1
UNIVERSITI TEKNOLOGI
UNIVERSITI
MALAYSIA
TEKNOLOGI MALAYSIA
DECLARATION OF THESIS / UNDERGRADUATE PROJECT PAPER AND COPYRIGHT
Author’s full name :
MANI A/P CHOW
Date of birth
:
6 AUGUST 1986
Title
:
TEMPERATURE MONITORING SYSTEM FOR ULTRASOUND
THERAPY MACHINE
Academic Session :
2008/20O9
I declare that this thesis is classified as :
√
CONFIDENTIAL
(Contains confidential information under the Official Secret
Act 1972)*
RESTRICTED
(Contains restricted information as specified by the
organisation where research was done)*
OPEN ACCESS
I agree that my thesis to be published as online open access
(full text)
I acknowledged that Universiti Teknologi Malaysia reserves the right as follows :
1. The thesis is the property of Universiti Teknologi Malaysia.
2. The Library of Universiti Teknologi Malaysia has the right to make copies for the purpose
of research only.
3. The Library has the right to make copies of the thesis for academic exchange.
Certified by :
SIGNATURE
860806-02-5750
(NEW IC NO. /PASSPORT NO.)
Date: 11 MAY 2009
NOTES :
*
SIGNATURE OF SUPERVISOR
DR. BUSTANUR ROSIDI
NAME OF SUPERVISOR
Date :
11 MAY 2009
If the thesis is CONFIDENTIAL or RESTRICTED, please attach with the letter from
the organisation with period and reasons for confidentiality or restriction.
Date: 7 MAY 2009
Date : 7 MAY 2009
“I/We hereby declare that I/we have read this thesis and in my/our opinion
this thesis is adequate in terms of scope and quality for the purpose of awarding a
Bachelor‟s degree of Electrical Engineering (Medical-Electronics).”
Signature
: ....................................................
Name of Supervisor I
: Dr. Bustanur Rosidi
Date
: 11 May 2009
Signature
: ....................................................
Name of Supervisor II
: Ir. Dr. –Ing. Eko Supriyanto
Date
: 11 May 2009
TEMPERATURE MONITORING SYSTEM FOR
ULTRASOUND THERAPY MACHINE
MANI A/P CHOW
Submitted to the Faculty of Electrical Engineering
in partial fulfillment of the requirements for the award of the
Bachelor of Electrical Engineering (Medical-Electronics)
Faculty of Electrical Engineering
University of Technology Malaysia
MAY 2009
ii
I declare that this thesis entitle “Temperature Monitoring System for Ultrasound
Therapy Machine” is the result of my own research except as cited in the reference.
This thesis has not been accepted for any degree and is not concurrently submitted in
candidature of any other degree.
Signature
:
………………………………….
Name
:
MANI A/P CHOW
Date
:
11 MAY 2009
iii
Dedicated, in thankful appreciation for support, encouragement and understandings
to my beloved father, mother, brothers, sisters, lecturers and friends.
iv
ACKNOWLEDGEMENT
First and foremost, I would like to express my sincere appreciation to both of
my Final Year Project supervisors Dr. Bustanur Rosidi and Dr. Eko Supriyanto for
their continuous guidance, encouragement and thought that has given to me through
completing this project.
My appreciation also goes to my beloved family for their understanding,
endless love and support, emotionally and financially all these years.
I would also like to thank CLEANER LAB team (staff and students) for their
co-operations, guidance, help and invaluable assistance in this project.
Special thanks also goes to my fellow friends whose we share the same lab
(CLEANER LAB) through our FYP, Mohd Hafiz, Sheikh (Fairuz Hakim), Lee Siew
Wen, Noraini Huda, Norsyazwani, Nur Afni, Nur Hazreen, Nur Liyana Mardhiah,
and Zubaidah for their helping and memories. Last but not least, SEP and SEB
members batch 2005 and those whom involve directly and indirectly with this
project. There is no such meaningful word than……… Thank You So Much.
v
ABSTRACT
The use of ultrasound in therapy is based on many effects including thermal.
However, this thermal effect from ultrasound therapy machine is not monitor in most
of the currently available machine. The thermal effect may raise the temperature up
to several degrees Celsius. However, this temperature rise may be somehow out of
the allowable range and hazardous because it is possible to cause tissue damage and
skin burn. Thus, this project had been implemented in order to add the safety feature
of the currently available ultrasound therapy machine in market. In brief, this project
is about the development of temperature monitoring system for ultrasound therapy
machine. This includes the implementation of the temperature sensor circuit, analog
to digital converter and graphical user interface. The complete system integration is
then test for the stability and accuracy of the measurement. The results show that the
accuracy of this system is more than 95 percents. In conclusion, temperature
monitoring system is essential for ultrasound therapy machine. It is possible to be
attached into the casing of the ultrasound therapy transducer to monitor the effect of
temperature rise. For this, miniaturization is needed.
vi
ABSTRAK
Penggunaan ultrasonik di dalam bidang terapi adalah berdasarkan pelbagai
kesan termasuk pemanasan. Walau bagaimanapun, kesan pemanasan ini tidak di
awasi di dalam kebanyakan mesin terapi utrasonik yang terdapat di pasaran pada
masa sekarang. Kesan pemanasan ini mungkin boleh meningkat sehingga beberapa
darjah Celsius. Tetapi, peningkatan suhu ini mungkin lebih daripada julat yang
dibenarkan dan membahayakan pengguna kerana boleh menyebabkan kerosakan
pada tisu dan juga kulit terbakar. Oleh itu, projek ini telah dilaksanakan yang
bertujuan untuk menambahkan lagi ciri-ciri keselamatan yang terdapat pada mesin
terapi ultrasonik yang terdapat di pasaran pada masa sekarang. Secara ringkas, projek
ini ialah tentang pembinaan sistem pengawasan suhu bagi mesin terapi ultrasonik.
Projek ini termasuk pembinaan litar pengesan suhu, litar penukar analog ke digit dan
grafik antaramuka pengguna. Sistem yang telah lengkap dibina ini kemudian diuji
kestabilan dan ketepatannya di dalam pengukuran. Keputusan menunjukkan bahawa
ketepatan sistem ini adalah melebihi 95 peratus. Kesimpulannya, pengawasan suhu
adalah penting bagi mesin terapi ultrasonik. Sistem ini boleh disertakan sekali di
dalam tranduser terapi ultrasonik untuk mengawasi suhu. Untuk tujuan ini,
pengecilan skala diperlukan.
vii
TABLE OF CONTENT
CHAPTER
TITLE
PAGE
DECLARATION OF THESIS
DEDICATION
ACKNOWLEDGEMENT
ABSTRACT
ABSTRAK
TABLE OF CONTENT
vi
LIST OF TABLE
iv
LIST OF FIGURE
v
LIST OF SYMBOLS
LIST OF APPENDICES
1
2
INTRODUCTION
1.1
Background
1
1.2
Problem Statement
2
1.3
Objectives of Project
2
1.4
Scope of Project
2
1.5
Work Breakdown
3
1.6
Work Flow
4
1.7
Gantt Chart
6
1.8
Thesis Outline
7
LITERATURE REVIEW
2.1
Medical Ultrasound
8
2.2
Therapeutic Ultrasound
9
2.3
Previous Patent on Ultrasound Therapy product 11
viii
2.4
The mechanism of Action of Ultrasound
12
2.5
Temperature and Thermal Equilibrium
14
2.6
Thermal Effect of Ultrasound
15
2.7
Comparison between Contact and Non-Contact 17
Temperature Sensor
2.8
Comparison between 4 Types of Temperature
18
Sensor
3
2.9
Temperature Sensor LM 35
20
2.10
Microcontroller
21
2.11
RS 232 Serial Port
22
2.12
Visual Basic 6.0
23
DESIGN AND IMPLEMENTATION
3.1
Introduction
28
3.2
Temperature Monitoring System for
30
Ultrasound Therapy Machine
3.3
Hardware Implementation
31
3.3.1
Temperature Sensor Circuit
31
3.3.2
Embedded ADC in PIC16877A
33
Microcontroller
3.4
Software Implementation
34
3.4.1
34
Algorithm for Analog to Digital
Converter
3.4.2
Programming in PIC C Compiler
35
3.4.3
Algorithm and Programming in
37
Visual Basic 6.0
3.5
4
3.4.3.1 Forms
39
3.4.3.2 GUI Source Code
42
Problem and Solution in Implementation
45
RESULT AND ANALYSIS
4.1
Introduction
46
ix
4.2
Experiment 1: Determine Relationship of Power 46
Supply and Voltage for Ultrasound Therapy Probes
4.2.1
Procedures
47
4.2.2
Experimental Result Analysis
48
4.2.2.1 Transmitted the Ultrasound
49
Through Transmission Gel
for Continuous Waveform.
4.2.2.2 Transmitted the Ultrasound
50
Through Transmission Gel
for Pulse Waveform.
4.2.2.3 Transmitted the Ultrasound
51
Through Water for
Continuous Waveform.
4.2.2.4 Transmitted the Ultrasound
52
Through Water for Pulse
Waveform.
4.2.2.5 No Specific Transmission
53
Medium for Continuous
Waveform.
4.2.2.6 No Specific Transmission
54
Medium for Pulse Waveform.
4.2.3
4.3
Result Discussion
Experiment 2: Determine the Thermal Effect
55
56
with the Time of Ultrasound Irradiation.
4.4
4.3.1
Procedures
56
4.3.2
Experimental Result Analysis
57
4.3.3
Result Discussion
58
Experiment 3: Experiment 3: Comparison
58
between system measurement and
thermometer measurement.
4.4 1
Procedures
59
4.4.2
Experimental Results
59
4.4.3
Discussion
60
x
5
4.5
Limitation
61
4.6
Possible Application
61
CONCLUSION
62
REFERENCES
63
APPENDICES
66
xi
LIST OF TABLE
TABLE NO.
2.1
TITLE
Comparison between contact and non-contact
PAGE
17
temperature sensor
2.2
Comparison between thermocouple, RTD,
19
thermistor and I.C sensor
2.3
RS232 pin assignments (DB9 PC signal set)
23
3.1
Components that build up temperature sensor circuit
32
4.1
Relationship of power supply and output voltage
49
4.2
Relationship of power supply and output voltage
50
4.3
Relationship of power supply and output voltage
51
4.4
Relationship of power supply and output voltage
52
4.5
Relationship of power supply and output voltage
53
4.6
Relationship of power supply and output voltage
54
4.7
Relationship of ultrasound therapy irradiation time
57
and temperature
4.8
Test measurements result
59
xii
LIST OF FIGURE
FIGURE NO
1.1
TITLE
Work breakdowns for the project of temperature
PAGE
4
monitoring system for ultrasound therapy machine
1.2
Work flow of this project
5
1.3
Gantt Chart of the project schedule for semester 1
6
1.4
Gantt Chart of the project schedule for semester 2
6
2.1
Ultrasound therapy
11
2.2
Drawing of an ultrasound therapy machine
12
2.3
Thermal equilibrium
15
2.4
Tissue temperatures at 2.5 cm with 1.5 W/cm2 ultrasound
17
treatments
2.5
Plastic package bottom view of LM 35
21
2.6
RS232 DB9 pinout
22
2.7
Form
25
2.8
Toolbox
25
2.9
Properties
26
2.10
Form layout
26
2.11
Project window
27
3.1
Simplified block diagram of a smart ultrasound therapy
29
machine
3.2
Detailed block diagram of a smart ultrasound therapy
29
machine
3.3
Block diagram of the temperature monitoring system
30
3.4
Circuit diagram of temperature sensor circuit
31
3.5
Temperature sensor circuit
32
3.6
Image and pin diagram of PIC16F877A
33
xiii
3.7
Embedded ADC in PIC16F877A connected to PC
34
through RS232
3.8
Flow chart of ADC
35
3.9
Programming for ADC in PIC C Compiler
36
3.10
Hex file in PIC C
37
3.11
Flows of GUI programming
38
3.12
Visual basic 6.0
38
3.13
Introduction form
39
3.14
Users manual form
40
3.15
Main form display temperature
41
3.16
Help form
42
3.17
Variable declaration
42
3.18
Message box coding
43
3.19
Start Message Box
43
3.20
Source code for start time
43
3.21
Source code for start temperature
44
3.22
Source code for calendar
44
4.1
Experimental setup to determine the relationship between
47
power and voltage
4.2
Graph of voltage versus power supply
49
4.3
Graph of voltage versus power supply
50
4.4
Graph of voltage versus power supply
51
4.5
Graph of voltage versus power supply
52
4.6
Graph of voltage versus power supply
53
4.7
Graph of voltage versus power supply
54
4.8
Distance between transmitter and receiver of ultrasound
55
and the output voltage
4.9
Experimental setup
56
4.10
Graph of Temperature versus Time
58
4.11
Graph of measurement between thermometer and system
60
4.12
Application of temperature monitoring in ultrasound therapy 61
xiv
LIST OF SYMBOLS
°C
-
Degree Celsius
°F
-
Degree Fahrenheit
°K
-
Kelvin
𝛼
-
Absorption coefficient cm-2
ADC
-
Analog to Digital Converter
BNR
-
Beam Non-Uniformity Ratio
CPU
-
Central Processing Unit
GUI
-
Graphical User Interface
I
-
beam intensity in W/cm2
I.C
-
Integrated Circuit
I/O
-
Input/Output
PC
-
Personal Computer
RAM
-
Random Access Memory
ROM
-
Read Only Memory
RTD
-
Resistance Thermo Detector
Uh
-
heat energy in watts
US
-
Ultrasound
VB
-
Visual basic
xv
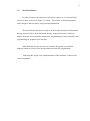
LIST OF APPENDICES
APPENDIX
A
TITLE
Full System of Temperature Monitoring Project for
PAGE
66
Ultrasound Therapy Machine
B
Full Source Code for ADC Programming in PIC C Compiler
67
C
Full Source Code of Graphical User Interface in Visual
68
Basic 6.
CHAPTER 1
INTRODUCTION
1.1
Background
Ultrasound is defined as sound wave having a frequency greater than the
upper limit of human hearing. Although this limit varies from person to person, it is
approximately 20 kilohertz (20,000 hertz) in healthy, young adults and thus, 20 kHz
serves as a useful lower limit in describing ultrasound. There are two primary form
of ultrasound, diagnostic and therapeutic. Diagnostic ultrasound is used for medical
imaging while the therapeutic counterpart is used in the treatment of various physical
ailments and fitness machines.
In fact, ultrasound has been used in therapeutic for over 60 years. This
include in the management of pain, musculoskeletal injuries, inflamed tendons, soft
tissue damage, strained and torn muscle, scar tissue sensitivity and tension, sprained
ligaments and also in cosmetic. At the moment, recent uses of ultrasound therapy
include the accelerated healing of fractures, muscle injury and thrombolysis.
Ultrasound may induce thermal and non-thermal physiological effects in
tissue. Thermal effects of ultrasound upon tissue may include increased blood flow,
reduction in muscle spasm, increased extensibility of collagen fibres and a proinflammatory response. It is estimated that thermal effects occur with the elevation
of tissue temperature to about 40ᵒC to 45ᵒC for at least 5 minutes. However, the
excessive thermal effects, seen in particular with higher ultrasound intensities and the
2
possible failure of the machine may damage the tissue and causing burning to the
skin surface.
1.2
Problem Statement
Although there are a wide variety of ultrasound therapy product, but none of
them is equipped with the temperature monitoring system. However, it is important
to monitor the heat produce by the product because the excessive heat that is possible
cause by the failure of the machine, high intensity for long duration application could
cause damage to the tissue and burn the skin surface. Thus, temperature monitoring
is actually an important safety feature that must be included in an ultrasound therapy
machine.
1.3
Objectives of Project
There are two objectives to achieve in this project. The first objective is to
obtain the characteristics of heat increasing because of ultrasound power. Other than
that, the second objective of this project is to develop hardware and software to
monitor the temperature generates by the ultrasound therapy machine.
1.4
Scope of Project
There are several scope had been outlined for this projects. The scope of this
project includes using semiconductor temperature sensor (LM 35), build hardware
for the system and interface the hardware to computer using RS232 serial port
communication, display the temperature on personal computer. The temperature
sensor is required to cover the temperature from 35ᵒC to 55ᵒC with a resolution of
1ᵒC.
3
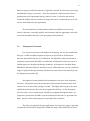
1.5
Work Breakdown
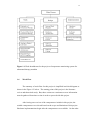
In order to achieve the objective of this project, there are several tasks that
need to be done as shown in Figure 1.1 below. These tasks are divided into three
main categories that are study, design and implementation.
The related items that need to study in detail are the principles of ultrasound
therapy, thermal effects from ultrasound therapy, temperature sensor, analog to
digital converter, microcontroller architecture, programming for microcontroller and
programming for graphical user interface.
Other than that, for this system it is needed to design the system block
diagram, hardware circuit, software algorithm and software programming.
Following the design is the implementation of the hardware, software and
system integration.
4
Figure 1.1 Work breakdowns for the project of temperature monitoring system for
ultrasound therapy machine
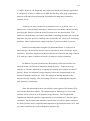
1.6
Work Flow
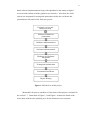
The summary of work flow for this project is simplified into block diagram as
shown in the Figure 1.2 below. The starting point of this project is the literature
review and theoretical study. But, these actions are continuous as new information
must be gathered from time to time in order to proceed with this project.
After having an overview of the component to include in this project, the
suitable components were selected based on the scope and limitation of this project.
Hardware implementations begin after the components were available. On the other
5
hand, software implementations begin with algorithm for the analog to digital
converter and continue with the graphical user interface. After that, the whole
system was integrated for testing and optimization before the real demo and
presentation to the panel of the final year project.
Literature review and
theoritical study
Selection of hardware
components
Hardware Implementation
Software Implementation
Hardware and Software
Integration
Testing and Optimization
Presentation and Demo
Report Writing
Figure 1.2 Work flow of this project
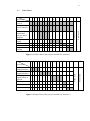
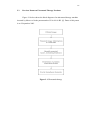
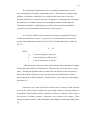
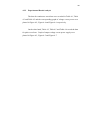
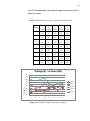
Meanwhile, the project schedule or Gantt chart of this project is included in
the section 1.7. Gantt chart of Figure 1.3 and Figure 1.4 shows the detail of the
works done with the time spending on it for the duration of two semesters.
6
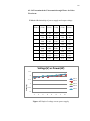
Week 1 2 3 4 5 6 7 8 9
Activities
1.Literature
review
2.Study on
microcontrolle
r
3. Study on
ultrasound
therapy block
diagram
4.Experimental
setup
5.Data analysis
6.Presentation
7.Report
writing
1
0
1
1
1
2
1
3
1
4
1
5
16
17
Exam week
Gantt Chart
Study week
1.7
1 2 3 4 5 6 7 8 9 10 11 12 13 14 15
16
17
Exam week
Week
Study week
Figure 1.3 Gantt Chart of the project schedule for semester 1
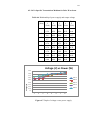
Activities
1. Circuit
implementation
2. Software
implementation
3.Testing and
optimization of
system
4.Presentation
5.Demo
6.Report writing
Figure 1.4 Gantt Chart of the project schedule for semester 2
7
1.8
Thesis Outline
This thesis is a report of a final year project of title “Temperature Monitoring
System for Ultrasound Therapy Machine”. There are five main chapters explained in
detail within this thesis.
Chapter 1 explain in detail the information about the project background,
problem statement, objectives, scope, work flow, Gantt chart, thesis content and
work breakdown. In this chapter, the reader could find out the overview of this
project and also the significant of this project.
Next in chapter 2, the related literature to this project is provided in detail.
The topic explained in this chapter included medical ultrasound, therapeutic
ultrasound, thermal effect of ultrasound and basic of hardware involve.
Chapter 3 is about design and implementation. In this chapter, the design and
implementation step is explained in detail.
Chapter 4 contains the information about the results and discussion and the
last, Chapter 5 summarize about this project
CHAPTER 2
LITERATURE REVIEW
2.1
Medical Ultrasound
Ultrasound has been employed in medicine for more than 50 years. The
early application of ultrasound for medical treatment was introduced in Germany in
the late 1930s and in the United States in the late 1940s.
Ultrasound refers to acoustical waves above the range of human hearings
(frequencies higher than 20 000 Hz). Although the same frequencies may be used
both in medical ultrasound and in high-frequency radio systems (2 to 10 MHz),
there is a distinguishing difference between them. Radio signals are
electromagnetic waves, while medical ultrasound signals are acoustical. An
ultrasonic wave is acoustical, which means that it requires a medium in which to
propagate, while the electromagnetic signal can propagate in outer space, where no
known medium exists.
The use of ultrasound in medical field can be divided into two major areas,
therapeutic and diagnostic. The major difference between the two applications is
the ultrasonic power at which the equipment operates. In therapeutic applications,
the system operate at ultrasonic power levels of up to several watts per square
centimeter while the diagnostic equipment operates at power levels of well below
100mW/cm2. The therapeutic equipment is designed to agitate the tissue to the level
where thermal heating occurs in the tissue. For diagnostic purpose, on the other
9
hand, as long as a sufficient amount of signal has returned for electronic processing,
no additional energy is necessary. Since the absorption of ultrasound in tissue is
proportional to the operating frequency which, in turn, is related to the desired
resolution (ability to detect certain size target) the choice of ultrasonic power levels
used is often dictated by the application.
The main attraction of ultrasound in medical modalities lies in its noninvasive character, externally applied, non-traumatic and also apparently safe at the
acoustical intensities and duty cycles presently used in medical.
2.2
Therapeutic Ultrasound
For a given sound source, the higher the frequency, the less the sound beam
diverges. Sound at audible frequencies appears to spread out in all directions,
whereas ultrasound beam are well collimated. Provided that, ultrasound beams at
frequencies greater than 800 kHz are sufficiently collimated to electively expose a
limited target area for physical therapy treatment. At frequencies less than about
800kHz the ultrasound beam‟s intensity levels is sufficiently low as to be outside the
range for physical therapy treatment, but has been used at these low intensity levels
for diagnostic procedures [8].
Absorption of sound, and therefore attenuation, increases as the frequency
increases. Absorption occurs in part because of the internal friction in tissue that
needs to be overcome in the passage of sound. The higher the frequency, the more
rapidly the molecules are forced to move against this friction. As the absorption
increases, there is less sound energy available to propagate through the tissue. At
frequencies greater than 20 MHz, superficial absorption becomes so great that less
than 1 percent of the sound penetrates beyond the first centimeter.
Therefore, for physical therapy applications, the frequency range is generally
considered to be limited to frequencies within the range of about 800 kHz to about
10
3.3 MHz. However, the frequently most often used for physical therapy application
is a frequency of about 1.0 MHz or 3.0 MHz because they offer good compromises
between sufficiently deep penetration and adequate heating under customary
exposure levels.
Sound waves can be produced as continuous wave or as pulsed wave. A
pulsed wave is intermittently interrupted. Pulsed waves are further characterized by
specifying the fraction of time the sound is present over one pulse period. This
fraction is called the duty cycle and is calculated by dividing the pulse time on by the
total time of a pulse period or similarly time on plus time off. Duty cycle for therapy
machines, when in pulsed mode, range from about 5 percent to about 50 percent.
Intensity determined the strength of an ultrasound beam. It is the rate at
which energy is delivered per unit area and is expressed in units of watts per square
centimeter. Intensities employed in physical therapy are limited to the range of about
0.25 watts per square centimeter to about 3.00 watts per square centimeter.
In addition, for pulsed sound beam, the intensity of the beam will be zero
when the beam is off and at its maximum during the pulse. Temporal average
intensity of a beam is obtained by averaging the intensity over both the on and off
periods. Hence, the temporal average intensity is decrease proportionally to the
amount of time the sound is off. Since, the amount of heating depends on the
temporal average intensity, thus less heating will occur even though the temporal
peak intensity is unchanged.
Since the ultrasound beam is not uniform, some regions of the beam will be
more intense than other regions. The measurement of intensity gives an average
intensity and is referred to as the spatial average intensity. The World Health
Organization limits the spatial average intensity to a maximum of 3 watt per square
centimeter. On the other hand, intensities greater than 10 watt per square centimeter
are used to destroy tissue surgically and temporal average intensities below 0.21 watt
per square centimeter are used for diagnostic purposes [8].
11
2.3
Previous Patent on Ultrasound Therapy Products
Figure 2.1 below shows the block diagram of an ultrasound therapy machine
invented by Maor et al in the patent number US 6 619 88 B2. [6]. Dates of this patent
is on 2 September 2003.
Figure 2.1 Ultrasound therapy
12
Figure 2.2 is it corresponding drawing of the system.
Figure 2.2 Drawing of an ultrasound therapy machine
This system is configured to deliver ultrasound energy in the range of 0.01
Mhz to 10 Mhz that is focused in the patient brain [6].
2.4
The Mechanisms of Action of Ultrasound
The mechanisms of action of ultrasound should be considered in terms of four
categories. First is the thermal effect, which relates to the heat generated into the
deeper tissues and especially the collagen, and the benefits derived from this.
Second is the mechanical effect [3], which relates to the high-speed vibrations that
act on the tissue just like a micro massage. Third is the cavitations effect. This
refers to the production of countless microscopic droplets of oxygen from the
vibration process. Fourth are the biological effects [1], which include blood vessel
dilatation, improved blood flow and circulation, sonopheresis, improved lymph flow,
muscle relaxation, reduced inflammation, and pain relief.
13
The technology of ultrasound revolves around the transmission of cyclic
waves through the skin and the surrounding tissues. The ultrasonic machine sends
millions of vibrations (1,000,000) per second into the deep tissues of the skin,
breaking stubborn fat so that the fat can be decomposed. Ultrasound also encourages
the production of collagen which irons out unsightly wrinkles and fat deposits.
Ultrasound vibrating in a high frequency results in increased tissue stimulation,
promotion of local metabolism, and excretion of skin waste [1].
As a result of millions of tiny sound waves being sent through the skin per
second, frictional heat is created . In general, we can state that heat created is the
product of the applied power intensity (I) in W/cm2 and the absorption coefficient,
cm-2 [7].
Uh = 𝛼I
Where
Uh
is the heat energy in watts (W)
𝛼
is the absorption coefficient cm-2
I
is the beam intensity in W/cm2
This heat in the deep layers of the skin facilitates skin metabolism (collagen
rejuvenation and reduction of fat deposits). This heat also causes the skin to excrete
waste. Through the slight heat that is produced by the friction of the sound waves
interacting with the deep tissue, the waste that rests just beneath the skin will be
dissolved and the cellular fat shrunk. This all leads to a more attractive and younger
appearance [1].
Ultrasonic waves cause liquid in the skin to form a vacuum, which is known
as the hollow effect. In this vacuum state, gas rapidly vaporizes and emits numerous
tiny bubbles. These bubbles initiate exothermic reactions or oxidation. This results in
the decrease of damage particles. Ultrasonic waves promote pH changes. These
changes include oxidation, reduced alkalinity, and changes in ionization and gelation
[1].
14
In addition, biological effect is caused by the motion of the intracellular
which is created by the vibrations of the membrane under the influence of the
ultrasound waves. These movements often take the form of twisting action.
2.5
Temperature and Thermal Equilibrium
Temperature is a measure of the average heat or thermal energy of the
particles in a substance. It is also the degree of hotness or coldness the can be measured
using a thermometer. It's also a measure of how fast the atoms and molecules of a substance
are moving.
Historically, there were two temperature scales (Fahrenheit and Celsius) that
were produced as a practical convenience and neither of them have a deep physical
meaning. The scale that is universally adopted as fundamental in physics is the
Kelvin scale where “absolute zero” is defined as zero on the Kelvin scale. The
increments in the Kelvin scale are called degrees and identically match the separation
in Celsius degrees.
In order to calibrate thermometers between laboratories, there needs to be a
specific temperature that can be reliably reproduced. One of these temperatures is
called the triple-point of water, the temperature where water, ice, and water vapor
coexist at atmospheric pressure. The triple-point of water is Ttr = 273.16 K. The
relationship between degree Fahrenheit, Celsius and Kelvin are:
° F = 1.8° C + 32
° K = ° C + 273
It is observed that a higher temperature object which is in contact with a
lower temperature object will transfer heat to the lower temperature object. The
objects will approach the same temperature, and in the absence of loss to other
objects, they will then maintain a constant temperature. They are then said to be in
15
thermal equilibrium. Thermal equilibrium is the subject of the Zeroth Law of
Thermodynamics.
Figure 2.3 Thermal equilibrium
The "zeroth law" states that if two systems are at the same time in thermal
equilibrium with a third system, they are in thermal equilibrium with each other.
If A and C are in thermal equilibrium with B, then A is in thermal equilibrium with
B. Practically this means that all three are at the same temperature, and it forms the
basis for comparison of temperatures. It is so named because it logically precedes
the First and Second Laws of Thermodynamics.
2.6
Thermal Effect of Ultrasound
Ultrasound is capable of producing thermal therapeutic effects. In 1987,
Dyson suggested that the tissue must reach a temperature of 40ᵒC to 45ᵒC for at
least five minutes to be therapeutic in nature. Experiments performed with
nonperfused tissue demonstrated that ultrasound of frequency 1 MHz and intensity
1W/cm2 could increase the tissue temperature at a rate of 0.86ᵒC/min. Draper et al,
Ashton et al and Chan et al measures the increased in muscle temperature during a
ten minutes treatment with either 1 MHz or 3 MHz ultrasound by inserting
thermistors to various depth within 5cm or less. The data they obtained shows that
treatment with 1 MHz or 3 MHz ultrasound resulted in a time and dosage dependent
16
increase in tissue temperature. However, the 3 MHz frequency increased tissue
temperature at a faster rate than the 1 MHz frequency [16].
Ultrasound induce temperature rise varies with tissue properties such as
absorption coefficient, density, perfusion, pulse duration, PRF (pulse repetition
frequency) and beam or scanning configuration. The unique property of ultrasound
induced temperature rise is that it is focal, which may not trigger systemic heat
dissipating thermoregulatory mechanism.
The factors that affect tissue temperature rice include the ultrasound field
parameters, the involved tissue characteristics, thermal conductivity of tissue and
blood perfusion of tissue. Temperature rises are steeper in tissues that are poorly
vascularizad such as tendon and fat and in tissues that conduct heat such as bone.
Tissues adjacent to bone are particularly susceptible to heat increase via conduction.
Biological tissue absorption is directly related to the protein content. Collagen are
particularly has high absorption. Generally, absorption is greatest in mineralized
bone followed by skin, tendon, spinal cord and finally brain, liver or kidney [16].
The primary ultrasound parameters to consider for thermal considerations
include the wave form, either pulse or continuous, average and spatial intensity
(W/cm2), beam non-uniformity ratio (BNR), time of exposure, duty cycle and
frequency. Generally, pulsed waves produce less heat than continuous while
intensity parameters determine the total energy transferred to the tissue.
Draper et al demonstrated that 1MHz continuous ultrasound for 10 minutes
1.5 W/cm2 produced a 5ᵒC increase in the gastrocnemius muscle over 10 minutes at
a depth of 3 cm without surface skin heating.
17
Figure 2.4 Tissue temperatures at 2.5 cm with 1.5 W/cm2 ultrasound treatments
2.7
Comparison between Contact and Non-Contact Temperature Sensor
Table 2.1 below describes the difference between contact and non-contact
temperature sensor in terms of measuring condition, measuring range, measuring
accuracy and speed of the system.
Table 2.1 Comparison between contact and non-contact temperature sensor
Contact Methods
Measuring
conditions
Measuring head
contacts the measuring
objects.
No changes should be
introduced in the
temperature of the
measured object when
it is brought into
contact with the
Non-contact method
Contact with the
measuring object is
indirect. Thus, the
measuring object
must be observable.
18
Measuring range
Measuring accuracy
Speed of response
Example
2.8
measuring head.
Measurements made
above 1200 C are
difficult, but
measurements below
1000 C are easily
made.
Generally, 0.5 to 1 %.
0.01% is possible,
depending on the
measuring conditions.
Generally slow about1
to 2 minutes.
May take more than 1
hour in unfavourable
conditions.
Thermocouples,
Resistance Thermo
Detector (RTD),
Thermistor, Glass
Thermometer and
Bimetallic.
Large errors tend to
occur when
measurements are
made below 1000
C. Measurements
above 1000C is
easily made.
Generally, around
20C.
5 to 10C at best.
Generally 2 to 3
seconds.
Less than 10
seconds in the worst
case.
Infrared, Thermal
Imagers, Optical
Pyrometers
Comparison between 4 Types of Temperature Sensor
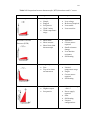
There are various temperature sensors available in market. The selection of
sensor to be used for certain project are depends on the scope of the project. Table
2.2 below describes some of the difference in advantages and disadvantages between
thermocouple, resistance thermo detector, thermistor and I.C sensor.
19
Table 2.2 Comparison between thermocouple, RTD, thermistor and I.C sensor
Advantages
Disadvantages
Thermocouple
Self-powered
Simple
Rugged
Inexpensive
Wide Variety
Wide temperature
range
Non-linear
Low voltage
Reference Required
Least stable
Least sensitive
Resistance Thermo
Most stable
Most accurate
More linear than
thermocouple
Expensive
Current source
required
Small resistance
change
Low absolute
resistance
Self-heating
Detector (RTD)
Thermistor
High output
Fast
Twp-wire ohms
measurement
I.C. Sensor
Most linear
Highest output
Inexpensive
Non-linear
Limited
temperature range
Fragile
Current source
required
Self-heating
Measurement range
<200ᵒC
Power supply
required
Slow
Self-heating
Limited
configurations
20
2.9
Temperature Sensor LM 35
The LM35 series are precision integrated-circuit temperature sensors, whose
output voltage is linearly proportional to the Celsius (Centigrade) temperature. The
LM35 does not require any external calibration or trimming to provide typical
accuracies of (+1/4ᵒC at room temperature and +1/4ᵒC over a full -55 to +150ᵒC
temperature range. Low cost is assured by trimming and calibration at the wafer
level. The LM35's low output impedance, linear output, and precise inherent
calibration make interfacing to readout or control circuitry especially easy. It can be
used with single power supplies, or with plus and minus supplies. As it draws only
60 mA from its supply, it has very low self-heating, less than 0.1ᵒC in still air. The
LM35 is rated to operate over a -55 to a150ᵒC temperature range. The LM35 series
is available packaged in hermetic TO-46 transistor packages.
Features of LM 35:
I.
II.
Calibrated directly in ᵒCelsius (Centigrade)
Linear a 10.0 mV/ᵒC scale factor
III.
0.5ᵒC accuracy guarantee (at a 25ᵒC)
IV.
Rated for full -55 to a150ᵒC range
V.
VI.
VII.
VIII.
IX.
X.
XI.
Suitable for remote applications
Low cost due to wafer-level trimming
Operates from 4 to 30 volts
Less than 60 mA current drain
Low self-heating, 0.08ᵒC in still air
Nonlinearity only +1/4ᵒC typical
Low impedance output, 0.1 Ω for 1 mA load
21
Figure 2.5 Plastic package bottom view of LM 35
2.10
Microcontroller
A microcontroller is a small computer on a single integrated circuit consisting
of a relatively simple CPU combined with support functions such as a crystal
oscillator, timers, watchdog, serial and analog I/O. Program memory in the form of
NOR flash or OTP ROM is often also included on chip, as well as a typically small
reads/write memory. It is design for small applications compare to microprocessors
and are used in automatically controlled products and devices, such as automobile
engine, control systems, remote control, and many other applications.
Since embedded processors are usually used to control devices, they
sometimes need to accept input from the device they are controlling. This is the
purpose of the analog to digital converter. Since processors are built to interpret and
process digital data, i.e 1s and 0s, they won‟t be able to do anything with the analog
signals that may be being sent to it by a device. So the analog to digital converter is
used to convert the incoming data into a form that the processor can recognize.
There is also a digital to analog converter that allows the processor to send data to the
device it is controlling.
22
2.11
RS232 Serial Port
RS232 is a popular communications protocol for connecting modems and
data acquisition devices to computer. RS232 devices can be plugged straight into the
computer‟s serial port (also known as the COM or Comms port) [18]. In serial
communications, the terminal end PC is called Data Terminal Equipment or DTEs
and the modem is called Data communication equipment or DCEs.
To obtain data from RS232 instrument and display it on PC, we need some
software. There is version 4.3 of the Windmill RS232 software now available for
free from their website [18].
RS stands for recommended standard. In the 60‟s a committee now known as
the Electronic Industries Association developed an interface to connect to connect
computer to terminals to modems. The standard defines the electrical and
mechanical characteristics of the connection, including the function of the signals
and handshake pins, the voltage levels and maximum bit rate. A nine pin D plug has
become the standard fitting for the serial ports of PCs [18]. The pin connections used
are shown in Figure 2.6 and the corresponding pin assignments are shown in Table
2.3.
Figure 2.6 RS232 DB9 pinout
23
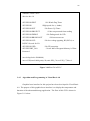
Table 2.3 RS232 pin assignments DB9 PC signal set
Pin 1 Input
DCD Data Carrier Detect
Pin 2 Input
RXD Received Data
Pin 3 Output TXD Transmitted Data
Pin 4 Output DTR
Data Terminal Ready
Pin 5
Signal Ground
Pin 6 Input
DSR
Data Set Ready
Pin 7 Output RTS
Request To Send
Pin 8 Input
CTS
Clear To Send
Pin 9 Input
RI
Ring Indicator
The speed of RS232 communications is expressed in Baud. The maximum
speed, according to the standard is 20000 Baud. However, modern equipment can
operate much faster than this. No matter how fast or slow the connection, the
maximum number of readings per second that it can take from the instrument
depends on software. The length of the cable also plays a part in maximum speed.
The longer the cable, the greater the cable‟s capacitance that results in the slower
speed which can obtain accurate results [18].
2.12
Visual Basic 6.0
Visual Basic is a tool that allows the development of Windows (Graphic User
Interface - GUI) application which the applications have a familiar appearance to the
user.
Visual Basic is event-driven, meaning that the code remains idle until called
upon to respond to some event (button pressing, menu selection, and etc). Visual
Basic is governed by an event processor. Nothing happens until an event is detected.
Once an event is detected, the code corresponding to that event (event procedure) is
executed. Program control is then returned to the event processor [17].
24
These are some of the feature of the visual basic:
I.
II.
Full set of objects - 'draw' the application
Lots of icons and pictures for use
III.
Response to mouse and keyboard actions
IV.
Clipboard and printer access
V.
VI.
VII.
VIII.
IX.
X.
XI.
Full array of mathematical, string handling, and graphics functions
Can handle fixed and dynamic variable and control arrays
Sequential and random access file support
Useful debugger and error-handling facilities
Powerful database access tools
ActiveX support
Package & Deployment Wizard makes distributing your applications
simple
There are several items in visual basic that will be used in graphical user
interface implementation. For example, form is the windows that will be create for
user interface. Controls is the graphical features drawn on forms to allow user
interaction (text boxes, labels, scroll bars, command buttons, etc.) (Forms and
Controls are objects.) Every characteristic of a form or control is specified by a
property. Example properties include names, captions, size, color, position, and
contents. Visual Basic applies default properties. It can be change properties at
design time or run time. Modules are the collection of general procedures, variable
declarations, and constant definitions used by application [17].
There are three primary steps involved in building a Visual Basic application:
1. Draw the user interface.
2. Assign properties to controls.
3. Attach code to controls.
Six windows appear upon start Visual Basic. The Main Window consists of
the title bar, menu bar, and toolbar. The title bar indicates the project name, the
current Visual Basic operating mode, and the current form. The menu bar has drop-
25
down menus from which you control the operation of the Visual Basic environment.
The toolbar has buttons that provide shortcuts to some of the menu options. The
main window also shows the location of the current form relative to the upper left
corner of the screen and the width and length of the current form [17].
The Form Window is central to developing Visual Basic applications. It
is where the application is drawn.
Figure 2.7 Form
The toolbox contains the selection menu for controls used in the application.
Pointer
Label
Frame
Picture Box
Text Box
Command Button
Check Box
Option Button
Combo Box
List Box
Horizontal Scroll Bar
Timer
Directory List Box
Shapes
Image Box
Vertical Scroll Bar
Drive List Box
File List Box
Lines
Data Tool
Object Linking
Embedding
Figure 2.8 Toolbox
26
The Properties Window is used to establish initial property values for objects.
The drop-down box at the top of the window lists all objects in the current form.
Two views are available, alphabetic and categorized. Under this box are the
available properties for the currently selected object.
Figure 2.9 Properties
The Form Layout Window shows where (upon program execution)
the form will be displayed relative to monitor‟s screen:
Figure 2.10 Form layout
27
The Project Window displays a list of all forms and modules making
up the application. A view of the Form or Code windows (window
containing the actual Basic coding) also can be obtained from the Project
window.
Figure 2.11 Project window
The user interface is „drawn‟ in the form window. There are two ways to
place controls on a form. First, double-click the tool in the toolbox and it is created
with a default size on the form. You can then move it or resize it. The second way is
click the tool in the toolbox, then move the mouse pointer to the form window. The
cursor changes to a crosshair. Place the crosshair at the upper left corner of where
you want the control to be, press the left mouse button and hold it down while
dragging the cursor toward the lower right corner. When you release the mouse
button, the control is drawn [17].
CHAPTER 3
DESIGN AND IMPLEMENTATION
3.1
Introduction
This chapter describes the design and implementation for the temperature
monitoring system for an ultrasound therapy machine. This system implementation
functions as one of the important safety feature in the ultrasound therapy machine.
This project included the implementation of the hardware and software. The
required range of temperature monitoring is from 35ᵒC to 55ᵒC. Meanwhile, the
resolution of this system is needed at 1ᵒC.
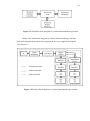
Figure 3.1 below shows the simplified block diagram of a smart ultrasound
therapy machine. This ultrasound therapy machine will have three main important
subsystems which includes ultrasound therapy waveform transmitter, ultrasound
receiver monitoring system and temperature monitoring system. However, this
report is specifically focus on the temperature monitoring design and implementation
for this system.
29
Figure 3.1 Simplified block diagram of a smart ultrasound therapy machine
Below is the detail block diagram for a smart ultrasound therapy machine.
This block diagram shows the detail compartment for every single block diagram
from Figure 3.1.
Figure 3.2 Detailed block diagram of a smart ultrasound therapy machine
30
3.2
Temperature Monitoring System for Ultrasound Therapy Machine
Figure 3.2 above shows the connection between the three subsystems and
how it will be integrated. However, this project reports only about the temperature
monitoring system for this ultrasound therapy machine.
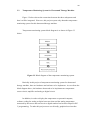
Temperature monitoring system block diagram is as shown in Figure 3.3
below.
Figure 3.3 Block diagram of the temperature monitoring system
Basically in this project of temperature monitoring system for ultrasound
therapy machine, there are hardware and software to be implement. As seen from the
block diagram above, the hardware that needs to be implement are temperature
sensor circuit, amplifier and analog to digital circuit.
In addition, in order to display the temperature on personal computer,
software coding for analog to digital converter that read the analog temperature
measured by the sensor and converts it to digital number has been developed in PIC
C programming. To make this project more user friendly, graphical user interface
31
that display the temperature on personal computer have been implement in Visual
Basic 6.0 environment.
3.3
Hardware Implementation
This section will discuss about the components and circuit that have been
developed for this project such as temperature sensor circuit, embedded analog to
digital converter in PIC16F877A microcontroller and RS232 serial input output port.
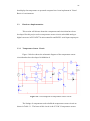
3.3.1
Temperature Sensor Circuit
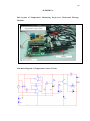
Figure 3.4 below shows the schematic diagram of the temperature sensor
circuit that has been developed in Multisim 8.
Figure 3.4 Circuit diagram of temperature sensor circuit
The listings of components used to build the temperature sensor circuit are
shown in Table 3.1. The heart of this circuit is the IC LM 35 temperature sensor.
32
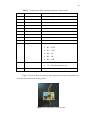
Table 3.1 Components that build up temperature sensor circuit
Number
Components
Description
1.
LM 35
Precision centigrade temperature sensor
2.
TL 431
Precision voltage reference
3.
LM 358
Dual single supply op-amp
4.
LED1
5mm LED
5.
Q1
General purpose PNP transistor
6.
D1,D2
1N4148 silicon diodes
7.
D3,D4
1N4002 rectifier diodes
8.
ZD1
Zener diode, 12V, 400mW
9.
Preset (trim pot)
2.2K
10.
Resistor
11.
12.
Capacitors
Miniature relay
R1 = 10K
R3 = 4.7M
R3 = 1.2K
R4 = 1K
R5 = 1K
R6 = 33Ω
C1 = 0.1μF ceramic cap
C2 = 470μF electrolytic cap
DC12V DPDT
Figure 3.5 below shows the picture of the temperature sensor circuit that have
been developed and used in this project.
Figure 3.5 Temperature sensor circuit
33
The input (heat) of this circuit is sensed by LM 35 temperature sensor. This
temperature sensor is factory calibrated in the Celsius scale with a linear degree and
voltage correlation. The output voltage at pin 2 of LM 35 change with temperature
from -550mV (-55ᵒC) to 1500mV (150ᵒC).
3.3.2
Embedded ADC in PIC16F877A Microcontroller
This project requires resolution of 0.1ᵒC. So, the suitable ADC should be
the one of 10 bit. In this project, embedded ADC in PIC16F877A is used. Figure
3.6 below shows the image and the pin diagram of the microcontroller used.
Figure 3.6 Image and pin diagram of PIC16F877A
Figure 3.7 below shows the microcontroller circuit and its connection with
the temperature sensor circuit and RS232. The input from temperature sensor circuit
is connected to AN0 (pin 2) and ground (pin 14) is connected to the ground of the
temperature sensor circuit. Output from the ADC is connected to personal computer
through RS232 serial port.
34
Figure 3.7 Embedded ADC in PIC16F877A connected to PC through RS232
3.4
Software Implementation
For software implementation, PIC C Compiler is used to write and compile
the program of the microcontroller. Meanwhile, PICkit 2 v2.40 is used to load the
hex file from the PIC C to the microcontroller. Other than that, Visual Basic 6.0 is
used for programming the user interface and monitoring the start temperature and
time, stop temperature and time and also the ultrasound therapy application duration.
3.4.1
Algorithm for Analog to Digital Converter
Figure 3.8 below shows the flow chart of how to setup ADC and read
the value of ADC from the PIC 16F877A Microcontroller.
35
Figure 3.8 Flow chart of ADC
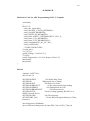
3.4.2 Programming in PIC C Compiler
First, the equation those relate the output voltage from temperature sensor
circuit had been determined. This equation is required to convert the output voltage
from pin 2 of LM 35 to temperature in ᵒC. The equation is:
Temperature = 100*Output Voltage
36
void main()
{
float V;//T;
setup_adc_ports(AN0);
setup_adc(ADC_CLOCK_INTERNAL);
setup_psp(PSP_DISABLED);
setup_spi(SPI_SS_DISABLED);
setup_timer_0(RTCC_INTERNAL|RTCC_DIV_1);
setup_timer_1(T1_DISABLED);
setup_timer_2(T2_DISABLED,0,1);
setup_comparator(NC_NC_NC_NC);
setup_vref(FALSE);
// TODO: USER CODE!!
V=read_adc();
V=(V*1/51);
printf("Voltage = %6.4f\n\r",V);
T=100*V;
printf("Temperature= %3.1f\n\r degree Celcius",T);
putc(0x0D);
putc(0x0A);
}
Figure 3.9 Programming for ADC in PIC C Compiler
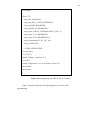
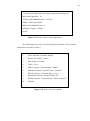
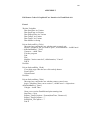
Figure 3.8 below shows the corresponding hex file for the ADC
programming.
37
#include <16F877A.h>
#device adc=10
#FUSES NOWDT
//No Watch Dog Timer
#FUSES HS
//High speed Osc (> 4mhz)
#FUSES NOPUT
//No Power Up Timer
#FUSES NOPROTECT
#FUSES NODEBUG
//Code not protected from reading
//No Debug mode for ICD
#FUSES NOBROWNOUT
#FUSES NOLVP
//No brownout reset
//No low voltage prgming, B3(PIC16) or
B5(PIC18) used for I/O
#FUSES NOCPD
//No EE protection
#FUSES WRT_50%
//Lower half of Program Memory is Write
Protected
#use delay(clock=20000000)
#use rs232(baud=9600,parity=N,xmit=PIN_C6,rcv=PIN_C7,bits=8
Figure 3.10 Hex file in PIC C
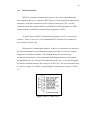
3.4.3
Algorithm and Programming in Visual Basic 6.0
Graphical user interface for this project have been developed in Visual Basic
6.0. The purpose of this graphical user interface is to display the temperature and
duration of the ultrasound therapy application. The flow of this GUI is shown in
Figure 3.11 below.
38
Figure 3.11 Flows of GUI programming
Figure 3.12 shows the form, properties, form layout and toolbox in visual
basic 6.0. Command button, label, text box and many more tools are select from the
toolbox on the left. Double clicking on the desired tool and it will appear on the
form. The properties of each box can be choose to change from the properties
Figure 3.12 Visual basic 6.0
39
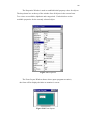
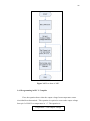
3.4.3.1 Forms
There are four main forms in this graphical user interface. The first form is
the introduction form, which is shown in Figure 3.13 below. This form appear when
the user start running the visual basic program. In only contains the information
about the title of this project, presenter, supervisor and a start command button with
caption START DEMO.
Figure 3.13
Introduction form
Once the START DEMO button is pressed, form of Figure 3.14 will be
shown. This is the user manual form. This form will give information to the user on
how to use this graphical user interface. To proceed to the main form where to
display the temperature, the user must click on the next button.
40
Figure 3.14 Users manual form
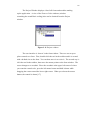
After the user had click the next button as in form 2 of Figure 3.14 above, the
user will be redirected to the main from as shown in Figure 3.15 below. There was a
calendar at the right top this form which shows the current date and time. The users
have the option to put in their personal particular such as name and age. First the
user must click on the corresponding box to activate it and then type in their personal
particular.
The START button is used to start the application. Once the START button
is clicked, start time and temperature will be shown. Stop time and temperature will
be shown when the user click on the STOP button to stop the application. USER
MANUAL and HELP box will redirect the user back to the user manual and help
form. In this form, MS Comm is needed to be place here because this GUI gets their
input from RS232 port. Other than that, a timer also had been included here because
it counts the time interval that the data being sent to the GUI.
41
Figure 3.15 Main form display temperature
Figure 3.16 below shows the help information form. In this form is included
the information that the user might needed when using this GUI application. BACK
button will redirect the user back to main form.
42
Figure 3.16 Help form
3.4.3.2 GUI Source Code
All the variables used must be declared as in the Figure 3.17 below:
Dim StartTime As Variant
Dim StopTime As Variant
Dim ElapsedTime As Variant
Dim TempF As Variant
Dim TempC As Variant
Dim InData As String
Figure 3.17 Variable declaration
This part of report will describe about the source code implemented for graphical
user interface.
43
Private Sub cmdStart_Click()
'Message box confirm the user whether start or cancel start
begin = MsgBox("Start a new session?", vbOKCancel + vbQuestion
_vbDefaultButton1, "Start")
Figure 3.18 Message box coding
This part of source code is used to prompt the user confirmation about
starting the application. A message box as below appears:
Figure 3.19 Start Message Box
If the user select yes, then start time and the current temperature sensed will
be displayed on the main form.
If begin = vbOK Then
'Start a new session Establish and print starting time
StartTime = Now
lblStart_TimeD.Caption = Format(StartTime, "hh:mm:ss")
lblStop_TimeD.Caption = ""
lblElapsed_TD.Caption = ""
End If
Figure 3.20 Source code for start time
44
'Get input from MSComm and display temperature during start
MSComm1.InputLen = 10
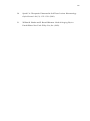
If MSComm1.InBufferCount > 10 Then
InData = MSComm1.Input
MSComm1.InBufferCount = 0
lblTemp1.Caption = InData
End If
Figure 3.21 Source code for start temperature
The following source code is used to display the calendar. Local variables
declaration is used here in line 3.
1.
'Time and Date (Calendar) Display
2.
Private Sub Timer1_Timer()
3.
Dim Today As Variant
4.
Today = Now
5.
lblDay.Caption = Format(Today, "dddd")
6.
lblMonth.Caption = Format(Today, "mmmm")
7.
lblYear.Caption = Format(Today, "yyyy")
8.
lblNumber.Caption = Format(Today, "d")
9.
lblTime.Caption = Format(Today, "h:mm:ss ampm")
10.
End Sub
Figure 3.22 Source code for calendar
45
3.5
Problem and Solution in Implementation
The actual plan for this system is using infrared temperature sensor.
However, because of time limitation, the sensor had been replaced with
semiconductor integrated circuit sensor. Infrared temperature sensor is hard to find
in local market.
CHAPTER 4
RESULT AND ANALYSIS
4.1
Introduction
Some experiments had been conducted throughout semester one. First
experiment was to find the relationship between voltage and power of an ultrasound
therapy machine. The effects of the distances from the transmitter to the receiver
with the output voltage were observed. Then, the data collected were plotted on
graph for further analyzed. After that, there was another experiment to find out the
relationship of the thermal effect with the time of ultrasound therapy irradiation. The
data obtained were then plotted on graph for further analyzed.
4.2
Experiment 1: Determine Relationship of Power Supply and Voltage of
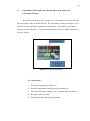
an Ultrasound Therapy Devices
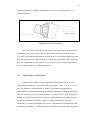
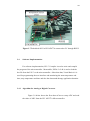
Figure 4.1 shows the experimental setup to determine the relationship
between power supply and the output voltage of a machine for fat removal with the
application of ultrasound. Tx represent the ultrasound transmitter and Rx represent
the ultrasound receiver. The oscilloscope will show the ultrasound waveform and the
corresponding voltage will be read from the amplitude of the waveform. There are
three condition tested in this experiment which is differing by the three different
medium between the space of the transmitter and the receiver as shown in Figure 4.1.
The three conditions were:
47
i.
Transmitted the ultrasound through transmission gel
ii.
Transmitted the ultrasound through water
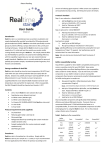
iii.
No specific transmission medium (very near transmission through air)
The power of the machine for fat removal is changed from 1W to 8W. Five
measurement of voltage are taken for each power level. For this experiment, there
are two different waveform used, continuous and pulse.
Figure 4.1 Experimental setup to determine the relationship between
power and voltage
4.2.1
Procedures
1. The experiment was set up as Figure 4.1.
2. Choose continuous waveform from the machine for fat removal.
3. Start with power 1W.
4. Take measurement of output voltage from oscilloscope.
5. Increase the power one unit until 8W.
6. Repeat step 3, step 4 and step 5 until five measurements were taken for
each power level.
7. The corresponding voltage and power is recorded in table.
8. Three graph of voltage versus power containing five series of
measurement each were plotted.
9. Repeat step 3, 4,5,6,7 and 8 for pulse waveform.
48
4.2.2
Experimental Result Analysis
The data for continuous waveform were recorded in Table 4.1, Table
4.3 and Table 4.5 and the corresponding graph of voltage versus power were
plotted in Figure 4.2, Figure 4.4 and Figure 4.6 respectively.
On the other hand, Table 4.2, Table 4.5 and Table 4.6 record the data
for pulse waveform. Graph of output voltage versus power supply were
plotted in Figure 4.3, Figure 4.5 and Figure 4.7.
49
4.2.2.1 Transmitted the Ultrasound through Transmission Gel for
Continuous Waveform.
Table 4.1 Relationship of power supply and output voltage
Power
(Watt)
Trial Trial Trial Trial Trial
1
2
3
4
5
(Volt) (Volt) (Volt) (Volt) (Volt)
1
20
15
5
10
14
20
17
10
9
23
20
15
10
10
24
15
15
15
10
31
20
18
20
20
35
22
20
23
20
17
25
39
23
23
12
30
23
25
22
14
2
3
4
5
6
7
8
Voltage(V) vs Power(W)
45
40
Voltage(V)
35
30
Trial 1
25
Trial 2
20
Trial 3
15
Trial 4
10
Trial 5
5
0
1
2
3
4
5
6
7
8
Figure 4.2 Graph of voltage versus power supply
50
4.2.2.2 Transmitted the Ultrasound through Transmission Gel for
Pulse Waveform.
Table 4.2 Relationship of power supply and output voltage
Power
(Watt)
Trial
1
(Volt)
Trial
2
(Volt)
Trial
3
(Volt)
Trial
4
(Volt)
Trial
5
(Volt)
15
6
11
23
35
14
10
16
19
33
11
12
11
17
35
10
11
7
26
39
12
18
23
18
27
20
17
22
21
22
11
20
24
19
28
20
18
21
20
26
1
2
3
4
5
6
7
8
Voltage(V) vs Power(W)
45
40
Voltage(V)
35
30
Trial 1
25
Trial 2
20
Trial 3
15
Trial 4
10
Trial 5
5
0
1
2
3
4
5
6
7
8
Figure 4.3 Graph of voltage versus power supply
51
4.2.2.3 Transmitted the Ultrasound through Water for
Continuous Waveform.
Table 4.3 Relationship of power supply and output voltage
Power Trial 1 Trial 2 Trial 3 Trial 4
(Watt) (Volt) (Volt) (Volt) (Volt)
1
2
3
4
5
6
7
Trial
5
(Volt)
1.88
1.88
1.92
2.00
1.92
1.92
2.04
1.96
2.04
1.96
2.00
2.12
2.00
2.08
2.00
2.04
2.20
2.04
2.12
2.08
2.12
2.16
2.12
2.16
2.12
2.08
2.24
2.16
2.20
2.16
2.12
2.28
2.24
2.24
2.20
2.16
2.28
2.28
2.24
2.24
8
Voltage(V) vs Power(W)
2.5
2
Trial 1
1.5
Trial 2
Trial 3
Voltage(V)
1
Trial 4
0.5
Trial 4
0
1
2
3
4
5
6
7
Figure 4.4 Graph of voltage versus power supply
8
52
4.2.2.4 Transmitted the Ultrasound through Water for Pulse
Waveform.
Table 4.4 Relationship of power supply and output voltage
Power
(Watt)
Trial 1 Trial 2 Trial 3 Trial 4 Trial 5
(Volt) (Volt) (Volt) (Volt) (Volt)
1
1.88
1.88
1.84
1.84
1.8
1.96
1.96
1.92
1.88
1.96
2.04
1.96
1.96
1.92
2
2.04
2
2.04
1.96
2.04
2.08
2.04
2.08
2
2.08
2.12
2.08
2.12
2.08
2.12
2.2
2.12
2.16
2.16
2.16
2.2
2.16
2.24
2.2
2.24
2
3
4
5
6
7
8
Voltage(V) vs Power(W)
2.5
2
Trial 1
Voltage (V)
1.5
Trial 2
Trial 3
1
Trial 4
0.5
Trial 5
0
1
2
3
4
5
6
7
8
Figure 4.5 Graph of voltage versus power supply
53
4.2.2.5 No Specific Transmission Medium for Continuous
Waveform
Table 4.5 Relationship of power supply and output voltage
Power
(Watt)
Trial
1
(Volt)
Trial
2
(Volt)
Trial
3
(Volt)
Trial
4
(Volt)
Trial
5
(Volt)
0.58
0.6
0.6
0.6
0.68
0.6
0.62
0.66
0.62
0.72
0.6
0.64
0.68
0.66
0.76
0.62
0.64
0.64
0.72
0.76
0.68
0.66
0.68
0.74
0.78
0.64
0.68
0.7
0.76
0.8
0.68
0.72
0.72
0.8
0.84
0.72
0.74
0.74
0.86
0.86
1
2
3
4
5
6
7
8
Volyage (V)
Voltage(V) vs Power(W)
1
0.9
0.8
0.7
0.6
0.5
0.4
0.3
0.2
0.1
0
Trial 1
Trial 2
Trial 3
Trial 4
Trial 5
1
2
3
4
5
6
7
8
Figure 4.6 Graph of voltage versus power supply
54
4.2.2.6 No Specific Transmission Medium for Pulse Waveform.
Table 4.6 Relationship of power supply and output voltage
Power
(Watt)
Trial Trial Trial Trial Trial
1
2
3
4
5
(Volt) (Volt) (Volt) (Volt) (Volt)
1
0.58
0.58
0.66
0.52
0.66
0.6
0.58
0.68
0.6
0.7
0.7
0.6
0.7
0.62
0.74
0.74
0.7
0.72
0.76
0.78
0.78
0.78
0.74
0.8
0.78
0.78
0.8
0.8
0.8
0.8
0.82
0.8
0.82
0.82
0.82
0.84
0.84
0.82
0.82
0.84
2
3
4
5
6
7
8
Voltage (V) vs Power (W)
0.9
0.8
Voltage (V)
0.7
0.6
Trial 1
0.5
Trial 2
0.4
Trial 3
0.3
Trial 4
0.2
Trial 5
0.1
0
1
2
3
4
5
6
7
8
Figure 4.7 Graph of voltage versus power supply
55
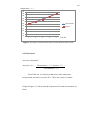
4.2.3 Result Discussion
There are similarity shown in the graph of Figure 4.4, Figure 4.5,
Figure 4.6, and Figure 4.7.
The increment in power is causing linear
increment in voltage. But, the graph of Figure 4.2 and Figure 4.3 shows that
the increment in power does not cause linear increment in voltage.
This phenomenon can be explained by Figure 4.8 below.
The
amplitude of the graph represents the voltage while the horizontal axis
represents the distance between the transmitter and receiver.
If the
transmitter and receiver are placed very near to each other, it will cause the
non linear relationship of output voltage and supply power to the ultrasound
machine.
However, as the distance in more far, it will result in linear
relationship between voltage and power.
Figure 4.8 Distance between transmitter and receiver of ultrasound
and the output voltage
56
4.3
Experiment 2: Determine the Thermal Effect with Time of an
Ultrasound Therapy.
The experiment set up was as in Figure 4.9. Thermometer is used to measure
the temperature of the fat inside the tank. The temperature reading was taken every 5
minutes after the continuous irradiation of ultrasound. Ultrasound was irradiated
from a fat removal machine. The ultrasound frequency used was 1MHz and power is
select to 8Watts.
Figure 4.9 Experimental setup
4.3.1 Procedures
1. Set up the experiment as Figure 4.9.
2. Irradiate ultrasound towards the tank containing fat.
3. Take the temperature reading every 5 minutes until 120 minutes.
4. Record the data in a table.
5. Plotted the graph from the data obtained.
57
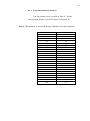
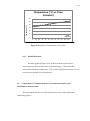
4.3.2
Experimental Result Analysis
The data obtained were recorded in Table 4.7 and the
corresponding graph was plotted as shown in Figure 4.10.
Table 4.7 Relationship of ultrasound therapy irradiation time and temperature
Time (minutes)
5
10
15
20
25
30
35
40
45
50
55
60
65
70
75
80
85
90
95
100
105
110
115
120
Temperature (°C)
18
18
18
19
19
20
20
20
21
21
22
22
23
23
24
24
25
25
25
25
26
26
26
27
58
Temperature (° C) vs Time
(minutes)
30
25
Temperature (°C)
20
15
10
5
Time
(minutes)
0
5
15
25
35
45
55
65
75
85
95 105 115
Figure 4.10 Graph of Temperature versus Time
4.3.3
Result Discussion
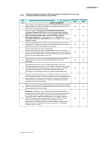
From the graph of Figure 4.10, it shows that the temperature is
increasing as the time of ultrasound irradiation longer. This means that
ultrasound irradiation produce heat. This result is significant because it is one
of the factors that help in fat destruction.
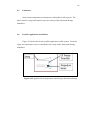
4.4
Experiment 3: Comparison between system measurement and
thermometer measurement.
This experiment was set up to determine the accuracy of the temperature
monitoring system.
59
4.4.1 Procedures
1. Fill in a tank with water.
2. Take the temperature reading outside the tank using thermometer.
3. Take temperature measurement using the system implement in this project.
4. Change the test water for 5 set of reading.
5. Record the data in table.
6. Plot graph.
7. Make comparison.
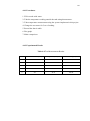
4.4.2 Experimental Result
Table 4.8 Test Measurement Results
Test
Thermometer (ᵒC)
System (ᵒC)
Accuracy (%)
1
25
25.7
97.20
2
30
29.2
97.30
3
35
34.5
98.57
4
40
40.3
99.99
5
45
45.4
99.99
60
Temperature (ᵒC)
50
45
40
35
30
25
Thermometer
20
System
15
10
5
0
1
2
3
4
5
Test Set
Figure 4.11 Graph of measurement between thermometer and system
4.4.3 Discussion
Accuracy calculation:
Accuracy (%) = | Thermometer (ᵒC) - System (ᵒC)
|
Thermometer (ᵒC)
From Table 4.8, it is found out that most of the temperature
measurement accuracies are more 95%. Thus, this system is reliable.
Graph of Figure 4.11 shows that the temperature for both measurement are
linear.
61
4.5
Limitation
Only contact temperature measurement is allowable for this system. The
whole system is large and cannot keep in the casing of the ultrasound therapy
transducer.
4.6
Possible Application and Market
Figure 4.12 below shows the possible application of this system. From the
figure, the temperature sensor is attached in the casing of the ultrasound therapy
transducer.
Figure 4.12 Application of temperature monitoring in ultrasound therapy
CHAPTER 5
CONCLUSION
A temperature monitoring system for ultrasound therapy machine has been
developed. This system is able to cover the range from 35ᵒC to 55ᵒC with a
resolution of 0.1ᵒC.
This system consists of temperature sensor circuit, analog to digital converter
and graphical user interface. This system is developed to be integrated with the
ultrasound therapy machine as one of the important safety feature.
For the purpose of integration, FPGA may be used to as high speed system is
needed for the ultrasound therapy generation and monitoring. Other than that, the
ultrasound therapy is optimum to be used in water. Thus, a temperature sensor that
can be immersed in water is needed to replace the semiconductor sensor. A suitable
one for that purpose is the infrared temperature sensor.
63
REFERENCES
1.
Charles S. Desilets and Cameron Pollock. Apparatus and Method for the
destruction of Adipose Tissue. United States Patent Application Publication.
(US Patent 2007/00551156 A1). (2007).
2.
Cribbs, R. Hennige, C. and Hillstead, R. “Ultrasonic Treatment and Imaging
of Adipose Tissue”. (US Patent 2004/0039312 A1). (2007).
3.
Chris Guy and Dominic Fythce. An Introduction to the Principles of Medical
Imaging. Revised Edition. London: Imperial College Press. (2005).
4.
D. Langin. “Control of fatty acid and glycerol release in adipose tissue
lipolysis”. C. R. Biologies 329.598–607. (2006).
5.
D. O. Draper and S. Sunderland. “Examination of The Law of
Grotthus-Draper: Does Ultrasound Penetrate Subcutaneous Fat in
Human?”. Volume 28, Number 3, Pg 246-250. (1993).
6.
Dov Maor, Javier Grinfeld and Kullervo Hynynen. Ultrasound Therapy.
United States Patent. (US Patent 6,612,988 B2). (2003).
7.
Gary Cornell. Visual Basic 6 from the Ground Up Build Window and
Internet Applications Step by Step. California. McGraw-Hill. (1998).
8.
H. Miwa, M. Kino, L. K. Han, K. Takaoka, T. Tsujita, H. Furuhata, M.
Sugiyama, H. Seno, Y. Morita, Y. Kimura and H. Okuda. “Effect of
ultrasound application on fat mobilization”. Pathophysiology 9 13_/19.
(2002).
64
9.
James J. Romano. “The use of Ultrasound in Cosmetic surgery”. San
Francisco, CA 94108, 415 . 981 . 3911. (2007).
10.
Jared Hoylman. Understanding and Using VisualBasic 6. Part 6. Reynolds
Electronics. http://www.rentron.com/receiving_data.htm. (2007).
11.
Jerry L. Prince and Jonathan M. Links. Medical Imaging Signal and Systems.
Pearson Prentice Hall Bioengineering.
12.
John Z.S. The Biophysical Effects of Ultrasound. A Review of the Current
Literature. Pg 7-9.
13.
Joseph J. Carr and John M. Brown. Introduction to Biomedical Equipment
Technology. Fourth Edition. New Jersey. Prentice-Hall, Inc. (2001).
14.
Kenneth W. Coffey and Gregory F. Dorholt. Apparatus and Method for
Substantially Stationary Transducer Therapeutic Ultrasound Treatment. US.
United States Patent. (US Patent 6599 246 B1.). (2003).
15.
Kullervo Hynynen and Gregory T. Clement. Ultrasound Therapy. United
States Patent. (US Patent 6,770,031 B2.). (2004).
16.
Lennart D.J Nonthermal Effects of Therapeutic Ultrasound: The Frequency
Resonance Hypothesis. Journal of Athletic Training. 37(3): 293-299. (2002).
17.
Lou Tylee. Learn Visual Basic 6.0. Bellevue. KIDware (206) 721-2556.
http://www.jetcity.com/~kidware
18.
Microlink Engineering Solutions. Acquiring Data from the RS232 Serial
Port. http://www.microlink.co.uk/rs232.html. (2006).
19.
R. S. Khandpur. Handbook of Biomedical Instrumentation. Second Edition.
New Delhi.: Tata McGraw-Hill Publishing Company Limited. (2007).
65
20.
Speed C.A. Therapeutic Ultrasound in Soft Tissue Lesions. Rheumatology
Oxford Journal. 40 (12): 1331-1336. (2001).
21.
William R. Hendee and E. Russell Ritenour. Medical Imaging Physics.
Fourth Editon. New York: Wiley-Liss, Inc. (2002).
66
APPENDIX A
Full System of Temperature Monitoring Project for Ultrasound Therapy
Machine
Schematic Diagram of Temperature Sensor Circuit
67
APPENDIX B
Full Source Code for ADC Programming in PIC C Compiler
void main()
{
float V;//T;
setup_adc_ports(AN0);
setup_adc(ADC_CLOCK_INTERNAL);
setup_psp(PSP_DISABLED);
setup_spi(SPI_SS_DISABLED);
setup_timer_0(RTCC_INTERNAL|RTCC_DIV_1);
setup_timer_1(T1_DISABLED);
setup_timer_2(T2_DISABLED,0,1);
setup_comparator(NC_NC_NC_NC);
setup_vref(FALSE);
// TODO: USER CODE!!
V=read_adc();
V=(V*1/51);
printf("Voltage = %6.4f\n\r",V);
T=100*V;
printf("Temperature= %3.1f\n\r degree Celcius",T);
putc(0x0D);
putc(0x0A);
}
Hex file
#include <16F877A.h>
#device adc=10
#FUSES NOWDT
//No Watch Dog Timer
#FUSES HS
//High speed Osc (> 4mhz)
#FUSES NOPUT
//No Power Up Timer
#FUSES NOPROTECT
//Code not protected from reading
#FUSES NODEBUG
//No Debug mode for ICD
#FUSES NOBROWNOUT
//No brownout reset
#FUSES NOLVP
//No low voltage prgming, B3(PIC16) or
B5(PIC18) used for I/O
#FUSES NOCPD
//No EE protection
#FUSES WRT_50%
//Lower half of Program Memory is Write
Protected
#use delay(clock=20000000)
#use rs232(baud=9600,parity=N,xmit=PIN_C6,rcv=PIN_C7,bits=8)
68
APPENDIX C
Full Source Code of Graphical User Interface in Visual Basic 6.0
Form 1
'Declare Variables
Dim StartTime As Variant
Dim StopTime As Variant
Dim ElapsedTime As Variant
Dim TempF As Variant
Dim TempC As Variant
Dim InData As String
Private Sub cmdExit_Click()
'Message box confirm the user whether quit or cancel quit
answer = MsgBox("Do you want to quit?", vbExclamation + vbOKCancel
+ vbDefaultButton1, "Exit")
If answer = vbOK Then
'Exit the program
End
Else
MsgBox "Action canceled", vbInformation, "Cancel"
End If
End Sub
Private Sub cmdHelp_Click()
'Go to help page when the user click on help button
Form3.Show
Unload Form1
End Sub
Private Sub cmdStart_Click()
'Message box confirm the user whether startt or cancel start
begin = MsgBox("Start a new session?", vbOKCancel + vbQuestion +
vbDefaultButton1, "Start")
If begin = vbOK Then
'Start a new session Establish and print starting time
StartTime = Now
lblStart_TimeD.Caption = Format(StartTime, "hh:mm:ss")
lblStop_TimeD.Caption = ""
lblElapsed_TD.Caption = ""
End If
69
'Get input from MSComm and display temperature during start
MSComm1.InputLen = 10
If MSComm1.InBufferCount > 10 Then
InData = MSComm1.Input
MSComm1.InBufferCount = 0
lblTemp1.Caption = InData
End If
End Sub
Private Sub cmdStop_Click()
'Message box confirm the user whether stop or cancel stop
nono = MsgBox("Stop this current application?", vbOKCancel +
vbDefaultButton1 + vbExclamation, "Stop")
If nono = vbOK Then
'Find the ending time, compute the elapsed time
'Put both values in label boxes
StopTime = Now
ElapsedTime = StopTime - StartTime
lblStop_TimeD.Caption = Format(StopTime, "hh:mm:ss")
lblElapsed_TD.Caption = Format(ElapsedTime, "hh:mm:ss")
'Put the stop temperature in label boxes
MSComm1.InputLen = 10
If MSComm1.InBufferCount > 10 Then
InData = MSComm1.Input
MSComm1.InBufferCount = 0
lblTemp2.Caption = InData
End If
End Sub
Private Sub cmdUserManual_Click()
Form4.Show
Unload Form1
End Sub
Private Sub Form_Load()
MSComm1.PortOpen = True
End Sub
Private Sub Form_Unload(Cancel As Integer)
MSComm1.PortOpen = False
End Sub
'Time and Date (Calendar) Display
Private Sub Timer1_Timer()
Dim Today As Variant
70
Today = Now
lblDay.Caption = Format(Today, "dddd")
lblMonth.Caption = Format(Today, "mmmm")
lblYear.Caption = Format(Today, "yyyy")
lblNumber.Caption = Format(Today, "d")
lblTime.Caption = Format(Today, "h:mm:ss ampm")
End Sub
Form 2
Private Sub cmdStartDemo_Click()
Form4.Show
Unload Form2
End Sub
Form 3
Private Sub cmdBack_Click()
Form1.Show
Unload Form3
End Sub
Form 4
Private Sub Command1_Click()
Form1.Show
Unload Form4
End Sub