1
Introduction to Manifold GIS (Tutorial)
page 1
Introduction to Manifold GIS (Tutorial)
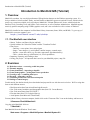
1. Overview
Manifold is a modern, low-cost, high-performance GIS application that runs on the Windows operating system. It is
freely available to Cornell students, faculty, and staff, thanks to Manifold's generous Academic License, which includes
nearly every extension available, and is equivalent to Manifold's "Ultimate Edition x64" license, which includes the
Business Tools, Geocoding Tools, and Surface Tools extensions, as well as Database Administrator. Manifold supports
massively parallel computing using NVIDIA graphics cards, and is also available for 64-bit versions of Windows.
Manifold is installed on the computers in all the Mann Library classrooms (Stone, B30A, and B30B). To get a copy of
Manifold for your own computer, go to:
https://confluence.cornell.edu/x/e4CqB
1.1. The Manifold user interface
• Menus, Toolbars, and Panes (Project and Info)
• Special toolbars: the "Selection Toolbar" and the "Transform Toolbar"
• Data Layers
◦ Drawing = vector points, lines, and polygons
◦ Image = raster images (e.g. aerial photos, satellite imagery, scanned maps)
◦ Surface = raster data values (e.g. elevation, temperature, population density)
◦ Table = tabular data (e.g. tab-delimited, csv, Excel spreadsheet)
• Importing, Exporting, and Linking to data
• Saving your project -- all imported data is saved to your Manifold project (.map) file.
2. Exercises
2.1 Bird observations -- converting a table into points
2.2 Thematic mapping
2.3 County boundaries -- importing a shapefile
2.4 County demographics -- joining data from a spreadsheet
2.5 Creating a map -- combining data layers
2.6 Elevation -- importing a surface
2.7 Calculating elevation for each observation point
2.8 Linking to remote imagery
For this tutorial, the data has already been downloaded and prepared for use with the exercises below. We'll be using data
from several different sources:
•
•
•
•
•
Bird observation data (from Avian Knowledge Network)
New York county boundaries and demographic data (from U.S. Census Bureau)
New York streets data (from NYS CSCIC)
Elevation data (from U.S. Geological Survey)
Aerial photos (from Microsoft Virtual Earth)
From any Mann Library classroom computer, double-click on the "Classroom Files" icon on the desktop, and browse to:
\\Classroom Files\GIS\Manifold1\
Copy the entire Manifold1 folder to:
T:\Manifold1\
Start Manifold from the Windows "Start" menu:
Start menu > Programs > Manifold System > Manifold System 8.0
Introduction to Manifold GIS (Tutorial)
page 2
2.1 Bird observations -- converting a table into points
The bird observation data was downloaded from the Avian Knowledge Network (AKN). For this exercise, it has been
pared down to just a small subset of the fields available, and has been saved as a comma-delimited .txt file. It includes
Latitude/Longitude coordinates that we can use to create a layer of points.
Import the observation data:
•
•
•
•
•
•
•
File menu > Import > Table...
Navigate to T:\Manifold1\
Make sure that "Files of type" is set to "CSV Files"
Open "AKN_BaldEagle.txt"
You will see a preview of the data. Leave all the default settings and click "OK".
Notice that the "AKN_BaldEagle" table now appears in the Project pane.
Double-click to view the data.
To turn this table into a drawing:
•
•
•
•
•
Right-click the "AKN_BaldEagle" table in the Project pane > Copy
Right-click on empty space in the Project pane > Paste as > Drawing...
In the dialog, you can select which fields to include (we'll keep them all)
Manifold will guess which columns contain the x and y coordinates. Review this selection.
Click "OK"
Notice that a drawing layer called "AKN_BaldEagle 2" now appears in the Project pane. Let's rename it:
• Right-click the "AKN_BaldEagle 2" layer > Rename... "Bald Eagle"
At this point, we can delete the original table, since we've copied all the data into the drawing:
• Right-click the original table "AKN_BaldEagle" > Delete
Double-click the "Bald Eagle" drawing to view the points. Try the following:
• Click any county to view the associated fields in the Info pane.
• Notice that the status bar at the bottom of the Manifold window shows the Latitude/Longitude coordinates of your
cursor as you move across the map.
• Use the tools on the navigation toolbar to zoom in and out:
• Use the tools on the format toolbar to change the way the counties are displayed. The right-most section of this
toolbar controls the display of points. Hover over the controls to see what they control. Try changing the "Point
Background" and "Point Size".
Introduction to Manifold GIS (Tutorial)
page 3
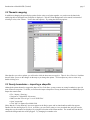
2.2 Thematic mapping
In addition to changing the point display options for the entire set of points together, we can also use the data in the
underlying table to determine how each point is displayed. Click the "Point Background" color swatch, but instead of
selecting a color, select "Theme..." (below the color options). Try setting the following options:
Note that after you select a palette, you will need to click the down-arrow to apply it. There is also a "Preview" checkbox
that will allow you to see the changes on the map as you change the options. You can adjust any value or color or by
double-clicking on it.
2.3 County boundaries -- importing a shapefile
Although the points themselves suggest the shape of New York State, we may want to use county boundaries to provide
more context to our points. To do this, we first need to import a shapefile of county boundaries into our Manifold project.
Import the counties data:
•
•
•
•
•
File > Import > Drawing...
Navigate to T:\Manifold1\ if necessary
Make sure that "Files of type" is set to "SHP Files"
Open "county.shp"
Click "OK", to import all available fields
Notice that the "County Drawing" layer now appears in the Project pane, and its related attribute table also appears.
Double-click the drawing layer to view it. As before, you can click a county to view associated data, and you can also
change the way the counties are displayed, by using the left section of the format toolbar. The swatch 2nd from the left
controls the background color of the polygons. Try changing it to another color.
Introduction to Manifold GIS (Tutorial)
page 4
2.4 County demographics -- joining data from a spreadsheet
Our county shapefile didn't have very much interesting data for each county -- just the name and the county FIPS code (an
identifier used by the U.S. Census). Suppose we have a Excel spreadsheet that contains these FIPS codes, as well as some
additional demographic data for each county. We can load this data and join it to our county drawing. First, import the
Excel file as a table:
•
•
•
•
•
•
File menu > Import > Table...
Navigate to T:\Manifold1\ if necessary.
Make sure that "Files of type" is set to "XLS Files"
Open "NY_county_demographics.xls"
Click "OK", to import all available fields
Rename the table to "Demographics" (in the project pane, Right-click > Rename)
In order to join this data to our county drawing, both tables need to have common identifier present in both tables. You
can double-click the "Demographics" table in the Project Pane to view the data from the Excel spreadsheet. We will use
the county FIPS code, a federally-assigned number. (Lacking this, we could try to use the county name, which would
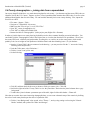
probably work, but we might run into problems with abbreviations and other matching issues.) To join the data:
• Open the "County Table" (the one connected to the drawing -- you may need to click the "+" next to the County
Drawing in the Project Pane)
• Under the Table menu, select "Relations..."
• Click the "create" icon (yellow star)
• Set the following:
• Click OK, and then check the box next to whatever fields you want to join. Click OK.
• Scroll to the right end of the "County Table" to view the joined data. Notice that the joined columns have a grey
background.
• To make these joined columns a permanent part of the table, right-click the table header > Flatten All.
Now that our counties have some interesting demographic data, we can create a thematic map of the counties by defining
the color of each county based upon the value of a particular field.
• Click the "Area Background" color swatch, select "Theme...", and try using setting a color using the "Natural
Breaks" method, and a palette like "Blues and Oranges".
Introduction to Manifold GIS (Tutorial)
page 5
2.5 Creating a map -- combining data layers
So far, we've only looked at a single data layer at a time. In order to combine our Bald Eagle points and our county
boundaries, we need to create a map. A map can display several data layers at the time.
• In the Project pane, click the small down-arrow next to the "Create" button (yellow star), and select "Map"
• Select both layers to be included in the map, and click OK.
• Double-click the new map layer to view it.
Notice that there is a tab for each layer at the bottom of the map window. You can double-click layers to toggle them
on/off, and you can drag the tabs to reorder the layers (top is to the left). Make sure that the Bald Eagle points appear on
top of the counties.
You may need to adjust the colors and display options of your data layers, so that the Bald Eagle points are clearly visible
on top of the counties.
2.6 Elevation -- importing a surface
Suppose that we think that bald eagle habitat is related to altitude, so we want to know the elevation of the land at which
the bald eagles were observed. This data wasn't included in our bird observation file, but we can use an elevation dataset
to calculate the heights of each observation point. First, we need to load the layer of elevation data, in this case from a
subset of GTOPO30 data that has been save as a .bil file.
•
•
•
•
•
File > Import > Surface...
Navigate to T:\Manifold1\ if necessary.
Make sure that "Files of type" is set to "BIL Files"
Open "elevation.bil"
Click "OK"
Notice that the Elevation layer appears in the Project pane, along with an associated terrain (which we'll ignore for now).
Double-click the "Elevation" layer to view it. Notice that, as you move the mouse across the image, the height value (in
meters) appears in the status bar at the bottom of the screen. (For example, "Z: 213.00")
We can change the way this layer appears by going to the "View" menu > Display options.
•
•
•
•
•
Set Display = "Height"
Set Palette = "Altitude in Meters"
Click the down-arrow to apply the palette.
Make sure the "Shading" checkbox is checked.
Click "OK".
2.7 Calculating elevation for each observation point
Next we want to calculate the elevation of the land at each point where a bald eagle was observed.
• Close the elevation layer and open the Map.
• Drag the Elevation layer from the Project Pane onto the Map window.
• In the map, turn off the County layer, and make sure that the Bald Eagle points are on top of the elevation layer.
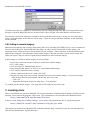
To extract the elevation value to each point, simply go to the "Surface" or "Drawing" menu (depending on which layer is
active), and select "Transfer Heights", and set the following:
Introduction to Manifold GIS (Tutorial)
page 6
Click OK, and in this case it happens so fast that it may look like nothing has happened. But click on a point and see the
Info pane (or open the Bald Eagle table) to see that elevation values ("Height") have been added to each observation.
We could also use this same technique to summarize the elevation data for the counties. In that case, we would want to
set the "Aggregate heights for line and area objects using..." option to average, maximum, minimum, or sum, depending
on what we want.
2.8 Linking to remote imagery
Manifold can dynamically link to imagery from remote Web servers, including OGC WMS servers, as well as commercial
providers such as Microsoft Virtual Earth and Yahoo Maps. In order to access Virtual Earth or Yahoo imagery, the
connectors to these image servers must first be installed on your computer. (These connectors are already installed on the
Mann Library computers.) One advantage of using remote imagery is that you do not have to store massive image files
within your project. But you will need a good network connection in order to load the imagery.
In this example we will link to satellite imagery from Virtual Earth:
•
•
•
•
•
•
•
In your map, zoom to the extent for which you would like to load the imagery.
File > Link > Image...
Set "Files of type" to "Manifold Image Servers"
In the dialog box that appears, set "Server" to "Virtual Earth Satellite Image"
Click "refresh" button (two arrows circling)
After the connection to the server is made, click "OK"
Drag the new image layer onto your map. Manifold will not re-project remote imagery, so if you get a message
about the projection being incompatible with the map, don't worry, and:
◦ Click "yes"
◦ Right-click the map tab for the new image layer > "Use projection"
Try zooming into the satellite imagery. New image tiles will be loaded as you zoom or pan.
3. Learning more
There is no published user manual for Manifold. The best documentation, including detailed examples of all the tools and
functions, can be found in the program's "Help" menu. This documentation is also available on the Manifold website:
http://www.manifold.net/doc/manifold.htm
In the real world, finding data is half the challenge. If you need to find geospatial data, here is a good starting point:
http://mannlib.cornell.edu/research-help/gis/gis-data
This tutorial was created for the "Manifold GIS" workshop at Mann Library, Cornell University, and was last updated on
2009-09-29 by Keith Jenkins <[email protected]>.