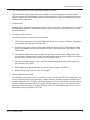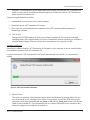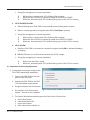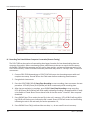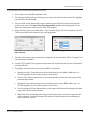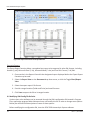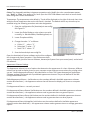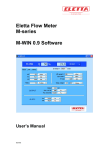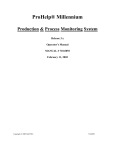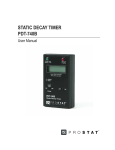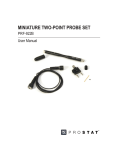
1
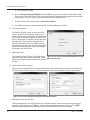
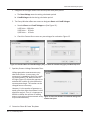
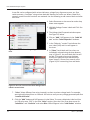
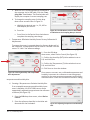
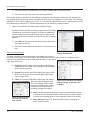
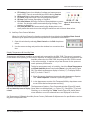
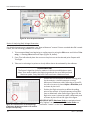
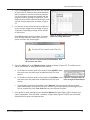
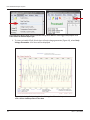
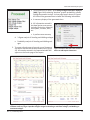
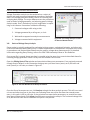
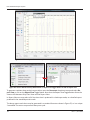
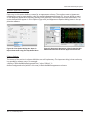
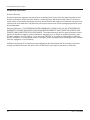
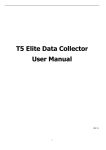
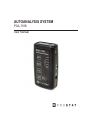
AUTOANALYSIS SYSTEM
PGA-710B
User Manual
Table of Contents
PROSTAT® PGA-710B AUTOANALYSIS SYSTEM
Section
Topic
Page
I.
ESD Control Elements
4
II.
PGA-710B Autoanalysis Set Content
4
III.
Cautions & Warnings
6
IV.
Instrument Setup & Computer Connection
6
V.
Controls
9
VI.
Preparation for Recording Operations
11
VII.
Generating Printed Charts & Reports
23
VIII.
Basics of Voltage Decay Analysis
27
IX.
Recording Test Data Without Computer Connection (Remote Testing)
30
X.
Exporting & Importing Data to and from Excel® Spreadsheets
32
XI.
Modifying XML Config File Defaults
34
XII.
Warranty Information
38
General Specifications
39
Application Software System Requirements
40
Copyright © 2012 by Prostat® Corporation. All rights reserved. Printed in the United States of America. No part of this
manual may be used or reproduced in any manner whatsoever without written permission. For information contact
Prostat Corporation, 1072 Tower Lane, Bensenville, IL 60106 USA
Prostat is the registered trademark of Prostat® Corporation
PGA-710B Autoanalysis System
Product Overview
The PROSTAT® PGA-710B Autoanalyzer is an electrostatic data analysis peripheral device for use with PROSTAT’s PFK-100 Instrument Set, which incorporates a
PFM-711A Electrostatic Field Meter, CPM-720 Charge Plate Monitor and PCS730 Charging Source. Using the Autoanalysis System Applications Software, the
PGA-710B will record, plot over time and automatically analyze body voltage
generation, electrostatic decay, voltage retention and other electrostatic events.
Its distinctive Voltage Generation analysis feature is designed to document and
calculate projected levels of typical Human Body and other voltages generated
in the manufacturing process.
It will also document and assess electrostatic decay functions, variations in voltage retention, and ambient temperature and relative humidity during each test.
Once tests and analysis are completed, this unique system will construct and
generate detailed written test reports.
I. ESD Control Elements
Examples of ESD Control products that can be evaluated using the PGA-710B Graphic Autoanalyzer include, but are not limited to:
Ionization Device and System Offset Voltage & Decay Performance
Footwear and Flooring combinations
Chairs (Sitting and Standing Functions)
Worksurface Voltage Suppression
Packaging Materials & Systems
Rolling Carts
Production Aids & Materials
Record process equipment field voltages
Other tests & evaluation
II. PGA-710B Autoanalysis Set Contents
The Autoanalysis System consists of the following components:
A. PGA-710B Autoanalyzer
The Autoanalyzer is an electronic data logging device incorporating analog signal to digital conversion, computing, memory, and temperature and relative humidity sensing capabilities. The Autoanalyzer receives input from a measurement instrument, such as a Prostat PFM-711A Field Meter.
Its output is typically via USB to a computer using Windows XP or later operating system. The unit
is powered by a rechargeable lithium-ion battery.
NOTE
Do not connect a device having an input voltage greater than ±2.0 volts to the Autoanalyzer. Voltages over ±2.0 V may damage the device and will void the warranty. For further
information regarding instrument connections contact Prostat customer service.
4
Rev. A / June 2013
PGA-710B Autoanalysis System
B. PGA-710B Autoanalysis System Application Software CD-ROM
The Autoanalysis System Applications disk includes the necessary programs to communicate
with, and operate the Autoanalyzer, install analytical programs, drivers and additional Microsoft
software. Before opening or loading software, please be sure to review the Autoanalysis System
Software license agreement.
C. Documentation
Documentation includes this Operating Manual, a Quick Start Guide, a Serial Number for access to
the Application Software, a Testing Guide for Flooring and Ionizers, and a Help file link in the Application Software.
D. Connections & Accessories
The following cables and accessories are provided:
1. USB cable for connection of the PGA-710B Autoanalyzer to a computer USB port. Computer is
not provided. (Part Number: PGA-710USB)
2. Shielded analog cable connects the analog output of a Prostat PFM-711A Field Meter (field
meter not provided) and the signal input of the PGA-710B Autoanalyzer (Part Number: PGA710AnaCab).
3. The shielded voltage measurement cable with ground is used for body voltage, body retention and other measurement. Connect the green shield lead to ground to reduce the effects of
ambient electrical noise. (Part Number: PGA-710ChgGen lead)
4. Input Shorting Shunt used to “zero” the PGA-710B Autoanalyzer during normal operations.
(Part Number: PGA-710CC)
5. Body voltage Hand Wand and Cable accessories. (Part Number: PFA-861-H)
6. Battery Charger (Part Number: PGA-710 Charger)
E. Shielded Measurement Cable
The shielded measurement cable is intented for use with the Prostat CPM-720 charge plate monitor for measuring body voltage generation, charge retention, remote equipment and other electrostatic voltage sources. The signal conductor insulation is Red and the shield insulation is Green.
Connect the Red lead to the CPM and the object being measured. Connect the Green shield to
ground to reduce the effects of ambient electrical noise and transmitted energy. Do not connect
the shield to the ground plate of the CPM.
Rev. A / Juneanuary 2013
5
PGA-710B Autoanalysis System
Figure 1: Schematic of Test Setup
III. Cautions & Warnings
A. There are no user serviceable parts in the unit. Do not open the PGA-710B Autoanalyzer, or damage the warranty seal. Only authorized Prostat technicians can provide repair and mechanical
updates. Opening the unit or damaging the seal will void the warranty.
B. To prevent low voltage shock or damage to the unit or operator, do not operate the device when
wet, or in a wet environment.
C. Do not exceed ± 2.0 volt signal input to the Autoanalyzer. Higher voltages may damage the unit
and will void the warranty.
NOTE: Contact Prostat Customer Service for information regarding feasibility of connecting other
than Prostat instruments and devices to the Autoanalyzer.
D. The Autoanalyzer is a precision instrument. Consider it as fragile. It can be damaged by abuse. As
with other fine instruments do not drop or cause mechanical shock.
E. The Autoanalyzer’s analytical program function is based on operator input and the data supplied.
Thus, the representative accuracy and value of system calculations are based on operator input
and actions. Prostat is not responsible for data analysis results or the decisions made based on
PGA-710B Autoanalysis System data analysis.
IV. Instrument Setup & Computer Connection
The PGA-710B Autoanalyzer connects to a Prostat PFM-711A Electrostatic Field Meter via its analog output lead and to a computer using USB cable. The PGA-710B and accompanying software converts the field
meter and computer into a digital chart recording system with automatic analysis and reporting features.
The USB connection provides optimal data transfer between the PGA-710B and the computer.
A. System Compatibility
The PGA-710B is intended for use ONLY with computers using current versions of Windows XP,
Vista 32-bit/64-bit, Win7 32-bit/64-bit and Win8 operating systems. Note that systems other than
Windows 2003 may be required to download a Microsoft upgrade (.NET platform) for proper
6
Rev. A / June 2013
PGA-710B Autoanalysis System
operation. The Autoanalysis System Applications disk includes the Microsoft .NET Framework 4.0
platform, which will be installed with operator approval. Periodically check for .NET software updates at the Microsoft web site.
Systems using Windows XP should be:
• Updated with current service pack 3 critical updates
• Download current .NET Framework 4.0 version
• Then check for, and download current updates to the .NET Framework before loading the
Autoanalysis software.
B. Prior to Use
Charge the PGA-710B’s battery for 8-14 hours using the supplied AC/DC converter. Estimated
operating battery life is approximately 8–10 hours of operation without connection to USB port or
supplied battery charger. The unit charges when connected to the computer via USB.
Software Installation
Autoanalysis software requires .NET Framework 4.0 installed on your computer. It can be installed either
thru Windows Update or from the installation CD.
For your convenience, .NET Framework 4.0 will install automatically from the CD if it’s not already installed.
Figure 2: .NET Framework 4 installation
C. Device Drivers
This version of software is delivered with device drivers for Windows XP through Win8. The drivers can be found on the installation CD in folder Drivers. before conneciPGA-710B deice to your
computer, install thee named VCP_V1.3.1_Setup or VCP_V1.3.1_Setup_x64 located in the Drivers
folder on the provided CD. Once completed, you can connect the device to your computer. Windows will complete the installation of the drivers.
Rev. A / Juneanuary 2013
7
PGA-710B Autoanalysis System
D. Quick Start: Software Installation & Instrument Connections
To load the Autoanalysis Application software:
1. Insert the Autoanalysis Application CD into the computer’s CD/DVD-ROM drive
2. Choose Start > Run. Click Browse and choose the Setup.exe file.
3. Follow the on-screen instructions.
4. If prompted to install the .NET Framework 4.0 Package, click Yes
5. Connect PGA-710B to computer via USB
cable. Refer to Figures 1 – 7.
6. Connect the PGA-710B to your PFM711A Field meter via analog signal cable
7. Slide PGA-710B’s battery cut off switch
to the ON position.
8. Press the System ON/Sleep panel membrane pad and release when LED’s energize.
Figure 3: USB Connection
9. Your computer should recognize NEW HARDWARE.
10.After installation Prostat “Autoanalysis System” shortcut will be installed on the desk top.
NOTE: The first time the PGA-710B software is opened, the operator has an opportunity to select
desired language and temperature display in either Celsius or Fahrenheit.
Both language and preferred temperature display can be changed at any time using the tool bar
View > Language and View > Temperature Scale
Figure 4: Front Panel
8
Figure 5: Analog Input & Reset
Rev. A / June 2013
PGA-710B Autoanalysis System
LED 1: Low Batt.
Pad 1: On/Sleep
Pad 2: Start/Stop
[In Remote Ops]
Pad 3: Save
[In Remote Ops]
LED 2: Unit ON
LED 3: Computer
Connected [Save]
LED 4: Battery
Charging [Erase]
Pad 4: Erase
[In Remote Ops]
Figure 6: Front Panel
V. Controls
A. Operator controls include:
1. Main Power Battery Bus Isolation Slide Switch
(Figure 7): Isolates battery from unit electronics during storage and between operating
sessions.
a. In OFF position Battery Charging (LED 4)
remains OFF when unit charges using AC/
DC converter.
b. Note that small green LED next to Charger
Connection will energize during charging.
See circle in Figure 7.
Figure 7: Main Power Battery Bus Slide
Switch Isolates Battery during Storage
c. In ON position, unit is energized in “sleep” mode but is not operational until System ON/
Sleep (Pad 1) button is pressed.
Rev. A / Juneanuary 2013
9
PGA-710B Autoanalysis System
2. PAD 1 System ON/Sleep: Places unit in Normal Operation or Sleep modes.
a. Press ON: LED’s #2 - #4 flash, then GREEN LED #2 blinks slowly to indicate unit is ON and
operating. (Figure 8)
b. Press Sleep: Press and hold pad until LED’s #2 - #4 energize temporarily, then release pad to
place unit in standby or “sleep” mode. LED’s are OFF.
3. PAD 2 Start/Stop Recording Records data when in Remote Mode, i.e., when not connected to a
computer. Remote operations allow recording and storage of individual test files for computer
download at a later time.
4. PAD 3 Save File when in Remote Mode. Once a remote test cycle is completed, i.e., PAD 2 is
pressed to stop recording, pressing PAD 3 saves the test data as an individual file in the unit’s
memory.
5. PAD 4 Erase File(s) when in Remote Mode.
a. Press Once erases current test before it is saved in unit memory
b. Press and Hold until LED’s 2–4 flash rapidly in sequence Erases ALL FILES in memory
6. Reset Re-boots PGA-710B in the case of latch up. See Figure 5.
B. LED Indicators
LED indicators provide information in computer connect and remote operational modes.
1. LED 1 RED: Low Battery level. Charge battery
via USB connection to computer or using AC/
DC converter. (See Battery Consumption in
Technical Specifications on page 39)
a. Unit operates normally during either
charging mode. During operation more
current is used than provided by USB connection. Periodically recharge battery with
the AC/DC charger.
b. Note that LED 1 does not operate, i.e.,
indicate low battery or energize, when Battery Bus Isolation Switch is OFF.
2. LED 2 GREEN: Electronics energized and operating.
Figure 8: ON/OFF: Power up or place PGA710B into “sleep mode”.
a. ON when PGA-710B is energized, i.e., Battery Bus Isolation Switch is ON and System ON/
Sleep pad is pressed. It blinks slowly to indicate unit is energized and operating.
b. When in remote operations
10
1)
2)
Energized when unit turned ON, blinks to indicate unit energized and operating
Energized when PAD 2 Start/Stop Recording is pressed
Rev. A / June 2013
PGA-710B Autoanalysis System
c. During file management in remote operations:
1)
2)
3)
Blinks slowly in tandem with LED’s #3 during file recording
Blinks fast with LED’s #3 to indicate file needs to be SAVED or ERASED
Blinks fast, alternately with LED’s #3 & #4 during erase of ALL FILES in memory
3. LED 3 ORANGE/YELLOW:
a. ON and Blinking when PGA-710B is connected & communicating with computer
b. When in remote operations, energized when PAD 2 Start/Stop is pressed
c. During file management in remote operations:
1)
2)
3)
Blinks slowly in tandem with LED’s #2 during file recording
Blinks fast with LED’s #2 to indicate file needs to be SAVED or ERASED
Blinks fast, alternately with LED’s #2 & #4 during erase of ALL FILES in memory
4. LED 4 YELLOW:
a. ON when PGA-710B is connected to computer, energized steady ON to indicate the battery
is charging
b. LED 4 is ON when unit is ON and connected to the AC/DC charger
c. During file management in remote operations:
1)
2)
Blinks once when file is saved
Blinks fast, alternately with LED’s #2 & #4 during erase of ALL FILES in memory
VI. Preparation for Recording Operations
A. Follow these initial steps to explore the
PGA-710B’s operational capabilities.
1. Connect the PGA-710B to the computer via the USB cable
2. Connect the PGA-710B to the PFM711A Field Meter analog output
3. Energize computer and instruments
4. On computer, click “Autoanalysis
System” shortcut to start software
Figure 9: Autoanalysis Software Start Screen
5. The Session Wizard automatically opens the Start Screen. Choose from:
a.
b.
c.
d.
Start a New Session
Load Saved Session file
Import from Device
Start a New Session Wizard, or
Rev. A / Juneanuary 2013
11
PGA-710B Autoanalysis System
e. Close the Start Screen
6. Select “Start a New Session Wizard” and Click OK as in Figure 9, will open Session Wizard Test
Type screen (Figure 10). Select Test Type and provide the requested information to be included
in test reports. See The Session Wizard section below for further details.
7. To open a fresh chart, simply select “Start a New Session”.
8. Press New Document symbol on the tool bar to open additional new files
B. The Session Wizard
The Session Wizard is used to enter test information, material identification, location and
notes. All information entered in the Wizard will
be included in the generated charts and test reports. Information is entered in any of the basic
test scenarios: General Test, Voltage Generation Test, and Decay Test. The Wizard consists
of an Opening Screen, Two General Information
Screens and Test Specialty screens for Voltage
Generation and Decay Tests.
C. Opening Screen
The Opening Screen (Figure 10) is used to des- Figure 10: Use the first Session Wizard Window to Designate the type of test to be conducted. In the ignate the Type Test
illustration at right, decay testing is the intent of
the test.
D. General Information Screens
Two screens provide fields for a variety of descriptive and location information that is included on
all charts and in detailed reports. The following two screens are included in all test type formats.
Figure 11: Technician, Material and General Information Screens
E. Specialty Screens: Decay Tests
Decay measurements are used primarily for ionization testing. Decay tests have a beginning voltage where timing begins or is “Reset”, and an ending voltage where timing stops, or is “Cutoff”.
The following screens and windows are used to enter Reset and Cutoff test voltages.
12
Rev. A / June 2013
PGA-710B Autoanalysis System
1. Designate the voltages used to Start and Stop the decay time period.
a. The Reset Voltage starts the timing calculation period.
b. Cutoff Voltage ends the timing calculation period.
2. The Decay Window offers two means to designate Reset and Cutoff Voltages.
a. Standard Reset and Cutoff Voltages are (See Figure 12):
1,000 Volts – 100 Volts
1,000 Volts – 50 Volts
1,000 Volts – 10 Volts
b. Check the Custom Box to enter any two voltages for evaluation. Figure 12.
Figure 12: Standard Reset and Cutoff Voltages (left), or check the Custom Box (right) and Manually Enter
F. Specialty Screens: Voltage Generation Tests
Voltage generation measurements may
take several forms. In many tests, the
movement is repetitious, much like a walking measurement. The Wizard screen at
the right (Figure 13) allows the operator to
estimate the number of cycles before the
measurements begin. The number can be
changed later as necessary.
However, it is the number of operator entered cycles that drive the software’s initial
algorithm analysis. Thus, it is important to
be able to define the number of walking
steps or test cycles so that automatic analy- Figure 13: Enter the Number of estimated Voltage Gensis proceeds effectively.
eration Test Cycles
G. Customize Charts & Create Templates
Rev. A / Juneanuary 2013
13
PGA-710B Autoanalysis System
A new file can be configured with various indicators, voltage lines, alignment arrows, etc. One
could construct a “template” using various desirable features for future use. When a New file is
opened, record & control functions are activated. Use the following to add custom labels and reference lines.
1. Select Document on the menu bar and a drop down menu appears
2. Highlight Voltage Custom Labels and Click. See Figure 14.
3. The Voltage Label Properties window opens. See Figure 15, below.
4. Click on “Add”; 0.00 appears in the “Label Val
ues” and the “Label Properties” windows.
5. In the “Behavior” section True indicates the zero Label (0.00) and Line will appear in the chart.
Figure 14: Customize Chart Using Voltage Labels and
Lines
6.
In “Colors” both Label and Line colors are individually selected using the drop down ar
row. In Figure 15, the zero Label and Line will be Red. To change colors press the down arrow(s) to open the color selection drop down menu(s). Choose from several colors (Figure 16) for customizing lines and labels.
Figure 15: One can create various Chart Voltage Lines &
Labels in several colors
7. “Value” allows different lines to be inserted in a chart at various voltage levels. For example,
we might add colored lines at +100 and -100 volts to easily see any voltage generated peak that
“exceeds ±100 volts”.
8. Click the “Add” button and 0.00 appears in Label Value. To create a distinctive Label and Line
at +100 volts enter “100” in the Data “Value” section. Open the Color Drop down menu for
“LabelColor” and “LineColor” and select Blue. 100 will appear in the “Label Values” window.
14
Rev. A / June 2013
PGA-710B Autoanalysis System
9. Repeat for “-100”, i.e., enter “-100” in
the Data “Value” section. Open the Color
Drop down menu and select Blue. -100
will appear in the “Label Values” window. See Figure 17. Click OK and your
plotting chart resembles Figure 18, on
the next page.
Use the various scale adjustment arrows
to center the 0.00 Line, adjust the chart
voltage and time sweep ranges to meet
anticipated test needs. Once prepared
to your liking, and before recording data,
save the chart as a template to reduce
future setup time. For example, save the
file as “ChgGen Template1.tst”. Whenever the file is recalled the chart settings
are as you left them and the file is ready
to record data and be saved with a new
name.
Figure 16: Color Drop down Menu Used to Change Label
Figure 17: : In the Data section enter Voltage Value
where a Chart Line is desired
NOTE
Creating Test Templates are convenient and save a great deal of time. However,
once data is recorded and saved in a file it cannot be reused as a template.
Rev. A / Juneanuary 2013
15
PGA-710B Autoanalysis System
Figure 18: New Chart with Red Zero Line and Blue Labels and lines at ±100
H. Set PGA-710B Time & Date
In preparation to record and analyze data, confirm PGA710B system date and time are correct.
1. Press Edit on the menu bar to open the drop down menu.
2. Select Device Control and a Device Control window (Figure 19) appears on the screen.
3. With the PGA-710B energized and connected to the computer via USB cable, Click the “Device Time” Read Figure 19: Use Edit drop down Menu to Access button. The Read window will display the computer’s Device Control Window for setting Set PGA-710B current date and time settings.
Date & Time
710B’s time clock to the computer.
4. Press the Set Device Time button to set the PGA-
5. Press Done to close the window.
I. Sampling Rate
The PGA-710B’s default Sampling Rate is 50 samples/second, which is suitable for most auditing
and analysis applications. To confirm or modify the rate proceed as follows:
1. Open the Edit drop down menu.
2. Select Device Control and a Device Control window (Figure 20) appears on the screen.
16
Rev. A / June 2013
PGA-710B Autoanalysis System
3. With the PGA-710B energized and connected to
the computer via its USB cable, Click the “Sampling Rate” Read button. The Read window will
display the computer’s current sampling rate.
4. To change the sampling rate, click the drop
down menu arrow as seen in Figure 21:
a. Highlight the desired rate, i.e., 50, 100 or
200 samples per second
b. Press Set
c. Press Done in the Device Control window to
complete the sampling rate change.
Figure 20: Use Edit Menu to Access Device Control Window to Set Sampling Rate per Second
J. Temperature & Relative Humidity Sensor Factory Calibration &
Adjustments
To ensure the sensor is operating based on factory design and initial calibration, all adjustments or bias must be “cleared” from the
sensor. To “clear” the software settings:
Figure 21: Select Sampling Rate
1. From the Edit drop
down menu, select Device Control (See Figure 22)
2. Confirm the Humidity (Rh%) Value window is set at
0.0, and click Clear
3. Confirm the Temperature (F) Value window is set at
0.0, and click Clear
4. Click Done to close the window.
Figure 22: Clearing Humidity and Temperature
Bias adjustments
temperature and humidity bias.
Once sensors are reset, use a calibrated temperature and
humidity instrument as a reference to set the appropriate bias for the most accurate temperature and humidity
mesasurements. Follow the instructions below for srtting
K. Creating a Temperature or Relative Humidity Bias
If an acceptable temperature and humidity instrument is available, the PGA-710B’s sensor can be
operationally adjusted to approximate the reference
as follows (See Figure 23):
1. From the Edit drop down menu, select Device
Control
2. Enter the reference humidity in the Value window and click the Set button
Rev. A / Juneanuary 2013
Figure 23: Adjusting Temperature and Humidity
Bias
17
PGA-710B Autoanalysis System
3. Enter the reference temperature in the Value window and click the Set button
4. Click Done to reset the sensor and close the window
Once a new setting is entered into the software, temperature and humidity indications will be based on
the existing sensor performance plus the influence of the new net setting bias. For example, if the existing
indication is 70°F and the setting input is 65°F, a -5° bias will be added to the sensor’s measurement, and it
will subsequently indicate 65°F. A similar adjustment can be made for relative humidity.
L. Open Current (Real Time) Measurement Digital Display
A left panel area includes real time measurements of volatge,
temperature and relative humidity. To display an additional
real time measurement window showing the values of voltage, temperature and relative humidity during the recording
process:
1. Press Edit on the menu bar and select Current Measures.
See Figure 24 and 25.
2. Place the Current Measures window in a convenient location.
Figure 24: Access Current Measures
through the Edit Menu
Data Recording Controls
The data recording Controls are located at the upper left corner of
the screen. See Figures 25 and 26, below. The symbols are similar to the controls of a traditional tape
recorder (for those who may remember tape recorders). From left to
right, the controls are:
1. Preview: Green Triangle starts chart plot and indicates
magnitude of data. Data is not recorded, it allows adjustments before recording.
2. Record: Pressing the Red Circle begins data entry to file.
When recording, the circle becomes Red and the plot
trace changes color.
3. Pause: The vertical Parallel Bars allow stop and start of
data entry during Playback and
when recording in General Measurement and Decay test modes.
Pause does not function when
recording Voltage Generation.
Figure 26: Chart Controls
are similar to those of a
tape recorder
18
Figure 25: Current Measures window
displays Voltage, Temperature and
Humidity
4. Stop: The Black Square stops either Preview or Recording functions. If used to Stop the Preview function, when Preview is pressed again it resets the recording point to start ongoing Preview or Recording.
5. Short Cut Keys (Figure 27): Several function keys are assigned to
assist in chart control:
Rev. A / June 2013
PGA-710B Autoanalysis System
a. F5 Preview: Starts chart display of voltage and measurement
levels. NOTE: Data is not entered into the file during Preview
b. F6 Record: Begins data capture of all measurement levels
c. F7 Pause: Stops and Starts Chart recording and playback
d. F8 Stop: Ends Preview, Recording or Playback.
e. F11 Auto Balance: Will align Preview or Recorded data to center Figure 27: Short Cut Key
of chart. Can also be used to automatically align Voltage, Tem- Controls
perature or Humidity.
f. F12 Auto Min Max: Will automatically align display data to vertically utilize the entire chart view using the maximum and minimum data values.
N. Auxiliary Chart Control Window
When the Left Panel Control is closed to maximize the chart display the Auxiliary Chart Control
window may be opened and positioned anywhere for operational convenience.
1. Open this window by selecting Chart Control on the Edit drop down
menu.
2. Use the mouse to drag and position the window in a convenient location.
Display Temperature & Humidity Data
Temperature and Relative humidity are sensed and measured by the PGA-710B. The sensor is mounted
in the bottom shell opening of the case for exposure to ambient conditions. It measures temperature and
humidity external to the PGA-710B. Assuming the PGA-710B is stored
in the area overnight, it requires only a few minutes for the system to
reach optimum performance.
To display temperature and, or humidity, check the Show Temperature
and Show Humidity boxes listed under Charts in the left panel (Figure
28). The default temperature display is Celsius (°C). To display Fahrenheit (°F) or both °C and °F:
1. Open Document drop down menu and select Appearance Options. The “Chart Properties” window is opened (Figure 29).
2. In the Appearance section click TempaxesVisibility drop down menu arrow. Select desired temperature scale(s).
Figure 28: Check Show TemperaThe Appearance Options, Chart Properties window (Figure 29) estabture and Humidity Boxes to display lishes what is to be displayed, i.e., Celsius (°C), Fahrenheit (°F) or both.
related
Checking, or un-checking the “Show” boxes (Figure 28, above) deter-
mines whether or not the selected items are displayed in the chart.
See Temperature & Relative Humidity Sensor Factory Calibration & Adjustments for specifications and setting Rh or temperature bias.
Rev. A / Juneanuary 2013
19
PGA-710B Autoanalysis System
Figure 29: Chart Properties Window
Basics of Analyzing Body Voltage Generation
For detailed measurement suggestions, see “How to Measure” manual. Once a recorded data file is established, use the following guidelines for analysis:
1. Trim unwanted data from beginning or ending traces by using the Edit menu and click on Trimming…. A floating Edit window will open (Figure 30, below).
2. Press Trim Left tab and place the cursor on the plot trace at the selected point. Repeat with
Trim Right.
3. Take care in selecting trim points to clearly define data to be evaluated by the software.
OPERATIONAL HINT
The System’s algorithm looks for patterns in Minimum and Maximum peak
values. One needs to define the beginning and end of a set of Minimum and
Maximum peaks. Every Minimum Peak must have a Maximum Peak.
Figure 30: Trim Data Trace to Identify Range
of Minimum & Maximum Peaks to be used for
Analysis and reporting.
20
a.
Position the Left trim point to define a starting point for the analysis. It should represent an initial
Minimum or Maximum value. Referring to Figure 30, the Left trim cursor is placed before a Minimum peak as shown by the circle.
b.
Position the Right trim point to define the ending point of the analysis. It should represent a final Mini
mum or Maximum value. Referring to Figure 30, the Right trim cursor is placed just after a Maximum peak as shown by the circle at the right of the figure.
IMPORTANT NOTE: Maximum Peaks are positioned vertically “Highest” on the chart, while Minimum Peaks are
positioned “Lowest” on the chart.
Rev. A / June 2013
PGA-710B Autoanalysis System
4. Click the Voltage Gen tab and enter the number
of step cycles or measure-ment peaks between
the trim points on the chart and press Analyze.
If a clear number of peaks are entered and the
program confirms through its algorithm, it will
display a series of Min and Max peaks with vertical lines for each step cycle as shown in Figure
31.
5. If a number of step cycles cannot be confirmed
by the analysis program the message in Figure
32 appears requesting a change in the number
of step cycles:
Click OK and enter another number. If you continue to have difficulty, modify the chart Trim
points and start this process again.
Figure 31: Representative number of Cycles
entered in Voltage Generation
Figure 32: Error in Peaks entered in Edit Window. Click
OK and enter new value
6. Press the Adjust tab in the Editing Control window as shown in Figure 33. This allows you to
add or remove Min or Max peaks from the analysis.
a. To include a minimum peak in the analysis click Add Min, place
the cursor over the peak to be included and Left Click your
mouse.
b. To include a maximum peak in the analysis cick Add Max, place Figure 33: Click Adjust then Rethe cursor over the peak to be included and Left Click your
lease to begin the Autoanalysis
mouse.
c. To eliminate a peak from the analysis select Remove, place the cursor over the vertical
peak identification line and Left Click your mouse. If you have difficulty identifying the vertical line, expand the chart Time Scale and retry the Remove function.
7. Once peaks for each walking step are identified Release the data (Figure 33) for analysis and
report preparation. Once the data is released, 3 Sigma data (Figures 34 & 35) are calculated,
displayed and a report can be generated.
Rev. A / Juneanuary 2013
21
PGA-710B Autoanalysis System
Figure 34: Releasing Data and Process the 3-Sigma Analysis for Minimum
& Maximum peak sets
8. The 3-Sigma Analysis is calculated for the Maximum and Minimum data sets and displayed as
follows (Figure 35):
a. The average and standard deviation are calculated.
b. Three times the standard deviation are added
to the average to establish the Highest end of
the range.
c. Three times the standard deviation are subtracted from the average to establish the Lowest end of the range.
d. The Average, High and Low ends of each range
are identified and plotted on the chart.
Figure 35: 3-Sigma Ranges are calculated and
plotted for Minimum & Maximum Peak Sets
22
Rev. A / June 2013
PGA-710B Autoanalysis System
Chart Information: Test Information Status
As one proceeds through the recording, trim, edit and analysis phases, the lower portion of the chart
screen provides Test Information and status. Status indications are as follows:
Incomplete:
Data is not recorded; chart is blank.
Figure 36: Chart Status Incomplete: No Recorded Data
Edited:
Data is recorded but file is not yet analyzed
Figure 37: Chart Status: Data Recorded & Trimmed – Chart Not Analyzed
Analyzed: Data is trimmed and number of peaks identified
Figure 38: Chart Status: Data Trimmed and Peaks Identified
Processed: Data is adjusted and “Released” ±3 Sigma Calculated & Identified
Figure 39: Chart Status: Data Evaluated and 3 Sigma Ranges Calculated
VII.Generating Printed Charts & Reports
To generate printed charts and reports open the Document drop down menu and select Report View
(Figure 40), which processes recorded data and provides a new screen view. Or, press the Report toggle
button on the tool bar.
Rev. A / Juneanuary 2013
23
PGA-710B Autoanalysis System
Figure 40: Select Report View from the Document drop down Menu or Click Toggle Chart/Report View.
Then choose the desired Report type.
1. To view a printable 8.5x11.0 inch chart of body voltage generation (Figure 41), select Body
Voltage Generation. A full chart will be displayed.
Figure 41: Selecting “Body Voltage Test” or “Voltage Test” from the Report Menu Generates a full size landscape Chart of Test Data
24
Rev. A / June 2013
PGA-710B Autoanalysis System
2.
To view and print a report, select Body Voltage Generation Analysis (Abs) (Figure 41A) meaning “absolute” graphic probability, or Body Voltage Generation Analysis. A three page report shown in Figures 43 & 44 will be generated that includes the following information.
a. A summary display of the generated chart.
b. All information entered in
the New Session start menus,
including Technician, Material
Description, Location, Area,
etc.
c. A performance summary
d. 3-Sigma analysis of Standing and Walking voltages
e. Probability analysis of Standing and Walking voltages
3. To create a fourth page of remarks, press Document
and select Remarks on the drop down menu (Figure
42). All remarks entered in the opened window will
appear on the fourth page of the report.
Figure 42: Select Remarks from Document
Menu to Add Reports Comments
Figure 43: Report Pages 1 & 2. Front Page provides charted data with analysis points, general information
and data summary. Pages 2 provides 3-Sigma ranges for Standing or minimum voltages, and Walking or
maximum voltages.
Rev. A / Juneanuary 2013
25
PGA-710B Autoanalysis System
Figure 44: Report Pages 3 & 4. Page 3 displays Probability Analysis based on normal distribution of Average and Standard Deviation information for Standing (Minimum) and Walking (Maximum) Voltage Data.
Page 4 is optional and designed for Report Remarks.
Absolute (Abs) vs. Non-Absolute Reports
Selecting an Absolute (Abs) report simply means
that the probability curves displayed on the third
page of the report are draw without regard to positive or negative polarity data; the absolute data
values are employed in the analysis. In this form all
curves are draw from left to right as shown in Figure
44, above.
Selecting non-absolute report format allows the
probability curve analysis to employ negative and
positive data. Consequently probability curves may
be drawn either from Left to Right, or Right to Left as
shown at the right in Figure 45.
Figure 45: Report Probability based on actual Data
Polarity, i.e., not absolute
26
Rev. A / June 2013
PGA-710B Autoanalysis System
General Voltage Generation Measurements
Voltage Generation analysis can be conducted on a variety of
objects and used to assessed operational procedures. Recording
data in the voltage generation mode is similar to recording and
analyzing body voltage. The major differences are the procedures
used to obtain voltage generation, and selecting generic Voltage
Analysis mode. One is limited only by their imagination in capitalizing on this feature. Illustrations include the following:
1. Personnel voltages while using a chair
2. Voltages generated by a rolling cart, or chair
3. Worksurface suppression analysis measurements
4. Voltages measured within equipment
VIII.
Figure 46: Use Voltage Analysis Formats
for General Measurements
Basics of Voltage Decay Analysis
Decay testing is typically employed for evaluating ionizing systems, packaging dissipation, and other technical control elements where decay time is a useful measurement or analysis tool. A separate set of analysis procedures and Session Wizard details may be used for voltage decay measurements. For detailed
information regarding Decay Testing, refer to the PGA-710B Autoanalysis How to Test Guideline.
Once a new file is opened, decay test data is recorded using the same chart controls described above for
recording voltage generation. Short Cut Keys are also used for this function:
Open the Editing Control Trim window and enter desired decay test parameters if not previously entered
through Session Wizard. In this illustration the decay test cycle time starts (resets) at ±1,000 volts and
ends (cutoof) at ± 10 volts, as shown in Figure 47.
Figure 47: Use Edit Window to Set Decay Parameters
Once the Decay Parameters are set, click Analyze to begin the decay analysis process. This will insert vertical start and stop time lines in the chart area indicating those test cycles that have the entered parameters, in this case ±1,000 to ±10 volts. If the cycle does not meet these parameters, no vertical start stop
time lines will be entered. Click Adjust then Release to complete the analysis. The horizontal voltage lines
at ±1,000 and ±10 volts will be inserted at this point in the process.
Rev. A / Juneanuary 2013
27
PGA-710B Autoanalysis System
Figure 48: Click Analyze to Process Decay Data
Figure 49: Use the Document Drop Down Menu or Report View Toggle Button to shift to Report View
To generate a written decay analysis report either open the Document drop down menu and select Report View or click on the Report View Toggle Button. Note that the Report View Toggle Button allows the
view to shift between Strip Chart View and the Report View.
In Report View one may select a full size chart that is produced in a landscape mode, or a detailed report
produced in the standard portrait mode.
The decay reports and charts may be generated in a standard format as shown in Figure 52, or in a unique
“assembled” format to compare each decay test cycle.
28
Rev. A / June 2013
PGA-710B Autoanalysis System
Assembled Decay Charts
In the “assembled” format, all decay cycles are compared to each
other regardless of how long it required generating the entire test
series.
In effect, the test set is “taken apart” by each test cycle and reassembled in sequence. The Positive cycles are compared to the
Negative cycles as shown in Figure 53. For example, the total decay time of all Positive cycles was slightly more than 4.8 seconds,
while the total of all Negative cycles is approximately 5.7 seconds.
Figure 50: Use Voltage Analysis Formats
for General Measurements
Figure 51: Page 1 of Standard Decay Report of Test Data
Decay testing may be adapted to assess a variety of dissipative materials and objects, including charge
movement across materials, chairs, perform personnel decay analysis, as well as assess ionization systems.
Rev. A / Juneanuary 2013
29
PGA-710B Autoanalysis System
Figure 52: A Full Size Landscape Chart in the “Assembled” Format
IX. Recording Test Data Without Computer Connection (Remote Testing)
The PGA-710B can be used as a freestanding data logger/recorder for later downloading data to a
computer for analysis. Before conducting remote measurements be sure to match the time stamp
of the PGA-710B with the computer you will use for data analysis, and erase all data presently in the
PGA-710B’s memory. Failure to follow these two procedures may result in “corrupt” data. To record a
remote test:
1. Connect PGA-710B Autoanalyzer to PFM-711A Field meter via the analog output cable and
complete test setup. Ground & Zero the Field meter before conducting measurements
2. Energize both instruments
3. Press the PGA-710B’s PAD #2 Start/Stop Recording to start recording, then commence the test
procedure. LED’s #2 (Green) & #3 (Yellow) will blink continuously while recording data.
4. After the test evolution is complete, press PAD #2 Start/Stop Recording to stop recording.
LED’s #2 (Green) & #3 (Yellow) will blink rapidly indicating recording is stopped and file is ready
to be Saved or Erased. Note: Excess data at ends of the test can be “trimmed” after computer
download.
5. Press PAD #3 Save File to retain the test file in the unit’s memory, LED’s #2 & #3 will stop blinking LED #3 will flash once to indicate the file is saved. Green LED #2 will revert to slow blinking
indicating the unit is ON and ready for further operations. Or,
6. Press PAD #4 Erase File(s) to discard the test data, i.e., do not save file to unit memory.
30
Rev. A / June 2013
PGA-710B Autoanalysis System
Note: Pressing and holding PAD #4 until LED’s 2, 3 & 4 Blink rapidly and alternately will erase all
files in memory.
7. The PGA-710B will identify each saved test file in sequence by date and time, which are displayed when files are selected for download to the computer.
The PGA-710B’s date and time is established when last connected to a computer and the unit time reset
as previously described. It would be prudent to make note of date, time and test information for later file
identification and information entry.
Download Test Data from Device
To transfer remotely captured tests to a computer use the following procedure:
1. Connect the PGA-710B Autoanalyzer to the computer and energize both instruments.
2. Start the PGA-710B Autoanalysis software and select Import
Figure 53: Select Import from Device from
3. From Device on the Start Screen as shown in Figure the Start
53.
4. Or, Open File drop down menu and select Import
from PGA-710B. (See Figure 54.)
5. Steps 2 - 4 will open the Import window. Click the Read
button to display all available files for download from
PGA-710B by Date and Time recorded. The highlighted
file will be previewed in the adjoining window as in Figure 55.
6. Highlight selected file(s) to be downloaded, then:
a. Check box(s) to confirm selection (Figure 56)
b. Press OK button
c. Selected file(s) will be downloaded to the computer
Figure 55: Open Import Window and Click
“Read” to Display Stored Files
Rev. A / Juneanuary 2013
Figure 54: Use the File Menu to Import
Data
Figure 56: Check the Box to Select Download
Files
31
PGA-710B Autoanalysis System
7. Downloaded Files will be displayed and indicated by Offload - # on their file tab ( See Figure 57)
a. Click name tab to select offloaded file to preview
b. Analyze and Save file(s) using new file names
Figure 57: Offloaded File from PGA-710B Autoanalyzer
X. Exporting & Importing Data to and from Excel® Spreadsheets
Data generated by the PGA-710B system may be exported to an Excel spreadsheet.
1. Open the File drop down menu and select Export.
2. File selection window will open allowing you to name or select the data Target file.
3. Once the Excel file is selected click Save and a new Excel file will be created containing all data
acquired by the PGA-710B system.
Data generated by other measurement systems may be imported into the Autoanalysis System Operating
software by way of an Excel spreadsheet. Once imported, the data can be easily analyzed by the PGA-710B
software and reports generated as though originally generated within the system. To import data from
and Excel sheet the time detail should be in a single column and correlate to the respective voltage data in
another column as discussed below.
32
Rev. A / June 2013
PGA-710B Autoanalysis System
To import data from an Excel sheet proceed as follows:
1. Select Import from the File drop down menu
2. File selection window will open allowing you to name and select the data source file. Highlight
the desired file and click Open
3. The source file and an Autoanalysis import window (Figure 58) will be opened and superimposed on the sheet. The Import From Excel Spreadsheet window allows designation of the
data to be imported for analysis by the PGA-710B program.
4. Select the Test Type from the drop down “Type” window (Figure 59). Once imported, the PGA710B Session Wizard will respond to the type designation.
Figure 58: Autoanalysis Excel Spreadsheet
Import Window
Figure 59: Test Type Window
5. The Date down arrow opens a calendar to designate the test date which will be “stamped” into
the Autoanalysis software.
6. Using the T[F] and Rh[%] entry panels temperature and relative humidity can be included with
the imported data.
7. To highlight and select data to be imported (Refer to Figure 60)
a. Highlight the first Time reference cell and simultaneously press <Shift> <Ctrl> and <↓>.
This will highlight all cells containing data in that column.
b. Click the Time Select Range button in the Import Window and the time data range will be
automatically entered.
c. Highlight the first Value reference cell and simultaneously press <Shift> <Ctrl> and <↓>.
This will highlight all cells containing data in that column.
d. Click the Voltage [V] Select Range button in the Import Window and the voltage value data
range will be automatically entered.
e. When both Time and Voltage data ranges have been properly entered, the Import button
will be activated. Pressing this button will import the selected data and immediately geneate a chart for analysis.
Rev. A / Juneanuary 2013
33
PGA-710B Autoanalysis System
Figure 60: Import Data from Excel Spreadsheet
Exporting Reports
The Export Report function allows a completed test report to be exported in other file formats, including
Acrobat (*.pdf), Microsoft Excel (*.xls), Microsoft Word (*.doc) and Text Rich Format (*.rtf) files.
1. One must be in the Report View with the designated report displayed before the Export Report
function may be used.
2. Select the Report View on the Document drop down menu, or click the Toggle Chart/Report
View.
3. Select the export report’s file format
4. Provide a target location (Folder and Drive) and new file name
5. Click Save to export the file to its target location
XI. Modifying XML Config File Defaults
Various chart color attributes can be accessed through the XML configuration file located in Program
Files, application program folder. Advanced users can modify this file in order to change some options.
Below you will find brief descriptions of some of these options.
Before modifying the configuration file, close the PGA-710B Autoanalysis System software.
34
Rev. A / June 2013
PGA-710B Autoanalysis System
1. Open the configuration file (AutoAnalysis.exe.config)
located in Program Files > Prostat Corporation >
Prostat Autoanalysis System
2. Locate the Global Setting or color scheme you wish
to modify, e.g,. BlackAndwhite, BlackBackground,
etc.
3. Within the scheme locate the attribute you wish to
change, e.g., Voltage, Humidity, Temperature, etc.
4. Identify the element, color or display you wish to
modify. The variable is between “x”
5. Save the AutoAnalysis.exe.config file
Figure 61: AutoAnalysis.exe.confg File
Open the Autoanalysis System software and confirm
the modification. The following are a few illustrations
Global settings
ShowStartScreen (valid values are “True” and “False”) – determines whether start screen appears each
time you start the application. In order to switch this option
off you can
1. Modify this entry to False or…
2. Uncheck Show start screen at startup check box
on the start screen (Figure 62) or…
3. In running application access View menu and uncheck Show Start Screen at Startup menu
Figure 62: Start Screen Options
ReportFolder – Determines subfolder where report definitions are stored. Unless you know what you are doing never
change this setting.
UsePrintAppearanceScheme (valid values are “True” and “False”) – enables you to use different appearance schemes for printing. This option is set to ON (True) by default. Appearance options are described
in next section. If this option is set to False (OFF), your printout will appear as seen on the screen (WYSIWYG).
Color Scheme Modifications
Five basic color schemes are available for display and printing. Current color schemes are:
Black and White
Decay Color Printer
Black Background
Voltage Color Printer
General Color Printer
The differences between each scheme are related to line, grid and background colors and scale displays
that may be useful for various measurements. Line and grid scale colors, temperature type and other defaults can be modified within a color scheme. Some illustrations follow.
Rev. A / Juneanuary 2013
35
PGA-710B Autoanalysis System
Colors: The changeable attribute is between quotation marks. Modify the color name between quotes,
e.g., “Gold” to “Lime”, then perform File, Save. Open the PGA-710B software and check to insure the default change was correct and effective.
Temperature: The temperature scale default is °C and will be displayed on the right of the strip chart view
when the Show Temperature box on the Left Panel is checked. The default within any scheme may be
modified using the following procedure and scale designations.
1. Open the configuration file (AutoAnalysis.exe.config)
See Figure 63
2. Locate the Global Setting or color scheme you wish
to modify, i.e. BlackAndwhite, BlackBackground, etc.
3. Locate TempAxesvisibility
4. Change the value =”x” as follows:
a. Celsius °C value = “1”
b. Fahrenheit °F value = “2”
c. Both °C & °F value = “3”
5. Save the AutoAnalysis.exe.config file
Figure 63: Modify Temperature Axis Scale
Open the AutoAnalysis System software and confirm configura- for each Scheme
tion changes and proper operation. If the file becomes damaged or inoperable, perform Remove Software, Autoanalysis System from your control panel, and reinstall
the software.
Appearance Schemes Settings
The Appearance scheme is a set of options that determine the appearance of a chart. Moreover, different
schema can be used to display charts on your computer screen and you can use others for printing unless
you set “UsePrintAppearanceScheme” described earlier to False. The Prostat Autoanalysis Applications
Software package is delivered with 5 predefined appearance schemes. They are all defined in the XML
config file described earlier.
DefaultAppearanceScheme – (valid values are the numbers defined in Available appearance schemes
section described later) – the appearance scheme that will be used to display your charts on computer
screen.
PrintAppearanceScheme – currently not used
PrintAppearanceScheme.General (valid values are the numbers defined in Available appearance schemes
section described later) – the appearance scheme used to generate charts on general reports.
PrintAppearanceScheme.Decay (valid values are the numbers defined in Available appearance schemes
section described later) – the appearance scheme used to generate charts on decay reports.
PrintAppearanceScheme.VoltageGen (valid values are the numbers defined in Available appearance
schemes section described later) – the appearance scheme used to generate charts on voltage generation
reports.
36
Rev. A / June 2013
PGA-710B Autoanalysis System
Available Appearance Schemes
Each entry in this section defines a name for an appearance scheme. The numbers next to AppearanceScheme key must be separated by a dot (for example AppearanceScheme.02). You can define as many
as 100 different appearance schemes (numbers from 00 to 99). The numbers must be consecutive. The
entries defined here appear in Print Options (Figure 64) and Appearance Options dialog boxes in the application software.
Figure 64: Print Options Dialog Box. Open in
Report View mode using File Drop Down Menu
Figure 65: Document Appearance, Chart Properties Window Allows Selection of Various Appearance Schemes
Scheme Settings
The names of the entries in scheme definition are self-explanatory. The important thing is that each entry
is preceded by scheme name. For example:
<add key=”BlackAndWhite.BackgroundColor” value=”White” />
defines background color (white in this case) in BlackAndWhite appearance scheme.
Rev. A / Juneanuary 2013
37
PGA-710B Autoanalysis System
XII.Warranty Information
Prostat® Warranty
Prostat Corporation expressly warrants that for a period of one (1) year from the date of purchase, that
Prostat instruments will be free from defects in material (parts) and workmanship (labor). If Prostat receives notice of such defect during the warranty period, Prostat will replace at its expense such parts that
it determines to be defective. Any defective part must be returned to Prostat postage prepaid with proof
of purchase date.
Warranty Exclusions – THE FOREGOING EXPRESS WARRANTY IS MADE IN LIEU OF ALL OTHER PRODUCT
WARRANTIES, EXPRESS AND IMPLIED, INCLUDING MERCHANTABILITY AND FITNESS FOR A PARTICULAR
PURPOSE, WHICH ARE SPECIFICALLY DISCLAIMED. The express warranty will not apply to defects or damage due to accidents, neglect, misuse, alterations, operator error, or failure to properly maintain, clean,
or repair products. Limit of Liability – in no event will PROSTAT or any seller be responsible or liable for
special, incidental, or consequential losses or damages, under any legal theory including but not limited to
contract, negligence, or strict liability.
Fulfillment by Prostat of its express warranty obligations described above will be purchaser’s exclusive
remedy and will be Prostat’s and seller’s limit of liability for any breach of warranty or otherwise.
38
Rev. A / June 2013
PGA-710B Autoanalysis System
PGA-710B Autoanalysis System Specifications
Size:
5.0 in (12.7 cm) L x 2.8 in (7.1 cm) W x 1.35 in (3.4 cm) H
Weight:
6.5 ounces (185 grams)
Input:
<±2 Volts
Output:
USB
Sampling Rate:
50, 100 and 200 Samples per second
File Size Limit:
≈1 to 15 minutes per file, continuous recording at 50 samples/sec
≈7 minutes at 100 samples/sec
3.5 minutes at 200 samples/sec
Battery Consumption Notes:
PGA-710B current flow with Main Power Switch ON:
1. During Sleep Mode (Main Power Battery Switch ON, unit OFF): 8 – 10mA. Unit in standby Panel
keypad is energized.
2. During Normal Operations: 108mA
Unit is operating in remote or computer mode
3. Computer USB Battery Charge: 100mA
Operating in computer mode and receiving 100ma current from USB port reduces battery drain rate
to 8ma.
4. Battery Charge from AC/DC Charger: 280mA
Charge battery with Main ON, OFF, or during operations,
Temperature & Relative Humidity Sensor: Temperature
Range
Accuracy
Response Time
-25 to + 85°C (-13°F to 185°F)
± 0.8°C (≈2°F)
6 ms in 20 I/min minimum air flow
Humidity
Operating Range Accuracy
0 – 100 percent (%)
±4.0% Rh, 0-100% non-condensing
PGA-710B Autoanalysis Application Software System Requirements
The following hardware and software is required to run the Autoanalysis Application Software.
• Microsoft® Windows® XP, Vista 32-bit/64-bit, Win7 32-bit/64-bit, Win8, Server 2003, Server 2008 or Server
20012.
• 1 GHz Processor
Rev. A / Juneanuary 2013
39
PGA-710B Autoanalysis System
• 512MB RAM
• Disk Space
32-bit: 850 MB
64-bit: 2 GB
• 800 x 600 or higher-resolution display with 256 colors
• Microsoft® DirectX 9b
• Instrument input limits to ± 2 volts
Note: Providing over ±2 volts to the PGA-710B Autoanalyzer will void the warranty. For appropriate adapters or
cables, please contact Prostat Corporation or your Prostat Authorized Reseller.
40
Rev. A / June 2013
PGA-710B Autoanalysis System
NOTES
Rev. A / Juneanuary 2013
41
PGA-710B Autoanalysis System
NOTES
42
Rev. A / June 2013
Specifications are subject to change without notice.
All Prostat trademarks and trade names are the property of Prostat Corporation.
All other trademarks and trade names are the property of their respective companies.
P R O F E S S I O N A L
S T A T I C
C O N T R O L
P R O D U C T S
Prostat Corporation
Corporate Headquarters • 1072 Tower Lane • Bensenville, IL 60106 • 630-238-8883 • Fax: 630-238-9717 • 1-855-STATIC1 • www.prostatcorp.com