1
MassMotion
Help Guide
13 Fitzroy Street
London
W1T 4BQ
Telephone: +44 (0) 20 7755 3302
Facsimile: +44 (0) 20 7755 3720
Central Square
Forth Street
Newcastle Upon Tyne
NE1 3PL
Telephone: +44 (0) 191 238 7559
Facsimile: +44 (0) 191 238 7555
e-mail: <%EMAIL_ADDRESS%>
Website: <%HOME_URL%>
© 2015 Oasys Software Limited
MassMotion
© 2015 Oasys Software Limited
All rights reserved. No parts of this work may be reproduced in any form or by any means - graphic, electronic, or
mechanical, including photocopying, recording, taping, or information storage and retrieval systems - without the
written permission of the publisher.
Products that are referred to in this document may be either trademarks and/or registered trademarks of the
respective owners. The publisher and the author make no claim to these trademarks.
While every precaution has been taken in the preparation of this document, the publisher and the author assume no
responsibility for errors or omissions, or for damages resulting from the use of information contained in this
document or from the use of programs and source code that may accompany it. In no event shall the publisher and
the author be liable for any loss of profit or any other commercial damage caused or alleged to have been caused
directly or indirectly by this document.
Printed: September 2015
MassMotion
Table of Contents
Part I Welcome to MassMotion
7
Part II What's New in 8
9
Part III User Guide
12
1 Installation
................................................................................................................................... 12
System Requirements
......................................................................................................................................................... 12
Licensing ......................................................................................................................................................... 12
MassMotion.........................................................................................................................................................
& Flow
13
2 How
...................................................................................................................................
MassMotion Works
14
The Scene ......................................................................................................................................................... 14
People as Agents
......................................................................................................................................................... 19
3 User
...................................................................................................................................
Interface Overview
24
Main Window
......................................................................................................................................................... 24
Objects
......................................................................................................................................................... 25
Selection ......................................................................................................................................................... 26
4 Project
...................................................................................................................................
Workflow
26
Authoring ......................................................................................................................................................... 26
Simulation ......................................................................................................................................................... 51
Analysis ......................................................................................................................................................... 52
5 Troubleshooting
................................................................................................................................... 53
Auditing ......................................................................................................................................................... 53
Validation ......................................................................................................................................................... 53
Observing Agents
......................................................................................................................................................... 54
Finding Object
.........................................................................................................................................................
References
54
Debugging a
.........................................................................................................................................................
Simulation
54
Using Analysis
.........................................................................................................................................................
to Diagnose Issues
55
Part IV Reference
57
1 Project
................................................................................................................................... 57
Project Settings
......................................................................................................................................................... 57
Merging Projects
......................................................................................................................................................... 58
Importing and
.........................................................................................................................................................
Exporting Objects
58
Files
......................................................................................................................................................... 59
Upgrading Older
.........................................................................................................................................................
Projects
59
2 User
...................................................................................................................................
Interface
61
Main Window
......................................................................................................................................................... 61
Editing Object
.........................................................................................................................................................
Properties
72
Choosing Objects
......................................................................................................................................................... 74
Working w ith
.........................................................................................................................................................
Colours
77
Working w ith
.........................................................................................................................................................
Time
79
Issue Window
......................................................................................................................................................... 81
Keyboard and
.........................................................................................................................................................
Mouse Controls
81
Application .........................................................................................................................................................
Preferences
83
3 Objects
................................................................................................................................... 84
4
© 2015 Oasys Software Limited
MassMotion
Scene Objects
......................................................................................................................................................... 84
Activity Objects
......................................................................................................................................................... 119
Analysis Objects
......................................................................................................................................................... 156
4 Simulation
................................................................................................................................... 196
Running a.........................................................................................................................................................
Simulation
196
Console Simulation
.........................................................................................................................................................
Window
198
Debug Simulation
.........................................................................................................................................................
Window
198
Running from
.........................................................................................................................................................
the Command Line
205
Generated.........................................................................................................................................................
Simulation Files
207
Randomness
......................................................................................................................................................... 208
5 Analysis
...................................................................................................................................
& Reporting
211
Agent Observer
......................................................................................................................................................... 211
Areas
......................................................................................................................................................... 212
Transition ......................................................................................................................................................... 212
LOS Colour
.........................................................................................................................................................
Mapping
214
Alembic Export
......................................................................................................................................................... 215
Agent Position
.........................................................................................................................................................
Export
216
Movie and.........................................................................................................................................................
Image Export
217
© 2015 Oasys Software Limited
5
Part I
MassMotion
1
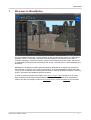
Welcome to MassMotion
The field of pedestrian planning is rapidly growing as design professionals respond to a world where
population density is increasing. This leads to greater emphasis on the efficiency and safety of
commercial buildings, performance venues, schools, transit facilities and public areas. The process
of understanding how people will move through and occupy a finished project is both challenging and
fascinating.
MassMotion is developed to enable design and planning professionals to rapidly test and analyse
the movement of people in many kinds of environments. To do this MassMotion provides users with
a suite of tools for creating and modifying 3D environments, defining operational scenarios, executing
dynamic simulations and developing powerful analyses.
A range of introductory videos are provided on the Oasys product page to enable users to quickly
begin modeling and simulating with MassMotion. To unlock the full potential of the MassMotion
toolset users are encouraged to review the User Guide and to consult the Reference as necessary.
© 2015 Oasys Software Limited
7
Part II
MassMotion
2
What's New in 8
Migrating from Softimage Workbench
MassMotion no longer requires Softimage. To open legacy emdl projects they must be exported to
mmxsi using the MassMotion 7 workbench. Some workbench objects will not be editable in
MassMotion 8, but can be manually converted to equivalent objects. See Upgrading Projects for
more information.
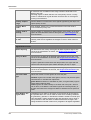
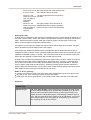
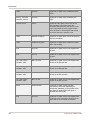
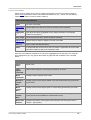
Actions
New interface for authoring agent actions and tests.
New agent tests: "Entered at" tests whether an agent entered the simulation via a portal, "Initial
goal" tests whether an agent was given a portal as an initial goal.
Right-click on an object and choose 'Find' to discover whether or not it is used in any actions.
Servers and Process Chains
New interface for authoring server objects.
New interface for connecting servers together into process chains directly through the 3d scene.
Timetables
New interface for authoring timetable objects.
General Events
New agent demand types: "Instant" creates all agents in a single burst, "Table" provides an
editable table of duration/population pairs (see journey).
New agent colouring: complex rules colour agents by origin/destination/profile/event (see journey).
New dwell rules for the circulate event allow for different wait times for each circulation portal.
Support for weighted collection of profiles to generate a range of population types from a single
event.
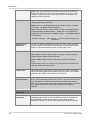
Analysis Objects
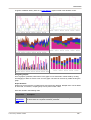
New region density graph: plots the average density within one or more regions over time.
New agent speed ratio graph: plots the number of agents in different speed ratio ranges over time.
New dynamic path map: shows dynamic agent trails with configurable length and opacity.
All maps can display an optional colour value legend.
Review when actions were applied by observing an agent during playback.
Analysis Filters
Improved editing through drag and drop copying and re-ordering of sub-components.
New "Has end state": filters agents by the manner in which they left the simulation (exited with
success, exited with error, still in scene at end of simulation).
Rendering
The playback of a simulation run can be exported to alembic animation files for rending in 3rd
party applications like Softimage or 3ds Max.
Create, import, or edit the static avatar objects used to represent agents.
Application Preferences
Set default values for the various movie/image export settings (available through "Edit" menu).
Full Release Notes
Added authoring of servers and process chains (hotkey 'q')
Added authoring of actions
Added authoring of timetables
Added authoring of action event
© 2015 Oasys Software Limited
9
MassMotion
Added birth actions to journey, circulate, vehicle, and evacuate events
Added birth action to profile
Added agent action tests 'Entered At' and 'Initial Goal'
Added ability to migrate SI workbench schedules and evacuation events to editable MassMotion
objects
Added authoring of agent avatars
Added actions field in agent observer window for viewing agent action history
Added ability to specify weighted collection of profiles in events
Added 'Instant' event demand type for creation of agents all in a single frame
Added 'Table of intervals' event demand type for complex arrival patterns
Added 'Color Scheme' option for colouring agents in events by entrance/exit
Added ability to specify dwell times per portal in circulate events
Added alembic export for rendering of simulation playback in other applications
Added new 'Has end state' agent filter for isolating error agents during playback/analysis
Added colour legends as overlay when displaying an analysis map
Added new region density analysis graph
Added improved editing of agent filters through copy/paste and drag/drop (re-order items by
dragging the 'handle' to the right of the filter)
Added orthogonal 'Side' camera viewpoint (can be rotated horizontally)
Added camera rotation snapping (hold shift to snap to the nearest 15 degree rotation)
Added application preferences (from 'Edit' menu) for default movie export settings
Added support for virtual paths
Added ability to rename objects directly from the main window using F2
Added opacity parameter to agent path map and modified its behaviour to take agent colour from
the source simulation run
Added dynamic path map for showing agent 'trails'
Added speed ratio graph for showing counts of agents with different actual/desired speed ratios
Added support for importing reference geometry as ramps (including auto-detection of IfcRamp
objects)
Added ability to create normalized graphs (stacked bars or areas that sum to 100% instead of an
absolute value).
Changed simulation run objects to point to database file rather than results folder
Improved 'Find' object context menus to provide more information
Improved options for circulation end conditions
Improved behaviour of mesh simplification
Improved performance when closing projects with thousands of objects.
Improved visibility of measuring tool points
Fixed bug where vehicle arrivals within 10 seconds of simulation start would not produce alighting
agents for that arrival.
Fixed saved views for orthogonal viewpoints (top-down, front, etc.)
Fixed agents losing their way when seeking servers on a virtual floor
Fixed audit false positives in objects with disabled properties
Fixed issue with playback agents not hiding when on hidden floors
Fixed inconsistencies in how multi run simulation run names were generated
Fixed resize behaviour of object choosers when widget resizes
Fixed false positive issue raised when DefaultProfile deleted
Fixed false positive error/warning in simulation console when overwriting old database file
Fixed issue where where importing from an old IFC file or one with invalid geometry could cause a
crash
Fixed issue where some types of agent filters did not work with agent density graphs
Fixed issue where server population graphs could not be toggled between combined series/series
per server
10
© 2015 Oasys Software Limited
Part III
MassMotion
3
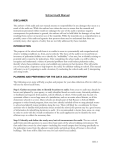
User Guide
The user guide provides a brief introduction to MassMotion. It describes some of the key concepts
and outlines basic project workflow. It is intended to be used in combination with the introductory
video tutorials available at http://www.oasys-software.com and the comprehensive Reference
section.
3.1
Installation
The most up to date version of MassMotion may be downloaded at http://www.oasys-software.com.
Once the download has completed users can double click on the .msi file to launch the installer.
Users should follow the on screen prompts, supplying information as necessary.
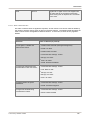
3.1.1
System Requirements
MassMotion is a high performance 64bit multi-threaded application that is capable of effectively
utilizing very high specification equipment. It is particularly important when running simulations that
have very high concurrent agent counts (25,000+) that CPU core counts are maximised for
processing speed and that solid state storage is provided for efficient database transactions. GPU
performance is important for highly detailed 3D environments and for 3D playback of high agent
count environments.
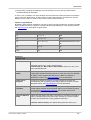
Recommended Minimum Specification:
Windows 64bit OS (Windows 7 & later)
8-core Intel or AMD workstation/server class CPU
16GB of RAM
OpenGL 4 workstation GPU from NVIDIA or AMD
500GB Solid State Hard Drive
2 1680x1050 display monitors
3-button mouse
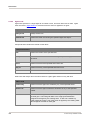
Minimum Specification:
Windows 64bit OS (Windows 7 & later)
Dual-core Intel or AMD workstation/server class CPU
4GB of RAM
OpenGL 3.0 compatible GPU
500GB Hard Drive
1280x1024 display monitor
3-button mouse
3.1.2
Licensing
MassMotion licensing can be per machine, networked, or site based. For information on how to
purchase MassMotion please visit http://www.oasys-software.com for sales information or to have a
member of the commercial team contact you.
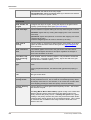
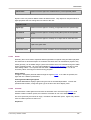
Standalone Licenses
Standalone licenses may only be installed on one computer at a time. Users may switch the license
from one machine to another by deactivating it on the current machine and then activating it on the
new one. This licensing scheme does not require an active internet connection to function, although
an internet connection is required for initial activation and transfer.
To activate or move your license see http://www.oasys-software.com/support/licensing.html for
details.
12
© 2015 Oasys Software Limited
MassMotion
Shared & Virtual Licenses
Shared licenses may utilized by any machine with MassMotion installed within an organization,
provided that the total number of concurrently active MassMotion users does not exceed the number
of shared licenses within an organization. It is also the required licensing option for virtual machines.
This “floating” license scheme is typical of CAD packages and other high-end technical software. It
requires an active internet connection to function.
To activate your license see http://www.oasys-software.com/support/licensing.html for details.
University Licenses
Site licenses are typically used by educational institutions and licensing is controlled by designated
IP address. Any machine that connects to the internet using the IP address will be granted a 60 day
license that will be automatically renewed each time MassMotion is launched while the machine is
connected to the internet through the designated network.
To activate your license see http://www.oasys-software.com/company/university_licensing.html for
details.
3.1.3
MassMotion & Flow
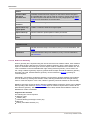
Oasys offers two crowd simulation products: MassMotion and Flow. The project files (.mm) and
results databases (.mmdb) from each version may be opened and used in the other. The two
versions are differentiated by the extent of the authoring and agent scheduling features available as
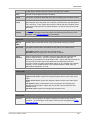
per the diagram below. While Flow can run simulations or analyse projects with actions, complex
events, and process modeling, only MassMotion can create or edit those components..
© 2015 Oasys Software Limited
13
MassMotion
3.2
How MassMotion Works
This section provides a brief introduction to some of the main concepts in MassMotion. The Scene
covers topics related to the simulation environment, then People as Agents describes the
representation of people.
3.2.1
The Scene
MassMotion models real world spaces by breaking those spaces down into component parts and
classifying the parts according to function. People in a MassMotion simulation know to walk around
an obstruction because it has been marked as a barrier. Speed of movement is reduced when
walking up a surface because that surface has been marked as a stair.
The way in which classified objects are arranged can have a large impact on how people navigate a
space, affecting their speed, their movement patterns, and their route choices.
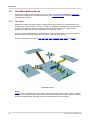
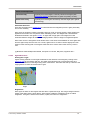
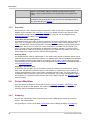
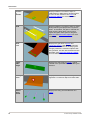
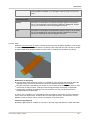
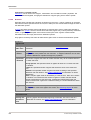
The basic elements of a scene are: floor, link, stair, ramp, escalator, path, portal, and barrier.
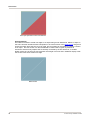
MassMotion Scene
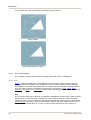
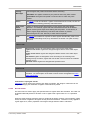
Floors
Floors are the most fundamental scene object. They represent the spaces (rooms, hallways, plazas,
sidewalks, train platforms) which define the program areas of a design. Each floor defines a separate
and distinct walkable area, with agent movement constrained by the floor boundary.
14
© 2015 Oasys Software Limited
MassMotion
Floor
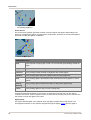
Connections Between Floors
People may only move between floors where they are connected by connection objects. Links
represent simple flat doorways or turnstiles. Stairs, ramps, and escalators connect floors at different
elevations. Paths connect floors at any elevation and restrict movement to single file. Connection
objects also act as decision points in the route network.
Link
Stair
Escalator
Path
Ram p
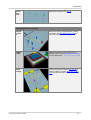
Entrances and Exits
Portals serve two main functions: they mark areas where people can enter the simulation and they
represent destinations to which people can be sent.
Portal
Obstructions
Barriers represent walls, columns, tables, benches, and anything else that can constrain movement
on a floor.
© 2015 Oasys Software Limited
15
MassMotion
Barrier
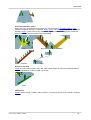
3.2.1.1
Connecting Objects Together
Each connection object (ie. link, stair, ramp, escalator or path) has a goal line at either end. Portals
have a single goal line. It is the goal line which connects an object to the underlying floor. Arrows on
either side of the goal line indicate the possible directions of travel over the connection. Goal lines
must be above the floor but not higher than 0.4m, with both ends at least 0.2m from the edge of the
floor. The "balls" and "boxes" at the ends of the goal lines are positioned with respect to these offset
requirements and may be used as guides when positioning connection object edges.
Box Disconnected
Ball and Box Connected
Portal Connected
16
© 2015 Oasys Software Limited
MassMotion
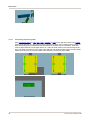
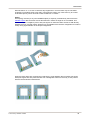
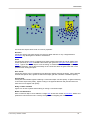
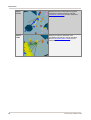
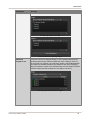
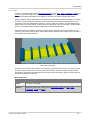
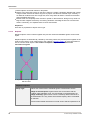
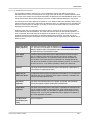
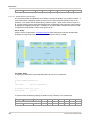
3.2.1.2
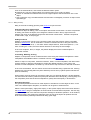
Determining Walkable Space
Walkable space on a floor, link, stair, ramp, or escalator is represented through surface maps. A
surface map is a 2D grid. Red values indicate areas not on the walkable object or blocked by an
obstacle. Black, white, or grey areas represent useable space. Surface maps are created
automatically for each object in the scene at the time of simulation. Understanding surface maps
can help with understanding how people in MassMotion navigate a space.
Surface maps can be exported as part of the simulation results (see Generated Simulation Files) or
viewed within a debug simulation (see Debug Simulation Window).
A sim ple room w ith one portal and tw o links
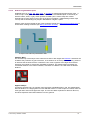
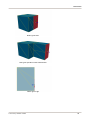
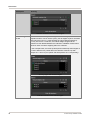
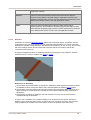
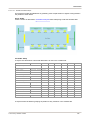
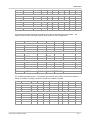
Obstacle Maps
The obstacle map of the simple room marks the location of floor edges and obstacles. Obstacles are
included if they intersect any part of the floor, or are within 0.4m of the top of the floor. Any portion of
an obstacle that is below the floor or above the 0.4m cutoff is ignored. Floor edges and included
obstacles are marked as red and are unavailable for walking. The shaded regions represent the
normalized distance to the nearest obstacle, with black as a distance of 0 and white the farthest
distance.
Obstacle m ap
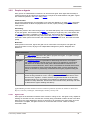
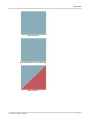
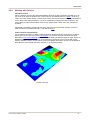
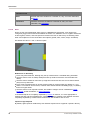
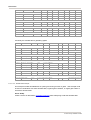
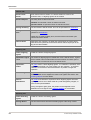
Approach Maps
As with the obstacle map, an approach map represents unavailable areas in red. The shaded areas
describe distance to a single goal line on the walkable surface. For the simple room above, there are
three goal lines and so three approach maps. In each case black represents a distance value of 0,
and white represents the furthest distance from the goal line.
© 2015 Oasys Software Limited
17
MassMotion
Link 1 approach
3.2.1.3
Link 2 approach
Portal approach
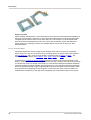
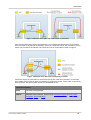
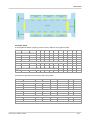
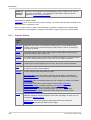
The Network
The arrangement of floors, connection objects (ie. links, stairs, ramps, escalators and paths) and
portals is termed the network. The network describes all possible routes available when navigating
the scene. In the diagram below, black circles represent nodes in the network. When a person is on
a node, the arrows leading from the node represent possible route options.
A sim ple scene. The black circles and lines represent nodes and routes through the netw ork.
3.2.1.4
Destinations
A destination is represented by a portal. People in the scene can be asked to seek out a particular
destination and will then use the network to determine the best available route.
Route options are constructed during simulation initialization. The tracing algorithm begins at the
destination portal and moves through all available connections, marking the shortest route to every
other object in the scene. This information is stored in the form of a cost tree. There is a separate
cost tree for each possible portal destination in the scene. The cost tree is then used by people
when navigating the network to assist them in finding the shortest route to a particular portal.
18
© 2015 Oasys Software Limited
MassMotion
3.2.2
People as Agents
Every person in a MassMotion simulation is an autonomous agent. Each agent has the ability to
monitor and react to its environment according to a unique set of characteristics and goals. Agents
are created and placed in the scene using events.
Characteristics
The physical characteristics and personality of an agent are defined by its agent profile. The profile
defines a distribution of values for properties such as size, speed, and any preference for various
route options.
Scheduling
Agents are placed in the scene through events. All events will specify one or more starting locations
for the new agents. Some events like the Journey will specify a single entry time, while others like
the Vehicle will specify a repeating cycle of entry times. Some events like the Journey will give a
single task (seek this portal than exit), while others like Evacuate will give a series of tasks to be
executed in order (wait for 20 seconds, then evacuate the train platform zone, then seek the street
portal).
Behaviour
When placed in the scene, agents are given one or more tasks to accomplish. The agent will
execute its tasks in order, relying on two independent intelligence systems: Navigation and
Movement.
Scene Interaction
Task
The task system determines the goals or purpose of an agent. An agent is always
attempting to execute its current task.
Navigatio
n
The navigation system is responsible for determining how best to accomplish a
task. When seeking a particular portal, the agent must evaluate its surroundings
and determine the best route to that portal. This determination is based on an
awareness of the environment, both in terms of the distances involved and a limited
sense of congestion at some of the near decision points. Once a route has been
chosen, that choice is periodically re-evaluated as the agent progresses along the
route.
Movemen
t
Once the agent has chosen where to go, its movement system guides the agent
across the floor towards its choice. This system relies on a modified version of the
Social Forces 1 algorithm. A series of forces are generated based on the direction
the agent wants to go, the location and movement of neighbouring agents, and the
position of nearby obstacles. These forces are summed at every time step and used
to determine the agent's heading and velocity.
[1] Dirk Helbing and Péter Molnár Social force model for pedestrian dynamics II. Institute of Theoretical
Physics, University of Stuttgart, 70550 Stuttgart, Germany, January 1995
3.2.2.1
Agent Tasks
Each agent in the simulation maintains a list of tasks or "things to do". The agent is only capable of
working on one task at a time, and the task currently being considered is said to be the active task.
Each frame, the agent determines what to do and how to do it based on the active task. Once the
active task is complete, the agent will move on to the next task in its list. Tasks are always
executed in order.
© 2015 Oasys Software Limited
19
MassMotion
Giving Agents New Tasks
Agents can be assigned new tasks using Actions. When an agent receives one or more tasks from
an action, those tasks are pushed in front of any currently active tasks and executed in order. The
agent will return to the deferred tasks when all of the new tasks have been completed.
Types of Tasks
For a complete list of available tasks, please see the task giving actions in Agent Actions. Typical
tasks include:
Moving to a portal destination.
Moving to and entering a process chain.
Evacuating a zone.
Waiting in an area for some duration.
Executing a sequence of sub tasks (in order).
Exiting the simulation.
3.2.2.2
Agent Navigation
Agent navigation makes use of the scene network, assessing route options and planning the best
path to a given destination. When choosing between a number of available routes, agents will
consider the network objects connected to the current floor, and select the object with the best route
cost. The chosen route is called the local target. The choice of target is periodically re-evaluated as
the situation on the floor changes. Once the agent has reached the target and transitioned onto a
new floor, the routes leading off of that floor are evaluated and the next local target selected.
Agents are only aware of route options off of their immediate floor. Any congestion or surprise
conditions on downstream floors are not factored into the local choice.
Costing Routes
A local target is chosen based on a comparison of the cost of each possible route off of the current
floor. A number of components are considered. Distance values are converted into time by dividing
by the agent speed. Component time values are then summed to produce a total cost for the route.
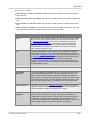
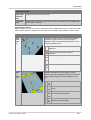
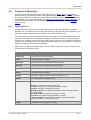
Route Cost Components
20
Downstream Horizontal
Distance
The shortest possible horizontal distance from the target to the goal.
Weighted Downstream
Vertical Displacement
The vertical displacement measured along the route that was traced
to measure the downstream horizontal distance. Components of the
vertical displacement are multiplied by a factor based on object type
(stair, escalator, ramp, etc.) [1].
Near Horizontal
Distance
The horizontal distance from the agent to the target.
Queue Time
The expected time it will take to queue for the target, calculated
using the number of people queuing in front of the agent and the
expected flow rate onto the target. Agents are only aware of queuing
for objects leading off of their current floor.
Opposing Flow
A penalty time based on the magnitude of the oncoming flow across
the target.
© 2015 Oasys Software Limited
MassMotion
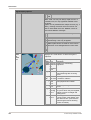
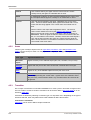
Route Cost Components
Closed Penalty
A penalty time if the target is currently closed to the agent (See
Connection Objects for information on gates and priority access).
Backtrack Penalty
A penalty time if the agent has already used the target (bias against
backtracking).
Stochastic Elements
There are two areas where randomness is introduced into the navigation process: agent personality
and choice variability.
Each agent is assigned a unique personality based on a set of costing weights. These weights are
applied to the various cost components when evaluating routes. The weights are calculated from
distributions defined in the agent's Profile. An agent with a high queue cost weight and a low
horizontal distance weight will tend to avoid large queues in favour of longer uncongested options.
Each route choice is assigned a small random factor. This factor will be different for each agent each
time the agent steps onto the floor. As a result, agents will on occasion choose slightly less than
optimal routes ensuring that not all agents make the same choice when routes are very close in
cost.
[1] Business Case Development Manual, Transport For London, May 2013, Appendix E 3.1
3.2.2.3
Agent Movement
Finding the Target
Agents moving towards a local target will determine the direction to that target by looking at the
approach map for the target's goal line. The agent extends feelers out in various directions and
measures the distance to the target along each of the feelers. The feeler that ends up closest to the
target goal line is taken as the direction to goal.
Agent aw areness of direction to
target.
Neighbours
Each agent is aware of other agents that are within a particular range. This range changes with the
speed of the agent and the local density. Other agents inside the awareness range are called
neighbours. An agent is aware of the location, speed, and size of its neighbours.
© 2015 Oasys Software Limited
21
MassMotion
Agent aw areness of
surrounding neighbours
Social Forces
The social forces algorithm generates a series of forces based on the agent's desired target, the
presence of neighbouring agents, and the location of obstacles. These forces are summed together
and used to modify the agent's acceleration.
Forces acting on agent
Component Forces
Goal
Force required to nudge agent so that it is at its desired speed heading towards its
target.
Neighbour
Repulsive force from each neighbour within range.
Cohesion
Force pushing towards centroid of neighbours with similar targets.
Collision
Force pushing agent away from collisions with oncoming neighbours.
Drift
Force pushing agent in bias direction when faced with oncoming agents in narrow
spaces.
Orderly
Queuing
Force pushing agents towards the middle of a target when approaching.
Corner
Force pushing agents to hug a corner or swing wide.
It should be noted that obstacles do not result in a repulsive force of their own, but are used to
constrain other forces. When component forces are summed, the resulting net force is reduced such
that it does not push the agent into a barrier.
Agent Speed
The agent's desired speed is the speed at which the agent will walk when on flat ground in an
uncongested environment. This speed is assigned through the agent's profile when the agent is
22
© 2015 Oasys Software Limited
MassMotion
created.
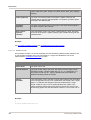
The actual speed of an agent at any given time depends on a number of additional factors.
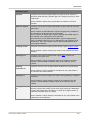
Factors Influencing Agent Speed
Density
In order to simulate the reduced stride length and reduced mobility of people in
crowded spaces, agent speed is reduced as density increases. The exact
relationship between speed and density has been tuned to match the data in John
Fruin's Pedestrian Planning & Design [1].
Object
Type
Escalator: Agent speed is set to exactly match the escalator speed property.
Floor or Link: Agent speed is not altered.
Path or Server: When immediately behind another agent, speed is reduced to match
the agent in front.
Ramp or Stair: Agent speed is modified based on whether travel is in the up or down
direction. See the object reference pages for more information.
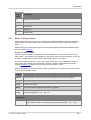
Object
Speed
Limit
Property
Objects have a property for capping agent speed. Any agent on the object with a
speed above the cutoff will have their speed reduced to the cutoff. Agents below the
cutoff are unaffected.
[1] Fruin, John J. Pedestrian Planning & Design, Revised Edition Chapt. 4, Elevator World, 1987
© 2015 Oasys Software Limited
23
MassMotion
3.3
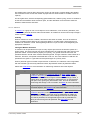
User Interface Overview
3.3.1
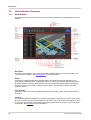
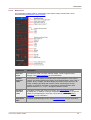
Main Window
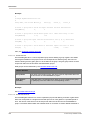
The following image enumerates some of the more important features in the MassMotion main user
interface.
Main Menu
The main menu duplicates much of the functionality available elsewhere in the user interface, but
consolidated in one place. See Main Menu Bar for more information.
Ribbon
The ribbon is a tabbed toolbar which provides buttons for performing high level operations. The
project tab provides buttons for managing the project, the scene and activities tabs provide buttons
for creating scene and activity related objects, and the analysis tab provides buttons for validating
the project, running a simulation, creating analysis objects, and exporting results to text files,
images or videos.
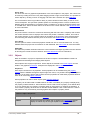
Layout Cluster
The buttons here can be used to collapse and expand the list view, scene views, model panel and
time panel.
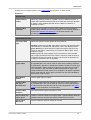
List View
The list view provides a mechanism for accessing the objects in the project by name or type. A filter
at the top controls the type of object displayed. The search bar can be used to find objects by name
or type. The capsule drawn beside each object displays information on the type, colour, and status
of the object. See List View for more information.
24
© 2015 Oasys Software Limited
MassMotion
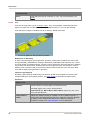
Scene View
The 3D scene view is a graphical representation of the scene objects in the project. The camera can
be moved by holding down the 'S' key while dragging the left or right mouse buttons. It is possible to
select objects by clicking on them or dragging over them with a selection box (see Selection).
The camera button at the top provides a variety of preset cameras and the ability to save or recall
custom viewpoints. The eye button provides options for controlling how the scene is rendered, from
different agent representations, to wireframe mode, to whether or not agents should be hidden when
on a hidden floor. The focus button will focus the view on the current selection. See 3D Scene View
for more information.
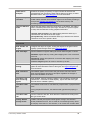
Model Panel
The panel contains a number of controls for interacting with the scene view. It displays and controls
the current selection mode. It displays and controls the position, translation, rotation, and scale of
the current selection. It also contains buttons for operating on the geometry of the selected object
and measuring the distance between points in the scene. See Model Panel for more information.
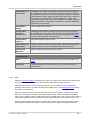
Time Panel
The time panel is used to control the playback of data from one or more simulation runs. It is only
available when the project has a simulation run with valid data. See Time Panel for more information.
Status Bar
The status bar provides information about the current selection and agent population and has buttons
for showing the console and issue windows. See Main Status Bar for more information,
3.3.2
Objects
Much of the data in a project is represented in the form of objects. The MassMotion interface is
designed around viewing and managing these objects.
Some objects have a physical presence. These objects are referred to as scene objects and are
visible in the graphical scene view. All objects are displayed in the list view.
Properties
Each object contains a list of properties. These properties can be modified using the property
window which is available through the object's right-click menu, or by double-clicking on the object in
the scene or list views. Objects which share common properties can have those properties edited in
batch all at once using object multi-edit.
Some properties can refer to other objects (See Choosing Objects).
A property can be either valid or invalid based on its value. The validity of a property is displayed by
the property indicator beside it. These indicators can be used to reset a property to its default value,
or to copy values from one property to another (either by right-clicking or dragging the indicator). In
some cases a property will be shown as valid but still fail validation. This occurs when the cause of
the problem is only uncovered by checking against other objects or property values.
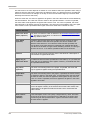
Common Object Properties
Selected
All objects can be selected.
Hidden
Objects that have been hidden will not appear in the scene view and will
display an outline only for the type capsule in the list view. All scene
© 2015 Oasys Software Limited
25
MassMotion
objects can be hidden. Hiding a collection will hide all of its member
objects. Hiding a map will remove any textures that it has applied in the
scene.
Disabled
3.3.3
Some objects can be disabled. A disabled object will not be included in
simulations and will be shown as grey in the scene and displayed with a
grey type capsule in the list view.
Selection
The selection is a list of objects or object components chosen by the user for a particular purpose.
Objects can be selected in the scene view, list view, or individual choosers. The selection mode,
which toggles between selecting objects, faces, edges, or vertices, can be changed through
keyboard shortcuts or buttons in the Model Panel.
Select Here, Selected Everywhere
The selection status of an object or object component is a property of the object and so visible in all
parts of the user interface. If an object is selected in the list view, it will show as selected in the
scene. This behaviour can be leveraged when choosing objects. If a dialog is presented which asks
for an object, but the user is unsure of the name of the object, the object can be selected in the
scene, and that choice will automatically be reflected in the dialog. Similarly, if a user is unsure
about which object a dialog is describing, that object can be selected in the dialog, then the scene
'focus' button can be used to view the selected object graphically.
Selection Mode
The default selection mode is 'Object|Agent'. In this mode, entire objects or playback agents can be
selected. The component selection modes are only available when one or more objects are selected.
The component selection modes allow for the selection of face, edge, or vertex components of the
selected object(s). The selection mode can be changed from the Model Panel in the Main Window or
using keyboard shortcuts.
Selecting in the Scene View
In the scene view, an object can be selected by clicking on it with the left mouse button. Holding
down CTRL will add each subsequent object to the selection. A selection box can be used by leftclicking and dragging the mouse. If the mouse is dragged from left to right, only those objects or
components which are entirely inside the box will be selected. If the mouse is dragged from right to
left, all objects or components which intersect with the box will be selected. See 3D Scene View for
more information.
3.4
Project Workflow
There are three main stages to working with a project: authoring, simulation, and analysis. The
evolution of a project is often iterative, with results from simulation or analysis leading back to
authoring changes and additional simulation runs.
3.4.1
Authoring
The process of authoring involves constructing the scene, establishing a network of connected
objects, and creating events.
The geometry for a scene can be either imported from other modeling packages or created from
26
© 2015 Oasys Software Limited
MassMotion
scratch. In both cases the geometry of the resulting objects can be edited to achieve the desired
form. The section on scene objects outlines recommended strategies for representing real world
objects and spaces. Finally, events are used to populate the scene with agents.
3.4.1.1
Working with Geometry
3.4.1.1.1 Importing Geometry
MassMotion can import geometry from a variety of formats: .3ds, .dae, .dxf, .fbx, .ifc, .obj.
Imported geometry is classified as Reference Geometry and grouped under a single Reference
Model collection. This collection allows the reference geometry to be scaled, rotated, translated, or
hidden as a group. Reference geometry itself cannot be edited and will not be included in any
simulation or analysis. Reference geometry can be imported through the 'Scene' tab of the
main window.
Reference geometry can be used through its right-click menu to generate a floor, link, stair, ramp,
escalator, barrier, or portal. Once used, the reference geometry is automatically marked as used
and hidden. There are two ways to convert reference geometry into a MassMotion object: 'Duplicate
as' and 'Use to Generate".
Creating MassMotion Objects
Duplicate as
Right-click on
a selection of
faces
Creates an object of the specified type, using duplicates of
the selected faces as its geometry.
Use to
Generate
Right-click on
reference
geometry or a
selection of
faces
Creates an object of the specified type. Examines the
reference geometry or selected faces and based on the
object type, uses a subset of the faces to generate new
representative geometry. When generating a floor, this might
involve taking only the top faces from the reference
geometry.
IFC based reference geometry contains additional contextual information about the function of the
object. When generating objects from IFC based reference geometry, the 'Auto' object type indicates
that MassMotion should choose a target object type based on the original IFC type. For example,
IfcSlabs and IfcSpaces might become floors, while an IfcDoor would become a link.
FBX files created with AutoCAD use a very old version of the file format and may not be read
correctly by MassMotion. To upgrade AutoCAD experted .fbx files it is recommended to use the FBX
2013.3 Converter which is available free of charge from Autodesk.
DXF 3D object support in MassMotion is currently limited to explicit mesh geometry definitions. DXF
files that represent geometry through ACIS definitions are not yet supported.
3.4.1.1.2 Creating Geometry
MassMotion objects can be created through the ribbon buttons at the top of the main window, or
through the right click menu in the 3d scene view. New standard objects come with a default
geometry which can then be edited to match requirements.
New geometry can be created from existing geometry. Select the desired face components, right-
© 2015 Oasys Software Limited
27
MassMotion
click on the selected faces, and choose the desired creation option:
Duplicate as: Copy the selected faces and combine them into a single new object.
Extract as: Remove the selected faces from the original objects and combine them into a new
object.
Use to generate: Copy the selected faces and use them to intelligently construct an object of the
specified type.
3.4.1.1.3 Editing Geometry
Many of the tools for editing geometry have shortcuts for quick access.
Selecting Objects or Components
To select an object for editing, click on the object with the left mouse button. To select components
for editing, first select the object, then change the selection mode in the top right of the main
window, then click on the desired components with the left mouse button. Possible components
include vertex, edge, or face/polygon.
Setting Positions
Objects or components can be set to a specific location using the 'Position' entries in the Main
Window's Model Panel. This is useful when a number of vertices need to be along the same line.
Select one vertex, note the X, Y, or Z value. Select multiple vertices, enter the required X, Y, or Z
value. If setting the Y value, all of the vertices will then be at exactly the same height.
In the case of objects, faces, or edges, the position displayed is of the combined object or
component centroid.
Translating, Rotating, Scaling
Objects or components can be moved around the scene using the transform manipulators. These
manipulators are available under the 'Transform' section of the Model Panel.
Select an object or component, select the transform, rotate, or scale manipulator, then either enter
numbers directly or drag the manipulator to achieve the desired transform. In the case of the
translate or rotate manipulator, the 'Shift' key can be held to snap movement to discrete increments.
In the case of translation, the axis arrows can be used to translate along a particular axis. Clicking
between two axes will drag within the plane defined by the two axis (a yellow square indicates the
plane of translation).
When scaling, the axis arrows can be used to scale only in a particular direction. Clicking between
two axes will scale uniformly within that plane (both directions will scale equally). Clicking away from
the manipulator (such that the entire manipulator is yellow) will scale equally in all directions.
Extruding (Growing)
The grow manipulator can be used on mesh objects to extrude one or more edges or faces. In the
case of line based objects like paths, end vertices can be grown to extend the line.
Select a vertex (line object), edge (mesh object), or face (mesh object) and use the 'Grow' button in
the Model Panel. The grow manipulator is shown similar to the translate manipulator. The first drag
will create a duplicate of the selected component and begin a translation operation. So for instance,
selecting an edge, then growing the edge away from the rest of the object will produce two new
faces connected the previously selected and newly grown edge.
28
© 2015 Oasys Software Limited
MassMotion
Before grow faces
After grow operation on the selected faces
Before grow edge
© 2015 Oasys Software Limited
29
MassMotion
After grow operation on the selected edge
Before grow vertex
After grow operation on the selected vertex
Splitting
Edges or faces can be split to provide additional edges or vertices for manipulation. Select one or
more faces or edges and use the 'Split' button in the Model Panel or component right-click menu.
30
© 2015 Oasys Software Limited
MassMotion
Before split edge
After split operation on the selected edge
Before split face
© 2015 Oasys Software Limited
31
MassMotion
After split operation on the selected face
Slicing (Knifing)
The knife tool is used to create new edges in an object along a user defined line. Select an object in
the scene and then enable the knife manipulator in the 'Tools' section of the Model Panel. Drag a line
across the object where the slice is to be made. The new edges can be useful for isolating a section
of an object. The new section can then be deleted to create a hole or grown to produce an
extrusions. Note that only objects that are actually contacted by the line will be cut; in shaded
display mode, the cut line must touch at least one triangle of a mesh and in wireframe display mode
the cut line most touch at least one edge.
Before knife
32
© 2015 Oasys Software Limited
MassMotion
After tw o horizontal knife operations on the object.
Deleting
Select an object or component and use the delete button in the Model Panel to delete the selection.
Before delete face
After deletion of selected face
Simplifying
If an object has been sliced, split, or grown many times, there can sometimes be an excess of
faces. Use the 'Simplify' command in the Model Panel or object right-click menu to reduce the object
© 2015 Oasys Software Limited
33
MassMotion
to its simplest form. The overall shape of the object will not be altered.
Before sim plify
After sim plify operation on object
3.4.1.2
Scene Development
The contained sections detail strategies for modeling real world objects in MassMotion.
3.4.1.2.1 Floors
Floors are the basic building block of MassMotion scenes and getting them right is important to
developing effective simulations. They represent the spaces (rooms, hallways, plazas, sidewalks,
train platforms) which define the program areas of a design. Each floor defines a separate walkable
area, with agent movement constrained to the boundary of a single floor. Links, ramps, stairs,
escalators, and paths act as connections between floors enabling agents to transition from one floor
to another.
Size
The size of floor objects is not explicitly constrained in MassMotion but there are a number of factors
that should be accounted for when considering how big to make a single floor. During simulation
runtime there are a number of data structures that are automatically constructed which describe the
walkable space of the object. The size of these data structures is directly related to the size of the
object's geometrical bounding box so a 2m x 2m floor requires four times as much memory to
34
© 2015 Oasys Software Limited
MassMotion
describe than a 1m x 1m floor. If there are very large floors in a scene there may be noticeable
increases in simulation setup times and in some extreme cases may cause memory to exceed
local RAM capacity which can lead to slow simulations or crashes.
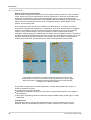
Shape
The topology of floors (or any other walkable object) is explicitly constrained by the fact that the
walkable space data structures are two dimensional in nature as height is not considered. This
means that (from a navigation point of view) the agents on the floors below are free to walk directly
between the entry and exit portals. While this is acceptable for the flat floor configuration it results in
clearly wrong agent behavior in the sloped configuration.
When the floors above are corrected such that there is a gap between the two portals (as shown
below) the agents are then presented with one unambiguous route from the entry to exit portal in
both the flat and sloped configurations.
© 2015 Oasys Software Limited
35
MassMotion
Slopes on Floors
Agents walking unobstructed on a floor will always move at the same horizontal speed regardless of
the slope of the geometry under them. In the images above the agents on both the flat and sloped
configurations will take the same time to reach the exit. For this reason it is recommended that
floors be constructed with geometry that is as close to flat as possible. Agents will adjust their
vertical position by tracking top surface of a walkable object, but this has no impact on their
horizontal speed.
3.4.1.2.2 Connection Objects
Connection objects are used to provide access between pairs of floors in the form of doorways,
stairs, ramps, etc. They act as decision points, providing options for agents during route selection
(see The Network). They can be used as statistic collection points for graphs or tables. The
available connection objects are escalators, links, paths, ramps and stairs.
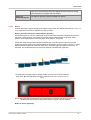
As described in Connecting Objects Together there are a number of geometric limitations on link
objects. As shown below links must overlap the floors that they connect to but care should be taken
to minimize the amount of overlap to the minimum. In the left hand example the overlaps have been
minimized enabling a smooth approach flow through the lnk. In the right hand example the overlaps
are far too generous leading to agents approaching the goal line from both the front and back sides
of the goal line and interrupting the flow of agents. In both cases the same number of agents are
created and the inefficiency of the right hand configuration has a noticeable impact on the results.
36
© 2015 Oasys Software Limited
MassMotion
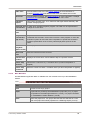
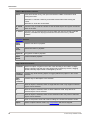
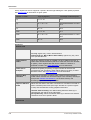
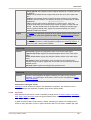
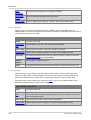
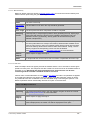
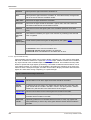
All connection objects share a set of common properties:
Direction
Connection objects may allow agents to enter from either direction or only a single direction.
Escalators only allow agents to travel in one direction.
Gates
All connection objects can be configured to be gated. Gated connections do not let agents enter
unless opened by an event. Available events which open gates are open gate events and vehicle
events. Agents will use the object's "Cost of waiting" to determine how a closed gate will impact
their route selection. Agents that are already on the connection when the gate closes will not be
prevented from exiting the object.
Flow Limits
Connection objects can be configured to limit the flow of agents entering the object. When demand
exceeds the specific limit, agents are held at the object goal line until there is available capacity.
Priority Flow
Priority flow sets whether agents traversing a connection object can have priority. If agents traversing
a connection object have priority, agents moving in the opposite direction will yield and wait until
there are no more agents with priority.
Delay on Enter and Exit
Agents can be set to pause while entering or exiting a connection object.
Banks and Perimeters
Each connection object can be added to a single bank and/or and number of perimeters. Banks and
perimeters control how the link is used by the agent when navigating the network.
© 2015 Oasys Software Limited
37
MassMotion
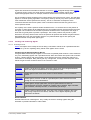
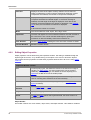
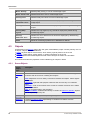
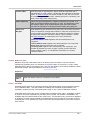
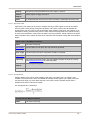
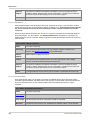
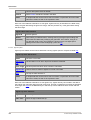
3.4.1.2.3 Complex Spaces
Determining when to split up floors
When a person navigates the network, they are constantly choosing a path from a set of possible
routes. These routes can be represented as a series of goal lines. It describes all possible routes
through the scene with each scene object representing a node or choice point along the route.
Agents are continuously evaluating the cost of available nodes when determining the optimal route to
a goal. Costs are calculated from factors such as horizontal distance, vertical distance, local
queuing, and oncoming traffic.
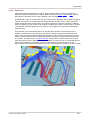
In the image below, the same layout is modeled in two different ways. On the left, two narrow
channels are created by placing barriers on a single floor. There is no network and so no navigation
required. The navigation system will choose the portal as destination and rely on the movement
system to carry it across the floor. The agent movement system is aware of the resulting
congestion, keeping agents from colliding with one another, but the navigation system is unaware so
all agents will take the shortest path to the portal. On the right, the single floor has been split in two
with links representing the narrow channels. The navigation system is aware of congestion as it
builds up around each link, and will factor that in when choosing between the two routes.
Left: Agents are not aw are of congestion at the left opening as it occurs in the
m iddle of the floor and are not even aw are of the right channel as an option. Right:
Agents are aw are of congestion at the left link and can choose to take the right,
resulting in m ore balanced loading.
This process of splitting floors to ensure agents fully consider route implications is useful in a
number of situations including:
narrowing due to barriers (as above)
bifurcation of routes due to a barrier or void in a floor (as with stairs/escalators in the middle of
train platforms)
heavy flows compressing around an obstruction despite available space (as with jogs in corridor
alignments)
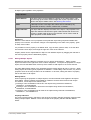
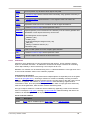
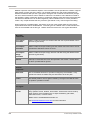
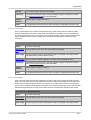
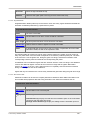
Considerations
While splitting floors up and introducing additional links to enhance network choice can be
beneficial, there are counterbalancing factors to consider. Agents are only able to perceive
38
© 2015 Oasys Software Limited
MassMotion
congestion associated with links that are connected to their current floor. In the image below it can
be seen that agents will continue to select the nearest route despite the fact that the narrow link in
the connecting corridor has become congested and the alternate route has become more efficient.
This is by design as in most real world cases people are not able to see downstream congestion but
this should be considered when deciding when and where to split up complex spaces.
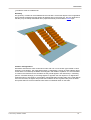
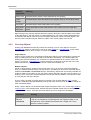
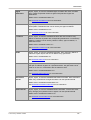
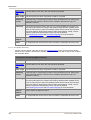
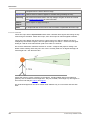
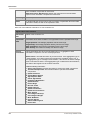
3.4.1.2.4 Turnstiles
MassMotion is used extensively for analyzing transit stations, and the modelling of turnstile
geometry and related agent behaviour is a common requirement. There are a number of factors
which should be considered when modelling turnstiles.
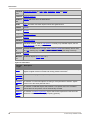
Geometry
The geometry of the turnstiles will be similar to Doors. In order to achieve the desired flow rates
across the links, consider the following steps:
1. Determine the centre to centre dimension of the real world turnstiles and use that for the width of
the link.
2. Make the width of the separating barrier geometry as narrow as is practically possible.
3. At the end conditions, extend the width of the barrier geometry to prevent agents from ending up
beside their target links.
© 2015 Oasys Software Limited
39
MassMotion
A set of 0.68m w ide turnstiles w ith barriers 0.1m w ide
Object Properties
If the turnstiles are to be used in one direction only, set that direction in the link property window. If
the turnstiles are to be bidirectional, enable priority access and set the priority direction to
bidirectional. In this case it is recommended that priority 'move aside' be turned off so that agents do
not move to block one turnstile when waiting for access to another.
The limit flow property can be used to ensure the processing rate does not exceed operational
expectations. An additional delay on exit can be used to simulate the brief pause from dealing with
fares or navigating the turnstile. Delay on exit is recommended over delay on enter so that paused
agents do not interfere with the limit flow control over inbound flow rates.
If the turnstile widths are exceptionally narrow (less than 0.6m) or if the turnstile is not aligned with
the scene axes, it may be necessary to also do the following:
1. For each turnstile object, set the traversal type property (on the agent behaviour tab of the link's
property window) to ignore barriers. This will free up space for the agents along the edges of the
link surface.
2. For each floor on either side, set the physical map resolution to 0.05m or even 0.02m. This will
enhance the resolution of the edge/barrier condition on the approach to the turnstile channels and
provide more effective width within the approach channel.
Banks of Turnstiles
Turnstiles are often positioned in groups bridging the same two floors. To ensure that agents use all
available turnstiles and consider all turnstiles equally, links in the same direction should be banked.
Please see Banks for more information.
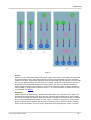
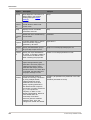
3.4.1.2.5 Stairs and Escalators
Stairs, ramps, and escalators (vertical circulation elements or VCEs) are link objects that connect
floors of different heights using a sloped vertical transition. They have much the same best practice
guidelines that are described in the Doors guide to simple links and in the Connecting Objects
Together section. The are however, a number of distinguishing differences:
The slope of VCEs must be between 0 and 50 degrees from level. Steeper slopes may result in
agents being unable to track the surface during simulation
On stair agents will reduce their horizontal speed proportional to the degree of the slope
On ramps agents traveling upwards will reduce their horizontal speed proportional to the degree of
the upward slope. Agents traveling downwards will ignore ramp slope and not reduce their speed
On escalators, agents will travel at the rate specified in the Escalator Average Speed parameter of
the object's property page
40
© 2015 Oasys Software Limited
MassMotion
Escalators must be unidirectional
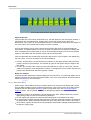
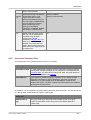
Geometry
The geometry of VCEs can be as detailed as the user likes. All the stair objects in the image below
are functionally equivalent and the agents will traverse them in the same way. The only restriction is
that they may not overlap themselves when projected vertically as described in Floors topic.
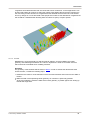
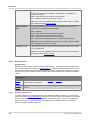
Common Configurations
Escalators and stairs are often constructed in sets with one or more of each type located in close
proximity to one another. The image below shows a configuration common in transit stations where
a stair and a set of down/up escalators are arranged in the middle of a platform. It is recommended
to construct the banisters for the escalators as they would appear in the real world (i.e. extending
past the escalator landings) to encourage agents to approach the VCE objects in an aligned and
organized manner. This leads to more realistic queuing behaviour and flow rates on the VCE objects.
As in the real world, the agents will perceive the escalators to have a greater utility than the stairs
and queues will form for the escalators before there is substantial traffic on the stairs.
© 2015 Oasys Software Limited
41
MassMotion
Escalators
To ensure that the escalators are able to process pedestrians at the expected rate, it is important to
follow these guidelines:
Ensure the geometry is well formed as described above.
The modeled width of a 1m (double channel) escalator should be the width between the handrails
(e.g., 1.2m) as this accounts for the total diameter of a person which is required to achieve
"doubling up" of agents on MassMotion escalators
Escalator speed should be set appropriately for the expected flow rate
Traversal type should be set to the default (for VCEs) "Ignore Barriers"
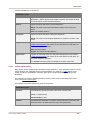
Banks of Vertical Circulation Elements
When multiple stairs, escalators, or ramps are positioned beside one another, have the same
directionality, and bridge the same two floors, they should be banked to ensure agents make use of
all available elements. In Figure 2, the two escalators are in opposite directions, while the stair is
bidirectional. Because an object can only be part of one bank, it is not possible to bank the stair
with both escalators. A single bank should be created for the stair and whichever escalator is likely
to see the most traffic during the simulation. Please see Banks for more information.
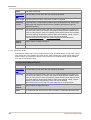
3.4.1.2.6 Sw itchback Stairs
Switchback stairs such as those commonly found in the evacuation cores of buildings present a set
of unique challenges. These stairs are generally narrow, with constrained landing areas where
agents must make abrupt changes in direction.
Geometry
If flow rates on switchback stairs are not at the desired level, angle the ends of the stair landings to
help guide agents in a smooth transition from one stair to the other.
42
© 2015 Oasys Software Limited
MassMotion
Initial sw itchback stair landing
Modified sw itchback stair landing
Note that if goal lines are placed at too great an angle to one another, the outside corners of the
landings will present such acute angles that agents can have trouble squeezing onto the landings
along the outside edges. Moderate angles like those demonstrated above are recommended.
Properties
Given a demand at or below level of service D, switchback stairs process agents at a rate roughly
equal to similarly sized straight stairs. For level of service E or F, there can be a 10% drop in
processing rates despite the geometric adjustments described above. To achieve the same rates as
straight stairs even in high density situations, set the switchback stair property for agent body radius
to a value of 0.2m.
3.4.1.2.7 Ladders
A ladder can be modelled using a path.
Geometry
Ensure that the final line segments on either end of the path are flat.
© 2015 Oasys Software Limited
43
MassMotion
A ladder m odelled using a path.
Properties
If the ladder is only to be used in one direction, set the path to the desired direction. If two-way travel
is required, enable priority access. If there is a clear priority direction, set the priority direction
appropriately and ensure that the option 'Primary will yield' is checked so that agents will only use
the path in one direction at a time.
3.4.1.2.8 Elevators
There is no built in object type for elevators, but elevators can be approximated using a combination
of gated links, floors, and paths. Note that elevator approximations will not model true car capacity
or proper car timing, but will rely on controlled flow and set door opening times.
An elevator can be m odelled using a com bination of
floors, gated links, a path, and a gate event.
Floors, Links, and Path
Create a small floor for each level at which the elevator will stop. Connect these elevator floors to
their levels with gated links. Connect each elevator floor to the floors above and below using a path.
The paths will allow agents to travel between levels while the gated links will control access to the
elevator, opening when the elevator is at a particular floor. Create a separate gate event to control
each elevator link.
Properties
Ensure the path directionality is set to bidirectional.
44
© 2015 Oasys Software Limited
MassMotion
The elevator links must be gated. Set priority access to give priority to agents leaving the elevator.
Use controlled access to limit the number of people that can enter the link to simulate a fixed car
capacity.
For each gate event, add the corresponding gated elevator link, enable cycling, set the on duration to
be the time the elevators doors will remain open, and the off duration to be the time it takes the
elevator to leave the floor and return.
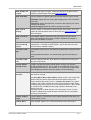
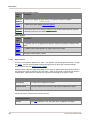
3.4.1.2.9 Collections
A collection is a group of one or more objects. Some collections, such as banks, perimeters, and
zones, have a particular function within the simulation. All collections can be used to help manage a
scene or perform analysis.
Visibility
When a collection is shown or hidden, all members are shown or hidden. This can be useful for
quickly controlling which elements of a scene are visible. In an office tower, there might be one
collection for each floor or level. Showing/hiding levels then is just a matter of showing/hiding the
appropriate collections.
Intelligent Member Selection
A collection can be specified as an input to many objects (for instance the entrance portals in a
journey event). The object will pull only those members from the collection that make sense in the
particular context. For the entrance property of a journey, only portals would be used from the
specified collection and all other members would be ignored. A single collection could contain all of
the floors, door links, and portals associated with a train car. The same collection could then be
specified for the gates in a gate event and the portal origins in a journey event.
When a particular type of member is expected from a collection, the collection name is appended
with that member type name: MyCollection.Portals, MyCollection.Areas, MyCollection.Gates.
Please see Collections for more information on referencing collections from other objects.
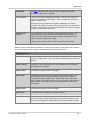
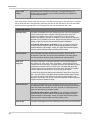
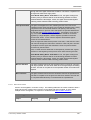
Collection Type
Bank
A bank is a collection of connection objects (ie. links, stairs, ramps,
escalators and paths) that bridge the same two floors and are spatially
close to one another. When an agent chooses a route through a bank, it
selects which of the bank members to take based only on near distance
and queue cost, ignoring any downstream costs. This can be useful for
maximizing flow through a set of turnstiles. See Bank for more information.
Collection
A general purpose collection with no special purpose beyond the grouping
of member objects. See Collection for more information.
Perimeter
A perimeter is a collection of connection objects (ie. links, stairs, ramps,
escalators and paths) marking a boundary around a special area. Routes
that cross this boundary more than once are disallowed. By adding all
turnstile links to a perimeter, routes leading into and out of the fair paid
area will be permitted, but through-traffic agents will be prevented from
taking shortcut through the fair paid area. See Perimeter for more
information.
© 2015 Oasys Software Limited
45
MassMotion
Zone
A zone is a collection of floors, links, stairs, ramps, escalators, or paths.
Zones are used primarily for evacuations where agents inside a zone can
be instructed to prioritize leaving the zone before heading to any other
destination. This is useful in scenarios where agents evacuating a subway
station must first evacuate the platform before worrying about evacuating
the station. See Zone for more information.
3.4.1.2.10 Ticket Desks
The definition of ticket desks or similar processes is a common task in MassMotion. Pictured below
is a standard multi-fare airline-style ticketing/check-in configuration:
Ticketing Layout
Ticketing layouts are constructed using servers that are chained together to represent the flow of
people from one process component to the next. In the above configuration there are two
accumulator queues for business and economy passengers which feed into 4 service positions. The
two accumulator queue entrance points should be connected together such that agents can be sent
to a single dispatch entry point for the entire process chain.
It is good practice to setup barriers around the queues (as in the real world) to ensure that circulating
people don't try to pass through the queuing areas.
Properties
46
© 2015 Oasys Software Limited
MassMotion
Agents are assumed to have either a business or economy token assigned through earlier actions.
To manage access control, the server objects representing the accumulator queues are set to
require the appropriate token, for example, business tokens for the business class queue.
The accumulator queues should be set to infinite capacity and contact times of zero. This will allow
agents to continue queuing regardless of occupancy and they will only stop at the queue exit points
if the downstream service positions are all busy. This is an automatic consequence of the
connection between both the exit points of the accumulator servers and the entry points to the
service position servers.
The capacity of the service position servers should be set to 1 to ensure that once the position is
occupied, no other agents will be released from the accumulator queues until the position becomes
free again. The contact time for the service positions should be set to correspond to the range of
times that it typically take to process a passenger. The service positions may be set to prefer
business or economy tokens which means the position will prioritize the release of agents with the
designated token from the accumulator queues. If no preferred token agents are queuing the
positions will then accept other agent types.
3.4.1.3
Creating and Controling Agents
3.4.1.3.1 Scheduling & Events
Events are objects which modify the scene during a simulation. Events fire at a specified start time
but may be cyclical or repeating. Many events insert agents into the scene.
Creating Agents Using Scheduling Events
All agent related events will place agents in the scene at specified portal locations. Some events fire
only once, distributing agents over a specified interval, while other events will repeat a set of number
of times, creating agents over each iteration. Once placed in the scene, agents are given one or
more tasks to accomplish. Many events give only a single task, usually to seek one portal. Some
events will give a series of tasks that are to be executed in order.
Events that Create Agents
Journey
Create a single burst of agents, each with a single origin and a single destination,
where the origins and destinations are assigned from a set.
Circulate
Create agents which move some number of times between a set of "circulation"
portals.
Evacuate
Create agents, tell them to wait for a specified period, then evacuate the scene
through one of a set of destinations.
Timetabl
e
Create agents, assign agent tasks, and open gates based on a series of
coordinated text input files. Suitable for modeling train schedules, flight schedules,
bus schedules, university lectures, or intersection gate timings.
Vehicle
Create a series of vehicle arrivals, each with a set of agents created in the scene
and moving to depart on the vehicle, and with a set of agents departing into the
scene from the vehicle.
General Events
General events do not create agents. They modify the scene or existing agents during the
simulation or provide information to other events.
© 2015 Oasys Software Limited
47
MassMotion
General Events
Execute
Action
Applies an action to agents at a specified time.
Open
Gate
Opens connection objects which have been configured as gates.
Referenc
e Time
This virtual event does nothing to the scene, but can be used by the reference times
of other events to refer to a common time.
3.4.1.3.2 Process Chains
A process chain provides a mechanism for modeling the progression of agents through a series of
capacity constrained stations or servers. Agents can be distributed evenly across a number of
servers, wait in single file for their turn at each server, be held for a specified period of time by the
server, then be released when downstream servers have the available capacity to receive the agents.
Process chains are ideal for designing security, ticketing, or other processes which are evaluated on
their throughput efficiency and wait times.
Definition
A process chain is a series of one or more servers connected together and has one or more start
points (green circles) through which agents may enter the chain, and one or more end points (blue
circles) where agents are released from the chain. The most basic process chain (shown in Figure 11) consists of a single server with one start point and one end point.
The most simple compound process chain (shown in Figure 1-2) consists of two servers connected
together, with a single start point, a single end point, and a single internal connection. Agents
following the internal connection from one server to another will only proceed to the connected server
when it has the available capacity. If there is no available capacity, agents will wait at the upstream
processor, potentially blocking other agents from accessing the upstream processor.
48
© 2015 Oasys Software Limited
MassMotion
Figure 1
Servers
Servers form the core building blocks of a process chain. Each server is composed of an input buffer
line (green triangle at entry point and purple path geometry) and a terminating process node (blue
square at exit point). Agents walk and queue along the input buffer until they reach the process node
and will only leave the server once processing is complete. The amount of time taken to process a
single agent can be specified through the server properties. The server can also limit access to
specific agents based on token possession, and limit the maximum number of agents permitted in
the input buffer. A single server is shown in Figure 1-1. For more information on server construction
and properties, see Servers.
Dispatches
Dispatch objects are automatically created when server objects are connected to each other. The
dispatches are represented by pink discs with pink connector lines indicating which server objects
are connected through the dispatch. Within the context of a dispatch, upstream servers are referred
to as sources and downstream servers as sinks. Figure 1-3 shows how server entry points can be
grouped together using a dispatch and also how successive groups of server exit points and entry
points can be connected in a many-to-many configuration via a single dispatch. Figure 1-4 shows
© 2015 Oasys Software Limited
49
MassMotion
how multiple levels of servers may be connected using many servers and dispatches to define
complex operations. The dispatch objects control the distribution pattern of agents (random or
shortest queue) from sources to sinks. For more information on dispatch properties please see
Dispatches.
Creating Process Chains
Creating process chains is done by entering the "Process Chain Edit" mode. This can be done by
either clicking on the
icon in Model Panel on the right hand side of the main window or by using
the hot-key "Q". In edit mode, all server start and end points and all dispatches in the model will be
outlined in yellow circles. These yellow circles may be connected together by selecting the circles
and clicking the
Connect icon in the Model Panel. Dispatches will automatically be created
between server start and end points as needed. To disconnect process elements from a process
chain, click the
Disconnect icon in the Model Panel. Connecting and disconnecting process
chain elements may also by done by right clicking the selected 3D objects and selecting the
appropriate item in the pop-up menu. To exit "Process Chains Edit" mode click on the
icon in
Model Panel on the right hand side of the main window or press the hot-key "Q". For a detailed walk
through of creating process chains, please watch this tutorial video.
Sending Agents to Process Chains
Process chain entry points (server or dispatch) are identified by green circles. Agents can be
directed to a single entry point using the "Task: Seek process start" action. Once an agent is
tasked with seeking a process chain entry it will navigate the scene using the standard route choice
algorithms until it reaches the floor with the process chain, at which point it will attempt to enter and
follow the chain.
If the entrances to servers in the chain are left unconnected, separate actions are required to
explicitly send agents to the individual entry servers. If the servers are connected by a single entry
dispatch, all agents can be sent to that single dispatch, and then the dispatch will distribute agents
across the connected servers. For example, in Figure 1-4 there are three start point entries into the
process chain (two servers and one dispatch). Agents can be explicitly directed to any of the three
using actions. However, those agents that are directed to the third start point will be evenly
distributed across the third and fourth server.
Movement Within a Process Chain
Agents that enter a server cease to navigate via the normal crowd movement algorithms and will
instead advance along the input buffer in a strictly ordered fashion. When in transit between two
internal servers, agents will employ normal crowd movement behavior, attempting to avoid obstacles
and each other, but will not engage in any route selection or wayfinding. For this reason all servers in
a process chain must be located on the same floor.
Measuring Counts and Times in a Process Chain
Please see Analysis Objects for information on the various metrics available for measuring the
performance of process chains.
3.4.1.3.3 Actions
While traditional origin-destination based pedestrian simulators model the flow of people from A to B,
MassMotion can target a sub population mid-route and direct those individuals to accomplish any
number of alternate Tasks.
Actions are operators that can be selectively applied to agents as they move through the scene.
Actions can be applied as an agent enters the simulation, as it transitions between links and floors,
as it enters or exits zones, as it reaches destination portals, as it finishes processing at a server, or
through the use of time triggered action events. Possible operations include changing the agent
50
© 2015 Oasys Software Limited
MassMotion
colour, giving the agent a new goal, or instructing the agent to wait for a specific interval.
For a full list of available operations, see Agent Actions. For information on how to apply actions to
agents, see Where to Use Actions. For details on the order in which actions are applied to an agent,
see Order of Action Execution.
3.4.2
Simulation
Once authoring has reached a stage where the scene contains a viable network and there are events
for generating agents, the project can be simulated. See running a simulation for information on how
to launch a simulation. See simulation data for information on the data produced by a simulation.
Validation
When a simulation is launched, the project is automatically validated. Validation involves verifying
that all objects and their properties are in a consistent state, that all object references can be
resolved, and that the resulting simulation network will be well formed. Any errors must be
addressed before proceeding with a simulation.
Validation can also be performed manually using the Validate button in the analysis tab of the main
window's ribbon.
Compiling
When starting a simulation, a copy of the project is created and compiled into an optimized form. It
is the optimized copy which is used for the simulation, meaning that changes in the authoring
environment have no impact on a simulation that is already running.
Compilation involves converting the various object properties into raw data, resolving references
between different objects, generating obstacle and approach maps for walkable objects, converting
object goal lines into network waypoints, building the network, constructing cost trees for each
destination in the scene, and creating a new database file.
Execution
The simulation can be run either in console mode or debug mode (see Running a Simulation). Both
methods make use of all available processors on the machine. The console window provides text
based feedback on the simulation. The debug window contains a graphical scene view and provides
a mechanism for interrogating agents and objects as the simulation progresses. Both methods
make use of all available processors on the machine, but a console simulation will execute much
faster than a debug.
Review
Once a simulation is complete, the results can be played back or analysed through queries using
the Analysis system.
3.4.2.1
Simulation Data
Each iteration of a simulation is associated with a simulation run object in the project. The
simulation run is connected to a database file on disk and is the handle through which MassMotion
accesses the data for both playback and analysis.
All of the simulation data is stored in a single mmdb file. This is a standard SQLite database file
and can be interrogated using any third party SQLite tool. Many of the analysis queries provided by
MassMotion are convenience wrappers for the execution of raw SQL queries. Agent position
information is packed into an optimized form and difficult to read directly, but all other information
© 2015 Oasys Software Limited
51
MassMotion
can be extracted directly from the database with a basic understanding of SQL. For example, tables
exist in this database to indicate what floors agents were on at every instant, and what tokens they
were holding. A separate tool for extracting and exporting agent positions is available from the main
window.
Local Storage Recommended
The performance of simulation execution, playback, and analysis queries can all be negatively
affected by slow database access times. As a result, it is recommended that simulation runs point
only to local drives and not use a USB or network drive. SSD drives give the best performance, but
note that the results database for a large model can be 100 GB or more. A rule of thumb is that 1
agent for 1 hour will take approximately 1 MB; therefore, a 2 hour simulation with a sustained
population of 10 000 agents will result in a database approximately 20 GB in size.
Recovering a Project
The database file referenced by the simulation run contains not just the results of the simulation, but
a copy of the project used as input to the simulation. The original project can be recovered by
opening the mmdb database file as if it were a regular project file (*.mm) using the Open button in
the main window's project ribbon.
3.4.3
Analysis
Each time a simulation is executed the results are recorded in a simulation run. Tools are provided
in MassMotion for playing back the simulation or extracting data from the run in the form of a query.
Queries can be customized for a particular project, saved, and re-applied to additional runs.
Playback
The results from a simulation run can be reviewed through playback. It is possible to view agents
from multiple simulation runs at the same time. For more information see Playback.
Queries
Analysis queries take the form of Graphs, Tables, or Maps. Graphs display information such as
population counts or flow counts over time. Tables provide summary information about a particular
population of agents. Maps represent spatial information such as density by painting colours directly
onto the 3D scene objects.
Agent Filters
Agent filters allow for further customization of simulation run playback or queries by separating out
specific sub-populations of agents. Agent filters can isolate agents that entered at a particular portal,
or who are on a specified floor, or who have ever crossed a certain link. The filters can then be fed
into maps, graphs, tables, or general playback to customize the query or playback output.
Reporting
Simulation run data can be exported to text files, images, or videos. For information see Reporting.
3.4.3.1
Playback
A simulation can be reviewed in the scene view through the main window's playback controls. The
run will populate the view with agents as they were at the specified time in the recorded simulation.
Each simulation run in the project will play back a separate population of agents. These populations
are presented over top of one another. This can be very useful when comparing populations from
runs with slightly different setups.
The colour of agents is taken from the colouring in the simulation. The colouring can be changed
through the properties of the simulation run object. Agents can be set to a single colour in order to
52
© 2015 Oasys Software Limited
MassMotion
distinguish the populations of one run from the population of another, or the agents can be coloured
by density. It is also possible to use an agent filter to colour a sub population.
The current time and count of agents shown in the scene can be displayed in the 3D scene view by
enabling the appropriate scene view overlay.
3.4.3.2
Reporting
Data can be exported from MassMotion in a number of different ways:
Graph and Table Data
When a table or graph query has been created and evaluated, the resulting data can be exported to
a text CSV file using the 'File' button in the graph or table properties window.
Graph Images
When a graph query has been created and evaluated, the resulting data can be exported to an
image file using the 'File' button in the graph properties window. Use the style options in the property
window to control general graph formatting.
Scene Images and Videos
The Movie and Image Export window can be used to generate both snapshot images of the 3D
scene view and videos of simulation playback. The export window is available from the 'Analysis' tab
of the Main Window ribbon.
Agent Positions
The Agent Position Export window can be used to export agent positions to a CSV text file. The
export window is available from the 'Analysis' tab of the Main Window ribbon.
Alembic
The Alembic Export window can be used to export agent playback information to alembic files.
These files can be loaded into 3rd party applications like Softimage or 3ds Max to produce high
quality renderings of the simulation.
3.5
Troubleshooting
A complex project will almost always encounter issues in setup or design. MassMotion provides a
number of tools to help identify and resolve authoring related issues.
3.5.1
Auditing
Auditing an object will identify all properties that have non default values. This can sometimes
uncover properties that were unintentionally modified or values that are incorrect. Audit results can
be presented either by object or by property. Object auditing is available through an object's rightclick menu. See the Issue Window for information on how to review any resulting issues.
3.5.2
Validation
Validation verifies general project integrity. Invalid property values in objects will be reported.
Missing or incorrect references between objects will be flagged. All issues are collected and
presented using the Issue Window.
A project is automatically validated when launching a new simulation. The project can be manually
validated using the Validate button in the Simulation & Analysis tab of the main window ribbon.
Individual objects can be validated through the object's right-click menu.
© 2015 Oasys Software Limited
53
MassMotion
3.5.3
Observing Agents
The Agent Observer window can be used to interrogate the history of an agent from a particular
simulation run. It displays lifetime information such as the starting portal, ending portal, creation
event, route taken, and action history. It also displays some dynamic information such as speed,
state, and density.
The basic observer window is available through the right-click menu on a playback agent. If trying to
track down deleted agents, review the deletion error message from the simulation window and note
the agent ID. Open the agent observer window by right clicking on the simulation run, and enter the
agent ID directly.
3.5.4
Finding Object References
The ‘Find’ command in an object’s right-click menu will search a project for objects that relate to the
selected object(s). For example it is possible to find all members of a collection, or find all events
that reference a particular gate, find the reference geometry used to generate a stair, or find all
actions that use a particular token. This can be useful when determining why a gate is opening at an
unexpected time or which events are creating agents at a given portal.
3.5.5
Debugging a Simulation
Running a simulation in debug mode provides more than just a graphical view of what is going on. It
also gives access to many of the low level properties used by agents in their decision making. It can
reveal why agents are being deleted or making unexpected decisions.
In the simulation launch dialog, specify a breakpoint time to have the debug simulation automatically
pause when it reaches that time.
Object Properties
The right panel of the Debug Simulation Window shows the compiled properties of the selected
object. See Object Properties for a detailed list of these properties. Agent properties are particularly
useful when tracking down why an agent is being deleted or not behaving as expected. The task
panel shows the list of tasks in the agent’s to-do list, including the current active task. The action
panel shows a history of all actions that have been applied to an agent and summarizes the results.
Agent Display Options
Enable specialized display options on a per agent basis to gain a better understanding of why an
agent is behaving in a particular manner. The display options are available from the right-click menu
for an agent in the debug scene view. 'Route Costing' will display perceived costs for the various
route options the agent is considering. 'Neighbourhood' will indicate the neighbours that an agent is
aware of. 'Surface Probe' will show the direction in which the agent believes it should move to reach
its target. 'Social Forces' draws arrows representing the various forces acting on the agent. These
options are described in detail in the Simulation Scene View.
Obstacle Maps
Enable the display of an object's obstacle map to visualize the walkable space on a floor, link, stair,
ramp, or escalator. Areas marked in red are unavailable to agents either because they are off the
floor or covered by a nearby barrier. Sometimes barriers that don’t look like they should be having an
impact on an area will still cut a link in two or block access to a stair. Use an object's right-click
menu to display the obstacle map.
Dumping Surface Maps
In the project settings, enable the dumping of surface maps. When the simulation is compiled, all
approach maps and obstacle maps will be written out as images to a debug folder in the simulation
54
© 2015 Oasys Software Limited
MassMotion
run results folder. Examine images for those objects that are involved in a problem and verify that
goal lines appear as expected and that there aren't any unexpected barriers interfering with walkable
space.
3.5.6
Using Analysis to Diagnose Issues
The Analysis system of queries and agent filters can be very useful for verifying the integrity of a
project or tracking down the cause of any problems.
The Origin/Destination table is useful for quickly making sure the expected number of agents are
entering and leaving at the expected places. The Agent Path map will trace the route taken by a set
of agents. The Agent Summary table can indicate which agents failed to exit the simulation cleanly.
When diagnosing issues with agent route choice, the Static Cost map can help understand cost or
distance gradients throughout the scene. Unintentional distance penalties on links, forgotten one
way stairs, or accidentally virtual floors will all present as discontinuities in the map.
The 'Has end state' Agent Filter can be useful for isolating those agents that were deleted with
errors, or that unexpectedly remained in the simulation after completion. Use the filter within a
Simulation Run to only show those agents that have been deleted, or use in combination with an
Agent Path to examine the path problem agents took through the scene.
The 'Selected agents' Agent Filter can also be useful for limiting a query to only the selected agents.
© 2015 Oasys Software Limited
55
Part IV
MassMotion
4
Reference
The reference section provides details about the individual components of MassMotion. It is intended
to work in concert with the User Guide. The core of the reference section is the Objects subsection,
which contains detailed descriptions of the various properties of both objects that are part of the
simulation (such as floors and schedules) and analyses that are used to query the results of the
simulation.
4.1
Project
4.1.1
Project Settings
The project settings includes critical information such as the timing of simulation runs and location of
results. The project settings are available from the project tab of the main window's ribbon.
General tab
Runtime: Start
Time
Sets the starting time of the simulation. Values are in hh:mm:ss. See
Working with Time.
Runtime: Duration
Sets the duration of the simulation. Values are in hh:mm:ss. See Working
with Time.
Simulation:
Random Seed
Sets the seed of the project. The project seed governs several project
variables, such as the distribution of agent speeds and where and when
agents are created. See Randomness.
Simulation:
Population
Multiplier
Modifies the global population by a set factor. This scales the number of
agents produced by all events. This can be a fractional value of less than
one or greater than one.
Results Working
Folder
Sets the folder where the default simulation run and analysis outputs will
be sent.
Custom Views tab
Main window
This window shows the list of all custom views. Custom views are created
from the 3D scene view.
Show
Shows the selected custom view in the main viewport.
Rename
Renames the selected custom view.
Delete
Deletes the selected custom view.
Debug files such as surface map images or route cost spreadsheets are placed in a 'debug' folder
alongside the simulation run's results database file.
© 2015 Oasys Software Limited
57
MassMotion
Debug tab
4.1.2
Simulation
Diagnostic Files:
Surface Maps
Enables creation of debug surface maps for every object in the scene.
Simulation
Diagnostic Files:
Route Costs
Enables creation of route cost spreadsheets for every portal in the scene.
Merging Projects
MassMotion includes functionality for merging data from another project file into the currently open
project, through the File -> Merge menu entry. This will attempt to take all Objects and the Project
Settings from the file and import them into the current project. A dialog window will be shown to
indicate what data will be merged and allow for the resolution of any conflicts.
Objects
Any objects that exist in the file but not in the current project will be added to the current project
as a new object. If file objects happen to have the same name as objects in the current project,
the file objects will be renamed by adding a numerical suffix.
If the same object exists in both the file and current project, and both versions are equal (same
name, geometry and properties), the file object is ignored.
If the same object exists in both the file and current project, and the versions are different, then
there is a conflict with that object, and the user must resolve the conflict manually.
Project Settings
If the project settings from the imported project are different in any way from the current project, they
will be marked as in conflict and must be resolved.
Resolving Conflicts
There are three options for dealing with object or settings conflicts:
Use existing will use the version from the current project and ignore the file.
Use imported will use the version from the file, overwriting the current project.
Advanced allows the user to choose between 'Use existing' and 'Use imported' for settings and
conflicted objects on an individual basis.
4.1.3
Importing and Exporting Objects
Objects can be imported and exported using the File menu or buttons in the 'Project' tab of the main
window's ribbon, and can also be exported while editing object properties. Exported objects include
both geometry and properties. References between objects are maintained provided all referenced
objects are either included in the export, or are already present in the destination project (for
instance, when exporting/importing between different versions of the same project).
When an imported .mmxml file contains objects with the same name as existing objects, the newly
imported objects will be renamed by adding a numerical suffix. In some situations, importing objects
will lead to a conflict with objects currently in the project. In this case the Merging Projects window
will be used to resolve the conflicts.
58
© 2015 Oasys Software Limited
MassMotion
4.1.4
Files
MassMotion Files
File Type
Description
.mm
The standard MassMotion project file. Contains all objects and the project settings.
.mmdb
The results of a MassMotion simulation.
A simulation run is used to access a mmdb file from within the project. A simulation
also produces several other files as listed in Generated Simulation Files.
The file can be queried as an sqlite database for information about agents or used to
recover a project by opening it as if it were a mm project file. See Simulation Data
for more information.
.mmxml
Exported MassMotion objects. See Importing and Exporting Objects for more
information.
.mmxsi
A project exported from the Softimage workbench using MassMotion 7.
Import Files
MassMotion can import geometry from a variety of sources as Reference Geometry, which can be
used to create other scene objects. See Importing Geometry for more information.
Export Files
MassMotion's analysis tools can export data for further processing. All tables and graphs can export
their datasets to a .csv file, and graphs can additionally be exported as an image. Agent Position
Export can be used to output the position of agents from a simulation run to a .csv file. Movie and
Image Export can be used to produce images and movies in various formats. Alembic Export can be
used to export animated agent models for use in animation/visualization packages.
4.1.5
Upgrading Older Projects
Projects saved using an older version of MassMotion will automatically be upgraded to version 8
when opened. No user intervention is required. Projects saved in version 8 cannot be opened in an
older version of MassMotion.
Simulation Results
Database files are not compatible between versions. Older simulation runs cannot be used for
playback or analysis and will have to be rerun using version 8.0.
Converting Workbench Object(s)
Some objects created in the MassMotion 7 Softimage workbench cannot be authored in
MassMotion 8. These objects will import into a version 8 project and can be used to execute a
simulation, but cannot be modified. To change the behaviour of these objects they must be
converted into comparable MassMotion 8 objects. Some information may be lost in the conversion.
To convert an object right click on it in the main window list view and select "Convert Workbench
Object(s)" or use the button in the workbench object's properties window.
© 2015 Oasys Software Limited
59
MassMotion
Workbenc
h Object
MassMotion
Object
Notes
Workbench
Schedule
Journey
Start time, demand curve, population count, profile, actions,
origins, destinations are all converted with no loss.
Agent colours are specified using a rule generated from the
origin/destination avatar assignment from the workbench
schedule.
Avatar assignment is lost during conversion and all agents use
the same avatar from the specified profile.
Workbench
Evacuation
Execute Action
An inline action is created to mimic exactly the behaviour of the
workbench evacuation event. Agents are given a wait task, a
seek best portal task, and then an exit simulation task. No
information is lost in the conversion.
MassMotion 7
Goal line tolerances were tightened. Some links, stairs, ramps, escalators, or portals that
validated in version 6 may have to be adjusted in version 7.
Unique names enforced. In version 6 it was possible to have objects of different types with the
same name. As of version 7 all objects must have a unique name regardless of type.
MassMotion 8
Validation errors must now be resolved before a simulation can execute.
Old style process chains with connected server port groups will automatically be converted to the
new dispatch process chain style.
60
© 2015 Oasys Software Limited
MassMotion
4.2
User Interface
4.2.1
Main Window
4.2.1.1
List View
The list view presents the name and type of all objects in the project. The list can be filtered to
display only objects meeting certain criteria.
The list view has built in filters accessible through the "Filter by type menu". Alternatively, right
clicking on objects in the list view or scene view and using a "Find" command will create a custom
filter presenting only the found objects.
UI Element
Description
Navigator
Arrows
Go backwards and forwards through the history of displayed objects.
Search by
name or
type...
Search objects by name or type. Objects will only be shown if either the
object's name or its type contains the given text.
Filter by type
menu
Filters the list by objects of a certain type. Categories of objects can be used,
such as all collections or all analysis objects.
View columns
The column headers can be used to sort objects by name or type.
© 2015 Oasys Software Limited
61
MassMotion
4.2.1.2
Focus on
selection
button
Filters the list to display all currently selected objects.
Visibility
Indicator
Each object has an indicator which shows its colour and visibility. Hidden
objects will have only an outline as an indicator. Disabled objects will have a
small grey dot.
Object Name
Each object's name. The name can be edited by selecting one or more objects
and pressing the 'F2' key.
Object Type
Each object's type.
3D Scene View
The 3D scene view shows the spatial arrangement of all scene objects as well as analysis cordons
and regions. Decorators display the status of various objects.
Right clicking on objects in the scene view produces a menu which allows users to manipulate the
scene. Additional controls can be found in Keyboard and Mouse Controls.
UI Elements
Focus on
selection
62
Centre and zoom in on the currently selected object(s).
© 2015 Oasys Software Limited
MassMotion
View
selection &
management
Change the camera between perspective and various orthographic views.
Custom views can be saved and applied in this menu as well.
Visibility
options
Change the appearance of objects in the scene view. These settings are very
useful when setting up the scene to export a movie or image.
Agents: Change the appearance of agents. See below for a description of agent
appearance options.
Decoration: Toggle the appearance of decorations in the scene view. See
below for a description of all available decorations.
Overlay: Toggle the appearance of overlays which display information such as
the current simulation time and visible population. It can also be used to hide
the reference axes which appear at the top right, and the legend which can be
displayed when maps are shown in the scene.
Render Type: Switch between shaded and wireframe representations.
Draw Geometry Edges: Toggle the highlighting of geometry edges.
Hide Agents On Hidden Floors: Agents on hidden floors and other geometry
will not be shown.
3D scene
view
A graphical representation of all visible scene objects.
Expand/
collapse
view
Expand and collapse scene views. By default, only one scene view is displayed,
but three are available. If only one view is visible, clicking this button will shrink
that view so all three are shown. If all three views are visible, clicking any one of
them will expand it to be the only one shown.
Agent
Appearance
Animated
The default animated avatar with articulated arms and legs.
Avatars
For a project containing advanced features, agents can be assigned custom
geometry. This option displays agents using that geometry. If the project does
not contain custom agent geometry, the low resolution pegs are used.
Debug
A low resolution simple peg. The size of the peg will change with the radius of
the agent.
Decorations
Decorations can be turned on or off for specific objects by right clicking on an object and using the
'Display' menu. All decorations of a given type can be enabled or disabled globally through the
visibility options of the scene view.
General Decorations
© 2015 Oasys Software Limited
63
MassMotion
64
Directio
n
Arrows
Displays whether a connection object is
unidirectional or bidirectional, allowing agents
to cross in each direction. See Links and
Connection Objects for more information.
Gate
Displays whether a connection object is gated.
During authoring and playback the symbol is
white. In simulation, the gate is coloured red
when closed, yellow when open for some
agents and green when open for all agents.
See Links and Connection Objects for more
information.
Goal
Line
Displays the goal lines of portals and
connection objects. Goal lines are coloured
green when connected to an underlying floor
and grey otherwise. Connection objects have
two goal lines, one with box terminals and one
with balls. See Connecting Objects Together
for more information.
Portal
Start
Angle
Displays the start angle for portals. Agents
created at this portal will be created facing this
direction.
Priority
Flow
Displays which side will yield when agents
approach a connection object from both sides.
Server
Entry
Arrow
Displays the entry point and direction of a
server.
© 2015 Oasys Software Limited
MassMotion
Server
End
Point
Displays the end point of a server.
Debug Simulation Decorations
Neighb
ourhoo
d
Displays an agent's neighbourhood in debug
simulation. See Simulation Scene View for
more information.
Obstacl
e Map
Displays the obstacle map for surfaces in
debug simulation. See Simulation Scene View
for more information.
Route
Costing
Displays how agents perceive the network in
debug simulation. See the Simulation Scene
View for more information.
© 2015 Oasys Software Limited
65
MassMotion
66
Social
Forces
Displays the forces which affect an agent's
movement in debug simulation. See the
Simulation Scene View for more information.
Surface
Probe
Displays an agent's awareness of its
immediate surrounding in debug simulation.
See the Simulation Scene View for more
information.
© 2015 Oasys Software Limited
MassMotion
4.2.1.3
Model Panel
The model panel provides tools for manipulating scene objects. Many of these tools can be
accessed using keyboard and mouse controls.
UI Element
Description
Selection
mode
The selection mode can switch between Object, Vertex, Edge and Face/
Polygon. See Editing Geometry for more information.
Position
indicator/
editor
The position fields display the location of the current selection. In the case of
vertices, the values represent the location of the selected vertex. In the case of
objects, faces, or edges, the values display the location of the centroid. In all
cases, modifying the values will move the current selection(s) to the new
location. If more than one object or component is selected and they have
different values for X, Y, or Z, a * will appear instead of a value.
Transform
indicator/
editor
Translation, rotation and scaling to geometry and scene objects can be
activated here. In addition to using a manipulator in the scene view, the precise
values of a transformation in each axis can be directly edited. See Editing
Geometry for more information.
Operations:
Split
Subdivide a selected edge or face. See Editing Geometry for more information.
© 2015 Oasys Software Limited
67
MassMotion
4.2.1.4
Operations:
Simplify
Merge edges and faces to reduce geometric complexity without changing the
object shape. See Editing Geometry for more information.
Operations:
Delete
Delete selected objects or components.
Tools: Grow
Extrude a selected edge or face. See Editing Geometry for more information.
Tools: Knife
Cut selected objects along a cutting plane. See Editing Geometry for more
information.
Tools:
Measure
The measure tool is used to find the distances between points in the scene.
Clicking any two points will display the distance between them as well as the X,
Y,Z values. By holding shift, multiple points can be selected. The total distance
between selected points is displayed in the main status bar. Switching to
vertex, edge and face selection modes will snap points to the available
components.
Process
Chains: Edit
Enable or disable process chain editing mode. See Process Chains for details.
Process
Chains:
Connect
Connect servers and/or dispatches within a process chain. See Process Chains
for details.
Process
Chains:
Disconnect
Disconnect servers and/or dispatches within a process chain. See Process
Chains for details.
Time Panel
The time panel displays the current time and can be used to play back simulations in the scene view
.
UI Element
68
Description
© 2015 Oasys Software Limited
MassMotion
4.2.1.5
Start Time
The simulation's start time. See Project Settings for more information. If
multiple simulation runs have different start times, the earliest one is used.
End Time
The simulation's end time. See Project Settings for more information. If multiple
simulation runs have different end times, the latest one is used.
Playback
Speed
How quickly playback runs. 1x is "real time" and higher values effectively "fast
forward" through playback.
Timeline and
current time
A slider which indicates playback progress. The slider can be repositioned to
change the current time.
Go to start
time
Sets the current time to the start time.
Play from
current time
(Up arrow)
Plays back simulations from the current time. MassMotion simulations are
calculated and recorded in 0.2second increments. When playback is active the
animation system will use linear frame interpolation to provide the smoothest
possible representation of the currently selected playback speed in the 3D
views.
Pause
playback
(Down arrow)
Pause playback.
Go to end
time
Sets the current time to the end time.
Current time
position
Displays the current time. Can be edited to skip to a specific moment.
Frame step
forward
Advance the current time by 1 simulation frame (no frame interpolation is
applied)
Frame step
backward
Move the current time back 1 simulation frame (no frame interpolation is applied)
Main Menu Bar
The MassMotion Application Menu is available from the menubar at the top of the MassMotion
window.
File
New
Create a new empty project.
Open
Open either a previously saved MassMotion project file (.mm), a project
exported from the Softimage workbench (.mmxsi), or a project contained
in a MassMotion results database (.mmdb).
Save
Save the project as a .mm project file. Note that this will save as a new
file if the project was initially opened from a Softimage export (.mmxsi).
© 2015 Oasys Software Limited
69
MassMotion
Save As
Save the project as an alternative .mm project file with a new name.
Close
Stop all running simulations and close the current project.
Merge
Merges the open MassMotion project with data from another MassMotion
project file (.mm), a project exported from the Softimage workbench (.
mmxsi), or with project data contained in a MassMotion results database
(.mmdb). See Merging Projects for more information.
Import
Import either:
Objects exported from other projects (.mmxml) (see Importing and
Exporting Objects).
Analysis objects from MassMotion 6.0 or 6.1 projects (Analysis.xml)
(see Importing and Exporting Objects).
Avatar geometry
Reference geometry exported from other CAD/geometric authoring
applications.
Export
Export:
Objects for import into other MassMotion projects (.mmxml) (see
Importing and Exporting Objects).
Geometry to neutral file formats such as Collada (.dae) for import into
other CAD/geometric authoring applications
Agent positions data in a simple text file (see Agent Position Export).
Alembic animation data for rendering agent movement in applications
like Softimage or 3ds Max (see Alembic Export).
A movie or image generated from the current project (see Image and
Movie Export).
Settings
Edit the Project Settings.
Exit
Stop all running simulations and quit the application.
Edit
Undo
Undoes the previous command. Can be stepped back multiple times.
Redo
Steps forward if the Undo command is used. Can be used multiple times.
Select All
Select all objects in the project.
Select Inverse
Select all objects other than those in the current selection.
Deselect All
Deselect all objects currently selected.
Preferences
Edit the application preferences.
View
List View
70
Toggle display of left-hand side list view showing list of all existing object
(s) in the project.
© 2015 Oasys Software Limited
MassMotion
Scene View
Toggle display of all 3D scene views.
Time View
Toggle display of bottom pane time panel with playback controls (See
Playback).
Context View
Toggle display of right-hand side pane with contextual tools for operating
on currently selected objects; see Model Panel for details.
Other Windows
Toggle the display of additional windows:
Console: Show a console window with MassMotion diagnostic output.
Issues: Show the Issue Window with the most recent list of warnings,
errors, or audit information; see Validation for details
Observe Agents: Display information about a particular agent from a
particular run (see Agent Observer).
Close All Windows
Closes any pop-up properties or analysis windows.
Show All
Unhide all objects.
Show Selected
Unhide all selected objects.
Hide Selected
Hide all selected objects.
Hide All But
Selected
Hide all objects that are not part of the current selection (leaving only
selected objects visible).
Hide Maps On
Selected
If any of the selected surface objects have been covered by an analysis
map texture, the map texture is removed (does not apply to textured
reference geometry)
Hide Maps On All
Remove all analysis map textures from all surface objects in the scene
(does not apply to textured reference geometry)
Help
4.2.1.6
Show Help...
Display the MassMotion user guide.
Graphics Driver
Diagnostics
Displays the current OpenGL version as well as any issues detected;
MassMotion requires OpenGL version 3.0 or higher for full functionality. If
you are having problems with graphics not being displayed properly, or
crashes when attempting to open or create a project, please include this
diagnostic information in any support request.
About
MassMotion...
Display information on the current version of MassMotion.
Main Status Bar
The main window status bar is at the bottom of the main window.
Main Status Bar
© 2015 Oasys Software Limited
71
MassMotion
Selection
Displays the name of the object currently selected. If more than one
object is selected the number of objects selected is displayed. If object
components are selected, the number of components is displayed.
Distance
Displays the length of the edge currently selected, along with the
component horizontal and vertical lengths. If more than one edge is
selected, the total length of all edges is displayed. If two vertices are
selected, the distance between the vertices is displayed. If the measure
tool is active, the total distance measured is displayed.
In all cases the number is in metres.
4.2.2
Mode
The current selection mode: object, face, edge, vertex.
Population
The total of all agents from all connected simulation runs that are alive at
the current time. This counts includes hidden agents, ignoring the
simulation run filter and visibility state of the simulation run.
Issue Window
Show the issue window including the most recent list of issues or audits.
Console Window
Show the console window.
Editing Object Properties
Object properties can be edited using the Properties Window. This dialog is available through the
object's right-click menu, or by double-clicking on the object in the scene or list views. Objects
which share common properties can have those properties edited in batch all at once using object
multi-edit.
Properties Window Toolbar
File
For some query types, this allows the results to be saved to an image or
CSV file. For agent actions, the action graph image can be exported.
Additionally, for any object type, this allows the current object(s) to be
exported to an XML file for use in another project.
Select
Select the objects currently being edited (useful for then finding them in the
scene or choosing them elsewhere in the user interface).
Multi
Choose which objects are currently being edited (see Editing Multiple
Objects for details).
Generate/
Evaluate
Used by graph, map, and table queries to calculate results.
Help
Display the help page for the inspected object.
Arrow
For table and graph queries which generate data, the arrow will show or
hide the results.
Object Header
The header consists of a colour swatch, object name, and object indicator. This header is visible for
72
© 2015 Oasys Software Limited
MassMotion
all object types regardless of the properties.
Object Header
Colour Swatch
The object colour can be modified by clicking on the colour swatch. Left
click to bring up the colour chooser. Right click to pick a specific colour or
reset to the object’s default colour. See Working with Colours.
Name
Valid object names must begin with a letter then be followed by any
combination of letters, numbers, underscores, or dashes.
Object Indicator
The object indicator displays the status of the object. If all properties in the
object are valid the indicator will be green. Red indicates that at least one
property is invalid. Right-clicking on the indicator can be used to reset all
object properties to their default values.
Properties
Below the name field is a list of properties for the particular object being inspected. Beside each
property is an indicator. The indicator changes colour depending on the state of the property: green
for valid, red for invalid.
It is possible to reset a property to its default value, copy the value, paste a value, or set the value
from another source object, all through the right-click menu of the indicator.
Property values can be copied within an object or even between objects by dragging the indicator of
the source property onto the destination property.
4.2.2.1
Editing Multiple Objects
MassMotion supports editing the properties of many objects simultaneously. Select multiple
objects and then use the right-click menu to select 'Properties'. Or inspect the properties of a single
object, then use the 'Multi' button at the top of the window to add objects to the current session.
The editor dialog allows editing of any properties that the chosen objects all have in common. When
editing objects of similar type all properties are available. If multi-editing a floor and link, only shared
properties such as the map resolution can be modified. In all cases, setting the value of a property
will set that value on all objects.
Editing Names
When inspecting the properties of multiple objects, the name entered will be applied to all objects
being edited. Numeric suffixes will be added as needed to ensure that all names remain unique.
For instance, if three objects are selected, then:
Entering a name of 'NewName' will result in the objects being renamed to 'NewName',
'NewName1', and 'NewName2'
Entering a name of 'NewName1' will result in the objects being renamed to 'NewName1',
'NewName2', and 'NewName3'
Entering a name of 'NewName10' will result in the objects being renamed to 'NewName10',
'NewName11', and 'NewName12'
Property Indicators
The small coloured property indicators to the left of each property field are especially important when
editing multiple objects. Different colours and shapes of the property indicator indicate different
states:
© 2015 Oasys Software Limited
73
MassMotion
Indicator
appearance
Meaning
Green circle
All edited objects have the same valid value for this property.
Yellow
triangle
All edited objects have valid values for this property but they are not all the same.
Red square
All edited objects have invalid values for this property.
Split yellow/
red square
Some edited objects have invalid values for this property and some have valid
values.
Right-clicking on the property indicator allows the property value from a specific object to be copied
to all edited objects. 'Set from' brings up a dialog allowing any one of the currently-edited objects to
be selected; that object's value for the current property will then be copied to all other objects. 'Set
from any' works the same way but allows any object in the current project to be chosen.
4.2.3
Choosing Objects
Working with MassMotion frequently involves the choosing of one or more objects such as the
simulation run used by a given query or the set of origin portals for a circulate event. In both cases
MassMotion provides a variety of ways to choose the object(s).
Single Objects
Clicking on the 'mouse cursor' icon beside a single-object field (or on the field itself if it is blank) will
bring up a dialog with a list of all valid objects for that field. Alternatively, if the desired object has
already been selected elsewhere, the 'crosshair' icon beside the field can be used to choose that
object. For instance, a simulation run could be selected in the list view on the left side of the main
window and then the crosshair could be used to choose that simulation run.
Multiple Objects
Similar to single objects, clicking on the mouse cursor icon or in an empty multi-object field will
bring up a separate selection dialog. The two arrows in this dialog can be used to move valid objects
between the Available and Selected columns. Alternatively, objects that are currently selected can
be directly added or removed to or from the chosen objects field using the plus or minus buttons. For
instance, one or more links could be selected in the 3D view and then added or removed from a bank
by using the plus and minus buttons.
In some cases, the order of chosen objects is important, such as when defining a trip. In these
cases the multi-object field will additionally have up and down arrows that can be used to change the
order of selected objects.
Finally, chosen objects can sometimes have weights assigned to them, such as the origin portals in
a journey event. In the following table, assume that three individual portals and one collection of two
portals have been set up. There are then three options for how to assign and use weights:
74
Description
Meaning
Ignore weights in
list (and
collections)
All individual objects in the list, and all member objects of any collections
in the list, are merged into a single large set and weighted equally. In the
example below, each individual portal would have a weight of 0.2 since
there are a total of 5 portals.
© 2015 Oasys Software Limited
MassMotion
Description
Meaning
Journey origins ignoring w eights
Collection m em bers ignoring w eights
Automatic
weights in list
Each item in the list is weighted equally; in the example below the three
top-level portals and the collection would each have a weight of 0.25. For
any item that is a collection, the collection's weight is then divided between
the collection's individual member items based on each item's weighting
within the collection. Again in the example below, the two portals inside the
collection would both have a weight of 0.125 (half of 0.25 each).
Journey origins w ith autom atic w eights
© 2015 Oasys Software Limited
75
MassMotion
Description
Meaning
Collection m em bers w ith autom atic w eights
Manual weights
in list
Each item in the list of origins is assigned a manual weight; the two
'equalizer' buttons can be used to quickly set all weights equal or normalize
them (force them sum to 1 while keeping the same relative proportions).
For any item that is a collection, the manual weight assigned to the
collection is then divided between the collection's individual member items
based on each member's weighting within the collection.
In the example below, the three top-level portals would keep their weights of
0.2 each while the two portals within the collection would end up with
weights of 0.1 and 0.3 (one-quarter and three-quarters of 0.4 respectively).
Journey origins w ith m anual w eights
Collection m em bers w ith m anual w eights
76
© 2015 Oasys Software Limited
MassMotion
4.2.4
Working with Colours
Individual Colours
Colour 'swatches' are used throughout MassMotion wherever a colour should be specified (such as
the colour of an object in the 3D scene, or the colour of an individual series in a graph). In all such
cases, the colour swatch shows a preview of the colour and can be clicked to bring up a full-featured
colour dialog. Note that transparency can be set if desired by changing the 'Alpha channel' in the
colour dialog; an alpha channel value of 255 is fully opaque while a value of 0 is fully transparent
(invisible).
Alternatively, the swatch can be right-clicked to select from a small number of built-in colours or
reset the colour to its default value (e.g., light blue for a floor).
Colour Contours and Gradients
It is sometimes necessary to define a mapping between numerical values (such as time or density
values) and colours, such as in some map queries. For instance, the Fruin and IATA standards
described in LOS Colour Mapping define colours associated with different ranges of agent density. In
MassMotion, custom colour mappings can be defined by specifying a list of colours with cutoff
values in between colours. In most cases, these cutoff values and colours can then be visualized as
either discrete colour bands with sharp contours, or as smooth gradients.
Contour colouring
© 2015 Oasys Software Limited
77
MassMotion
Gradient colouring
The number of colours is always one more than the number of cutoff values. The first colour is used
for all values less than the first cutoff value and the last colour is used for all values greater than the
last cutoff value. If sharp contours are used, the second colour is used for all values between the first
and second cutoff value, the third colour is used for all values between the second and third cutoff
values, and so on. If a gradient is used, colour values are smoothly interpolated across each cutoff
value except for the first and last, which remain as sharp cutoffs. For example, the images below
show the relationship between numerical value and colour for cutoff values of 0.0, 1.0, 2.0, 5.0, 6.0
and 8.0. In the images above, note that the black and pink contours remain sharp even in the
gradient version. (In many cases the lower sharp cutoff will not be visible since it typically has an
associated cutoff value of 0.0, and often no values are less than or equal to 0.0.)
Contour colouring
Gradient colouring
The gradient behaviour is designed so that it is obvious (via a sharp edge) when a value falls outside
of the expected range. To avoid the sharp cutoff at each end of a gradient, the recommended method
is typically:
At the lower end, make the first two colours the same. In the above example, blue could be used
for both 'less than or equal to 0.0' and 'between 0.0 and 1.0'. Note that this means it will no longer
be possible to tell the difference between a small value and 'no data'.
At the upper end, add an extra cutoff value and associated colour; the cutoff value chosen should
78
© 2015 Oasys Software Limited
MassMotion
be one that you do not expect to ever reach. In the above example, a cutoff value of 12.0 could be
added with an associated colour of bright pink. This will cause the orange and red to blend
together over the cutoff value of 8.0; however, if the measured value (density, distance, time, cost
etc.) ever exceeds 12.0, a sharp cutoff to bright pink will be visible, perhaps indicating a
dangerously high population density or unacceptable time to exit during an evacuation.
The repeated-colour technique can also be used at the upper end, but the technique recommended
above has the advantage of clearly indicating when the simulation has exceeded expected bounds.
4.2.5
Working with Time
Working with MassMotion often involves specifying individual times, durations, or time ranges, such
as the time a particular event should fire or the time range over which a group of agents should enter
the simulation. Times and durations can either be entered explicitly in the form HH:MM:SS or using
a variety of shortcuts as shown in the table below:
Entere
d text
Resulting time
0
00:00:00
5
00:00:05
10s
00:00:10
2m
00:02:00
90s
00:01:30
1.5h
01:30:00
12:15
12:15:00
0:1:5
00:01:05
-30m
-00:30:00 (useful for specifying offsets, see below)
Note that:
Combined shortcuts such as 1h30m are not supported but can be entered as 90m or 1.5h instead.
A single number is interpreted as a count in seconds, but a time such as 1:30 is interpreted as
hours and minutes.
Time Ranges
Where a simple time range is required, it can be specified as:
Descripti
on
Meaning
All
available
The entire simulation
All before
From the beginning of the simulation to the specified time
All after
From the specified time to the end of the simulation
© 2015 Oasys Software Limited
79
MassMotion
Descripti
on
Meaning
Specified
interval
From the specified start time, for the specified duration
Time References
In several places, times can be entered as either absolute or relative to another time. These can be
specified as:
Descripti
on
Meaning
Absolute
A specific time in HH:MM:SS form. This is relative to midnight (00:00:00) on the start
day of the simulation. For instance, if the start time of the simulation (from the
project settings) is set to 08:30:00, an absolute time of 00:30:00 is actually before
the start of the simulation; an absolute time of 09:00:00 should be used in this case
instead.
Event
start
A specified offset from the start of a specified event (negative offset values can be
used if necessary).
Simulatio
n start
A specified offset from the start time of the simulation.
Simulatio
n end
A specified offset from the end time of the simulation (in this case, a negative offset
value should probably be used).
Time Reference Ranges
In some places, time ranges can be specified using time references (as above) instead of simple
times. In these cases the following options are possible:
80
Descri
ption
Meaning
All after
From the specified time reference to the end of the simulation
All
before
From the beginning of the simulation to the specified time reference
All
simulati
on
The entire simulation
Betwee
n times
Starting from one specified time reference, continuing until a second specified time
reference
Over
duratio
n
Starting from one specified time reference, continuing for a specified duration
© 2015 Oasys Software Limited
MassMotion
4.2.6
Issue Window
The issue window lists the results of a validation or audit. In the case of validation the window shows
potential errors in any object or the project settings. The issue window can be accessed from the
bottom right of the main window, listing the results of the last validation.
A similar issue log panel is available at the end of a simulation, listing any issues which arose during
the course of the simulation.
Issues are grouped by the objects they are related to, and individual issues for each object and
further details can be seen by expanding listed items. All issues can be expanded at once using
"Toggle expansion" button.
When an issue or audit result references one or more objects, those objects can be highlighted in
the list and scene views using the "Select subject" bullseye button. The contents of the issue
window can be saved to an external CSV file.
4.2.7
Keyboard and Mouse Controls
Project Controls
Ctrl-A
Select all from view. Select visible objects in the 3D scene view or the current
members of the list view.
Ctrl-Z
Undo
Ctrl-Y
Redo
Ctrl-S
Save
Camera Manipulation Controls
Pan
Press and hold the 'S' key, then press and hold the left mouse button while moving
the mouse.
Alternative: Hold the middle mouse button while moving the mouse.
Rotate
Press and hold the 'S' key, then press and hold the right mouse button while moving
the mouse. Note rotations are done around the current focus object. To change the
focus object, select the object and press the 'F' key.
Alternative: Hold the shift key and middle mouse button while moving the mouse.
© 2015 Oasys Software Limited
81
MassMotion
Camera Manipulation Controls
Zoom
Press and hold the 'S' key, then press and hold the middle mouse button while
moving the mouse.
Alternative 1: Hold the control key and middle mouse button while moving the
mouse.
Alternative 2: Scroll the mouse wheel.
A - Show
All
Use the 'A' key to move the camera so that all visible objects and agents are framed
within in the view.
F - Focus
Use the 'F' key to centre and zoom to frame within the view the currently selected
object(s). The selection object(s) will become the new focus for any camera
rotations.
Playback Controls
Right
Arrow
Advance one frame in playback.
Left
Arrow
Rewind one frame in playback.
Up Arrow
Play/pause simulation playback.
Down
Arrow
Pause simulation playback.
Object Selection Controls
82
Left Click
Selects an object or agents in the scene. Click and drag to "box select" multiple
objects. Dragging right will only select objects fully enclosed by the box, dragging
left will select any object within or overlapped by the box.
Ctrl Key +
Left Click
Hold this key while selecting objects to toggle (add/remove) objects in the current
selection.
Shift
Key +
Left Click
Hold this key to add objects to the selection
E
While an object is selected, switch to edge selection mode. Only edges of selected
objects can be selected.
T
While an object is selected, switch to vertex selection mode. Only vertices of
selected objects can be selected.
Y
While an object is selected, switch to face selection mode. Only faces of selected
objects can be selected.
Q
Enter or exit process chain edit mode for editing the connections between servers .
Space
Return to object selection mode. Any manipulations will also be stopped.
© 2015 Oasys Software Limited
MassMotion
Object Selection Controls
Escape
Deselect all and return to object selection mode. Any manipulations will also be
stopped.
Tool Controls
4.2.8
Right
Click
Open a context specific menu which can be used to modify objects, view their
properties, find related objects or create new objects in the scene view. Object
components have a separate context menu specific to the type of component.
X, C, V
Starts scaling, rotating and translation manipulations respectively. See Editing
Geometry for more information.
Ctrl-D
Duplicate the currently selected object. The new object will be selected.
G
Starts a growing operation when a vertex, edge or face is selected. See Editing
Geometry for more information.
M
Opens the measure tool. See Model Panel tools for more information.
K
Opens the knife tool. See Editing Geometry for more information.
Delete
Delete selected objects or components.
Application Preferences
MassMotion provides a number of preferences that apply to all projects. These preferences can be
accessed under Preferences in the main window's Edit menu.
General
Scene View:
Background
Background colour to use when displaying scenes.
Scene View: Near
clip distance
Minimum distance from the camera at which objects are visible. Decrease
to avoid clipping objects, at the cost of rendering accuracy (objects will be
more likely to appear to overlap each other).
Scene View: Far
clip distance
Maximum distance from the camera at which objects are visible. Increase
as necessary for very large scenes, at the cost of rendering accuracy
(objects will be more likely to appear to overlap each other).
Reset
Reset all general to MassMotion defaults.
Movie/Image
Appearance:
Resolution
Default resolution to use for movie/image export.
Appearance:
Background
Default background colour to use for movie/image export.
© 2015 Oasys Software Limited
83
MassMotion
4.3
Movie: Quality
Default quality setting to use for movie/image export.
Movie: Frame rate
Default frame rate to use for movie/image export.
Overlay: Text
Default overlay text colour to use for movie/image export.
Overlay:
Population count
Whether population count should be displayed by default during movie/
image export.
Overlay: Time
Whether current time should be displayed by default during movie/image
export.
Overlay: Map
legend
Whether the map legend (if any) should be displayed by default during
movie/image export.
Overlay:
Reference axes
Whether the set of reference axes should be displayed by default during
movie/image export.
Reset
Reset all movie/image preferences to MassMotion defaults.
Objects
As described in the Objects page of the user guide, a MassMotion project consists primarily of a set
of objects. Objects can be classified as:
Scene: physical objects such as floors, which have a physical presence in the scene
Activities: create agents, modify agents, or perform operations on the scene
Analysis: queries and related objects that are used to analyze the results of a simulation
This section describes the properties of each individual type of object in detail.
4.3.1
Scene Objects
Scene
Object
Type
Description
Collectio
ns
Collections are containers of other objects. Some collections are used during the
simulation and others are for modeling and analysis.
Bank: Represents a set of nearby connections between two objects. Affects agents
in simulation.
Collection: A general multi-purpose collection that can store any non-collection
object.
Perimeter: A set of connections which cannot be crossed more than once. Affects
agents in simulation.
Zone: A conceptual area in the simulation.
Reference Model: Created automatically to contain the reference geometry objects
from an imported geometry file.
84
Barrier
Obstacles that block agents from passing through.
Escalator
A vertical connection object representing an escalator. Escalators must be
unidirectional.
© 2015 Oasys Software Limited
MassMotion
Floor
Floors represent any flat area in which agents may walk.
Link
A connection object which connects floors horizontally. May represent a doorway or
turnstile.
Path
A connection object constructed from a curve segment. Does not need to be
horizontal.
Portal
Represents entrances into the simulation as well as agent destinations.
Ramp
A vertical connection object which represents a ramp.
Referenc
e
Geometry
Imported geometry from external sources. Geometry must be used to generate other
MassMotion scene objects before they can be used.
The following files can be imported:
3DS Max (.3ds)
Collada (.dae)
AutoCAD Drawing Exchange Format (.dxf)
FBX (.fbx)
Industry Foundation Classes (.ifc)
Wavefront (.obj)
4.3.1.1
Server
Used to model queues and more complex agent behaviour.
Stair
A vertical connection object which represents a stair.
Visual
Cosmetic objects that enhance the look of the scene.
Collections
Collections are a versatile way of using and interacting with objects. Some collections have an
impact on simulation execution. All collections can be used as simple containers for controlling
scene object visibility in bulk or referencing a set of objects all at once.
Members of a collection can be selected using "Find -> Collection Members" in the right click menu
or the "Find all members" button in the collection properties.
Collections as parameters
A collection can be chosen in most places where multiple objects are expected (such as the gated
links for an open gate event). Choosing a collection is similar to individually choosing its various
members. When a collection contains members that do not make sense for the given choice, those
members are ignored. For instance, a general collection called "EastWing" might include a
combination of links, floors and portals. Using that collection within an open gate event would only
make use of the gated links, while all other members would be ignored.
The type of objects used from a collection will be indicated by appending a suffix to the collection
name. For example, a map query choosing a general collection called "EastWing" will refer to the
collection as "EastWing.Surfaces" in its properties.
List of collection suffixes
Suffix
Description
Areas
Area objects: walkable objects (floors, links, etc.) or analysis regions.
© 2015 Oasys Software Limited
85
MassMotion
Connecti
ons
Connection objects (ie. links, stairs, escalators, ramps and paths).
Cordons
Analysis Cordons
ExitPort
als
Portals which are set to be destinations.
Gates
Links and other connection objects which have gated access.
Portals
Portals
Profiles
Profiles
Regions
Analysis Regions
Servers
Servers
SimRuns
Simulation Runs
Surfaces
Paintable surfaces, used for map queries. Is usually only walkable objects, but the
vision time map can also paint barriers.
TripPoin
ts
Possible destinations for a trip (ie. areas, cordons, portals and servers). When used
in a trip, reaching any of the members will count as fulfilling that stage of the trip.
Tokens
Tokens
Walkabl
es
Walkable objects (floors, links, etc.).
Types of Collections
86
Collectio
n Type
Description
Bank
A collection of connection objects which connect the same two objects. Banks help
agents navigate clusters of similar and closely placed connections.
General
Collectio
n
A collection of any type of object except other collections.
Perimet
er
A collection of connection objects encircling a conceptual area of interest. Agents
cannot cross the same perimeter twice.
Zone
A collection of walkable objects which define a conceptual area in the simulation.
Connected links and portals can be automatically included.
Referen
ce
Model
A collection of reference geometry objects which were imported from the same file.
These are created automatically by importing geometry.
© 2015 Oasys Software Limited
MassMotion
4.3.1.1.1 Bank
A bank is a collection that contains connection objects such as links, stairs, escalators, ramps and
paths that are close together and connect the same two floors. A bank groups the similar
connections together and makes them appear as one choice to agents navigating the space.
During navigation, agents will attempt to choose the most convenient connection based on a number
of factors including congestion, distance to the connection (near distance), and distance from the
connection to the goal (downstream distance). In many cases this results in unequal distribution of
agents along a set of very similar connections due to alignment of the incoming flow, unequal widths
of links, or small (but largely irrelevant) differences in downstream distance.
When connections are banked, agents ignore downstream distance and focus exclusively on the
remaining cost factors. This results in agents being better spread out over a large set of connections
and improves flow across the bank.
A row of turnstiles. Tw o banks should be created, one for the three links on the left, and another for the
three links on the right.
While the most common use of banks is for turnstiles or fare gate arrays, banks can also be useful
for sets of vertical connections, such as stairs and escalators, where the objects are right beside
one another. If both stairs and escalators are members of the same bank, agents will still prefer the
escalators regardless of the bank.
Bank Properties
Properties
Name
The name of the bank.
Objects
Members of the bank. These must be connection objects (ie. links, stairs,
escalators, ramps and paths).
© 2015 Oasys Software Limited
87
MassMotion
4.3.1.1.2 Collection
A general collection can store objects of any type except other collections. They can be used as
conceptual or spatial groupings of other objects. Objects can belong to more than one collection.
Collection Properties
Name
The name of the collection.
Objects
Members of the collection. These may be any non-collections object. The weights
of objects can be set here if set to manual. See Choosing Objects for more
details.
4.3.1.1.3 Perimeter
Perimeters are collections of connection objects which reduce the number of available routes
through a scene.
There are two common situations where this can be useful:
1. When the number of possible route permutations is so large that simulation initialization requires
hours to complete. This usually occurs when there is a very large number of connections in the
scene.
2. When certain regions of the simulation should not be used as shortcuts by agents 'just passing
through' (such as with fare paid zones in a transit station).
Perimeters can consist of connection objects (ie. links, stairs, ramps, escalators and paths). When
a route involves crossing a link that is a member of a perimeter, it is said to be a route which
crosses that perimeter. A route will be considered invalid (and so hidden from agents) if it crosses
the same perimeter more than once.
Connection objects maybe be part of several different perimeters.
Impact on available routes
Given a region of floors completely enclosed by members of a perimeter, access across the
boundary to that region will be permitted only to those agents either originating inside the region or
seeking a destination within the region. Agents wanting to simply pass through the region will be
forced to go around. Figure 1 demonstrates the effect of perimeters on available routes through a
network.
88
© 2015 Oasys Software Limited
MassMotion
Figure 1: Example floor plan with and without a perimeter.
Care must be taken when constructing perimeters. It is important that all links that can be used to
access an area are included in the perimeter. If there is a single link left out, the perimeter is said to
have a hole, and will not be effective. The impact of a hole on a perimeter is shown in Figure 2.
Figure 2: Example floor plan with incomplete perimeter.
Connection objects in series within a route should not be part of the same perimeter. For example,
given a flight of stairs with two stairs connected by a simple floor landing, if both stairs are part of the
same perimeter, the flight of stairs will become unavailable for use.
Perimeter Properties
Name
The name of the perimeter.
Objects
Members of the perimeter. These must be connection objects (ie. links, stairs,
escalators, ramps and paths).
© 2015 Oasys Software Limited
89
MassMotion
4.3.1.1.4 Zone
A zone is a collection of objects that define a conceptual area in the simulation. Zones are specified
using a set of primary members, but then will automatically include additional secondary members
based on the "Type" property setting as described below. The areas in a zone do not need to be
connected to one another. Objects may be members of any number of zones.
All members, both explicitly and automatically chosen, can be found by using the "Find All
Members" button, or by right clicking the zone in the list view and using "Find: Collection Members".
Zones are required for use in evacuation events.
Zone Properties
Type
Determines the manner in which members are specified.
Chosen objects: Allows all walkable objects to be chosen as members.
Automatically adds portals connected to member floors.
Chosen floors and interior connections: Allows only floors to be
selected as members. Automatically adds portals connected to member
floors as well as connections between any two member floors.
Chosen floors and all connections: Allows only floors to be selected
as members. Automatically adds portals and connections touching any
member floor.
Members
The explicitly chosen members of the zone. These may be floors, links,
stairs, escalators, ramps and paths depending on the Type. Both the
explicitly and implicitly chosen members of a zone may be selected by
right-clicking on the zone in the List View and selecting Find->Collection
Members.
4.3.1.1.5 Reference Model
Reference models are automatically generated when importing geometry and will contain all
imported reference geometry objects from a single file.
Reference geometry objects cannot be directly edited or modified and so reference model objects
provide a way to reposition them to fit into the scene. All objects from a single file can be scaled,
rotated and translated in bulk using the reference model.
Deleting a reference model will delete all associated reference geometry objects from the scene.
Reference geometry objects can also can be deleted individually.
Reference Model Properties
Scale, Rotation,
Translation
90
These can be modified to rescale and move reference geometry objects to
better fit the scene. Scale will be applied first, then rotation, then
translation. Note that this means that the translation values will be in
metres, the MassMotion unit of measurement (rather than the original file's
© 2015 Oasys Software Limited
MassMotion
units) since the translation values are applied after the model has already
been scaled from its original units into metres.
Reference
Geometry Objects
4.3.1.2
The reference geometry objects included from the file.
Barrier
A barrier describes a region through which agents cannot pass. The default new barrier is a 1m x 1m
x 1m cube which can be then edited to any size or shape.
Barrier geometry interaction with walkable geometry
The blocked region on a floor is determined using the volume of intersection between the floor and
the barrier. Those portions of the barrier that do not intersect with the floor are ignored. Those
portions of the barrier that are more than 40cm above the floor are ignored.
Intersection tests are performed using the bounding box of the floor which is formed using the
highest and lowest points on the floor (including the underside). If barrier walls or columns on a floor
intersect with the underside of the floor above, they will impact agent movement on that floor. To
avoid this, ensure that barriers for a lower floor terminate just below the upper floor.
1m tall barriers arranged at various heights relative to a floor. The red line m arks the
0.4m cutoff. Measuring distance from floor to barrier top is -0.2, 0.0, 0.2, 0.4, 0.6, 1.0,
1.3, 1.7.
The resulting obstacle m ap show s the first and last barriers are below and above the cutoff. The
5th barrier has top and bottom beyond the cutoff so only the w alls are included.
Notes on barrier geometry
© 2015 Oasys Software Limited
91
MassMotion
Barrier objects can be 3D volumes or 2D planes.
Barriers can have a large impact on the time it takes to compile a simulation. Barriers that contain
a large number of faces can take a long time to project onto the floor obstacle maps. Similarly, if
an obstacle contains faces over a large area, then many floors will have to consider to the barrier
when generating their maps.
Barriers must not completely block off links or portals on the same floor. Doing so may result in a
large number of agents removed by error during simulation. If dividing the floor into unconnected
areas is necessary, use separate floors for each area instead.
Properties
There are no properties for objects of this type.
4.3.1.3
Dispatch
Dispatch objects connect servers together into process chains and distribute agents across server
inputs.
Dispatch objects are automatically created by connecting server entry and exit points together in the
"Edit process chains" mode. Please refer to the overview of Process Chains for more information on
how to connect server objects. The location of dispatch objects has no effect on the
movement of agents.
A dispatch connecting tw o sources
and tw o sinks
Dispatch Properties
Assign Type
Defines the method used to distribute agents to downstream servers:
Assign to smallest queue: agents will be sent to the server with the
smallest queue (absolute count, not proportional) in the downstream set
Assign randomly: agents will be sent to a randomly determined server in
the downstream set. Only servers with unused capacity will be considered
for selection.
Note that token based restrictions on server access will be respected for all
92
© 2015 Oasys Software Limited
MassMotion
assignment methods.
4.3.1.4
Sources
The list of connected upstream servers which feed into this dispatch.
Sources can be added or removed using the multi-object chooser in the
Dispatch properties page or via the connect and disconnect functions in the
"Edit process chains" mode in the main application window.
Sinks
The list of connected downstream servers to which agents will be
dispatched.Sinks can be added or removed using the multi-object chooser
in the Dispatch properties page or via the connect and disconnect functions
in the "Edit process chains" mode in the main application window.
Escalator
Escalators are a vertical connection object. Unlike other connection objects, escalators must be
unidirectional. They are most typically used to model real world escalators, but can be made fully
horizontal to simulate moving walkways. The default new escalator is 4m tall, 7m long, and 1m wide,
with 0.5m landings at each end where the ball connection will be at the bottom and the box
connection will be at the top.
A change in elevation results in an additional vertical cost during agent route selection, however,
escalators are less costly to traverse than stairs or ramps.
An upw ards escalator.
Restrictions on Geometry
The escalator object itself should not include any handrails or other geometry that extends above
the walkable surface. If these are desired, they should be added as separate barrier objects.
The escalator must have a flat landing area at each end; this should be at least 0.5m by 0.5m to
allow construction of valid goal lines. Landings should be flat and approximately rectangular or
trapezoidal.
The geometry (including the landings) may have thickness, but only the top surface will be
considered during the simulation.
In order to run a simulation, the escalator landings must be placed such that each goal line is
between 0.01m and 0.20m above a floor, at least 0.20m from the edge of the floor. The two floors
must be different (an escalator cannot be used to connect two portions of the same floor).
© 2015 Oasys Software Limited
93
MassMotion
Impact on Agent Speed
Agent speed is modified to be exactly equal to the average speed as specified in the escalator
properties.
Properties
General Tab
Direction
Defines the direction of the escalator. Escalators are always unidirectional
(ie. either Ball to Box or Box to Ball).
Costs: Distance
added
Defines any distance penalty or modified cost to be added to the escalator.
A positive value will add a distance (and hence make the route less
desirable for agents), and a negative value will remove a distance. Distance
is measured in metres. See Agent Navigation for more information.
Costs: Queue
multiplier
Increases the penalty for queuing. A higher number will increase the
perceived time cost of queuing making agents more likely to seek alternate
options when there is queuing. See Agent Navigation for more information.
Physical: Map
Resolution
Determines the resolution of surface maps created for agent navigation.
Smaller values describe escalator and barrier edges more accurately
resulting in more precise walkable area definitions, but increase memory
and processing requirements during simulation.
Physical: Effective
Width
Defines how the width of the escalator's connections is calculated. The
width is used to calculate queue times (how long it will take for a queue of
agents to clear) and controlled flow if using people/minute/metre.
Calculate from Geometry: The default setting where the width (m) is
calculated from the vertices of the escalator edges.
Specify Manually: Allows the effective width (m) of both the box and ball
connections to be set to specific values.
Tread Speed
Defines the speed of the escalator along the incline, measured in metres
per second.
Access Tab
Gate: Enable use
as gate
Configures the object as a gate, closing the objects to all agents unless
explicitly opened through events (see Open Gate Event).
Gate: Wait style:
Sets the behaviour of agents waiting for the escalator when the gate is
closed.
Stand Still: Agents will stop moving after stepping onto a floor connected
to the escalator.
Spread Out: Agents will spread out on the floor after stepping onto a floor
connected to the escalator.
Focus On Target: Agents will move to and wait by the escalator.
Gate: Cost of
waiting
94
Sets the penalty (in seconds) for agents waiting. If this penalty is too high
agents will seek alternative routes to their goal. See Agent Navigation for
more information.
© 2015 Oasys Software Limited
MassMotion
Gate: Commit to
wait
Sets whether agents will commit to the gate once it has been chosen.
When checked agents will wait for this object regardless of changes in
route costs elsewhere on the floor.
Limit Flow: Cap
flow of entering
agents
When enabled, the flow of entering agents is not permitted to exceed the
specified rate. If demand exceeds capacity, agents are held at the goal
line until there is available capacity.
Limit Flow: Rate
type
Sets whether the flow rate is calculated as people/minute or people/minute/
metre.
If using people/minute/metre, the effective width (general tab property) is
used.
Limit Flow: Max
rate
Sets the maximum flow rate. Flow rate will be measured according to the
rate type shown above.
Agent Behaviour
tab
Delay On Enter
Sets how long an agent will be delayed before stepping onto an escalator.
This can be set as a distribution in seconds, see Single Value Distributions
for more information.
If an escalator is gated and closes before the delay finishes, the agent will
wait until the next time the escalator opens before attempting to step on
again.
Delay On Exit
Sets how long an agent will be delayed before stepping off an escalator.
This can be set as a distribution in seconds, see Single Value Distributions
for more information.
Traversal: Walk
type
Defines the manner in which agents will cross the escalator.
Standard: Agents will consider other agents, barriers, and personal speed
characteristics to calculate their trajectories.
Ignore Barriers: As above with the exception that agents will ignore any
barriers on the surface. This is the default for escalators.
Virtual: Agents will move instantly across the surface to their intended
goal, ignoring all obstructions on the surface. Commonly used for areas of
a simulation environment where the agent route choices are important but
crowding characteristics are not important.
Body Radius: Set
agent radius
If enabled the body radius for all agents on the surface will be changed to
the specified value. This can be useful in areas where crowding conditions
are governed by geometric or behavioural conditions outside of normal open
space standards. Agents approaching the escalator will slowly (over a
range of 2-3m) transition to the new radius to avoid instantaneous changes.
This setting should be used with caution as a) it applies to all agents
regardless of their profile settings, and b) agent movement has only been
validated for radius values close to 0.25m.
Body Radius:
Radius
Sets the agent radius in metres.
© 2015 Oasys Software Limited
95
MassMotion
Collections Tab
4.3.1.5
Bank
The bank which the escalator is a member of, if any. For more information,
see Banks.
Perimeters
Perimeters which the escalator is a member of, if any. For more
information, see Perimeters.
Floor
Floors are the most fundamental object types in a MassMotion environment. Floor objects are
contiguous polygon mesh surfaces that define the extent of a "walkable" area. An agent's awareness
of other agents, barriers, and route options is based on the floor on which they are standing. Most
other scene objects must be connected to floor objects (portals, links, stairs, ramps, escalators).
The default new floor is a 10m x 10m flat square.
A floor
Restrictions on Geometry
Floors may have thickness, although only the top surface will be considered during simulation.
The floor surface must not overlap itself (the entire top surface of the floor must be visible from
above).
The floor surface should be continuous (a single floor should not have two or more disconnected
parts) but may have holes.
Floors must have dimensions of at least 2 agent widths by 2 agent widths (by default 1m x 1m).
There is no maximum size for floors, however users should consider subdividing large (>10,000m2)
floors into logical areas.
The floor surface is not required to be flat, but elevation changes are not considered for Agent
Movement, speed calculations, or Agent Navigation.
If connected objects are completely separated by barriers on the floor, it is more appropriate to
separate the floor into two separate floors. Agents attempting to traverse a floor between two links
completely separated by a barrier will be removed from the simulation with an error.
Impact on Agent Speed
By default, agent speed is unaffected by floor traversal. Speed can be capped at a specific value by
96
© 2015 Oasys Software Limited
MassMotion
enabling the 'Limit Speed' property. See Agent Profile for information on agent speed.
Properties
General Tab
Costs: Distance
added
Defines any distance penalty or modified cost to be added to the floor. A
positive value will add a distance (and hence make the route less desirable
for agents), and a negative value will remove a distance. Distance is
measured in metres.
Physical: Map
resolution
Determines the resolution of surface maps created for agent navigation.
Smaller values describe floor and barrier edges more accurately resulting in
more precise walkable area definitions, but increase memory and
processing requirements during simulation.
Agent Behaviour Tab
Traversal: Walk
type
Defines the manner in which agents will cross the floor.
Standard: Agents will consider other agents, barriers, and personal speed
characteristics to calculate their trajectories. This is the default for floors.
Ignore Barriers: As above with the exception that agents will ignore any
barriers on the surface. Used mainly for connection objects (links, stairs,
escalators, ramps).
Virtual: Agents will move instantly across the surface to their intended
goal, ignoring all obstructions on the surface. Commonly used for areas of
a simulation environment where the agent route choices are important but
crowding characteristics are not important.
Body Radius: Set
agent radius
If enabled the body radius for all agents on the surface will be changed to
the specified value. This can be useful in areas where crowding conditions
are governed by geometric or behavioural conditions outside of normal open
space standards. Agents approaching the floor will slowly (over a range of
2-3m) transition to the new radius to avoid instantaneous changes. This
setting should be used with caution as a) it applies to all agents regardless
of their profile settings, and b) agent movement has only been validated for
radius values close to 0.25m.
Body Radius:
Radius
Sets the agent radius in metres.
Direction Bias:
Set agent
direction bias
If enabled, the direction bias of agents on the surface will be changed to
the specified value. This can be useful for corners or narrow spaces where
the natural system wide direction bias is locally inappropriate. See Agent
Profile for more information on Direction Bias.
Direction Bias:
Direction
Sets which direction agents will prefer to move.
Speed Limit: Cap
agent speed
Enables a maximum threshold for agent speed. Agents traveling above the
specified maximum will have their speed reduced to the maximum.
Speed Limit:
Maximum
Sets the maximum speed in metres per second.
© 2015 Oasys Software Limited
97
MassMotion
Collections Tab
Zones
4.3.1.6
Zones which the floor is a member of, if any. For more information, see
Zones.
Link
Links are the most basic type of connection object. They act as bridges or doors through which
agents may pass from one floor to the other. The default new link is a 1m x 2m flat rectangle.
Links will ignore changes in elevation and do not add any vertical route costs.
A series of gated links w ith priority flow enabled.
Restrictions on Geometry
In order to support properly formed goal lines, geometry used for links should be very close to flat
and approximately quadrilateral (a rectangle, trapezoid or parallelogram) although they may consist
of a large number of individual triangles. The link must be placed such that each goal line is between
0.01m and 0.20m above a floor, at least 0.20m from the edge of the floor. The two floors must be
different (a link cannot be used to connect two portions of the same floor). Links must be at least
0.4m wide to allow proper generation of goal lines.
Impact on Agent Speed
By default, agent speed is unaffected by link traversal. Speed can be capped at a specific value
through enabling the 'Limit Speed' property. See Agent Profile for information on agent speed.
Properties
General Tab
Direction
Sets the direction in which agents can traverse the link.
Two way: Agents may cross in both directions
Unidirectional (ie. Ball to Box or Box to Ball): Agents may only cross
in the specified direction.
Costs: Distance
added
98
Defines any distance penalty or modified cost to be added to the link. A
positive value will add a distance (and hence make the route less desirable
for agents), and a negative value will remove a distance. Distance is
measured in metres. See Agent Navigation for more information.
© 2015 Oasys Software Limited
MassMotion
Costs: Queue
multiplier
Increases the penalty for queuing. A higher number will increase the
perceived time cost of queuing, which makes agents more likely to select
alternative routes. See Agent Navigation for more information.
Physical: Map
resolution
Determines the resolution of surface maps created for agent navigation.
Smaller values describe link and barrier edges more accurately resulting in
more precise walkable area definitions, but increase memory and
processing requirements during simulation.
Physical: Effective
width
Defines how the width of the link's connections is calculated. The width is
used to calculate queue times (how long it will take for a queue of agents
to clear) and controlled flow if using people/minute/metre.
Calculate from Geometry: The default setting where the width (m) is
calculated from the vertices of the link edges.
Specify Manually: Allows the effective width (m) of both the box and ball
connections to be set to specific values.
Access Tab
Gate: Enable use
as gate
Configures the object as a gate, closing the objects to all agents unless
explicitly opened through events (see Open Gate Event).
Gate: Wait style:
Sets the behaviour of agents waiting for the link when the gate is closed.
Stand Still: Agents will stop moving after stepping onto a floor connected
to the link.
Spread Out: Agents will spread out on the floor after stepping onto a floor
connected to the link.
Focus On Target: Agents will move to and wait by the link.
Gate: Cost of
waiting
Sets the penalty (in seconds) for agents waiting. If this penalty is too high
agents will seek alternative routes to their goal. See Agent Navigation for
more information.
Gate: Commit to
wait
Sets whether agents will commit to the gate once it has been chosen.
When checked agents will wait for this object regardless of changes in
route costs elsewhere on the floor.
Limit Flow: Cap
flow of entering
agents
When enabled, the flow of entering agents is not permitted to exceed the
specified rate. If demand exceeds capacity, agents are held at the goal
line until there is available capacity.
Limit Flow: Rate
type
Sets whether the flow rate is calculated as people/minute or people/minute/
metre.
If using people/minute/metre, the effective width (general tab property) is
used.
Limit Flow: Max
rate
Sets the maximum flow rate. Flow rate will be measured according to the
rate type shown above.
Priority: Enable
priority access
Enables a limited yield system where agents moving in one direction
receive preferential access. This is useful for constrained geometry where
the majority of the flow is in one direction, or for cases such as train doors
© 2015 Oasys Software Limited
99
MassMotion
where alighting passengers often have priority over those boarding.
Priority: Primary
direction
Sets the direction in which agents will have primary access. The counterflow direction will yield.
One way (Ball to Box or Box to Ball): Agents moving in the counter-flow
direction will not enter the object when there are agents moving in the
priority direction with priority access. If Primary will yield is set, agents
traveling in the primary direction will yield if they arrive at the object while it
is already being used by agents in the counter-flow direction. This is useful
for scenarios such as ladders where usage should be restricted to one
direction at a time.
Two way: Agents in either direction can claim priority access. Priority
access is maintained for a given direction until there are no more agents
crossing in that direction.
Priority: Capture
range
Sets the distance in metres from which agents approaching the object can
capture priority access.
Priority: Move
aside
When enabled, agents in the counter-flow direction will move aside to
accommodate the priority flow.
Priority: Cost of
waiting
Sets the penalty (in seconds) for agents waiting. If this penalty is too high
agents will seek alternative routes to their goal. See Agent Navigation for
more information.
Priority: Commit
to wait
When enabled, agents that have chosen the object will continue to wait
until they have access regardless of changes to costs in other routes on
the floor.
Agent Behaviour tab
Delay On Enter
Sets how long an agent will be delayed before stepping onto a link. This
can be set as a distribution in seconds, see Single Value Distributions for
more information.
If a link is gated and closes before the delay finishes, the agent will wait
until the next time the link opens before attempting to step on again.
Delay On Exit
Sets how long an agent will be delayed before stepping off a link. This can
be set as a distribution in seconds, see Single Value Distributions for more
information.
Traversal: Walk
type
Defines the manner in which agents will cross the link.
Standard: Agents will consider other agents, barriers, and personal speed
characteristics to calculate their trajectories.
Ignore Barriers: As above with the exception that agents will ignore any
barriers on the surface. Used mainly for connection objects (links, stairs,
escalators, ramps).
Virtual: Agents will move instantly across the surface to their intended
goal, ignoring all obstructions on the surface. Commonly used for areas of
a simulation environment where the agent route choices are important but
crowding characteristics are not important.
100
© 2015 Oasys Software Limited
MassMotion
Body Radius: Set
agent radius
If enabled the body radius for all agents on the surface will be changed to
the specified value. This can be useful in areas where crowding conditions
are governed by geometric or behavioural conditions outside of normal open
space standards. Agents approaching the link will slowly (over a range of 23m) transition to the new radius to avoid instantaneous changes. This
setting should be used with caution as a) it applies to all agents regardless
of their profile settings, and b) agent movement has only been validated for
radius values close to 0.25m.
Body Radius:
Radius
Sets the agent radius in metres.
Direction Bias:
Set agent
direction bias
If enabled, the direction bias of agents on the surface will be changed to
the specified value. This can be useful for corners or narrow spaces where
the natural system wide direction bias is locally inappropriate. See Agent
Profile for more information on direction bias.
Direction Bias:
Direction
Sets which direction agents will move.
Speed Limit: Cap
agent speed
Enables a maximum threshold for agent speed. Agents traveling above the
specified maximum will have their speed reduced to the maximum.
Speed Limit:
Maximum
Sets the maximum speed in metres per second.
Collections Tab
4.3.1.7
Bank
The bank which the link is a member of, if any. For more information, see
Banks.
Perimeters
Perimeters which the link is a member of, if any. For more information,
see Perimeters.
Path
Paths are connection objects consisting of a simple curve. There are no restrictions on the shape of
the curve, and they may be vertical or even intersect themselves and other geometry.
The default new path is a 2m horizontal line segment. This line segment can be extended by
growing the end vertices, or splitting the edge into multiple pieces. See Editing Geometry for more
information on editing paths.
Agents can enter the curve at one end, follow along the curve in single file, and exit at the far end.
While on a curve agents will either move at their desired speed or follow immediately behind the
agent in front. Agents on the curve will ignore agents not following the curve or on the same curve but
moving in the opposite direction. Agents not on the curve will attempt to avoid agents on the curve.
Agents on a path will see each other as cylinders with a radius equal to their body radius. Agents
following behind another will maintain a "Queue Spacing" (set in Agent Behaviour) between the
© 2015 Oasys Software Limited
101
MassMotion
surfaces of the cylinders.
A path
Restrictions on Geometry:
A path must contain a single curve object.
Each end point of the curve must be positioned just above a separate floor.
There are no restrictions on the path described by the curve provided that it is continuous.
The final line segment at either end of the path should be roughly horizontal so as to produce valid
goal lines.
Impact on Agent Speed
By default, agent speed is unaffected by path traversal. Agents will slow down to follow an agent that
is immediately in front. Speed can be capped at a specific value through enabling the 'Limit Speed'
property. See Agent Profile for information on agent speed.
Properties
General Tab
Direction
Sets the direction in which agents can traverse the path.
Two way: Agents may cross in both directions
Unidirectional (ie. Ball to Box or Box to Ball): Agents may only cross
in the specified direction.
Costs: Distance
added
Defines any distance penalty or modified cost to be added to the path. A
positive value will add a distance (and hence make the route less desirable
for agents), and a negative value will remove a distance. Distance is
measured in metres. See Agent Navigation for more information.
Costs: Queue
multiplier
Increases the penalty for queuing. A higher number will increase the
perceived time cost of queuing, which makes agents more likely to select
alternative routes. See Agent Navigation for more information.
Physical: Effective
width
Paths are represented as lines, but the goal lines onto and off of the lines
still have width.
Defines how the width of the path's connections is calculated. The width is
used to calculate queue times (how long it will take for a queue of agents
102
© 2015 Oasys Software Limited
MassMotion
to clear) and controlled flow if using people/minute/metre.
Calculate from Geometry: The default setting where the width (m) is
calculated from the goal line width.
Specify Manually: Allows the effective width (m) of both the box and ball
connections to be set to specific values.
Access Tab
Gate: Enable use
as gate
Configures the object as a gate, closing the objects to all agents unless
explicitly opened through events (see Open Gate Event).
Gate: Wait style:
Sets the behaviour of agents waiting for the path when the gate is closed.
Stand Still: Agents will stop moving after stepping onto a floor connected
to the path.
Spread Out: Agents will spread out on the floor after stepping onto a floor
connected to the path.
Focus On Target: Agents will move to and wait by the path.
Gate: Cost of
waiting
Sets the penalty (in seconds) for agents waiting. If this penalty is too high
agents will seek alternative routes to their goal. See Agent Navigation for
more information.
Gate: Commit to
wait
Sets whether agents will commit to the gate once it has been chosen.
When checked agents will wait for this object regardless of changes in
route costs elsewhere on the floor.
Limit Flow: Cap
flow of entering
agents
When enabled, the flow of entering agents is not permitted to exceed the
specified rate. If demand exceeds capacity, agents are held at the goal
line until there is available capacity.
Limit Flow: Rate
type
Sets whether the flow rate is calculated as people/minute or people/minute/
metre.
If using people/minute/metre, the effective width (general tab property) is
used.
Limit Flow: Max
rate
Sets the maximum flow rate. Flow rate will be measured according to the
rate type shown above.
Priority: Enable
priority access
Enables a limited yield system where agents moving in one direction
receive preferential access. This is useful for constrained geometry where
the majority of the flow is in one direction, or for cases such as train doors
where alighting passengers often have priority over those boarding.
Priority: Primary
direction
Sets the direction in which agents will have primary access. The counterflow direction will yield.
One way (Ball to Box or Box to Ball): Agents moving in the counter-flow
direction will not enter the object when there are agents moving in the
priority direction with priority access. If Primary will yield is set, agents
traveling in the primary direction will yield if they arrive at the object while it
is already being used by agents in the counter-flow direction. This is useful
© 2015 Oasys Software Limited
103
MassMotion
for scenarios such as ladders where usage should be restricted to one
direction at a time.
Two way: Agents in either direction can claim priority access. Priority
access is maintained for a given direction until there are no more agents
crossing in that direction.
Priority: Capture
range
Sets the distance in metres from which agents approaching the object can
capture priority access.
Priority: Move
aside
When enabled, agents in the counter-flow direction will move aside to
accommodate the priority flow.
Priority: Cost of
waiting
Sets the penalty (in seconds) for agents waiting. If this penalty is too high
agents will seek alternative routes to their goal. See Agent Navigation for
more information.
Priority: Commit
to wait
When enabled, agents that have chosen the object will continue to wait
until they have access regardless of changes to costs in other routes on
the floor.
Agent Behaviour tab
Queue Spacing
This determines how closely each agent will follow a previous agent. This
can be set as a distribution in metres, see Single Value Distributions for
more information.
Delay On Enter
Sets how long an agent will be delayed before stepping onto a path. This
can be set as a distribution in seconds, see Single Value Distributions for
more information.
If a path is gated and closes before the delay finishes, the agent will wait
until the next time the path opens before attempting to step on again.
Delay On Exit
Sets how long an agent will be delayed before stepping off an path. This
can be set as a distribution in seconds, see Single Value Distributions for
more information.
Traversal: Walk
type
Defines the manner in which agents will cross the path.
Standard: Agents will consider other agents, barriers, and personal speed
characteristics to calculate their trajectories.
Ignore Barriers: Identical to 'Standard' for paths, as agents always ignore
barriers when traversing paths.
Virtual: Agents will move instantly to the other end of the path. When a
path is virtual, route distance calculations ignore the internal geometry of
the path and measure the straight line distance between the two path end
points.
Body Radius: Set
agent radius
104
If enabled the body radius for all agents on the surface will be changed to
the specified value. This can be useful in areas where crowding conditions
are governed by geometric or behavioural conditions outside of normal open
space standards. Agents approaching the path will slowly (over a range of
2-3m) transition to the new radius to avoid instantaneous changes. This
setting should be used with caution as a) it applies to all agents regardless
© 2015 Oasys Software Limited
MassMotion
of their profile settings, and b) agent movement has only been validated for
radius values close to 0.25m.
Body Radius:
Radius
Sets the agent radius in metres.
Agents on a path will see each other as cylinders with a radius equal to
their body radius and will maintain a space between each other set by their
"Queue Spacing".
Speed Limit: Cap
agent speed
Enables a maximum threshold for agent speed.
Speed Limit:
Maximum
Sets the maximum speed in metres per second. Agents traveling above the
specified maximum will have their speed reduced to the maximum.
Collections Tab
4.3.1.8
Bank
The bank which the path is a member of, if any. For more information, see
Banks.
Perimeters
Perimeters which the path is a member of, if any. For more information,
see Perimeters.
Portal
Portals act as both entrances and destinations for agents in the simulation. All portals can serve as
an entrance, specified through agent creation events. Portals are by default also enabled as
destinations, allowing agents to seek them as intermediate destinations or final simulation exits.
Destination portals require additional time to initialize during simulations. If simulation initialization is
too time consuming, consider changing some portals into "Entrance Only".
A portal
Restrictions on Geometry
Portals must be flat.
Portals must be approximately rectangular or trapezoidal, to allow proper construction of the goal
line.
Portals must be positioned between 0.01m and 0.2m above a floor and no closer than 0.2m to a
floor edge.
© 2015 Oasys Software Limited
105
MassMotion
Properties
General Tab
General:
Type
How events and agents will interact with the portal.
Entrance and Destination: Agents may enter and exit the simulation at this
portal as well as use it as a waypoint.
Entrance Only: Agents may enter the simulation at this portal, but may not use
it as a destination or waypoint.
4.3.1.9
Agent
Placement:
Distribute
Defines how newly created agents are placed in the simulation environment.
Agent
Placement:
Start Angle
Measured in degrees. Defines the orientation of the agents when they enter the
simulation environment. This angle is visually represented by a triangle
decoration on the portal's spawn line.
Along Spawn Line: Agents appear randomly distributed on the longest midline
of the planar, rectangular portal geometry.
Inside Portal: Agents appear randomly distributed inside the planar, rectangular
boundary of the portal geometry.
On Floor: Agents appear randomly distributed inside the planar, rectangular
boundary of the floor beneath the portal. Agents will only appear in valid
unobstructed regions of the floor, but may appear on top of existing agents in
areas of high density.
Ramp
Ramps are connection objects that represent inclined surfaces and are used to connect two floors
that are at different elevations. This change in elevation results in an additional vertical cost during
agent route selection and can have an impact on agent speed during traversal. Ramps are less
costly to traverse than stairs, but more costly than escalators.
A ram p
Restrictions on Geometry
The ramp object itself should not include any handrails or other geometry that extends above the
walkable surface. If these are desired, they should be added as separate Barrier objects.
The ramp must have a flat landing area at each end; this should be at least 0.5m by 0.5m to allow
construction of valid goal lines. Landings should be approximately rectangular or trapezoidal.
106
© 2015 Oasys Software Limited
MassMotion
The geometry (including the landings) may have thickness, but only the top surface will be
considered during the simulation.
In order to run a simulation, the ramp landings must be placed such that each goal line is between
0.01m and 0.20m above a floor, at least 0.20m from the edge of the floor. The two floors must be
different (a ramp cannot be used to connect two portions of the same floor).
Impact on Agent Speed
By default, agent speed is modified as a function of the ramp angle and direction of travel (see table
below). Speed can also be capped at a specific value through enabling the 'Limit Speed' properties.
See Agent Profile for information on agent speed.
Direction of Travel
Angle X (degrees)
Percentage of Natural Speed
Up
0 < X< 5
100
Up
5 <= X < 10
88.5
Up
10 <= X <= 20
Interpolated between 88.5 and
75
Up
20 < X
75
Down
Any
100
Properties
General Tab
Direction
Sets the direction in which agents can traverse the ramp.
Two way: Agents may cross in both directions
Unidirectional (ie. Ball to Box or Box to Ball): Agents may only cross
in the specified direction.
Costs: Distance
added
Defines any distance penalty or modified cost to be added to the ramp. A
positive value will add a distance (and hence make the route less desirable
for agents), and a negative value will remove a distance. Distance is
measured in metres. See Agent Navigation for more information.
Costs: Queue
multiplier
Increases the penalty for queuing. A higher number will increase the
perceived time cost of queuing, which makes agents more likely to select
alternative routes. See Agent Navigation for more information.
Physical: Map
resolution
Determines the resolution of surface maps created for agent navigation.
Smaller values describe ramp and barrier edges more accurately resulting
in more precise walkable area definitions, but increase memory and
processing requirements during simulation.
Physical: Effective
width
Defines how the width of the stair's connections is calculated. The width is
used to calculate queue times (how long it will take for a queue of agents
to clear) and controlled flow if using people/minute/metre.
Calculate from Geometry: The default setting where the width (m) is
© 2015 Oasys Software Limited
107
MassMotion
calculated from the vertices of the ramp edges.
Specify Manually: Allows the effective width (m) of both the box and ball
connections to be set to specific values.
Access Tab
Gate: Enable use
as gate
Configures the object as a gate, closing the objects to all agents unless
explicitly opened through events (see Open Gate Event).
Gate: Wait style:
Sets the behaviour of agents waiting for the ramp when the gate is closed.
Stand Still: Agents will stop moving after stepping onto a floor connected
to the ramp.
Spread Out: Agents will spread out on the floor after stepping onto a floor
connected to the ramp.
Focus On Target: Agents will move to and wait by the ramp.
Gate: Cost of
waiting
Sets the penalty (in seconds) for agents waiting. If this penalty is too high
agents will seek alternative routes to their goal. See Agent Navigation for
more information.
Gate: Commit to
wait
Sets whether agents will commit to the gate once it has been chosen.
When checked agents will wait for this object regardless of changes in
route costs elsewhere on the floor.
Limit Flow: Cap
flow of entering
agents
When enabled, the flow of entering agents is not permitted to exceed the
specified rate. If demand exceeds capacity, agents are held at the goal
line until there is available capacity.
Limit Flow: Rate
type
Sets whether the flow rate is calculated as people/minute or people/minute/
metre.
If using people/minute/metre, the effective width (general tab property) is
used.
Limit Flow: Max
rate
Sets the maximum flow rate. Flow rate will be measured according to the
rate type shown above.
Priority: Enable
priority access
Enables a limited yield system where agents moving in one direction
receive preferential access. This is useful for constrained geometry where
the majority of the flow is in one direction, or for cases such as train doors
where alighting passengers often have priority over those boarding.
Priority: Primary
direction
Sets the direction in which agents will have primary access. The counterflow direction will yield.
One way (Ball to Box or Box to Ball): Agents moving in the counter-flow
direction will not enter the object when there are agents moving in the
priority direction with priority access. If Primary will yield is set, agents
traveling in the primary direction will yield if they arrive at the object while it
is already being used by agents in the counter-flow direction. This is useful
for scenarios such as ladders where usage should be restricted to one
direction at a time.
108
© 2015 Oasys Software Limited
MassMotion
Two way: Agents in either direction can claim priority access. Priority
access is maintained for a given direction until there are no more agents
crossing in that direction.
Priority: Capture
range
Sets the distance in metres from which agents approaching the object can
capture priority access.
Priority: Move
aside
When enabled, agents in the counter-flow direction will move aside to
accommodate the priority flow.
Priority: Cost of
waiting
Sets the penalty (in seconds) for agents waiting. If this penalty is too high
agents will seek alternative routes to their goal. See Agent Navigation for
more information.
Priority: Commit
to wait
When enabled, agents that have chosen the object will continue to wait
until they have access regardless of changes to costs in other routes on
the floor.
Agent Behaviour tab
Delay On Enter
Sets how long an agent will be delayed before stepping onto an ramp. This
can be set as a distribution in seconds, see Single Value Distributions for
more information.
If a ramp is gated and closes before the delay finishes, the agent will wait
until the next time the ramp opens before attempting to step on again.
Delay On Exit
Sets how long an agent will be delayed before stepping off a ramp. This
can be set as a distribution in seconds, see Single Value Distributions for
more information.
Traversal: Walk
type
Defines the manner in which agents will cross the ramp.
Standard: Agents will consider other agents, barriers, and personal speed
characteristics to calculate their trajectories. Most like the real world.
Ignore Barriers: As above with the exception that agents will ignore any
barriers on the surface. Used mainly for connection objects (links, stairs,
escalators, ramps).
Virtual: Agents will move instantly across the surface to their intended
goal, ignoring all obstructions on the surface. Commonly used for areas of
a simulation environment where the agent route choices are important but
crowding characteristics are not important.
Body Radius: Set
agent radius
If enabled the body radius for all agents on the surface will be changed to
the specified value. This can be useful in areas where crowding conditions
are governed by geometric or behavioural conditions outside of normal open
space standards. Agents approaching the ramp will slowly (over a range of
2-3m) transition to the new radius to avoid instantaneous changes. This
setting should be used with caution as a) it applies to all agents regardless
of their profile settings, and b) agent movement has only been validated for
radius values close to 0.25m.
Body Radius:
Sets the agent radius in metres.
© 2015 Oasys Software Limited
109
MassMotion
Radius
Direction Bias:
Set agent
direction bias
If enabled, the direction bias of agents on the surface will be changed to
the specified value. This can be useful for corners or narrow spaces where
the natural system wide direction bias is locally inappropriate. See Agent
Profile for more information on Direction Bias.
Direction Bias:
Direction
Sets which direction agents will move.
Speed Limit: Cap
agent speed
Enables a maximum threshold for agent speed.
Speed Limit: Up
Sets the maximum upward speed in metres per second.
Speed Limit:
Down
Sets the maximum downward speed in metres per second.
Collections Tab
Bank
The bank which the ramp is a member of, if any. For more information, see
Banks.
Perimeters
Perimeters which the ramp is a member of, if any. For more information,
see Perimeters.
4.3.1.10 Reference Geometry
When a geometry file is imported using the 'Scene' tab of the main window's ribbon, each individual
object within the file is placed in the scene as a reference geometry object. These objects have no
impact on simulation and other types of scene objects must be created from them before use. The
"Use to Generate" sub-menu available when right clicking reference geometry can be used to do
this. Using a reference geometry object to generate another object will hide the reference geometry
and mark it as used. Unused reference geometry can be found via the list view by filtering for
"Unused Imports".
Alternatively, sub-sections of reference geometry can be used to generate separate scene objects.
This can be done by entering face selection mode, selecting the desired faces and right clicking
them to create new objects. In this case, reference geometry should be marked as used manually.
Reference geometry cannot be edited, although individual reference geometry objects can be deleted
after importing a file. Instead, a reference model object is created on import which contains all of a
file's reference geometry. The reference model can be scaled, rotated and translated to match the
MassMotion model's coordinates.
Supported File Formats
The following files can be imported:
3DStudio (.3ds)
Collada (.dae)
AutoCAD Drawing Exchange Format (.dxf)
FBX (.fbx)
Industry Foundation Classes (.ifc)
110
© 2015 Oasys Software Limited
MassMotion
Wavefront (.obj)
IFC files contain additional information about their geometry and create IFC specific types of
reference geometry. These can be used to automatically generate a corresponding scene object
shown in the table below.
All other file formats produce "Generic Reference Geometry".
IFC Type
Automatically Generated MassMotion Type
Wall, Wall Standard Case, Railing, Column,
Furnishing Element
Barrier
Escalator, Moving Walkway
Escalator
Space, Landing Slab
Floor
Door
Link
Stair, Stair Flight
Stair
Element, Floor Slab, Base Slab, Unrecognized
Slab, Elevator, Unrecognized Transport
Element, Plate, Building Element Proxy
None - must be explicitly specified
Properties
There are no properties for objects of this type.
4.3.1.11 Server
Servers model queuing behaviour and more complex interactions between agents and their
environments.
A server is used for process modeling and is the basic building block of process chains. Each server
has a conceptual entry point (green triangle) through which agents enter, and an exit point (blue
square) through which agents leave the server. If the server has a process time other than zero,
agents will be processed and held at the exit point for the specified duration. Server ports can be
grouped together or connected to other ports to form process chains. For more information on
process modeling and process chains see the introduction to Process Chains.
© 2015 Oasys Software Limited
111
MassMotion
Server object
To create a server use the "Server" button on the Scene tab of the main application window or right
click in a 3D view and select Create-> Scene-> Server. Like Paths the default new server is a 2m
horizontal line segment. This line segment can be extended by growing the end vertices, or splitting
the edge into multiple pieces. See Editing Geometry for more information.
Approach
Agents will only approach a server that has available capacity as defined by the input buffer
capacity. If an agent has chosen to use a server and there is no available capacity, the agent will
stand in place until space becomes available. Once there is capacity, the agent is registered with
the input buffer (regardless of whether or not it has reached the buffer line) and approaches the
processor according to the approach type (see the "General" properties below). Once the agent is
within close range of the processor it becomes available for processing. If there is no available
processor capacity, agents that are ready for processing will stand in place until there is capacity.
Processing
When the agent begins processing it is removed from the input buffer, freeing up space for agents
that would like to approach the server. The processor may process multiple agents at one time
according to the processor capacity. The amount of time spent processing each agent is based on
the server's contact time. There is a common contact time distribution that is the default for all
agents. Additional distributions can be specified by token. If an agent holds one of the given tokens
the agent will use the corresponding distribution instead of the common distribution. See the
"General" properties below for more information on contact time.
After Processing
Once processed, an agent is ready to leave the server. What happens next depends on the
situation:
112
© 2015 Oasys Software Limited
MassMotion
Server is the end of The agent finishes the 'Seek Process' task
a process chain
and continues with its next task.
Server is in the
middle of a process
chain and there is
downstream
capacity
Server is in the
middle of a process
chain and there is
no downstream
capacity
The agent approaches the next server in
the chain.
The agent is held in place until there is
available downstream capacity (possibly
blocking access to the current processor).
Filtering by Token
A server can be configured to give exclusive or preferential access to agents based on whether or not
they hold a specific token. Servers that require a specific token will only accept agents that hold the
token. Servers that prefer a specific token will accept any agent, but when given a choice will
always choose an agent that holds the preferred token.
If an agent is sent to a group of servers that require tokens that the agent does not have, the agent
will be removed from the simulation and the error logged.
If two servers are grouped and the first server is configured to ignore tokens while the second is
configured to prefer or require a token, all agents holding that token will be sent to the second server,
regardless of available capacity in the first. Only once the second server has reached capacity will
agents with the preferred or required token ever consider the first server.
Example: Use of required and preferred is typical of an airport check-in system, where the economy
class and business class status is determined by possession of an economy or business token.
The economy and business accumulator queues would require their respective tokens, while the
check-in desks would prefer the same tokens. While the business queue would be restricted to
agents holding the business token, the business check-in desk would be willing to accept economy
token holders in the event that the business queue was empty.
Notes on server geometry
A server must contain a single curve object (even when the approach type is set to 'Ignore Line').
All points on the curve must be just above the same floor object.
Server ports can only be grouped with or connected to other servers that are on the same floor.
Properties
General Tab
Approach Type
© 2015 Oasys Software Limited
Use Line: Enter At Start: Agents approaching the server will move across
the floor towards the beginning of the buffer line (identified by the entrance
arrow) and then move along the line until they reach the processing end.
Agents will move in single file along the curve following behind the agent in
front. Only the agent at the front of the line can be processed. In the case
where the line become full, new agents will continuously try to board the
line, clustering around the line entrance.
113
MassMotion
Ignore Line: Agents will ignore the buffer line and head across the floor
directly to the processing end of the server (identified by the box). They
will begin processing as soon as they reach the box, assuming there is
available processing capacity.
Capacity
Defines the maximum number of agents accepted by the server (not
counting those being processed).
Infinite: there is no constraint placed on the number of agents accepted
by the server. All agents are free to approach.
Finite: The server will only accept a certain number of new agents based
on the input buffer's available capacity. Agents will not be permitted to
approach the server until there is available capacity. The available capacity
is calculated as:
"Available Capacity" = "Max Capacity" - "Count of Agents Waiting to be
Processed"
Agent Spacing
Distribution
The minimum distance between two agents on the path. Each agent will
be given a target minimum distance according to this distribution, and will
always stay at least that distance back from the agent in front.
Token Access
Ignore Token: Server accepts all agents.
Prefer Token: Server accepts all agents, but given a choice will always
choose the agent holding the specified token.
Require Token: Server will only accept agents holding the specified
token.
Consume token check box indicates if the token will be removed from the
agent after entering the server object.
Contact Time
Defines the length of time taken to process an agent. This is the default
contact time that is applied to all agents that do not hold one of the tokens
specified by the optional contact time by token entries.
Optional Contact
Times By Token
Additional specialized contact times. If an agent holds one of the specified
tokens, the corresponding contact time is used. If the agent does not hold
any of the tokens or no tokens are specified, the default contact time is
used. In the case where an agent holds multiple defined tokens, one of the
token based contact times is used, but the process of selection is
undefined.
Actions Tab
Finished
Processing
114
The specified action is applied to each agent immediately after it has
finished being processed. In the case where the server is connected to
other downstream servers and the agent is held in place for lack of
downstream capacity, the action is still applied after processing (contact
© 2015 Oasys Software Limited
MassMotion
time) regardless of whether or not the agent is free to move on to the next
server.
Connections Tab
Source
If the server is connected to an upstream Dispatch object it will be listed
here. A source Dispatch can be removed, replaced or added here. Servers
can only be connected to one source dispatch at a time.
Sink
If the server is connected to an downstream Dispatch object it will be listed
here. A sink Dispatch can be removed, replaced or added here. Servers
can only be connected to one sink dispatch at a time.
4.3.1.12 Stair
Stairs are connection objects used to connect two floors that are at different elevations. This change
in elevation results in an additional vertical cost during agent route selection and can have an impact
on agent speed during traversal. Stairs are more costly to traverse than escalators and ramps.
A stair
Restrictions on Geometry
The stair object itself should not include any handrails or other geometry that extends above the
walkable surface. If these are desired, they should be added as separate barrier objects.
The stair must have a flat landing area at each end; this should be at least 0.5m by 0.5m to allow
construction of valid goal lines. Landings should be approximately rectangular or trapezoidal.
The geometry (including the landings) may have thickness, but only the top surface will be
considered during the simulation.
In order to run a simulation, the stair landings must be placed such that each goal line is between
0.01m and 0.20m above a floor, at least 0.20m from the edge of the floor. The two floors must be
different (a stair cannot be used to connect two portions of the same floor).
Impact on Agent Speed
By default, agent speed is modified as a function of the stair angle and direction of travel (see table
© 2015 Oasys Software Limited
115
MassMotion
below). Speed can also be capped at a specific value through enabling the 'Limit Speed' properties.
See Agent Profile for information on agent speed.
Direction of Travel
Angle X (degrees)
Percentage of Natural Speed
Up
0 < X < 27
42.6
Up
27 <= X <= 32
Interpolated between 42.6 and
37.8
Up
32 < X
37.8
Down
0 < X < 27
57.4
Down
27 <= X <= 32
Interpolated between 57.4 and
49.8
Down
32 < X
49.8
Properties
General Tab
Direction
Sets the direction in which agents can traverse the stair.
Two way: Agents may cross in both directions
Unidirectional (ie. Ball to Box or Box to Ball): Agents may only cross
in the specified direction.
Costs: Distance
added
Defines any distance penalty or modified cost to be added to the stair. A
positive value will add a distance (and hence make the route less desirable
for agents), and a negative value will remove a distance. Distance is
measured in metres. See Agent Navigation for more information.
Costs: Queue
multiplier
Increases the penalty for queuing. A higher number will increase the
perceived time cost of queuing, which makes agents more likely to select
alternative routes. See Agent Navigation for more information.
Physical: Map
resolution
Determines the resolution of surface maps created for agent navigation.
Smaller values describe stair and barrier edges more accurately resulting in
more precise walkable area definitions, but increase memory and
processing requirements during simulation.
Physical: Effective
width
Defines how the width of the stair's connections is calculated. The width is
used to calculate queue times (how long it will take for a queue of agents
to clear) and controlled flow if using people/minute/metre.
Calculate from Geometry: The default setting where the width (m) is
calculated from the vertices of the stair edges.
Specify Manually: Allows the effective width (m) of both the box and ball
connections to be set to specific values.
Access Tab
116
© 2015 Oasys Software Limited
MassMotion
Gate: Enable use
as gate
Configures the object as a gate, closing the objects to all agents unless
explicitly opened through events (see Open Gate Event).
Gate: Wait style:
Sets the behaviour of agents waiting for the stair when the gate is closed.
Stand Still: Agents will stop moving after stepping onto a floor connected
to the stair.
Spread Out: Agents will spread out on the floor after stepping onto a floor
connected to the stair.
Focus On Target: Agents will move to and wait by the stair.
Gate: Cost of
waiting
Sets the penalty (in seconds) for agents waiting. If this penalty is too high
agents will seek alternative routes to their goal. See Agent Navigation for
more information.
Gate: Commit to
wait
Sets whether agents will commit to the gate once it has been chosen.
When checked agents will wait for this object regardless of changes in
route costs elsewhere on the floor.
Limit Flow: Cap
flow of entering
agents
When enabled, the flow of entering agents is not permitted to exceed the
specified rate. If demand exceeds capacity, agents are held at the goal
line until there is available capacity.
Limit Flow: Rate
type
Sets whether the flow rate is calculated as people/minute or people/minute/
metre.
If using people/minute/metre, the effective width (general tab property) is
used.
Limit Flow: Max
rate
Sets the maximum flow rate. Flow rate will be measured according to the
rate type shown above.
Priority: Enable
priority access
Enables a limited yield system where agents moving in one direction
receive preferential access. This is useful for constrained geometry where
the majority of the flow is in one direction, or for cases such as train doors
where alighting passengers often have priority over those boarding.
Priority: Primary
direction
Sets the direction in which agents will have primary access. The counterflow direction will yield.
One way (Ball to Box or Box to Ball): Agents moving in the counter-flow
direction will not enter the object when there are agents moving in the
priority direction with priority access. If Primary will yield is set, agents
traveling in the primary direction will yield if they arrive at the object while it
is already being used by agents in the counter-flow direction. This is useful
for scenarios such as ladders where usage should be restricted to one
direction at a time.
Two way: Agents in either direction can claim priority access. Priority
access is maintained for a given direction until there are no more agents
crossing in that direction.
Priority: Capture
range
Sets the distance in metres from which agents approaching the object can
capture priority access.
Priority: Move
When enabled, agents in the counter-flow direction will move aside to
© 2015 Oasys Software Limited
117
MassMotion
aside
accommodate the priority flow.
Priority: Cost of
waiting
Sets the penalty (in seconds) for agents waiting. If this penalty is too high
agents will seek alternative routes to their goal. See Agent Navigation for
more information.
Priority: Commit
to wait
When enabled, agents that have chosen the object will continue to wait
until they have access regardless of changes to costs in other routes on
the floor.
Agent Behaviour tab
Delay On Enter
Sets how long an agent will be delayed before stepping onto an stair. This
can be set as a distribution in seconds, see Single Value Distributions for
more information.
If a stair is gated and closes before the delay finishes, the agent will wait
until the next time the stair opens before attempting to step on again.
Delay On Exit
Sets how long an agent will be delayed before stepping off a stair. This can
be set as a distribution in seconds, see Single Value Distributions for more
information.
Traversal: Walk
type
Defines the manner in which agents will cross the stair.
Standard: Agents will consider other agents, barriers, and personal speed
characteristics to calculate their trajectories. Most like the real world.
Ignore Barriers: As above with the exception that agents will ignore any
barriers on the surface. Used mainly for connection objects (links, stairs,
escalators, ramps).
Virtual: Agents will move instantly across the surface to their intended
goal, ignoring all obstructions on the surface. Commonly used for areas of
a simulation environment where the agent route choices are important but
crowding characteristics are not important.
118
Body Radius: Set
agent radius
If enabled the body radius for all agents on the surface will be changed to
the specified value. This can be useful in areas where crowding conditions
are governed by geometric or behavioural conditions outside of normal open
space standards. Agents approaching the stair will slowly (over a range of
2-3m) transition to the new radius to avoid instantaneous changes. This
setting should be used with caution as a) it applies to all agents regardless
of their profile settings, and b) agent movement has only been validated for
radius values close to 0.25m.
Body Radius:
Radius
Sets the agent radius in metres.
Direction Bias:
Set agent
direction bias
If enabled, the direction bias of agents on the surface will be changed to
the specified value. This can be useful for corners or narrow spaces where
the natural system wide direction bias is locally inappropriate. See Agent
Profile for more information on Direction Bias.
Direction Bias:
Direction
Sets which direction agents will move.
© 2015 Oasys Software Limited
MassMotion
Speed Limit: Cap
agent speed
Enables a maximum threshold for agent speed. Agents traveling above the
specified maximum will have their speed reduced to the maximum.
Speed Limit: Up
Sets the maximum upward speed in metres per second.
Speed Limit:
Down
Sets the maximum downward speed in metres per second.
Collections Tab
Bank
The bank which the stair is a member of, if any. For more information, see
Banks.
Perimeters
Perimeters which the stair is a member of, if any. For more information,
see Perimeters.
4.3.1.13 Visual
Visual objects can provide context to an environment or enhance the look of a scene. Visual objects
are not used during simulation or analysis and have no functional impact on a project.
4.3.2
Activity Objects
Activity objects have to do with creating agents, defining agent characteristics and behaviour, and
controlling elements of the scene.
Defining Agents
Object
Type
Description
Profile
Used by events to define agent characteristics.
Avatar
An optional editable physical representation of an agent.
Creating Agents
Object
Type
Description
Journey
An event to create agents moving from origin portals to destination portals.
Circulat
e
An event to create agents who move between "circulation" portals.
Vehicle
An event that simulates the regular arrival and departure of a "vehicle" such as a
subway car.
Evacuat
e
An event used to simulate evacuations. Agents are created and then evacuate the
scene in specified ways.
Timeta
ble
An event used to create large groups of agents and control the scene.
© 2015 Oasys Software Limited
119
MassMotion
Controling Agents and the Scene
Object
Type
Description
Execute
Action
An event which applies an agent action to change the behaviour of agents.
Open
Gate
An event which opens gated connection objects.
Referen
ce Time
A virtual event that can be used by reference times in other events and can help with
coordinating the timing of multiple events.
Other Objects
4.3.2.1
Object
Type
Description
Agent
Actions
An operation that can be applied to an agent to modify its properties or assign it new
tasks.
Agent
Tests
A condition which when applied to an agent returns true or false.
Token
Identifying markers held by agents.
Agent Actions
An action is an operation applied to an agent. The operation can modify agent properties or assign
new tasks. Actions can be applied to agents through events or when they transition between
objects in the scene (see Where to Use Actions).
Modifying actions alter the agent immediately as the action is applied. Task giving actions create a
new task for the agent to execute in the next frame. When a compound or named action results in
multiple tasks, those tasks are collected into a group and executed by the agent in order.
Special Actions
Do nothing
No action will be applied to the agent.
Named action
The action described by the action object will be applied to the agent.
Compound actions combine tests and other actions.
Compound Actions
If/Then
120
If the test evaluates to true, the 'Then' action is applied to the agent.
© 2015 Oasys Software Limited
MassMotion
If/Then/Else
If the test evaluates to true, the 'Then' action is applied to the agent,
otherwise the 'Else' action is applied.
List of actions
Each action in the list is applied to the agent. If set to 'Given order' the
actions are applied from top to bottom. If set to 'Random' the actions are
applied in random order.
Modifying actions are applied to the agent immediately in the order in
which they are applied. The tasks from task giving actions are collected in
the order in which the actions are applied and given to the agent as a group
of tasks to be executed in that order.
Choose action
from set
Only one action from the specified list will be applied to the agent. The
weight beside each action describes the likelihood that action will be
chosen. The sum of the likelihood values is always normalized to 100%
before the action is applied to an agent.
A single action is always chosen, even if that action is 'Do nothing'.
Modifying actions are applied immediately to the agent as the action is executed. Tests performed
later in the action will notice property modifications enacted earlier in the action.
Modifying Actions
Give tokens
Immediately give the specified tokens to the agent. Agents can only hold
one copy of a given token, and so any tokens already held by the agent are
ignored.
Remove tokens
If the agent is currently holding any of the specified tokens, immediately
remove them from the agent.
Assign avatar
Immediately change the avatar of the agent.
Reset avatar
Immediately return the agent to its original or first assigned avatar. The
first avatar assigned to an agent (whether through action or profile) is
considered the agent's original avatar. Reset avatar actions will always
return an agent to this original avatar. In the case where an agent does not
have an avatar or is currently using the first assigned avatar, this action
does nothing.
Assign colour
Immediately change the colour of the agent.
Reset colour
Immediately return the agent to its original colouring.
Clear tasks
Immediately clear the agent's existing list of tasks. This has no effect on
the tasks currently being generated by the action under execution. Those
tasks will still be given to the agent after the action has finished executing.
© 2015 Oasys Software Limited
121
MassMotion
Clear route
history
Immediately clear the agent's route history. The agent will forget any
previous journeys and clear all backtracking penalties associated with
routes already traversed.
Task giving actions create a task that is given to the agent for execution in the next frame. The agent
will put aside the task it was previously executing and start on the new task(s). Once all new tasks
have finished the agent will return to the original task that was interrupted by the action.
Task Giving Actions
Evacuate zone
The agent will navigate the scene, following the best cost route through the
zone to a floor that is not a member of the specified zone. Best cost
includes all standard route costing components such as horizontal
distance and queuing. The task is complete once the agent has reached a
floor that is not a member of the zone. Agents that are given this task when
already outside of the zone will complete the task immediately.
Erase Route History When Task Starts: If true, the agent will forget all
previous journeys and there will be no backtracking penalties for routes
traversed before the task began. If false, the agent will be biased against
selecting routes traversed while executing previous tasks.
Exit simulation
When executed, the agent will leave the simulation. The exit will be
recorded as a 'success'. This is the normal method for removing agents
from the simulation after they have completed their journeys/tasks.
Goto best
waypoint
The agent will attempt to reach and transition to the specified adjacent
floor, portal, link, stair, ramp, path, or escalator. The waypoint must be
connected to the current floor. If multiple waypoints are specified the agent
will attempt to reach the 'best' or lowest cost. The agent will ignore any
waypoint objects not connected to the current floor. The task is complete
once the agent has transitioned to one of the waypoint objects.
As soon as the agent has reached the waypoint it will move on to its next
task. This may result in the agent turning around and going back the way
they came in pursuit of the next task. To define a chain of routes to be
followed in succession, use a 'List of actions' and define multiple 'Goto best
waypoint' actions one after the other.
Seek best portal
The agent will navigate the scene, following the best cost route to one of
the specified portals. The agent will consider all of the portals specified and
select the portal with the best cost route. The task is complete once the
agent has reached one of the given portals.
Erase Route History When Task Starts: If true, the agent will forget all
previous journeys and there will be no backtracking penalties for routes
traversed before the task began. If false, the agent will be biased against
selecting routes traversed while executing previous tasks.
Seek origin
122
The agent will navigate the scene, following the best cost route to the portal
© 2015 Oasys Software Limited
MassMotion
through which the agent entered the simulation. The task is complete once
the agent has reached its origin portal.
Erase Route History When Task Starts: If true, the agent will forget all
previous journeys and there will be no backtracking penalties for routes
traversed before the task began. If false, the agent will be biased against
selecting routes traversed while executing previous tasks.
Seek process start
The agent will navigate the scene, following the best cost route to the
specified process chain start. Best cost includes all standard route costing
components such as horizontal distance and queuing. Note that only
designated servers or process chain start points are possible destinations
for this task (see Process Chains & Servers). If an agent is to be sent to
any of a number of similar servers, those servers should be connected
together by a single dispatch, and the dispatch specified in the 'Seek
process start' action. In this case the dispatch will distribute agents
across the connected servers.
Once the agent has reached the process chain start, it will enter the chain
and continue through the chain until it reaches a chain end point. The task
is complete once the agent has reached the chain end point and been
processed by the last server.
Note, if a 'Seek Process Start' task is interrupted by another task, agents
will return to the beginning of the process chain when resuming the task.
Erase Route History When Task Starts: If true, the agent will forget all
previous journeys and there will be no backtracking penalties for routes
traversed before the task began. If false, the agent will be biased against
selecting routes traversed while executing previous tasks.
Wait for duration
The agent will stand around for the specified number of seconds, using the
wait style specified. The wait timer starts when the agent begins executing
the task. The task is complete once the specified number of seconds have
elapsed.
Wait until time
The agent will stand around until the simulation reaches the specified time.
The task is complete once the given time has been reached. The task will
be completed instantaneously if executed after the specified time.
4.3.2.1.1 Where to Use Actions
Actions can be applied in a number of ways. The following table lists the various locations within a
project where user created custom actions can be referenced and so applied. In cases where
multiple actions are applied, it is important to understand the order of action execution.
Action Triggers
Object
© 2015 Oasys Software Limited
Property
Description
123
MassMotion
124
Profile
On birth
Applied to an agent newly created using the
profile.
Journey, Circulate,
Evacuate, Vehicle
On birth
Applied to an agent newly created by the
event.
Execute Action
Action
Applied to every agent in the scene at the
time specified, or as agents enter the
simulation during the time the event is active.
In the case where the event targets a zone,
when the action is active agents will receive
the action when they enter the zone.
Portal
Entered simulation
Applied to an agent when it uses the portal to
enter the simulation.
Portal
Arrived at waypoint
Applied to an agent when it reaches a portal
that it was seeking.
Floor
On enter
Applied to an agent once it has stepped onto
the floor.
Floor
On exit
Applied to an agent once it has stepped off of
the floor.
Link, Stair, Ramp,
Escalator, Path
Ball: On enter
Applied to an agent once it has stepped onto
the link at the ball goal line.
Link, Stair, Ramp,
Escalator, Path
Ball: On exit
Applied to an agent once it has stepped off of
the link at the ball goal line.
Link, Stair, Ramp,
Escalator, Path
Box: On enter
Applied to an agent once it has stepped onto
the link at the box goal line.
Link, Stair, Ramp,
Escalator, Path
Box: On exit
Applied to an agent once it has stepped off of
the link at the box goal line.
Server
When finished
Applied to an agent once it has been
processed by the server (depending on
downstream availability in the process chain,
this might be applied before the agent is
released from the server).
Zone
On enter
Applied to an agent once it has stepped onto
a member of the zone when coming from an
object that is not a member of the zone.
© 2015 Oasys Software Limited
MassMotion
Zone
On exit
Applied to an agent once it has stepped onto
an object that is not a member of the zone
when coming from an object that is a member
of the zone.
4.3.2.1.2 Order of Action Execution
The order in which actions are applied is important, as test results in one action could be altered by
the results of previous actions (such as giving or removing tokens). The following table describes the
order in which actions are applied for various scenarios. In each case, actions are only applied if
defined.
Order of Action Application
Scenario
Order of Actions (if present)
A new agent is created and
placed in the scene.
1. Creation event 'Internal' (initial goal assignment)
2. Profile: 'On birth'
3. Creation event 'On birth'
4. Timed execute action(s): 'Action'
5. Zone(s): 'On enter'
6. Floor: 'On enter'
7. Portal: 'Entered simulation'
An agent has transitioned from
the ball side of a link onto a floor.
1. Timed execute action(s): 'Action'
2. Link: 'Ball: On exit'
3. Zone(s): 'On exit'
4. Zone(s): 'On enter'
5. Floor: 'On enter'
An agent reaches its portal
destination.
1. Timed execute action(s): 'Action'
An agent has finished being
processed at a server.
1. Timed execute action(s): 'Action'
© 2015 Oasys Software Limited
2. Portal: 'Arrived at waypoint'
2. Server: 'When finished'
125
MassMotion
4.3.2.2
Agent Tests
Agent tests operate on a single agent at an instant in time, and return either true or false. Agent
tests are used by agent actions to customize how the action is applied to an agent.
Special Tests
Always true
Always returns true.
Named test
Returns the result of executing the specified agent test object.
Compound tests combine the results of other tests.
Compound Actions
Not
Returns the inverse of the specified test.
Compound Test
Combines the results of the two tests using the specified logic, and returns
the result.
All of
Returns true if all of the specified tests return true.
Any of
Returns true if any of the specified tests return true.
None of
Returns true if none of the specified tests return true.
Static tests will always return the same result for a given agent and do not vary with time.
Static Tests
126
Created by
Returns true if the agent was created by any of the specified events.
Entered at
Returns true if the agent entered the simulation at any of the specified
portals.
Initial Goal
Returns true if the agent was created with any of the specified portals as
its initial goal. The initial goal refers to the single portal destination
assigned to the agent by the creating event. It does not consider any
goals applied via actions, even if the action is applied by the creating event.
Not all agents will have an initial goal.
© 2015 Oasys Software Limited
MassMotion
Uses Profile
Returns true if the agent was created with any of the specified profiles.
Dynamic tests can produce different results at different times. They depend on temporal values or
agent properties that can change from one frame to the next.
Dynamic Tests
4.3.2.3
Agent Age
Returns true if the agent is currently younger/older than the specified age.
Has Tokens
Returns true if the agent is currently holding all/any/none of the specified
tokens.
Insize Zone
Returns true if the agent is currently on an object that is inside the zone.
Random Chance
Returns true if a random number chosen between 0 and 100 is less than or
equal to the given value.
Simulation Time
Returns true if the current simulation time is before/after the specified time.
Avatar
Geometry that can be used to represent different populations of agents during simulation playback.
The avatar has no functional impact on simulation execution and is for visualization purposes only.
Avatar geometry can be edited using a special scene viewer which is accessible through the avatar
object properties window. All of the tools available for editing scene geometry can also be used
when editing avatars. It is important that the avatar centroid remain at the origin or it will not
accurately reflect actual agent movement during playback.
Using Avatars
An agent is assigned a particular avatar through the agent's profile. If no avatar is specified, the
agent will use a default representation.
Viewing Avatars During Playback
By default MassMotion displays agents using the built in animated biped avatar. To view user
specified static avatars, change the agent type in the 3D scene view's display menu.
4.3.2.4
Circulate
Circulate events create agents that will enter the simulation from one of the origin portals, move
between several circulation portals, then leave the simulation at one of the destination portals.
The same portal may be used as an origin, circulation and destination portal. Agents may visit the
same circulation portal more than once.
Properties
© 2015 Oasys Software Limited
127
MassMotion
Arrive Tab
Timing:
Start Time
The reference time when the event starts. See Working with Time for more
information.
Population
: Profile
The profile used to create agents. If a collection is specified, each agent will be
assigned one of the profiles from the collection. A weighted collection can be used
to alter the distribution of profiles amongst the population.
Population
: Demand
The number of agents the event will create and when they will be created relative to
the event start time.
Evenly spaced: The specified number of agents will arrive at a constant rate over
the duration.
Instant: The specified number of agents will arrive all at once at the event start
time.
Random: The specified number of agents will arrive according to the specified
distribution over the duration. See Duration Distributions for information on arrival
distributions.
Table: Complex agent arrival is described by a series of rows. Each row contains
the duration of an interval and the number of agents to create over that interval.
The first interval starts at the event start. Subsequent intervals begin when the
previous interval ends. Agents are created according to a uniform distribution within
each interval.
Origins
The portals and collections of portals at which agents will be created. Portals can
be weighted to create more agents than others. See Choosing Objects for more
details.
Destinatio
ns
The portals and collections of portals to which agents will travel and exit once they
have finished circulating. Agent goals can be set to either travel to a portal
assigned by weights (see Choosing Objects), or to the lowest cost (often closest)
portal available.
Circulate Tab
Circulate
(Type)
Defines the end conditions for agent circulation. When using a time or duration
limit, the agent will cease circulating immediately once the limit is reached
regardless of whether the agent is currently waiting or in transit between circulation
portals.
For entire simulation: The agent will continue circulating amongst the portals
until the simulation is complete.
For count: The agent will circulate for the specified number of iterations.
For duration: The agent will circulate for the specified duration (measured from the
time the agent is created).
For duration or count: The agent will circulate until the specified duration or for
the specified number of iterations (see 'Wait After Count' below).
Until time: The agent will circulate until the specified simulation time. Agents
created after the time will proceed immediately to their destination.
Until time or count: The agent will circulate until the specified simulation time or
for the specified number of iterations (see 'Wait After Count' below).
Duration
128
The duration for which agents will circulate. The duration is measured separately
© 2015 Oasys Software Limited
MassMotion
for each agent, relative to the time at which the agent was created.
Time
The time at which agents will stop circulating.
Count
The number of portals an agent will visit before considering the circulation finished.
Wait After
Count
When the count and duration or end time are used together, this determines the
agent behaviour when they finish the circulation count before the specified duration
limit or end time. If true, agents will continue to wait at their last circulation portal.
If false agents will ignore the incomplete duration or end time and proceed to their
destination.
Circulation
Portals
The portals agents should circulate between. Portals can be weighted to adjust
their chances of being chosen when agents are determining the next leg in their
circulation. See Choosing Objects for more details.
Dwell Tab
Wait at
Start
Whether agents should wait at their origin portal before starting to circulate.
Wait Style
How agents should position themselves as they wait at a circulation portal.
Spread Out: Spread out over the floor, near the portal.
Stand Still: Stop moving as soon as the portal is reached.
Dwell
Duration
When an agent reaches a circulation portal, the agent will wait or dwell at that
portal for a period of time. The time is randomly generated according to a
distribution as specified by the dwell duration rules. Agents will search through the
rules from top to bottom and use the distribution corresponding to the first
occurrence of their circulation portal (either directly or as a member of a specified
collection). If the circulation portal is not contained within the dwell rules, the
default bottom distribution is used.
Colours Tab
Colours
Event colour: Agents are assigned the same colour as the event object.
Lighten event colour: Agents are assigned a lighter version of the event object
colour.
Darken event colour: Agents are assigned a darker version of the event object
colour.
Rule based: Agents are assigned a colour according to the colouring rules.
Working from top to bottom, agents will use the first colour for which the test
evaluates to true.
Specified colour: Agents are assigned the specified colour.
Actions Tab
On birth
The action will be applied to all agents created by the event as they enter the
simulation. For a description of the order in which actions are applied see Action
Order of Execution.
© 2015 Oasys Software Limited
129
MassMotion
Collections in circulate events
Collections can be used in the "Origins", "Destination" and "Circulation Portals" properties. The
collections can be weighted, changing the distribution of agents going from/to various portals.
4.3.2.5
Evacuate
Evacuate events simulate the evacuation of agents from the scene. Agents created by an evacuate
event will first wait a specified amount of time, then attempt to exit the simulation through the best of
the destination portals.
If zones have been specified, agents will attempt to evacuate each zone in order before heading to
the destination portals. Once a zone has been evacuated, agents may re-enter previously evacuated
zones, so generally, subsequent zones should contain prior zones. Agents created outside
evacuation zones will simply head to their destination portals.
Only agents created by this event will evacuate the given zones or head to the destination portals.
Properties
Agents Tab
Timing:
Start Time
The reference time when the event starts. See Working with Time for more
information.
Population
: Profile
The profile used to create agents. If a collection is specified, each agent will be
assigned one of the profiles from the collection. A weighted collection can be used
to alter the distribution of profiles amongst the population.
Population
: Demand
The number of agents the event will create and when they will be created relative to
the event start time.
Evenly spaced: The specified number of agents will arrive at a constant rate over
the duration.
Instant: The specified number of agents will arrive all at once at the event start
time.
Random: The specified number of agents will arrive according to the specified
distribution over the duration. See Duration Distributions for information on arrival
distributions.
Table: Complex agent arrival is described by a series of rows. Each row contains
the duration of an interval and the number of agents to create over that interval.
The first interval starts at the event start. Subsequent intervals begin when the
previous interval ends. Agents are created according to a uniform distribution within
each interval.
Origins
The portals and collections of portals at which agents will be created. Portals can
be weighted to create more agents than others. See Choosing Objects for more
details.
Evacuation Tab
Timing: Premovement
wait
130
How long agents will wait before beginning to evacuate. This can be set as a
distribution in seconds, see Single Value Distributions for more information.
© 2015 Oasys Software Limited
MassMotion
Timing:
Wait style
How the agents will position themselves before evacuating.
Stand Still: The agents will stand by the portal at which they were created.
Spread Out: The agents will spread out over the floor on which they were
created.
Zones
The zones in order of evacuation. Agents will evacuate zones in order, but are not
prevented from re-entering previously evacuated zones.
Exits: Clear
Route
History
Agents are biased against backtracking across objects they have already
traversed. If unchecked, agents that have evacuated all zones will be biased
against re-tracing their steps when seeking the exit portals. If route history is
cleared, agents forget where they have been and will have no problem
backtracking if that is the best way to reach their exit portals.
Exits
The portals and collections of portals to which agents will ultimately travel. Once
agents finish evacuating zones, they will head to the lowest cost (often closest)
exit portal.
Colours Tab
Colours
Event colour: Agents are assigned the same colour as the event object.
Lighten event colour: Agents are assigned a lighter version of the event object
colour.
Darken event colour: Agents are assigned a darker version of the event object
colour.
Rule based: Agents are assigned a colour according to the colouring rules.
Working from top to bottom, agents will use the first colour for which the condition
evaluates to true.
Specified colour: Agents are assigned the specified colour.
Actions Tab
On birth
The action will be applied to all agents created by the event as they enter the
simulation. For a description of the order in which actions are applied see Action
Order of Execution.
Collections in open gate events
Collections can be used in the "Origins" and "Exits" properties. The "Origins" collections can be
weighted, changing the distribution of agents created at those portals.
4.3.2.6
Execute Action
The action event is used to apply the specified action to agents within the simulation. The event can
be applied selectively based on whether or not an agent holds a given token or is in a specified
zone.
When the event becomes active the action is applied to all agents currently in the simulation. While
active, the action is applied to all agents as they enter the simulation. The action is only applied to
a given agent once, even if properties of that agent change while the event is still active.
© 2015 Oasys Software Limited
131
MassMotion
If a target token is specified then only agents holding the token receive the action.
If a target zone is specified then only agents within the zone receive the action. When using a target
zone, agents that enter the zone while the action is active will have the action applied as if it were a
zone 'On enter' action. Once inside the zone, the action will not be re-applied to an agent even if
properties of that agent change while the event is still active. However, if the agent leaves and then
re-enters the zone, the action will be reapplied on entry.
Time
4.3.2.7
Time range
Time over which the event is active. When the event starts, it will be applied
to all targeted agents in the simulation. While active, it will apply to all
targeted agents as they enter the simulation.
Target: Agents
holding token
If set, the action will only be applied to agents holding the specified token.
Note that the test for token possession is performed only when the event is
applied. Agents will not spontaneously respond to the event upon
acquiring the token even if the event remains active.
Target: Agents in
zone
If set, then only agents inside the specified zone will respond to the event.
When the event first fires it is applied to all agents in the zone. It is also
applied to each agent that enters the zone, for as long as the event
remains active.
Action
The action that will be applied to agents. The action is applied after any
actions related to agent creation, but before any actions received during the
frame.
Journey
Journey events are the most direct way to populate a scene. They create agents at one of the origin
portals and instruct them to seek one of the destination portals then exit the simulation.
The same portal may be used as both an origin and destination, however, agents that are given the
same portal as both origin and destination will exit the simulation immediately after being created.
Properties
Properties
132
Timing:
Start Time
The reference time when the event starts. See Working with Time for more
information.
Population:
Profile
The profile used to create agents. If a collection is specified, each agent will be
assigned one of the profiles from the collection. A weighted collection can be
used to alter the distribution of profiles amongst the population.
Population:
Demand
The number of agents the event will create and when they will be created relative
to the event start time.
© 2015 Oasys Software Limited
MassMotion
Evenly spaced: The specified number of agents will arrive at a constant rate over
the duration.
Instant: The specified number of agents will arrive all at once at the event start
time.
Random: The specified number of agents will arrive according to the specified
distribution over the duration. See Duration Distributions for information on arrival
distributions.
Table: Complex agent arrival is described by a series of rows. Each row
contains the duration of an interval and the number of agents to create over that
interval. The first interval starts at the event start. Subsequent intervals begin
when the previous interval ends. Agents are created according to a uniform
distribution within each interval.
Origins
The portals and collections of portals at which agents will be created. Portals can
be weighted to create more agents than others. See Choosing Objects for more
details.
Destinations
The portals and collections of portals to which agents will travel. Agent goals can
be set to either travel to a portal assigned by weights (see Choosing Objects), or
to the best (often closest) portal available.
Colours Tab
Colours
Event colour: Agents are assigned the same colour as the event object.
Lighten event colour: Agents are assigned a lighter version of the event object
colour.
Darken event colour: Agents are assigned a darker version of the event object
colour.
Rule based: Agents are assigned a colour according to the colouring rules.
Working from top to bottom, agents will use the first colour for which the condition
evaluates to true.
Specified colour: Agents are assigned the specified colour.
Actions Tab
On birth
The action will be applied to all agents created by the event as they enter the
simulation. For a description of the order in which actions are applied see Action
Order of Execution.
Collections in open gate events
Collections can be used in the "Origins" and "Destination" properties. The collections can be
weighted, changing the distribution of agents going from/to various portals.
4.3.2.8
Open Gate
Open gate events are used to control accessibility through various connection objects. Escalators,
links, paths, ramps and stairs must have gates enabled in their "Access" properties before they can
be used in an open gate event.
A gated connection object will be closed by default, preventing any agents from stepping onto it,
unless an open gate event is used. A gated connection object can be used in multiple open gate
© 2015 Oasys Software Limited
133
MassMotion
events and will be open if any of the events opens it.
A vehicle event is a convenient combination of an open gate event and a journey event.
Properties
Properties
Timing:
Time
range
The time reference range over which the event is active. See working with time for
more information.
Timing:
Cycle
By default, an open gate event will open its gates for the entire time it is active. It can
be set to instead cycle between open and close over its active duration.
Open: The gate will open for this duration after becoming active (or until the event is
no longer active).
Closed: The gate will then close for this duration before opening again.
Target
When enabled, the gate will only open for those agents holding the specified tokens.
If an agent does not hold one of the tokens, the gate is perceived as closed.
Gates
Gated connection objects that will be opened by the event. A connection object may
be used by several different open gate events.
Collections in open gate events
Collections can be used in the "Gates" property. All member links with gates enabled will be opened
as if they were directly used.
4.3.2.9
Profile
Every agent is created with a set of unique properties that define the agent's physical characteristics
and personality. The range of possible values for each agent is defined by the profile used to create
that agent. See Single Value Distributions for more information.
Events which create agents will have a "Profile" property which determines which profile will be used.
Profile Properties
The physical properties of the agent define radius, speed, and general movement characteristics.
Profile Properties
Radius
The size of each agent. Given the default value of 0.25m, each agent,
measured from one shoulder to the other, will be 0.5m across.
Note: care should be taken with this value. The simulation has been tuned
to a value of 0.25m. While there are no theoretical limits, it is
recommended that the practical body radius remain between 0.15m and
0.4m.
Speed
134
Each agent is assigned a desired speed according to the specified
distribution. The agent will attempt to maintain this speed when moving
freely in flat open space. See agent movement for information on other
factors affecting agent speed.
© 2015 Oasys Software Limited
MassMotion
Direction Bias
When faced with an opposing flow, agents will tend to drift either left or
right depending on local customs. The direction bias indicates the direction
of drift. In agent movement the collision avoidance, drift, and corner forces
are all affected by the direction bias. Available options are: Left Strong, Left
Weak, None, Right Weak, Right Strong.
Avatar (optional)
Defines the physical appearance of agents produced by this profile. If no
avatar is specified the default appearance is used. By default each scene
view displays agents using animated bipeds rather than static avatars.
See avatar for information on viewing the static avatars during playback.
Route Cost
Weights
When determining the overall cost for a given route, each of the component
costs is multiplied by a weight which serves to make that component more
or less important to a particular agent. The greater the variation in weights,
the greater the variation in decisions made by a given population. Please
see Agent Navigation for a description of the cost components.
Horizontal Distance Cost: Applied to the horizontal distance cost
component.
Vertical Distance Cost: Applied to the vertical distance cost component.
Queue Cost: Applied to the queue cost component.
Processing Cost: Applied to the closed penalty cost component. This
includes all penalties from from any gate or priority access 'wait when
closed' penalties, delays, or controlled flow restrictions on near floor
connection objects.
4.3.2.10 Reference Time
Reference times are virtual events that do not directly impact simulation. They are useful for
representing significant times in a simulation such as a fire alarm or the end of a concert. If other
dependent events refer to the reference time, then only the reference time need be modified to reflect
operational changes. See time references in Working with Time.
Properties
Properties
Timing:
Start
When the reference event is considered to have started.
4.3.2.11 Timetable
Timetable objects allow for the rapid and potentially automated creation of large numbers of agents
and coordinated events. They are suitable for modeling train schedules, flight schedules, bus
schedules, university lectures, intersection gate timings, or any number of additional scenarios.
Timetables allow for the batch import of related agent schedules and/or events. Timetables are driven
by a series of comma separated (csv) text files. Once imported, the raw data is embedded in the
timetable object and will be saved as part of the scene. The raw data is only processed on validation
or simulation so there is little overhead associated with the amount of data or the number of entries.
Timetable files can be generated by hand, but will more often be generated by user written scripts or
excel macros.
© 2015 Oasys Software Limited
135
MassMotion
Different input files control different aspects of the timetable. One file specifies the creation of agents
while another controls gate open events. It is possible to define time and location dependencies
between the different files (so that a gate opens and agents are created at the same time) through
the use of internal reference events. Reference events are not visible to scene elements outside of
the timetable. Agents created with respect to a particular reference event are forever associated with
that reference identifier and can be later targeted by other timetable events. It is also possible to
create a very simple timetable that only executes gate events or only controls agent scheduling.
When inspecting a timetable object, the buttons at the top of the window allow for batch import/
export/reload of the various timetable files. Each file type has a default name constructed from the
name of the timetable and the file type. Default names are listed in the 'File Types' table below.
Menu Bar
Commands
File: Import
Timetable
Select a folder and import all contained files with the expected default names
(see File Types below).
File: Export
Timetable
Select a folder and export all file types that contain data. If file names are not
specified the default file names are used.
File: Export
Empty
Timetable
Select a folder and export empty versions of all files using the default names
(see File Types below).
Reload
Attempt to reload data from each file specified in the window. Entries where
no file is specified will be ignored.
General
Properties
Base Path
This is the default location for input files managed by the timetable. If any
specific file names are relative they are assumed to be in this path.
Profile
The default profile to use for agents created by the agent schedule file when
no profile is specified in the file.
File Types
Reference
Events
Import, export, or clear the embedded reference event data. A reference event
entry specifies a time, duration, and location. These events can be used by
other sections of the timetable such as agent schedules, gate events,
evacuation events, or action events.
Default name: TimetableReferenceEvent.csv.
See Timetable Reference Event File for more information.
136
© 2015 Oasys Software Limited
MassMotion
Agent
Schedules
Import, export, or clear the embedded agent schedule data. Each schedule
entry creates a specified number of agents with particular origins and
destinations.
Default name: TimetableSchedule.csv.
See Timetable Schedule File for more information.
Curves
Import, export, or clear the embedded curve data. Each curve entry defines an
arrival profile or distribution that can be used by the agent schedules.
Default name: TimetableCurve.csv.
See Timetable Curve File for more information.
Locations
Import, export, or clear the embedded location data. Each location entry
defines a collection of portals with corresponding distributions or membership
weights. Locations can be used by reference events, agent schedules, or
evacuation events.
Default name: TimetableLocation.csv.
See Timetable Location File for more information.
Gates
Import, export, or clear the embedded gate data. Each gate entry defines a
collection of gate objects and can be referenced by gate events.
Default name: TimetableGate.csv.
See Timetable Gate File for more information.
Gate Events
Import, export, or clear the embedded gate event data. Each gate event entry
will open a collection of gates for a specified interval. The gate event can be
used on its own or in combination with the reference event.
Default name: TimetableGateEvent.csv.
See Timetable Gate Event File for more information.
Evacuation
Events
Import, export, or clear the embedded evacuation event data. Each evacuation
event entry will broadcast a single evacuation over the specified interval.
Default name: TimetableEvacuationEvent.csv.
See Timetable Evacuation Event File for more information.
Action Events
Import, export, or clear the embedded action event data. Each action event
entry will apply the specified action to agents over the specified interval.
Default name: TimetableActionEvent.csv.
See Timetable Action Event File for more information.
© 2015 Oasys Software Limited
137
MassMotion
4.3.2.11.1 Timetable Files
4.3.2.11.1.1 Timetable Reference Event File
The timetable reference event file is a comma separated (csv) text file defining one or more reference
events. Each row corresponds to a single reference event. These events can be referenced by other
input files within the same timetable. Reference events defined within the timetable may not be
referenced from outside of the timetable. Reference event names must be unique and cannot be the
same as any other objects within the project.
Reference events can refer to anything from an airplane departure to a train arrival to a university
lecture. The end time of the event is calculated as Start Time + Duration.
Column Headers
Reference Event
Name
The name of a reference event. The name must be unique both within the
file and across the entire MassMotion project. Other files within the
timetable can refer to a reference event by name.
Start Time
The time associated with the reference event. The value must be either a
single number indicating seconds, or a string of the form hh:mm:ss.
Duration
(optional)
The duration from arrival to departure. The value must be either a single
number indicating seconds, or a string of the form hh:mm:ss. If no value is
specified a duration of 0 is assumed.
Location
Either the name of a location group (see Timetable Location File) or the
name of a portal in the project.
Init Action
(optional)
The name of an existing action in the project. The action will be applied to
any agent created by a schedule that refers to this reference event.
Give Tokens...
(optional,
variable)
Each subsequent column can specify a single token by name. The token
must exist in the project. Agents created by a schedule that refers to this
event will be given the specified tokens.
Example
See Timetable Reference Event Example.
4.3.2.11.1.2 Timetable Schedule File
The timetable schedule file is a comma separated (csv) text file defining a number of schedules.
Each row corresponds to a single schedule and will create a population of agents. The schedule can
optionally refer to events in the reference event file or be used independently.
If the From or To fields reference locations, agents are created and sent to those locations. If the
From or To fields refer to reference events, the agents are created and sent to the locations defined
by those events.
The start time for a schedule is determined based on whether or not reference events were specified
138
© 2015 Oasys Software Limited
MassMotion
in the From or To fields:
From reference event, To reference event: The start time is taken from the From reference
event start time.
From reference event, To location: The start time is taken from the From reference event start
time.
From location, To reference event: The start time is taken from the To reference event start
time.
From location, To location: The start time is assumed to be midnight on the day at which the
simulation begins (so the time offset effectively becomes the start time).
Column Headers
From
The location at which agents should be created. The location can be either
the name of an existing portal in the project, the name of a location from
the Timetable Location File or the name of a reference event from the
Timetable Reference Event File. If the location is from the location file,
agents will be distributed across the member portals according to the
distribution defined in the file. If the location is the name of a reference
event, the event location is used.
To
The goal location given to agents created by the schedule. The location
can be either the name of an existing portal in the project, the name of a
location from Timetable Location File, or the name of a reference event from
the Timetable Reference Event File. If the location is from the location file,
agents will be either sent to the portals according to the defined
distribution, or told to seek the closest portal member depending on the
settings in the location file. If the location is the name of a reference event,
the event location is used.
Population
The number of agents created by the schedule.
Time Offset
(optional)
A time value added to the schedule start time. The value must be either a
single number indicating seconds, or a string of the form hh:mm:ss. If a
reference event has been specified, this time is added to the reference
event start time. If no reference event has been specified, this time is taken
as the schedule start time, measured relative to midnight (00:00:00). See
above for a full description of how the schedule start time is determined.
Curve (optional)
The name of an entry in the Timetable Curve File curve file. The specified
population of agents will be created according to the curve distribution. If no
curve is specified, all agents are created over 1 second.
Avatar or Colour
(optional)
The name of an existing avatar in the the project or a valid colour name. If
the text matches the name of an avatar, then agents created by the
schedule will be given that avatar. If the text does not match the name of
an avatar but corresponds to a recognized colour, then agents will be
created with the default avatar and given the specified colour. If the entry is
blank the default avatar is used and the agent is coloured grey.
© 2015 Oasys Software Limited
139
MassMotion
Colors: aqua, blue, green, orange, red, yellow, black, white, grey, lightgrey,
darkgrey.
Profile (optional)
The name of an existing profile in the project. Agents created by the
schedule will be given the specified profile. If no profile is specified, agents
will be given the default profile.
Init Action
(optional)
The name of an existing action in the project. The action will be applied to
any agent created by the schedule.
Give Tokens...
(optional,
variable)
Each subsequent column can specify a single token by name. The token
must exist in the project. Agents created by the schedule will be given the
specified tokens.
Example
See Timetable Schedule Example and Timetable Reference Event Example.
4.3.2.11.1.3 Timetable Curve File
The timetable curve file is a comma separated (csv) text file defining different arrival profiles for use
by the timetable schedule. Each row corresponds to a single curve distribution and can be
referenced from Timetable Schedule File by name.
Column Headers
Curve Name
The name of the curve.
Interval Duration
The length of each step in the curve. The value must be a single number
indicating seconds, a single number with a 'h', 'm', or 's' designator, or a
string of the form hh:mm:ss. Agents created inside each interval are
distributed randomly within the interval.
Values...
(variable)
Each subsequent column specifies a single value indicating the percentage
of the total population that is to be created within that interval. Use a single
value of 1 to indicate that all agents should be created within a single
interval. Values of 0.25, 0.5, 0.25 would indicate that a quarter of the
agents should be created over the first interval, half over the second, and
the remaining quarter over the third interval. Values in a curve must sum to
1.
Example
#
# Sample MyTimetableCurve.csv
140
© 2015 Oasys Software Limited
MassMotion
#
Curve Name,
Interval Duration,
Values...
# all agents within a single second
CBurst1,
1,
1
# uniformly random over 10 seconds
CConstant10,
10,
1
# uniformly random over 120 seconds
CConstant120,
00:02:00,
1
# tapered over 60 seconds
CTapered60,
10,
0.5,
0.3,
0.1,
0.05,
0.025,
0.025
0.5,
0.3,
0.1,
0.05,
0.025,
0.025
0.2,
0.01,
0.45,
0.15,
0.29
# tapered over 120 seconds
CTapered120,
20,
# custom rates over 1 hour
CCustom1H,
0.2h,
Also, see Timetable Schedule Example.
4.3.2.11.1.4 Timetable Location File
The timetable location file is a comma separated (csv) text file defining a group of portals. The
header lists all portals available in the project. Each row corresponds to a different group, with nonzero values indicating that the given portal is to be included in the group. Fractional values are used
to indicate percentage allocations within the group. The location group names must be unique both
within the file and within the MassMotion project.
Location groups can be referenced by the Timetable Reference Event File, Timetable Schedule File,
or Timetable Evacuation Event File.
Column Headers
Group Name
The name of the location group. The name must be unique both within the
file and across the entire MassMotion project.
Use Closest Goal
(optional)
This determines whether agents using this location as their goal will be
assigned a specific member portal based on the distribution (if false or
blank), or given all portals and told to seek the closest (if true). Use Y or 1
to indicate true.
Portals Names...
(variable)
Each location can indicate which portals are to be included in the group by
specifying a non-zero value in the corresponding column. Values should be
between 0 and 1. All values for a group should sum to 1. When a location
group is specified but only a single portal is required (for example when
determining where to create an agent) a portal is chosen from the group
using the probability distribution defined by the non-zero fractional values.
© 2015 Oasys Software Limited
141
MassMotion
Example
#
# Sample MyTimetableLocation.csv
#
Group Name, Use Closest Goal,
Portal_A,
Portal_B,
Portal_C,
Portal_D
# create a group with A and B and equal entrance and exit distribution
GroupABEven, ,
Y,
Y
# create a group with A and B where agents are 3 times more likely to use A than B
GroupABUneven,
,
0.75,
0.25
# create a group with equal entrance distribution over A, B, D, where when exiting agents will
GroupABD,
Y,
Y,
Y,
0,
Y
# create a group with C and D where as entrances agents are twice as likely to pick D, but as e
GroupCD,
Y,
,
,
0.6666,
0.3333
Also, see Timetable Schedule Example.
4.3.2.11.1.5 Timetable Gate File
The timetable gate file is a comma separated (csv) text file defining a group of gates. The header
lists all gates available in the project. Each row corresponds to a different group, with non-zero
values indicating that the given gate is to be included in the group. The gate group names must be
unique both within the file and within the MassMotion project.
Gate groups can be referenced by the Timetable Gate Event File.
Column Headers
Group Name
The name of the location group. The name must be unique both within the
file and across the entire MassMotion project.
Gate Names...
(variable)
Each gate group can indicate which gates are to be included in the group
by specifying a non-zero value in the corresponding column.
Example
See Timetable Gates Example
4.3.2.11.1.6 Timetable Gate Event File
The timetable gate event file is a comma separated (csv) text file defining a number of gate events.
Each row corresponds to a single event and will open one or more gates for a specified period of
time. The names of the events must be unique both within the file and across the MassMotion
project. The events defined within the timetable have no connection to events defined elsewhere in
142
© 2015 Oasys Software Limited
MassMotion
the project.
The start time for an event depends on whether or not a reference event was specified. When using
a reference event, the start time is taken from the reference event. If no reference event is specified,
the start time is assumed to be midnight on the day at which the simulation begins (so the time
offset effectively becomes the start time).
Column Headers
Reference Event
Name (optional)
The name of a reference event as defined in the Timetable Reference Event
File. The field can be left blank to indicate that the event is not associated
with any reference event.
Time Offset
(optional)
Combines with the event start time to define the time at which the event
fires. If a reference event has been specified, this time is added to the
reference event start time. If no reference event has been specified, this
time is taken as the gate event start time, measured relative to midnight
(00:00:00). The value must be either a single number indicating seconds, or
a string of the form hh:mm:ss. If no value is specified a value of 0 is
assumed.
Duration
(optional)
The length of time the gate will remain open. If a reference event has been
specified, this field can be left blank to indicate that the reference event
duration should be used. The value must be either a single number
indicating seconds, or a string of the form hh:mm:ss.
Apply only to
Reference Event
If a reference event has been specified and a true value (Y or 1) is used, the
gate will only open for those agents created by a schedule that uses the
specified reference event. The gate will remain closed to all agents not
arriving from or heading to the reference event.
Key Token
(optional)
The name of an existing token in the project. If specified, the gate will only
open for those agents holding the specified token.
Gates... (variable)
Each subsequent column can specify a gate or gate group to be opened by
the event. Each entry must refer either to an existing gate object in the
project or to a gate group defined in the Timetable Gate File.
Example
See Timetable Gates Example.
4.3.2.11.1.7 Timetable Action Event File
The timetable action event file is a comma separated (csv) text file defining a number of action
events. Each row corresponds to a single event and will fire the specified action for a specified period
of time. The names of the events must be unique both within the file and across the MassMotion
project. The events defined within the timetable have no connection to events defined elsewhere in
the project.
© 2015 Oasys Software Limited
143
MassMotion
The start time for an event depends on whether or not a reference event was specified. When using a
reference event the start time is taken from the reference event. If no reference event is specified the
start time is assumed to be midnight on the day at which the simulation begins (so the time offset
effectively becomes the start time).
When the event fires, the action is applied to all agents in the scene that meet the criteria defined by
the event definition. The event then remains active for the specified duration. If a zone is specified,
the active event will be applied to all agents that enter the zone. If no zone is specified, the active
event will apply to all agents entering the simulation. The event will not be applied to the same agent
twice unless a zone is specified and the agent enters then leaves then re-enters the zone.
Column Headers
144
Reference Event
Name (optional)
The name of a reference event as defined in the Timetable Reference Event
File. The field can be left blank to indicate that the event is not associated
with any reference event.
Time Offset
(optional)
Combines with the event start time to define the time at which the event
fires. If a reference event has been specified, this time is added to the
reference event start time. If no reference event has been specified, this
time is taken as the event start time measured from midnight (00:00:00).
The value must be either a single number indicating seconds, or a string of
the form hh:mm:ss. If no value is specified a value of 0 is assumed.
Duration
The length of time the event remains active. See above for a description of
how the event is applied while active.
Apply only to
Reference Event
If a reference event has been specified and a true value (Y or 1) is used, the
action will only be applied to those agents created by a schedule that uses
the specified reference event.
Key Token
(optional)
The name of an existing token in the project. If specified, the action will
only be applied to agents holding the specified token.
Target Zone
(optional)
The name of an existing zone in the project. If specified, the action will only
be applied to agents in the target zone. If new agents enter the zone while
the event is active, the action is applied to those agents as they enter the
zone. If no zone is specified, the event is applied to all agents in the scene
regardless of location.
Action
The name of an existing action in the project. This action will be applied
once to all agents currently in the scene that meet the event criteria, then
subsequently to all agents that either enter the zone or scene while the
event is active.
Give Tokens...
(optional,
variable)
Each subsequent column can specify a single token by name. The token
must exist in the project. Each agent that is affected by the action event
will also be given the specified tokens. Agents receive the tokens before
the event action is applied.
© 2015 Oasys Software Limited
MassMotion
4.3.2.11.1.8 Timetable Evacuation Event File
The timetable evacuation event file is a comma separated (csv) text file defining a number of
evacuation events. Each row corresponds to a single event and will fire for a specified period of time.
The names of the events must be unique both within the file and across the MassMotion project. The
events defined within the timetable have no connection to events defined elsewhere in the project.
The start time for an event depends on whether or not a reference event was specified. When using a
reference event the start time is taken from the reference event. If no reference event is specified, the
start time is assumed to be midnight on the day at which the simulation begins (so the time offset
effectively becomes the start time).
When the event fires, the evacuation command is given to all agents in the scene that meet the
criteria defined by the event definition. The event then remains active for the specified duration. If a
zone is specified, the active event will be applied to all agents as they enter the zone. If no zone is
specified, the active event will apply to all agents entering the simulation. The event will not be
applied to the same agent twice unless a zone is specified and the agent enters then leaves then reenters the zone.
Column Headers
Reference Event
Name (optional)
The name of a reference event as defined in the Timetable Reference Event
File. The field can be left blank to indicate that the event is not associated
with any reference event. The reference event can be used to define either
the event start time or evacuation location.
Time Offset
(optional)
Combines with the event start time to define the time at which the event
fires. If a reference event has been specified, this time is added to the
reference event start time. If no reference event has been specified, this
time is taken as the event start time measured from midnight (00:00:00).
The value must be either a single number indicating seconds, or a string of
the form hh:mm:ss. If no value is specified, a value of 0 is assumed.
Duration
The length of time the event remains active. See above for a description of
how the event is applied while active.
Apply only to
Reference Event
If a reference event has been specified and a true value (Y or 1) is used, the
evacuation will only be applied to those agents created by a schedule that
uses the specified reference event.
Key Token
(optional)
The name of an existing token in the project. If specified, the evacuation
will only be applied to agents holding the specified token.
Target Zone
(optional)
The name of an existing zone in the project. If specified, the evacuation will
only be applied to agents in the target zone. If new agents enter the zone
while the event is active, the evacuation is applied to those agents as they
enter the zone. If no zone is specified the event is applied to all agents in
the scene regardless of location.
Pre Movement
Distribution (not
used)
Not yet supported.
© 2015 Oasys Software Limited
145
MassMotion
Location...
(optional)
The name of an existing portal in the project, the name of a location group
from the Timetable Location File. If left blank and a reference event has
been specified, the location associated with the reference event is used.
Agents will be told to seek the location. Once the agent reaches the
location it will successfully exit the scene.
Give Tokens...
(optional,
variable)
Each subsequent column can specify a single token by name. The token
must exist in the project. Each agent that is affected by the evacuation
event will also be given the specified tokens.
4.3.2.11.2 Timetable Examples
All timetable examples assume the same general scene which can either be created from scratch
using the steps below, or opened pre built from the TimetableExample.mm project in the Examples
folder of the MassMotion installation directory.
1. Create a scene with the objects positioned and named as shown above.
2. Create an empty timetable object from the 'Activities' ribbon in the MainWindow and name it
'MyTimetable'.
3. Open the MyTimetable properties and use the File button to 'Export Empty Timetable' files to a
folder.
4. Edit the generated timetable files as appropriate (see the examples listed below).
5. Reload all file changes back into the timetable object using the 'Reload' button in the timetable's
properties window.
6. The project is ready for simulation.
Examples:
Timetable Schedule Example
Timetable Gates Example
Timetable Reference Event Example)
146
© 2015 Oasys Software Limited
MassMotion
4.3.2.11.2.1 Timetable Schedule Example
This example includes timetable files for generating a few simple streams of agents moving between
the portals as shown below.
Scene Setup
Create a scene as described in Timetable Examples before attempting to edit the timetable files.
Timetable Setup
A simple curve file defines a few arrival distributions for use in the schedule file:
#
# Sample MyTimetableCurve.csv
#
Curve Name,
Interval Duration,
Values...
# uniformly random over 30 seconds
CConstant30,
30,
1
# uniformly random over 120 seconds
CConstant120,
00:02:00,
1
# tapered over 60 seconds
CTapered60,
10,
0.5,
0.3,
0.1,
0.05,
0.025,
0.2,
0.01,
0.45,
0.15,
0.29
0.025
# custom rates over 1 hour
CCustom1H,
0.2h,
A simple location file defines groupings of portals for easy reference in the schedule file:
© 2015 Oasys Software Limited
147
MassMotion
#
# Sample MyTimetableLocation.csv
#
Group Name,
U se Closest Goal,
Portal_A1, Portal_A2,
Portal_A3,
Portal_B1,
Portal_B2,
Portal_B3,
Portal_Street1,
Portal_Street2
# Track A has uneven arrival distribution of agents across the cars, but departing agents take
GTrackA,
Y,
0.20,
0.40,
0.40
# Track B has even arrival distribution and departing agents are evenly assigned across the car
GTrackB,
,
,
,
,
Y,
Y,
Y
,
,
# A simple group to to include both street portals
GStreet,
,
,
,
,
,
Y,
Y
And finally the schedule file for generating agents
#
# Sample MyTimetableSchedule.csv
#
From,
To,
Population,
Time Offset,
Curve,
Avatar or Colour,
Profile,
Init Action,
Give Tokens...
# 100 agents at 00:15:00 over 1 hour, from either street portal to Portal_Inside, default profi
GStreet,Portal_Inside,
100,
00:15:00,
CCustom1H,
Red
# 45 and 23 agents at 00:15:00 over 1 hour, from Portal_Inside to the street portals
Portal_Inside,
Portal_Street1,
45,
15m,
CCustom1H,
Blue
Portal_Inside,
Portal_Street2,
23,
15m,
CCustom1H,
Blue
# 60 agents at 00:20:00 over 1 second from portals on Track A to the street, initialized with a
GTrackA,GStreet,
60,
00:20:00,
Green,
InitArrivingPax
# 100 agents at 27:30:00 over 120 seconds, from TrackA portals to TrackB portals, giving tokens
GTrackA,GTrackB,
100,
27:30:00,
CConstant120,
Red,
,
,
TNextDay,
Ttransfer
4.3.2.11.2.2 Timetable Gates Example
This example includes timetable files for opening and closing a series of gates. This example could
be used in combination with other timetable files, regular agent schedules, or regular gate events to
achieve the desired result.
Scene Setup
Create a scene as described in Timetable Examples before attempting to edit the timetable files.
148
© 2015 Oasys Software Limited
MassMotion
Timetable Setup
A simple gate file defines groupings of links for easy reference in the gate event file:
#
# Sample MyTimetableGate.csv
#
Group Name,
Gate_A1,
Gate_A2, Gate_A3,
Gate_A4,
Gate_A5,
Gate_A6,
Gate_B1,
Gate_B2,
Gate_B3
Gate_B4
Gate_B5
Gate_B6
# Combine all gates for track A into a single group for easy reference in gate events
Gates_A,Y,
Y,
Y,
Y,
Y,
Y
# Track B has even arrival distribution and departing agents are evenly assigned across the car
Gates_B,,
,
,
,
,
,
Y,
Y,
Y,
Y,
Y,
Y,
And finally the gate event file for opening and closing gates.
#
# Sample MyTimetableGateEvent.csv
#
Reference Time
Event,
Offset,
Duration, Apply OnlyKey
to Token,
Reference
Gate Event,
# Open all gates in the group Gates_A at 00:30:00 for 1 minute, for all agents
,
00:30:00,
1m,
,
,
Gates_A
# Open all gates in the group Gates_B at 00:35:00 for 30 seconds, only for agents holding the t
,
00:35:00,
30,
,
TArriving,Gates_B
# Open Gate_B4 at 32:30:00 for 1 hour, for all agents
© 2015 Oasys Software Limited
149
MassMotion
,
32:30:00,
01:00:00, ,
,
Gate_B4
4.3.2.11.2.3 Timetable Reference Event Example
This example includes timetable files for simulating a simple train platform using reference events. A
continuous stream of departing agents will move from the street and inside portals to both of the
platforms. Train arrivals will be represented by reference events. When a train arrives on track A or
B, a group of arriving agents will be generated and the corresponding gates opened to allow passage
for boarding and alighting passengers. In addition to the train arrivals, a reference event will be used
to represent a street festival to which some agents will be
Scene Setup
Create a scene as described in Timetable Examples before attempting to edit the timetable files.
In addition to the general steps outlined above, create tokens TTrainA, TTrainB
Timetable Setup
A simple curve file defines a few arrival distributions for use in the schedule file:
#
# Sample MyTimetableCurve.csv
#
Curve Name,
Interval Duration,
Values...
# uniformly random over 1 hour
CConstant1H,
01:00:00,
1
A simple location file defines groupings of portals for easy reference in the schedule file:
#
# Sample MyTimetableLocation.csv
#
150
© 2015 Oasys Software Limited
MassMotion
Group Name,
U se Closest Goal,
Portal_A1, Portal_A2,
Portal_A3,
Portal_B1,
Portal_B2,
Portal_B3,
Portal_Street1,
Portal_Street2
# Track A has uneven arrival distribution of agents across the cars, but departing agents take
GTrackA,
Y,
0.20,
0.40,
0.40
# Track B has even arrival distribution and departing agents are evenly assigned across the car
GTrackB,
,
,
,
,
Y,
Y,
Y
,
,
# A simple group to to include both street portals
GStreet,
,
,
,
,
,
Y,
Y
The reference event file defines each reference event with corresponding time and location. The
reference event can then be referenced from other event files or the schedule file.
#
# Sample MyTimetableReferenceEvent.csv
#
Reference Event
Start Name,
Time,
Duration, Location,
Init Action,
Give Tokens...
# Train A arrivals at portals in the GTrackA group (could be repeated any number of times)
Arrive_A1, 14:40:00,
,
GTrackA,
,
Arrive_A2, 14:55:00
,
GTrackA
,
# Train B arrivals at portals in GTrackB group (could be repeated any number of times)
Arrive_B1, 14:45:00,
,
GTrackB,
,
Arrive_B2, 14:54:00,
,
GTrackB,
,
# Festival event happening at Portal_Street1
Festival,
15:00:00,
01:00:00, Portal_Street1,
InitFestivalAgents
The schedule generates agents. Some agents are based on the locations and times of reference
events, and others are simply bound from one portal or location to another.
#
# Sample MyTimetableSchedule.csv
#
From,
To,
Population,
Time Offset,
Curve,
Avatar,
Profile,
Init Action,
Give Tokens...
# agents departing on tracks A and B (independent of any reference events)
GStreet,GTrackA,
200,
14:15:00,
CConstant1H,
Red
Portal_Inside,
GTrackA,
100
14:15:00,
CConstant1H,
Red
GStreet,GTrackB,
200,
14:15:00,
CConstant1H,
Blue
Portal_Inside,
GTrackB,
100,
14:15:00,
CConstant1H,
Blue
© 2015 Oasys Software Limited
151
MassMotion
# agents arriving on trains A1 and A2 (over 1s), with a -5s offset to make sure they're ready t
Arrive_A1,
GStreet,
20,
Arrive_A1,
Portal_Inside,
6,
-5,
,
Green
-5,
,
Green
# agents arriving on trains B1 and B2 (over 1s), with a -5s offset to make sure they're ready t
Arrive_B1,
GStreet,
25,
-5,
,
White
Arrive_B2,
Portal_Inside,
10,
-5,
,
White
# agents going to the festival, starting to appear 45 minutes before it starts
Portal_Inside,
Festival,
100,
-00:45:00,
CConstant1H,
Yellow
GStreet,Festival,
57,
-00:45:00,
CConstant1H,
Yellow
# agents arriving on trains and going to the location defined by the Festival reference event
Arrive_A1,
Festival,
3,
-5s,
,
Orange
Arrive_B1,
Festival,
6,
-5s,
,
Orange
Arrive_B2,
Festival,
1,
-5s,
,
Orange
The gate file defines groupings of links for easy reference in the gate event file:
#
# Sample MyTimetableGate.csv
#
Group Name,
Gate_A1,
Gate_A2, Gate_A3,
Gate_A4,
Gate_A5,
Gate_A6,
Gate_B1,
Gate_B2,
Gate_B3
Gate_B4
Gate_B5
Gate_B6
# Combine all gates for track A into a single group for easy reference in gate events
Gates_A,Y,
Y,
Y,
Y,
Y,
Y
# Track B has even arrival distribution and departing agents are evenly assigned across the car
Gates_B,,
,
,
,
,
,
Y,
Y,
Y,
Y,
Y,
Y,
The gate event file opens and closes the gates based on train arrival reference events
#
# Sample MyTimetableGateEvent.csv
#
Reference Time
Event,
Offset,
Duration, Apply OnlyKey
to Token,
Reference
Gate Event,
# Open gates briefly for arriving agents only (those generated from the schedule based on Arriv
Arrive_A1,00:00:00,
10,
Y,
,
Gates_A
# Open gates for all other agents departing on track A
Arrive_A1,00:00:10,
50,
,
,
Gates_A
,
Gates_A
# Similar events for all other arrivals
Arrive_A2,00:00:00,
152
10,
Y,
© 2015 Oasys Software Limited
MassMotion
Arrive_A2,00:00:10,
50,
,
,
Gates_A
Arrive_B1,00:00:00,
10,
Y,
,
Gates_B
Arrive_B1,00:00:10,
50,
,
,
Gates_B
Arrive_B2,00:00:00,
10,
Y,
,
Gates_B
Arrive_B2,00:00:10,
50,
,
,
Gates_B
4.3.2.12 Token
Tokens are objects held by agents. They can be used to identify certain agents or to limit access
at connection objects. Tokens are given or removed using Agent Actions.
4.3.2.13 Vehicle
Vehicle events are used to simulate the alighting and boarding of passengers from/to vehicles at
regular intervals, such as at a subway station. Gated links can be used to simulate the opening of
vehicle doors.
Vehicles "arrive" at controllable intervals and open their doors (ie. gated links) for as long as they
"dwell". Alighting agents will be created automatically slightly before the doors open, but boarding
agents can have more finely tuned arrival times. Origin and destinations of boarding and alighting
agents do not need to be the same, or have the same weights.
Darker agents alighting from a vehicle event w ith lighter
agents boarding.
Alternative Uses
Not all features of the vehicle event need to be used at once, nor does the event need to be used
specifically for vehicles. It can be used simply to open gates at irregular intervals, or to create bursts
of agents at controllable intervals.
Gates do not necessarily need to be near either the origins or destinations of agents, nor do they
need to separate their origins and destinations. Additional gates can be included, allowing the
vehicle event to control the flow of agents beyond those boarding and alighting.
Properties
© 2015 Oasys Software Limited
153
MassMotion
Vehicle Tab
Arrivals: First
Arrival
When the first vehicle "arrives". If a vehicle arrives too close to the
simulation start, no alighting agents will be created.
Arrivals: Repeat
How many times a vehicle will arrive.
Until End: An unlimited number of vehicles will arrive.
Specified Count: A specified number of vehicles will arrive
Timing: Headway
The time between vehicle arrivals. This can be specified as a distribution.
Timing: Dwell
Time
How long vehicles dwell with the vehicle doors open. This is can be
specified as a distribution.
If dwell time exceeds headway time, the vehicle doors will remain open
until the last vehicle leaves.
Vehicle Doors
Gated links and collections of gated links representing the vehicle doors.
These doors are opened when the vehicle arrives and are kept open for as
long as the vehicle dwells.
Alighting Tab
Create alighting
agents
Enable the creation of alighting agents.
Population: Agent
count
The number of alighting agents created each time a vehicle arrives. Agents
will be created a few seconds before the vehicle arrives and doors open to
give them time to marshal in front of the vehicle doors.
Population:
Profile
The profile used to create alighting agents. If a collection is specified, each
agent will be assigned one of the profiles from the collection. A weighted
collection can be used to alter the distribution of profiles amongst the
population.
Vehicle Origins
The portals and collections of portals at which alighting agents will be
created. Portals can be weighted to create more agents than others. See
Choosing Objects for more details.
Vehicle
Destinations
The portals and collections of portals to which alighting agents will travel.
Agent goals can be set to either travel to a portal assigned by weights, or
to the nearest portal available.
If using "Assigned" agent goals, the portals can be weighted to be a
destination for more agents. See Choosing Objects for more details.
Boarding Tab
154
Create boarding
agents
Enable the creation of boarding agents.
Timing: Before
The time before vehicle arrival that boarding agents start being created.
© 2015 Oasys Software Limited
MassMotion
arrival
Population:
Profile
The profile used to create boarding agents. If a collection is specified,
each agent will be assigned one of the profiles from the collection. A
weighted collection can be used to alter the distribution of profiles amongst
the population.
Population:
Demand
The number of agents the event will create and when they will be created
(relative to the start of boarding arrivals as specified by the 'Before arrival'
and vehicle arrival times). If demand duration exceeds headway time,
separate distributions of boarding agents will overlap.
Evenly spaced: The specified number of agents will arrive at a constant
rate over the duration.
Instant: The specified number of agents will arrive all at once at the event
start time.
Random: The specified number of agents will arrive according to the
specified distribution over the duration. See Agent Start Distributions for
information on arrival distributions.
Table: Complex agent arrival is described by a series of rows. Each row
contains the duration of an interval and the number of agents to create over
that interval. The first interval starts at the event start. Subsequent
intervals begin when the previous interval ends. Agents are created
according to a uniform distribution within each interval.
Vehicle Origins
The portals and collections of portals at which boarding agents will be
created. Portals can be weighted to create more agents than others. See
Choosing Objects for more details.
Vehicle
Destinations
The portals and collections of portals to which boarding agents will travel.
Agent goals can be set to either travel to a portal assigned by weights, or
to the nearest portal available.
If using "Assigned" agent goals, the portals can be weighted to be a
destination for more agents. See Choosing Objects for more details.
Colours Tab
Alighting /
Boarding:
Colours
Defines the colour scheme for alighting /boarding agents.
Event colour: Agents are assigned the same colour as the event object.
Lighten event colour: Agents are assigned a lighter version of the event object
colour.
Darken event colour: Agents are assigned a darker version of the event object
colour.
Rule based: Agents are assigned a colour according to the colouring rules.
Working from top to bottom, agents will use the first colour for which the condition
evaluates to true.
Specified colour: Agents are assigned the specified colour.
Actions Tab
© 2015 Oasys Software Limited
155
MassMotion
Alighting /
Boarding:
On birth
The action will be applied to all boarding/alighting agents created by the event as
they enter the simulation. For a description of the order in which actions are
applied see Action Order of Execution.
Collections in vehicle events
Collections can be used in the "Vehicle Doors" property. All member links with gates enabled will be
opened as if they were directly used.
They can also be used in "Origins" and "Destination" properties for alighting and boarding agents.
The collections can be weighted, changing the distribution of agents going from/to various portals.
4.3.3
Analysis Objects
Analysis
Object
Type
Description
Simulati
on Run
Represents the results of a simulation by defining links to results database files (.
mmdb). These form the basis the analysis system and are used as a parameter to
most types of queries.
Agent
Filter
A reusable analysis object. These allow queries to target agents meeting specific
criteria, including location, density, etc.
Cordon
A reusable analysis object. These objects represent boundaries in space that agents
can cross. Despite appearing in the scene, they do not impact simulations.
Region
A reusable analysis object. These objects represent volumes in space that may
contain agents. Despite appearing in the scene, they do not impact simulations.
Trip
A reusable analysis object. These objects represent an ordered series of locations
an agent may traverse over its lifetime.
Graphs
A query analysis object that produces graphs.
Agent Density: Counts the number of agents at various levels of crowd density.
Agent Speed Ratio: Counts the number of agents with different ratios of actual to
desired speed..
Composite: Fully customizable graph which can combine any number of simulation
runs and values.
Flow Count: Counts the number of agents crossing various transitions.
Performance Graph: Compares performance of simulation runs.
Population Count: Counts the number of agents in different areas.
Region Density: Measures the average density over one or more regions.
Server Population Count: Counts the number of agents at various servers.
Maps
A query analysis object. These queries paint objects in the scene based on the
behaviour of agents. With the exception of the Vision Time Map, all maps may only
be applied to walkable objects.
Agent Count: Counts the number of unique agents that cross each point.
Agent Path: Traces the route taken by each agent.
156
© 2015 Oasys Software Limited
MassMotion
Agent Time to Exit: The time required for an agent to exit from each point.
Average Density: The average density at each point.
Average Non-Zero Density: The average non-zero density at each point.
Dynamic Path: The average non-zero density at each point.
Experienced Density: The experienced density at each point.
Instantaneous Density: The current density at each point. This map is "live" and
updates with simulation playback.
Maximum Density: The maximum density at each point.
Static Cost: The cost perceived by agents to reach various destination portals. This
map does not require a simulation run.
Static Distance: The measured distance to various destination portals. This map
does not require a simulation run.
Time Above Density: The time agents spend above a specified density at each
point.
Time Occupied: The time for which each point is occupied by an agent.
Time Until Clear: The time before the last agent leaves each point.
Vision Time: The time agents spend looking at a surface. This map can be applied
to barriers.
Tables
A query analysis object that produces tables.
Agent Area Time: Lists the amount of time agents spend in given areas.
Agent LOS Time: Lists the amount of time agents spend at each level of service.
Agent Process Chain Time: Lists the amount of time agents spend in a process
chain.
Agent Summary: Provides general information about each agent.
Agent Timetable Summary: Provides a summary of agents produced by a given
timetable
Agent Token Time: Lists the amount of time agents carry given tokens.
Agent Trip Time: Lists the time required for agents to complete a given trip.
Origin/Destination: Counts the number of agents entering and exiting at each portal
Performance Table: Provides diagnostics for simulation runs
Server Summary: Lists queue times and other information for servers.
4.3.3.1
Simulation Run
A simulation run represents a single iteration of a MassMotion simulation. It maintains a connection
to a generated database and is used by both playback and analysis queries to extract results from
disk.
A simulation run can be created automatically when a simulation is executed, with results written to
the specified database file (see Simulation Data). An empty simulation run can also be created from
the main window's analysis ribbon. An empty simulation run can be used to connect to an existing
database file by editing the simulation run properties. This is useful when comparing results from
different projects; a simulation run object can be created in one project that is then set to point at
the results generated from a different project so that they can be compared.
For the purposes of playback and queries, it is possible to have multiple simulation runs reading
from the same database file at the same time (perhaps highlighting different areas by using the run's
agent filter). However, only one simulation may be executed at once. During simulation any other
simulation runs which point to the same database will be prevented from reading the database until
the simulation is complete. Similarly, when using the movie and image export tools, a lock is placed
on the simulation runs used and they may not be used for simulation until the export window is
closed.
© 2015 Oasys Software Limited
157
MassMotion
Object Properties
The properties of a simulation run object allow users to change which database file is connected as
well as the appearance of agents displayed by the object.
Properties
Database File
The file to which the object is connected. Simulation execution writes to
this file while playback and analysis read from this file.
Status
The status of the simulation run's connection to the database. Users can
refresh the connection by pressing the refresh button.
Agent Colour
The colour of agents from the simulation run.
The following options are available:
Custom: User specified colour.
Simulation Run Colour: The colour of the simulation run object.
Database: The agent colours stored in the database. This is the default
setting.
Database Darkened: The agent colours stored in the database but
darkened.
Database Lightened: The agent colours stored in the database but
lightened.
Fruin LOS (auto): Use object type specific Fruin Level of Service
colouring. The exact colour cutoff values will vary by the type of object
agents are on (eg. stairs vs floors).
Fruin Queuing (Platform) LOS: Use standard Fruin colouring for
queuing.
Fruin Stairway LOS: Use standard Fruin colouring for stairs.
Fruin Walkway LOS: Use standard Fruin colouring for walkways.
IATA Wait/Circulate LOS: Use standard IATA (International Air
Transport Association) Wait/Circulate colouring.
Agent Filter
Simulation runs can use an agent filter to modify how agents are displayed.
For instance, an agent filter could be used to only show agents that were
created by a particular schedule, or give a different colour to agents
currently undergoing a particular trip.
The following properties control how the filter is used:
Enable agent filter: This must be checked to enable the agent filter.
Mode: Set whether agents matching the filter are coloured differently or
are hidden. Alternatively, agents not matching the filter can be hidden.
Colour: What colour to use for filtered agents (only available if 'Colour
filtered agents' is specified).
Filter: The agent filter to use.
Status: Indicates whether the agent filter is currently applied. Users may
need to refresh this when the agent filter or properties are changed.
158
© 2015 Oasys Software Limited
MassMotion
4.3.3.2
Agent Filter
Agent filters provide a powerful way to set up queries (graphs, tables, maps) that operate on a
specific (possibly time-varying) set of agents. Refer to the various Graph, Table and Map types for
descriptions of how filters can be used in different types of queries.
Fundamentally, a filter is an object that, for any instant in time, generates a list of agents satisfying
the filter. For instance, a 'holding token' filter would generate, at every instant, a list of all agents
holding a particular token at that instant. Some filters combine or transform other filters in different
ways. For instance, an 'all of' filter could combine a 'holding token' and an 'at server' filter to create a
combined filter that would generate, at any instant, a list of agents at a particular server holding a
particular token.
One important type of transforming filter is an 'are ever' filter. This filter can be thought of as a
qualifier on another filter; instead of agents only being included in the generated list while they
satisfy some criterion (and therefore potentially dropping in and out of the generated list over time),
they are always included in the list if they ever satisfy the criterion during a particular time period.
For instance, as shown below, an Agent Path Map using the filter 'at server' would result in agent
paths being shown only for agents currently at the server. By using 'are ever' in combination with 'at
server' during a particular time period, the map would instead show paths of agents as they
approached and after they left the server (but no paths at all for agents who were never at the server).
Unfiltered paths
© 2015 Oasys Software Limited
159
MassMotion
Paths filtered by 'At server'
Paths filtered by 'Are ever' > 'At server'
Filter Debugging
An excellent way to determine if a filter is working as expected is to set a particular simulation to
colour agents differently based on whether or not they satisfy the filter (see Simulation Run for
details). For instance, a simulation run can be set to colour all agents blue unless they currently
satisfy a given filter, in which case they should be coloured green. By then using the various
playback controls in the time panel (such as dragging the timeline slider), it is easy to see which
agents satisfy the filter at which times.
160
© 2015 Oasys Software Limited
MassMotion
Named Filters
Agent filters can be created inline within a query, for use within that query. Filters can also be
created as independent, named objects by clicking on the 'Agent Filter' button in the Analysis
toolbar; these can then be referred to within other filters and queries, as discussed below.
Building Filters
Filters are built using a cascading set of drop-down menus. Wherever a filter is required, a drop-down
menu will be available to select the filter type. Each filter type may reference one or more other
objects. Depending on the type of filter chosen, more drop-down menus or entry fields may appear to
select those objects. The table below shows the various filter types available, along with their
required references and what agents are included in the generated list at every instant.
Note that not all filter types are immediately available in all situations, as some types of queries
require a filter that produces a fixed set of agents instead of a dynamically-changing one. In these
cases, an 'are ever' filter can usually be used in combination with the desired filter to obtain the
desired effect. For instance, it is not possible to create an Origin/Destination table for agents at a
particular cordon (as it is not clear what that would mean), but it is possible to create such a table
for agents that are ever at a particular cordon.
Collections in agent filters
Collections can be used to define agent filters and allow for the creation of more complex filters. It is
also more convenient to use a single "in area" filter with a collection, as opposed to an "any of filter"
followed by several individual "in area" filters.
Filter Type
References
Agents Included
All agents
None
All agents.
Selected
agents
None
Agents that are currently selected. Note that this filter is 'live',
and refers that whatever agents are selected when the filter is
actually used, not when it is created. For instance, if an Agent
Path map was created using this filter, whatever agents were
selected when the 'Evaluate' button was pressed would have their
paths shown. If later on a different set of agents was selected
and the map was re-evaluated, the map would change to show
the paths of the newly-selected agents.
Named
filter:
Named filter
Those included by the referenced named filter.
Are ever:
Filter
Agents that are ever included by the referenced filter at any
instant during a particular time period.
Not:
Filter
Agents not included by the specified filter.
Compound
filter:
Two filters
Agents included by the two filters combined with the specified
logic.
All of:
One or more
filters
Agents included by all of the referenced filters at a given instant.
Any of:
One or more
filters
Agents included by any of the referenced filters at a given
instant.
© 2015 Oasys Software Limited
161
MassMotion
162
Filter Type
References
Agents Included
None of:
One or more
filters
Agents included by none of the referenced filters at a given
instant.
Created by:
Timetable or
schedule
Agents that were initially created by the referenced timetable or
schedule.
Entered
simulation
at:
Portal
Agents that entered the simulation at the given portal.
With collections: Agents that entered the simulation at any of
the portals in the collection are included.
Exited
simulation
at:
Portal
Agents that exited the simulation at the given portal.
With collections: Agents that exited the simulation at any of the
portals in the collection are included.
From
profile:
Profile
Agents that were created with the referenced profile.
With collections: Agents that were created with any of the
profiles in the collection are included.
Has end
state:
None
Agents that finished the simulation with the specified state:
in simulation: still in scene at simulation end
exited with success: exited simulation as expected
exited with error: was deleted from simulation with an error.
At server:
Server
Agents that are at the referenced server. Agents are considered
to be 'at' a server from the first time when they are either being
processed by the server or are queueing for the server (blocked
by another agent that is at the server), until they are finished
being processed by the server.
With collections: Agents that are at any of the servers in the
collection are included.
At
transition:
Transition
Agents that are currently performing the specified transition (this
will only be true for an instant for any agent and so is often used
in combination with 'Are ever').
Local
density:
Upper and
lower density
bounds
Agents that currently have a local density around them that is in
the given range.
Current
speed:
Upper and
lower speed
bounds
Agents whose speed is currently in the given range.
Holding
token:
Token
Agents currently holding the referenced token.
With collections: Agents currently holding any of the tokens in
the collection are included.
In area:
Area
Agents currently in the given area.
With collections: Agents currently in any of the areas in the
collection are included.
In trip:
Trip
Agents currently in the referenced trip (have started and have not
yet finished). See Trips for a description of when an agent is
considered to be 'in' a trip.
© 2015 Oasys Software Limited
MassMotion
4.3.3.3
Cordon
Analysis cordon objects are used when performing analysis but have no impact on the simulation
itself. Agents will ignore objects of this type. It is possible to create and use cordon objects for
analysis on previously generated simulation runs without having to re-execute the run.
Notes on geometry
Must be a single polygon mesh object or a collection of polygon mesh objects. There are no other
restrictions on shape or orientation; cordons can be horizontal, vertical, curved or even closed
volumes (in which case agents will be counted when passing into or out of the volume).
During analysis, agents will be considered 'at' the cordon when the centre point between their feet
crosses any surface of the cordon object.
Properties
There are no properties for objects of this type.
4.3.3.4
Region
Analysis region objects are used when performing analysis but have no impact on the simulation
itself. Agents will ignore objects of this type. It is possible to create and use region objects for
analysis on previously generated simulation runs without having to re-execute the run.
Agents are considered inside a region when their feet are inside the region.
Notes on geometry
Must be a single polygon mesh object or a collection of polygon mesh objects.
During analysis, agents will be considered 'in' the region if the centre point between their feet is
within any of the volumes defined by the meshes.
Properties
There are no properties for objects of this type.
4.3.3.5
Trip
A trip in MassMotion is a way of describing a particular route or path through the model. It is defined
by a list of one or more areas, cordons, portals or servers.
Agents are considered to complete a trip if they crossed each of the objects in the trip in sequence.
There may be gaps in between objects. For instance, a trip could be specified as two links. Agents
that crossed the first link, then traversed an intermediate floor, then crossed the second link would
be considered to have completed the trip even though while crossing the floor they were not at either
of the two links.
Trips are created by using the 'Trip' button in the Analysis toolbar, or can be created inline when
constructing some types of queries (such as the Agent Trip Time table) or filters ('In trip'). Trips
created using the toolbar button can later be referenced by queries or filters.
In addition to specifying an ordered list of objects that define the trip, options exist to define when
exactly the trip is considered to begin and end (and therefore when an agent is considered to be 'in'
the trip):
Begin when
Entering
first item
© 2015 Oasys Software Limited
The trip begins at the moment the agent enters or crosses the first object. Agents
may enter an object by transitioning from another area/object, or entering the
163
MassMotion
simulation within that item.
Entering or
at first item
The trip begins at the moment the agent enters or crosses the first object, or at
the beginning of the query period if the agent is already on/in the object/area.
Exiting first
item
The trip begins at the moment the agent exits or crosses the first object.
End when
Exiting last
item
The trip ends at the moment the agent exits or crosses the last object. Agents
may exit an object by transitioning to another area/object, or by exiting the
simulation within that item.
Exiting or
at last item
The trip ends at the moment the agent exits or crosses the last object, or at the
end of the query period if the agent is still on/in the object/area.
Entering
last item
The trip ends at the moment the agent enters or crosses the last object.
Note that for the special case of analysis cordons, all of the above options are equivalent and simply
refer to the time at which the agent crossed the cordon. If, therefore, the trip is defined as starting
and ending at cordons, the options chosen are irrelevant.
Collections in trips
If a collection is part of a trip, agents are considered to complete that part of the trip if they reach
any of the members in the collection. This can be used to construct more complex trips with
branching routes.
A current limitation on trips is that each object may only appear once per trip, however collections
can be used as a workaround. For example, to create a round trip from FloorA to FloorB and back, a
trip can be created consisting of FloorA, FloorB and a collection containing only FloorA.
4.3.3.6
Graphs
Graph queries plot the number of agents under various conditions over time, including at certain
locations or in crowds above a certain density.
Once evaluated, graphs can be exported as an image or a CSV file of the plotted values. The
following image formats are supported: *.png, *.svg, *.pdf
Graph Styles
The title and axis labels of graphs can be set for each graph, as well as the inclusion of a legend.
The colour of datasets is set by the groups in the graph structure (see below).
Several styles of graph are available, though not all types of graphs may support each one. Stepped
graphs and bar graphs require a "bucket size" which is the duration which each section of the graph
lasts.
Stacked area and bar graphs additionally support a 'normalized' option. If this is selected, the values
at every instant will be normalized to sum to 100. This allows, for instance, indicating the percentage
164
© 2015 Oasys Software Limited
MassMotion
of agents at different density levels in an Agent Density graphs instead of the absolute counts.
Curves
Curves (Stepped)
Stacked Areas
Stacked Areas (Stepped)
Bars
Stacked Bars
Navigating Graphs
Once a graph is generated, subsections of the graph can be examined in further detail by clicking
and dragging to define an area to zoom to in the graph. The view can be reset by middle clicking the
graph.
Graph Structure
Graphs use a tree structure to organize their source data into datasets. Multiple items can be added
at each level; for instance, multiple groups can be placed under a filter.
Items are nested in the following order:
Graph Item
Description
1.
Simulation
Run
The simulation run to analyse. Most graphs only operate on a single simulation
run and have it as a separate "General" parameter.
© 2015 Oasys Software Limited
165
MassMotion
2. Graph
Type
The type of data to graph. Composite graphs can combine different Flow Counts,
Population Counts or Server Population Counts.
3. Filter
(optional)
An agent filter that limits which agents are counted.
4. Group
A dataset. The colour shown in the graph is set by this item.
5. Group
Members
Sources of data which are grouped into a dataset. Counts from individual group
members can either be summed, or displayed as separate series on the graph.
Composite graphs allow full use of this tree structure:
Com posite graph tree structure
Most graphs, however, use a more simplified tree structure and implicitly add simulation run and
graph types.
Flow graph tree structure
Agent density graphs generate the entire tree structure implicitly.
Graph Types
166
Agent Density
Counts the number of agents at various levels of crowd density.
Agent Speed
Counts the number of agents with different ratios of actual to desired speed.
© 2015 Oasys Software Limited
MassMotion
Ratio
Composite
Fully customizable graph which can combine any number of simulation runs
and values.
Flow Count
Counts the number of agents crossing various transitions.
Performance
Graph
Compares performance of simulation runs.
Population
Count
Counts the number of agents in different areas.
Region Density
Computes the average density over time for one or more regions.
Server
Population
Count
Counts the number of agents at various servers.
4.3.3.6.1 Agent Density
An agent density graph is a special graph type that shows the breakdown of agents within different
density ranges (see LOS Colour Mapping). The graph will be shown as stacked areas, with each
band corresponding to one density range.
Agent Density Parameters
Name
The name of the graph.
Simulation
run
The simulation run for which counts should be calculated.
Reporting
period
The time period over which counts should be calculated.
Sampling
period
How frequently to count the numbers of agents at different densities. Specifying a
larger value will reduce the amount of time needed to generate the graph, but
using very large values runs the risk of missing peaks in density that may occur
between samples.
Title
Graph title (will be included in exported images and CSV files).
X axis
X axis label (will be included in exported images and CSV files).
Y axis
Y axis label (will be included in exported images but not CSV files).
Normalized
If checked, agent counts will be normalized to sum to 100 (i.e., displayed as
percentages instead of absolute values).
Show
Legend
Display graph legend (will be included in exported images but not CSV files).
Graph must be regenerated to update dataset labels.
Show
Metadata
Display information about the MassMotion version and database file used to
generate the graph (will be included in exported images and CSV files).
Agent Filter
Used to specify which agents should be included in the graph. This can be used
© 2015 Oasys Software Limited
167
MassMotion
to display density ranges only for agents in a given area, only for those
undergoing a particular trip, only those holding a specific token, etc.
Density
Ranges
Specifies the density ranges and corresponding colours that should be used to
build the graph. In addition to the standard Fruin walkway, stairway and platform
(queueing) metrics, custom density levels and colours can be defined.
Notes
A simple field that can be used to save comments or explanation about the graph.
This will be saved, but will not be exported to CSV.
4.3.3.6.2 Agent Speed Ratio
An agent speed ratio graph is a special graph type that shows the breakdown of agents within
different ranges of speed ratios (ratio of actual to desired speed). The graph will be shown as
stacked areas, with each band corresponding to one speed ratio range.
Agent Density Parameters
168
Name
The name of the graph.
Simulation
run
The simulation run for which counts should be calculated.
Reporting
period
The time period over which counts should be calculated.
Sampling
period
How frequently to count the numbers of agents at different speed ratios.
Specifying a larger value will reduce the amount of time needed to generate the
graph, but using very large values runs the risk of missing peaks that may occur
between samples.
Title
Graph title (will be included in exported images and CSV files).
X axis
X axis label (will be included in exported images and CSV files).
Y axis
Y axis label (will be included in exported images but not CSV files).
Normalized
If checked, agent counts will be normalized to sum to 100 (i.e., displayed as
percentages instead of absolute values).
Show
Legend
Display graph legend (will be included in exported images but not CSV files).
Graph must be regenerated to update dataset labels.
Show
Metadata
Display information about the MassMotion version and database file used to
generate the graph (will be included in exported images and CSV files).
Agent Filter
Used to specify which agents should be included in the graph. This can be used
to display speed ratio ranges only for agents in a given area, only for those
undergoing a particular trip, only those holding a specific token, etc.
Speed
Ratio
Ranges
Specifies the speed ratio ranges and corresponding colours that should be used
to build the graph. Defaults to ratios based on standard Fruin walking speeds.
Notes
A simple field that can be used to save comments or explanation about the graph.
© 2015 Oasys Software Limited
MassMotion
This will be saved, but will not be exported to CSV.
4.3.3.6.3 Composite
Composite graphs are an advanced feature that allow data of different types and/or from different
simulation runs to be compared. For instance, flow counts could be compared between two different
simulation runs with slightly different configurations, or flow counts and population counts could be
compared on the same graph.
The tree structure used to define composite graphs has a more complex structure than other graph
types. In addition to filters, groups, and group member items, composite graph trees have separate
items corresponding to different simulation runs and different graph types. As with other graph types,
composite graphs are built top-down. Items are added in the following order:
1.
2.
3.
4.
5.
Simulation run
Graph type (population count, flow count, or server population count)
Filter (optional)
Group
Group members
Multiple items can be added at each level; for instance, multiple graph types can be added under a
single simulation run, and a graph type can have multiple groups or filtered groups beneath it.
Composite Graph Parameters
Name
The name of the graph.
Reporting
period
The time period over which results should be calculated.
Title
Graph title (will be included in exported images and CSV files).
X axis
X axis label (will be included in exported images and CSV files).
Y axis
Y axis label (will be included in exported images but not CSV files).
Show
Legend
Display graph legend (will be included in exported images but not CSV files).
Graph must be regenerated to update dataset labels.
Show
Metadata
Display information about the MassMotion version and database file used to
generate the graph (will be included in exported images and CSV files).
Style
Composite graphs can be displayed as curves, stepped curves and bars. For
stepped curves and bars, a bin size must be specified and values for each series
on the graph will be aggregated within time intervals of the given size. Note that
this will occur in whichever way is most appropriate for each series type; eg.
series representing population or queue counts will be averaged within time
intervals while flow counts will be summed. If sampling period exceeds bin size,
zero values will be present.
Notes
A simple field that can be used to save comments or explanation about the graph.
This will be saved, but will not be exported to CSV.
© 2015 Oasys Software Limited
169
MassMotion
4.3.3.6.4 Flow Count
Flow count graphs can be created to measure the number of agents performing specified transitions
during particular time intervals (bins).
Groups in a flow count graph are composed of one or more transitions. Each graph can be
configured to produce multiple series showing the flow counts for each of the selected transitions
independently, or one series showing the flow count treating all selected transitions as a single
combined transition.
If a group of transitions is created under a filter, only agents satisfied by that filter will be included in
the associated counts. Note the distinction between using a filter such as 'holding token' versus 'are
ever holding token'. In the first case, agents will be included in the flow count only if they are holding
the specified token while crossing the specified transition. In the second case, agents will be
included in the flow count as long as they ever held the specified token at some point during the
reporting period.
Flow Count Parameters
Name
The name of the graph.
Simulation
run
The simulation run for which counts should be calculated. To compare flow counts
between different runs, a composite graph can be used.
Reporting
period
The time period over which counts should be calculated.
Title
Graph title (will be included in exported images and CSV files).
X axis
X axis label (will be included in exported images and CSV files).
Y axis
Y axis label (will be included in exported images but not CSV files).
Style
Flow counts can be displayed as either curves, stepped curves, stacked areas,
stepped stacked areas, bars, or stacked bars.
If stepped curves, stepped areas, bars or stacked bars are chosen, a bin size
must be specified. Each stepped portion or bar will then correspond to an interval
of time with the size specified, and the associated value will be the total flow
during that time interval. If sampling period exceeds bin size, zero values will be
present.
If stacked areas, stepped areas or stacked bars are chosen, a 'Normalized' option
is available. If selected, flow counts will be displayed as percentages instead of
absolute values and will always sum to 100.
Curves and stacked areas use a single frame as the interval and are therefore
difficult to read, but may useful when exported to CSV for further analysis.
170
Show
Legend
Display graph legend (will be included in exported images but not CSV files).
Graph must be regenerated to update dataset labels.
Show
Metadata
Display information about the MassMotion version and database file used to
generate the graph (will be included in exported images and CSV files).
Notes
A simple field that can be used to save comments or explanation about the graph.
© 2015 Oasys Software Limited
MassMotion
This will be saved, but will not be exported to CSV.
4.3.3.6.5 Performance
Performance graphs can be used to compare time and operations required to process simulation
steps for each simulation frame.
Performance Table Parameters
Name
The name of the table.
Simulation
runs
The simulation runs to be analysed
Reporting
period
The time period over which counts should be calculated.
Series:
Metric
How performance statistics should be listed.
Duration (ms): Time required.
Operations: Operations required.
1000 * Duration (ms) / Operations: Time per operation.
1000 * Duration (ms) / Population: Time per population.
Series
Performance statistics to display.
Entire Frame: Processing an entire frame.
Serial Components: Processing the serial components of a frame.
Threaded Components: Processing the threaded components of a frame.
Information from individual components can be displayed as well.
Title
Graph title (will be included in exported images and CSV files).
X Axis
X axis label (will be included in exported images and CSV files).
Y Axis
Y axis label (will be included in exported images but not CSV files).
Show
Legend
Display graph legend (will be included in exported images but not CSV files).
Graph must be regenerated to update dataset labels.
Show
Metadata
Display information about the MassMotion version and database file used to
generate the graph (will be included in exported images and CSV files).
Notes
A simple field that can be used to save comments or explanation about the table.
This will be saved, but will not be exported to CSV.
4.3.3.6.6 Population Count
Population count graphs can be created to measure the total number of agents over time in specified
areas.
Groups in a population count graph are composed of one or more areas. Each group can be
© 2015 Oasys Software Limited
171
MassMotion
configured to produce multiple series showing the population counts in each of the selected areas
independently, or one series showing the population count treating all selected areas as a single
combined area.
If a group of areas is created under a filter, only agents satisfied by that filter will be included in the
associated counts. Note the distinction between using a filter such as 'holding token' versus 'are ever
holding token'. In the first case, agents will be included in the population count only while they are
holding the specified token. In the second case, agents will be included in the population count for
the entire reporting period as long as they ever held the specified token at some point during that
period.
Population Count Parameters
Name
The name of the graph.
Simulation
run
The simulation run for which counts should be calculated. To compare population
counts between different runs, a composite graph can be used.
Reporting
period
The time period over which counts should be calculated.
Sampling
period
How frequently to measure the population. Specifying a larger value will reduce
the amount of time needed to generate the graph, but using very large values runs
the risk of missing peaks in population that may occur between samples.
Title
Graph title (will be included in exported images and CSV files).
X Axis
X axis label (will be included in exported images and CSV files).
Y Axis
Y axis label (will be included in exported images but not CSV files).
Style
Population counts can be displayed as either curves, stepped curves, stacked
areas, stepped stacked areas, bars, or stacked bars.
If stepped curves, stepped areas, bars or stacked bars are chosen, a bin size
must be specified. Each bar will then correspond to an interval of time with the
size specified, and the associated value will be the average population within
that time interval. If sampling period exceeds bin size, zero values will be present.
If stacked areas, stepped areas or stacked bars are chosen, a 'Normalized' option
is available. If selected, population counts will be displayed as percentages
instead of absolute values and will always sum to 100.
172
Show
Legend
Display graph legend (will be included in exported images but not CSV files).
Graph must be regenerated to update dataset labels.
Show
Metadata
Display information about the MassMotion version and database file used to
generate the graph (will be included in exported images and CSV files).
Notes
A simple field that can be used to save comments or explanation about the graph.
This will be saved, but will not be exported to CSV.
© 2015 Oasys Software Limited
MassMotion
4.3.3.6.7 Region Density
Region density graphs can be used to show how the average density (total population divided by
total area) varies over time within one or more Region objects. Each region will have a corresponding
series on the graph showing its average density over time, and the graph will have coloured
horizontal background stripes indicating different density ranges.
Region Density Parameters
Name
The name of the graph.
Simulation
run
The simulation run for which densities should be calculated.
Reporting
period
The time period over which densities should be calculated.
Sampling
period
How frequently to measure each region's population and calculate its density.
Specifying a larger value will reduce the amount of time needed to generate the
graph, but using very large values runs the risk of missing peaks in density that
may occur between samples.
Title
Graph title (will be included in exported images and CSV files).
X Axis
X axis label (will be included in exported images and CSV files).
Y Axis
Y axis label (will be included in exported images but not CSV files).
Style
Densities can be displayed as either curves, stepped curves, or bars. If stepped
curves or bars are chosen, a bin size must be specified. Each bar will then
correspond to an interval of time with the size specified, and the associated value
will be the average density within that time interval. If sampling period exceeds
bin size, zero values will be present.
Show
Legend
Display graph legend (will be included in exported images but not CSV files).
Graph must be regenerated to update dataset labels.
Show
Metadata
Display information about the MassMotion version and database file used to
generate the graph (will be included in exported images and CSV files).
Regions
Which regions to include in the graph. Each region will correspond to one graph
series.
Density
Ranges
Which colours and density ranges to use for the coloured background stripes of
the graph. Any of the standard LOS Colour Mapping types can be used, or
custom ranges and colours can be specified.
Notes
A simple field that can be used to save comments or explanation about the graph.
This will be saved, but will not be exported to CSV.
4.3.3.6.8 Server Population Count
Server population count graphs can be created to measure the total number of agents at specified
servers over time. See Server for a description of when an agent is considered to be at a server. To
obtain detailed information about entire process chains instead of single servers, an Agent Process
Chain Time table can be used instead.
© 2015 Oasys Software Limited
173
MassMotion
Groups in a server population count graph are composed of one or more servers. Each group can be
configured to produce multiple series showing the population counts for each of the selected servers
independently, or one series showing the total population count for all selected servers.
If a group of servers is created under a filter, only agents satisfied by that filter will be included in the
associated counts. Note the distinction between using a filter such as 'holding token' versus 'are ever
holding token'. In the first case, agents will be included in the server population count only while they
are holding the specified token. In the second case, agents will be included in the count for the
entire reporting period as long as they ever held the specified token at some point during that period.
Server Population Count Parameters
Name
The name of the graph.
Simulation
run
The simulation run for which counts should be calculated. To compare server
population counts between different runs, a Composite Graph can be used.
Alternatively, a Server Summary table can be used to compare aggregate
information about different servers in different simulation runs directly.
Reporting
period
The time period over which counts should be calculated.
Sampling
period
How frequently to measure the server population. Specifying a larger value will
reduce the amount of time needed to generate the graph, but using very large
values runs the risk of missing peaks in population that may occur between
samples.
Title
Graph title (will be included in exported images and CSV files).
X Axis
X axis label (will be included in exported images and CSV files).
Y Axis
Y axis label (will be included in exported images but not CSV files).
Style
Server population counts can be displayed as either individual curves, stacked
areas, bars, or stacked bars.
If either bars or stacked bars are chosen, a bin size must be specified. Each bar
will then correspond to an interval of time with the size specified, and the
associated value will be the average count within that time interval. If sampling
period exceeds bin size, zero values will be present. If sampling period exceeds
bin size, zero values will be present.
If stacked areas, stepped areas or stacked bars are chosen, a 'Normalized' option
is available. If selected, population counts will be displayed as percentages
instead of absolute values and will always sum to 100.
174
Show
Legend
Display graph legend (will be included in exported images but not CSV files).
Graph must be regenerated to update dataset labels.
Show
Metadata
Display information about the MassMotion version and database file used to
generate the graph (will be included in exported images and CSV files).
Notes
A simple field that can be used to save comments or explanation about the graph.
This will be saved, but will not be exported to CSV.
© 2015 Oasys Software Limited
MassMotion
4.3.3.7
Maps
Map queries paint objects in the scene based on the behaviour of agents.
All maps have a "Surface Objects" parameter which determines which objects will be painted. Most
maps can only paint walkable surfaces, with the exception of vision time maps, which can paint
barriers as well.
Several maps can customize how they display values on their surfaces. Using transparent values will
allow an object's colour to be displayed instead of other colours. See Working with Colours for more
information.
Only one map can be displayed at any time, evaluating or showing a map will hide any other map
that is shown. Maps can be hidden from the view menu or by right clicking map objects in the list
view.
Maps cannot be directly exported, but the movie and image exporter can be used instead.
List of Maps
Map Type
Description
Agent Count
Counts the number of unique agents that cross each point.
Agent Path
Traces the route taken by each agent.
Agent Time
to Exit
The time required for an agent to exit from each point.
Average
Density
The average density at each point.
Average
Non-Zero
Density
The average non-zero density at each point.
Dynamic
Path
Shows dynamic 'trails' behind each agent as they move around the model.
Experience
d Density
The experienced density at each point.
Instantaneo
us Density
The current density at each point. This map is "live" and updates with simulation
playback.
Maximum
Density
The maximum density at each point.
Static Cost
The cost perceived by agents to reach various destination portals. This map does
not require a simulation run.
Static
Distance
The measured distance to various destination portals. This map does not require
a simulation run.
Time Above
Density
The time agents spend above a specified density at each point.
© 2015 Oasys Software Limited
175
MassMotion
Time
Occupied
The time for which each point is occupied by an agent.
Time Until
Clear
The time before the last agent leaves each point.
Vision Time
The time agents spend looking at a surface. This map can paint barriers.
4.3.3.7.1 Agent Count
Agent count maps can be used to display how many different agents use different parts of a
walkable object. The colour at each point will indicate the number of unique agents that ever stood at
that point during the given time range.
Agent Count Map Parameters
Name
The name of the map.
Simulation
run
The simulation run for which the map should be generated.
Time range
The time period over which map values should be computed.
Agent Filter
Used to select a subset of agents to consider when generating the map.
Colouring
The colours that will be used in the map. Ranges are given as agent counts. See
Working with Colours for more information.
Surface
Objects
Which objects to apply the map to.
Notes
A simple field that can be used to save comments or explanation about the map.
4.3.3.7.2 Agent Path
Agent path maps can be used to show where agents tend to walk. As agents move around the
model, they will lay down a semi-transparent trail with the same colour as the agent itself. These
paths will be laid down on top of each other, so later agents will tend to obscure earlier ones.
Agent path maps are very useful when constructing filters, as they can provide immediate visual
feedback on whether the filter is performing as expected.
Agent Path Map Parameters
176
Name
The name of the map.
Simulation
run
The simulation run for which the map should be generated. This also controls the
colour of the paths; the agent colouring options set on the simulation run are used
when generating the paths.
Time range
The time period over which paths should be generated.
Agent Filter
Used to select a subset of agents to consider when generating the map.
© 2015 Oasys Software Limited
MassMotion
Opacity
The opacity of the path laid down by each agent, in percent.
Surface
Objects
Which objects to apply the map to.
Notes
A simple field that can be used to save comments or explanation about the map.
4.3.3.7.3 Agent Time To Exit
Agent time to exit maps can be used to measure how long it takes agents to exit the simulation
from any point in their journey through the simulation. The colour at each point will indicate the
longest time it took any agent to exit the simulation after standing at that point. For instance, in an
evacuation scenario, points far away from the exits would have a large value since agents standing
at those points would take a long time to be able to exit the simulation. Points near the exits would
have small values since agents at those points would exit the simulation shortly after the evacuation
begins.
Agent Time To Exit Map Parameters
Name
The name of the map.
Simulation
run
The simulation run for which the map should be generated.
Time range
The time period over which map values should be computed.
Agent Filter
Used to select a subset of agents to consider when generating the map.
Colouring
The colours that will be used in the map. Ranges are given as times in seconds.
See Working with Colours for more information.
Surface
Objects
Which objects to apply the map to.
Notes
A simple field that can be used to save comments or explanation about the map.
4.3.3.7.4 Average Density
Average density maps can be used to display what parts of an object were, on average, most
crowded. The colour at each point will indicate the average density (agents per square metre) over
the given time range in a circle about that point. The circles used to calculate density have a
standard Fruin area of 3.25 square metres.
The average density is defined as:
Average Density Map Parameters
Name
© 2015 Oasys Software Limited
The name of the map.
177
MassMotion
Simulation
run
The simulation run for which the map should be generated.
Time range
The time period over which map values should be computed.
Sampling
period
How frequently to sample agent positions when generating the map. Specifying a
larger value will reduce the amount of time needed to generate the map, but
decrease accuracy.
Colouring
The colours that will be used in the map. Any of the standard Fruin metrics plus
the IATA (International Air Transport Association) Wait/Circulate standard can be
used. If 'Fruin (auto)' is used, Fruin walkway values will be used for floor and links,
and Fruin stairway values will be used for stairs and escalators. Finally, custom
density ranges and corresponding colours can also be defined.
See Working with Colours and LOS Colour Mapping for more information.
Surface
Objects
Which objects to apply the map to.
Notes
A simple field that can be used to save comments or explanation about the map.
4.3.3.7.5 Average Non-Zero Density
Average non-zero density maps are the same as Average Density maps except that zero density
values are not included in the average. Therefore, long stretches of time with no agents will not affect
the computed values.
Average Non-Zero Density Map Parameters
178
Name
The name of the map.
Simulation
run
The simulation run for which the map should be generated.
Time range
The time period over which map values should be computed.
Sampling
period
How frequently to sample agent positions when generating the map. Specifying a
larger value will reduce the amount of time needed to generate the map, but
decrease accuracy.
Colouring
The colours that will be used in the map. Any of the standard Fruin metrics plus
the IATA (International Air Transport Association) Wait/Circulate standard can be
used. If 'Fruin (auto)' is used, Fruin walkway values will be used for floor and links,
and Fruin stairway values will be used for stairs and escalators. Finally, custom
density ranges and corresponding colours can also be defined.
See Working with Colours and LOS Colour Mapping for more information.
Surface
Objects
Which objects to apply the map to.
Notes
A simple field that can be used to save comments or explanation about the map.
© 2015 Oasys Software Limited
MassMotion
4.3.3.7.6 Dynamic Path
Dynamic path maps are similar to agent path maps, but the trails left behind agents fade out over a
set period of time. The net effect is that each agent can have (for instance) a trail showing where it
has been in the last 10 seconds, which can be useful for visualization purposes.
A couple of techniques that can be used with dynamic path maps include:
Setting the decay time to zero and opacity to a small value (10-20%): this will have the effect of
adding a small circular 'shadow' under each agent.
Setting up a dynamic path map and then hiding the corresponding simulation run: in this way only
the paths themselves will be shown, which can be useful in visualizing overall flow patterns.
Dynamic path maps can be used when exporting movies, but can only be effectively previewed by
using the 'play' option of the Time Panel.Manually dragging the playback slider will erase and reset
all paths.
Dynamic Path Map Parameters
Name
The name of the map.
Simulation
run
The simulation run for which the map should be generated. This also controls the
colour of the paths; the agent colouring options set on the simulation run are used
when generating the paths.
Agent Filter
Used to select a subset of agents to consider when generating the map.
Initial
Opacity
The opacity of the path as initially laid down by an agent, in percent (i.e., the
opacity of the path directly under the agent's feet).
Decay Time
Approximately how long each path will be, in seconds. For instance, setting this
to 10 seconds will mean that the trail behind each agent will show approximately
the last 10 seconds of movement before fading into invisibility. Experimentation
may be needed to find a combination of initial opacity and decay time that
produces the desired visual effect.
Surface
Objects
Which objects to apply the map to.
Notes
A simple field that can be used to save comments or explanation about the map.
4.3.3.7.7 Experienced Density
Experienced density maps are a measure of the average density experienced by the agents (the
average of all experiences), computed as a weighted average. The measure is calculated as:
While the regular time based Average Density tends to smooth out dense but intermittent bursts in
traffic, the experienced average highlights those bursts regardless of their frequency.
Experienced Density Map Parameters
© 2015 Oasys Software Limited
179
MassMotion
Name
The name of the map.
Simulation
run
The simulation run for which the map should be generated.
Time range
The time period over which map values should be computed.
Sampling
period
How frequently to sample agent positions when generating the map. Specifying a
larger value will reduce the amount of time needed to generate the map, but
decrease accuracy.
Colouring
The colours that will be used in the map. Any of the standard Fruin metrics plus
the IATA (International Air Transport Association) Wait/Circulate standard can be
used. If 'Fruin (auto)' is used, Fruin walkway values will be used for floor and links,
and Fruin stairway values will be used for stairs and escalators. Finally, custom
density ranges and corresponding colours can also be defined.
See Working with Colours and LOS Colour Mapping for more information.
Surface
Objects
Which objects to apply the map to.
Notes
A simple field that can be used to save comments or explanation about the map.
4.3.3.7.8 Instantaneous Density
Instantaneous density maps can be used to produce a live, animated display of what parts of one or
more objects are most crowded. The colour at each point indicates the current density (agents per
square metre) in a circle about that point. The circles used to calculate density have a standard
Fruin area of 3.25 square metres.
Average Density Map Parameters
180
Name
The name of the map.
Simulation
run
The simulation run for which the map should be generated.
Colouring
The colours that will be used in the map. Any of the standard Fruin metrics plus
the IATA (International Air Transport Association) Wait/Circulate standard can be
used. If 'Fruin (auto)' is used, Fruin walkway values will be used for floor and links,
and Fruin stairway values will be used for stairs and escalators. Finally, custom
density ranges and corresponding colours can also be defined.
See Working with Colours and LOS Colour Mapping for more information.
Surface
Objects
Which objects to apply the map to.
Notes
A simple field that can be used to save comments or explanation about the map.
© 2015 Oasys Software Limited
MassMotion
4.3.3.7.9 Maximum Density
Maximum density maps are similar to average density maps, but show the maximum density ever
reached at each point during the given time range.
Maximum Density Map Parameters
Name
The name of the map.
Simulation
run
The simulation run for which the map should be generated.
Time range
The time period over which map values should be computed.
Sampling
period
How frequently to sample agent positions when generating the map. Specifying a
larger value will reduce the amount of time needed to generate the map, but
decrease accuracy (specifically, density peaks will be missed if they fall in
between sample times).
Colouring
The colours that will be used in the map. Any of the standard Fruin metrics plus
the IATA (International Air Transport Association) Wait/Circulate standard can be
used. If 'Fruin (auto)' is used, Fruin walkway values will be used for floor and links,
and Fruin stairway values will be used for stairs and escalators. Finally, custom
density ranges and corresponding colours can also be defined.
See Working with Colours and LOS Colour Mapping for more information.
Surface
Objects
Which objects to apply the map to.
Notes
A simple field that can be used to save comments or explanation about the map.
4.3.3.7.10 Static Cost
Static Cost Maps show how agents perceive the network and the cost in seconds to arrive at given
portals from each point. This map does not take crowds into account and can be evaluated before a
simulation is run. Evaluating this map rebuilds the scene network which can be time
consuming and the evaluate command cannot be canceled.
Vertical costs of vertical elements such as stairs or escalators and other cost penalties are applied
as a single step before the next object which may lead to visual discontinuities. Within an object,
only horizontal costs are considered. Costs are calculated using a nominal agent speed of 1 m/s.
Distance penalties and link directionality will have an impact on the final result.
Static Cost Map Parameters
Name
The name of the map.
Colouring
The colours that will be used in the map. Ranges are given as times in seconds.
See Working with Colours for more information.
Surface
Objects
Which objects to apply the map to.
Portals
The map will show the cost used by agents to arrive at any of the given portals.
With multiple portals, the lowest cost will be displayed for each point.
© 2015 Oasys Software Limited
181
MassMotion
Network
Objects
The objects included in the network calculations. The map includes the entire
model by default, reflecting what occurs in simulation. A subset of the model can
be used to speed up processing time or to focus the analysis.
Notes
A simple field that can be used to save comments or explanation about the map.
4.3.3.7.11 Static Distance
Static Distance Maps show the distance from given portals to each point. This map does not take
crowds into account and can be evaluated before a simulation is run. Evaluating this map rebuilds
the scene network which can be time consuming and the evaluate command cannot be
canceled.
Distances along vertical elements such as stairs or escalators are taken as the Cartesian distance
along their lengths. For other objects, only horizontal distance are considered. For example, any
height variation on a floor is ignored. Distance penalties and link directionality will have no impact on
the final result.
Static Distance Map Parameters
Name
The name of the map.
Colouring
The colours that will be used in the map. Ranges are given as distances in
metres. See Working with Colours for more information.
Surface
Objects
Which objects to apply the map to.
Portals
The map will show the distance from any of the given portals. With multiple
portals, the shortest will be displayed for each point.
Network
Objects
The objects included in the network calculations. The map includes the entire
model by default, reflecting what occurs in simulation. A subset of the model can
be used to speed up processing time or to focus the analysis.
Notes
A simple field that can be used to save comments or explanation about the map.
4.3.3.7.12 Time Above Density
Time above density maps can be used to find parts of walkable objects where the agent density
exceeded a given threshold, and determine for how long this occurred. Map colours will indicate the
amount of time each point on each selected object had a local density greater than a given
threshold.
Time Above Density Map Parameters
182
Name
The name of the map.
Simulation
run
The simulation run for which the map should be generated.
Time range
The time period over which map values should be computed.
Minimum
The density value cutoff to use. Standard Fruin walkway values can be selected,
© 2015 Oasys Software Limited
MassMotion
Density
or a custom density value can be specified.
Colouring
The colours that will be used in the map. Ranges are given as times in seconds.
See Working with Colours for more information.
Surface
Objects
Which objects to apply the map to.
Notes
A simple field that can be used to save comments or explanation about the map.
4.3.3.7.13 Time Occupied
Time occupied maps can be used to measure how long a given location was occupied by agents
during the simulation. The colour at each point will indicate the cumulative count (in seconds) that
any agent stood at that point. For instance, in train station scenario, a time occupied map might be
used to determine how much time people spent waiting near the departures board in the main
concourse.
Time Until Clear Map Parameters
Name
The name of the map.
Simulation
run
The simulation run for which the map should be generated.
Time range
The time period over which map values should be computed. Time values will be
computed from the start of the time range.
Agent Filter
Used to select a subset of agents to consider when generating the map.
Colouring
The colours that will be used in the map. Ranges are given as times in seconds.
See Working with Colours for more information.
Surface
Objects
Which objects to apply the map to.
Notes
A simple field that can be used to save comments or explanation about the map.
4.3.3.7.14 Time Until Clear
Time until clear maps can be used to measure how long it took until no agents were left at various
points. The colour at each point will indicate the last time, relative to the beginning of the given time
range, that any agent stood at that point. For instance, in an evacuation scenario, points far away
from the exits would have small values since those areas would be left quickly. Points near the exits
would have large values since those points would continue to be visited by agents as they exited.
Time Until Clear Map Parameters
Name
The name of the map.
Simulation
run
The simulation run for which the map should be generated.
Time range
The time period over which map values should be computed. Time values will be
© 2015 Oasys Software Limited
183
MassMotion
computed from the start of the time range.
Agent Filter
Used to select a subset of agents to consider when generating the map.
Colouring
The colours that will be used in the map. Ranges are given as times in seconds.
See Working with Colours for more information.
Surface
Objects
Which objects to apply the map to.
Notes
A simple field that can be used to save comments or explanation about the map.
4.3.3.7.15 Vision Time
Vision time maps are an experimental feature which calculates where agents are looking as they
move through a simulation. Unlike other maps, vision time maps can also be applied to barriers.
Vision time maps display the amount of time a given point on an object is viewed. The time is
multiplied by the number of agents, thus two agents looking at a wall for 1 second and one agent
looking at a wall for 2 seconds will both yield a time value of 2 seconds.
The scene is divided into volumetric elements or "voxels". All agents will project a viewing cone
ahead of them marking voxels they see. This cone is currently fixed at a 15 degree half angle, 20
metre length and 1.75m above the floor.
Agents will mark any voxels containing scene objects, including hidden objects and reference
geometry and are unable to see through them. They will, however, see through any other agents in
front of them and analysis cordons and regions.
The voxel based approach can cause certain visual artefacts may occur as voxels obscure each
other.
184
© 2015 Oasys Software Limited
MassMotion
Figure 1: Voxels in corners have no set values because they are blocked by
adjacent voxels.
This map is very resource intensive, consuming both CPU time and memory. Changing the sampling
period is an effective way of speeding up the map computation; the amount of memory consumed
can only be reduced by choosing a smaller set of objects.
Average Density Map Parameters
Name
The name of the map.
Simulation
run
The simulation run for which the map should be generated.
Time range
The time period over which map values should be computed.
Sampling
period
How frequently to sample agent positions when generating the map. Specifying a
larger value will reduce the amount of time needed to generate the map, but
decrease accuracy.
Colouring
The colours that will be used in the map. The default values may need to be
changed as value ranges change dramatically based on the population counts and
characteristics.
See Working with Colours for more information.
Surface
Objects
Which objects to apply the map to. Unlike most maps, vision maps can also
include barriers as surface objects.
The amount of memory used during vision map computation depends on the size
of a rectangular box that fits around all selected objects. Therefore, selecting a
very large object or even two small objects that are far apart will require a large
amount of memory.
Notes
© 2015 Oasys Software Limited
A simple field that can be used to save comments or explanation about the map.
185
MassMotion
4.3.3.8
Tables
Table queries all produce tabular data in different forms. Once evaluated, tables can be exported to a
CSV file. Additionally, right-clicking on any table column allows the generation of a histogram of the
values in that column, which can itself be exported to CSV.
List of Tables
Table Type
Description
Agent Area
Time
Lists the amount of time agents spend in given areas.
Agent LOS
Time
Lists the amount of time agents spend at each level of service.
Agent
Process
Chain Time
Lists the amount of time agents spend in a process chain.
Agent
Summary
Provides general information about each agent.
Agent
Timetable
Summary
Provides general information about agents produced by a given timetable.
Agent
Token Time
Lists the amount of time agents carry given tokens.
Agent Trip
Time
Lists the time required for agents to complete a given trip.
Origin/
Destination
Counts the number of agents entering and exiting at each portal.
Performanc
e Table
Provides diagnostics for simulation runs.
Server
Summary
Lists queue times and other information for servers.
4.3.3.8.1 Agent Area Time
Agent area time tables can be used to determine how long different agents spend in different areas.
Agent Region Time Parameters
186
Name
The name of the table.
Simulation
run
The simulation run for which region times should be calculated.
Time range
The time period over which times should be calculated.
© 2015 Oasys Software Limited
MassMotion
Agent Filter
Used to select when agents should be included in the area times; see the column
descriptions below for details.
Areas
Which areas should be included in the table.
Notes
A simple field that can be used to save comments or explanation about the table.
This will be saved, but will not be exported to CSV.
Each row of the table has information on one agent. Agents will only be included in the table if they
satisfy the given filter during the given time range, and are ever in any of the given areas during that
time range.
Agent Region Time Columns
Agent ID
Internal agent ID.
Names
(variable)
One column per selected areas, showing how long the agent spent in that area
while simultaneously satisfying the given filter. For instance, using an 'in trip' filter
will result in each row showing the amount of time one agent spent in various
areas while undergoing a particular trip.
4.3.3.8.2 Agent LOS Time
Agent LOS time tables can be used to determine how long different agents spend at different levels
of service.
Agent LOS Time Parameters
Name
The name of the table.
Simulation
run
The simulation run for which LOS times should be calculated.
Time range
The time period over which times should be calculated.
Agent Filter
Used to select when agents should be included in the LOS times; see the column
descriptions below for details.
Notes
A simple field that can be used to save comments or explanation about the table.
This will be saved, but will not be exported to CSV.
Each row of the table has information on one agent. Agents will only be included in the table if they
ever satisfy the given filter during the given time range.
Agent LOS Time Columns
Agent ID
Internal agent ID.
Total
Duration
Total amount of time that the agent satisfied the given filter. Note that this number
may be less than expected if the agent entered or exited the simulation during the
specified time range.
LOS [A,B,C,
Total amount of time that the agent spent at each level of service while
© 2015 Oasys Software Limited
187
MassMotion
D,E,F]
Duration
simultaneously satisfying the given filter. For instance, using an 'in area' filter with
a particular floor, each row will show how long one agent spent at each level of
service while on that floor. The level of service is calculated based on standard
Fruin values, with the LOS type determined by what sort of walkable object the
agent is standing on. Floors and links use Fruin walkway LOS values, and stairs
and escalators use Fruin stairway LOS values.
4.3.3.8.3 Agent Process Chain Time
Agent process chain time tables can be used to produce agent summary information about a given
process.
Agent Process Chain Time Parameters
Name
The name of the table.
Simulation
run
The simulation run for which process chain times should be calculated.
Finished
end server
at
A special type of time range: only agents that left the final server in the process
during the given time range will be included in the table. Agents that started the
process before the start of the interval but finished during the interval will be
included. Conversely, agents that started the process during the given time range
but did not finish until afterwards will not be included.
Agent Filter
Can be used to further restrict which agents are included in the table.
Servers
Specifies lists of start and end servers defining the process. An agent is defined
as starting the process chain when it starts the pre-contact wait stage at any of
the first servers (see Server for details on different server stages), and is defined
as finishing the process chain when it exits any of the end servers. It is possible
to specify the same server(s) as both start and end.
Notes
A simple field that can be used to save comments or explanation about the table.
This will be saved, but will not be exported to CSV.
Each row of the table has information on one agent's processing time. Agents will only be included
in the table if they satisfy the given filter during the given time range.
Agent Process Chain Time Columns
188
Agent ID
Internal agent ID.
Start Server
Which of the specified start servers the agent started the process chain at.
End Server
Which of the specified end servers the agent ended the process chain at.
Start Time
What time the agent started the process chain. This is the first time when they
are either being processed by one of the start servers or are queueing for the
server (blocked by another agent that is at the server).
End Time
What time the agent ended the process chain. This corresponds to the time at
which the agent was finished being processed by one of the end servers.
© 2015 Oasys Software Limited
MassMotion
Total
Duration
How long the agent took to finish the process chain (end time minus start time).
In Transit
Total amount of time the agent spent moving between servers. This includes both
the time spent moving to a server line and any time spent unobstructed along the
line.
Pre-Contact
Wait
Total amount of time the agent spent waiting in any server input buffers before
being processed..
Contact
Wait
Total amount of time the agent spent in contact with and being processed by
servers.
PostContact
Wait
Total amount of time the agent spent waiting in server output buffers for a space to
become available at a downstream server.
4.3.3.8.4 Agent Summary
Agent summary tables can be used to display a variety of overall summary information for a set of
agents. When combined with the agent filters the table becomes a powerful way to validate
components of a simulation.
For example:
Right-click on the Entrance column header to display a histogram of the number of agents
entering through each portal.
Right-click on the Desired Speed column header to display the number of agents in various speed
ranges.
Right-click on an agent Start Time value to focus the 3D view and timeline on the agent at the time
in entered the simulation.
Agent Summary Parameters
Name
The name of the table.
Simulation
run
The simulation run for which agent summaries should be calculated.
Agents
alive at
A special type of time range: only agents that were alive at any point during the
given interval will be included in the table. Values in the table (duration, distance
traveled etc.) will still refer to the entire lifetime of each agent.
Agent Filter
Can be used to further restrict which agents are included in the table.
Notes
A simple field that can be used to save comments or explanation about the table.
This will be saved, but will not be exported to CSV.
Each row of the table has information on one agent. Agents will only be included in the table if they
satisfy the given filter during the given time range.
Agent Summary Columns
Agent ID
© 2015 Oasys Software Limited
Internal agent ID.
189
MassMotion
Entrance
What portal the agent entered the simulation at.
Exit
What portal the agent exited the simulation at. If the field is blank, the agent was
still in the scene when the simulation ended.
Start Time
What time the agent entered the simulation.
End Time
What time the agent exited the simulation. Agents still in the scene when the
simulation ended will list the simulation end time.
Duration
Total amount of time the agent spent in the simulation (end time minus start
time).
Distance
Traveled
(m)
Total distance traveled by the agent. This includes any stuttering back and forth
when congested.
Desired
Speed (m/s)
Innate desired speed of the agent as designated by the agent's profile.
End State
The end state of the agent after leaving the simulation or the simulation ends.
in simulation: still in scene at simulation end
exited with success: exited simulation as expected
exited with error: was deleted from simulation with an error.
4.3.3.8.5 Agent Timetable Summary
Agent timetable summary tables can be used to display information for a set of agents associated
with a set of reference events from a particular Timetable object. Reference events are not visible to
any object outside of the Timetable object in which they are defined. The timetable summary table
allows for queries that target agents generated by a Timetable schedule that were based on one or
more reference events. For example, if the timetable is describing the operations of an airport and
reference events correspond to flights, the table can be made to display information about all those
agents who were either arriving or departing on a particular flight.
Agent Timetable Summary Parameters
190
Name
The name of the table.
Simulation
run
The simulation run for which agent summaries should be calculated.
Agents
alive at
A special type of time range: only agents that were alive at any point during the
given interval will be included in the table. Values in the table (duration, distance
traveled etc.) will still refer to the entire lifetime of each agent.
Agent Filter
Can be used to further restrict which agents are included in the table.
Timetable
The timetable object the table should refer to. Only agents created by this
timetable will be included in the table.
Reference
events
Optionally provide a list of timetable reference events. If used, only agents that
were produced by or sent to any of the given reference events will be included in
the table.
© 2015 Oasys Software Limited
MassMotion
Notes
A simple field that can be used to save comments or explanation about the table.
This will be saved, but will not be exported to CSV.
Each row of the table has information on one agent. Agents will only be included in the table if they
satisfy the given filter during the given time range.
Agent Timetable Summary Columns
Agent ID
Internal agent ID.
From
Reference
Event
Reference event from which the agent was created (blank if the schedule did not
specify a 'From' reference event).
To
Reference
Event
Reference event the agent was sent to (blank if the schedule did not specify a 'To'
reference event).
Entrance
What portal the agent entered the simulation at.
Exit
What portal the agent exited the simulation at. If the field is blank, the agent was
still in the scene when the simulation ended.
Start Time
What time the agent entered the simulation.
End Time
What time the agent exited the simulation. Agents still in the scene when the
simulation ended will list the simulation end time.
Duration
Total amount of time the agent spent in the simulation (end time minus start
time).
Distance
Traveled
(m)
Total distance traveled by the agent.
Desired
Speed (m/s)
Innate desired speed of the agent as designated by the agent's profile.
4.3.3.8.6 Agent Token Time
Agent token time tables can be used to determine how long different agents spend holding different
tokens.
Agent Token Time Parameters
Name
The name of the table.
Simulation
run
The simulation run for which token times should be calculated.
Time range
The time period over which token times should be calculated.
Agent Filter
Used to select when agents should be included in the token times; see the
© 2015 Oasys Software Limited
191
MassMotion
column descriptions below for details.
Tokens
Which tokens should be included in the table.
Notes
A simple field that can be used to save comments or explanation about the table.
This will be saved, but will not be exported to CSV.
Each row of the table has information on one agent. Agents will only be included in the table if they
satisfy the given filter during the given time range, and ever possess any of the given tokens during
that time range.
Agent Token Time Columns
Agent ID
Internal agent ID.
Names
(variable)
One column per selected token, showing how long the agent spent holding that
token while simultaneously satisfying the given filter. For instance, using an 'in
trip' filter will result in each row showing the amount of time one agent spent
holding various tokens while undergoing a particular trip.
4.3.3.8.7 Agent Trip Time
Agent trip time tables can be used to determine how long agents spent to complete a certain trip.
Agent Trip Time Parameters
Name
The name of the table.
Simulation
run
The simulation run for which trip times should be calculated.
Time range
The time period over which times should be calculated.
Agent Filter
Used to select a subset of agents to include in the table.
Trip
The trip the table will refer to.
Notes
A simple field that can be used to save comments or explanation about the table.
This will be saved, but will not be exported to CSV.
Each row of the table has information on one agent's trip. Agents will only be included in the table if
they satisfy the given filter during the given time range, and fully complete the trip within the specified
time range. See Trips for the different ways in which a trip can be defined in terms of start and end
criteria.
Agent Trip Time Columns
192
Agent ID
Internal agent ID.
Start Time
When the agent started the trip.
© 2015 Oasys Software Limited
MassMotion
End Time
When the agent finished the trip.
Duration
Total time the agent spent in the trip (end time minus start time).
4.3.3.8.8 Origin/Destination
Origin/destination tables (matrices) can be used to check how many agents entered and exited the
simulation at different portals during a particular time period.
Origin/Destination Parameters
Name
The name of the table.
Simulation
run
The simulation run for which counts should be calculated.
Time range
The time period over which counts should be calculated.
Agent Filter
Used to select a subset of agents to include in the table.
Notes
A simple field that can be used to save comments or explanation about the table.
This will be saved, but will not be exported to CSV.
The resulting table will contain one row for every entrance portal in the model, and one column for
every exit portal. Each cell in the table corresponds to an entrance portal/exit portal pair. The value
of the cell is the count of agents who, during the given time range, entered the simulation at the
corresponding entrance portal and exited at the corresponding exit portal.
An additional row is included for agents that are "Present at Start" of the time range. Two additional
columns are added for agents "Present at End" of the time range and for agents "Removed in
Transit" via actions or an error. Thus, agents that do not completely enter and exit the simulation
during a time range can also be accounted for.
Agents will only be included in the counts if they satisfied the given filter during the given time range.
4.3.3.8.9 Performance Table
Performance tables can be used to compare performance statistics about different simulation runs.
This includes both population data and timing information from when the simulation was run.
Performance Table Parameters
Name
The name of the table.
Simulation
run
The simulation runs to be analysed
Aggregatio
n
How timing information for each frame should be combined.
Total Duration (s): Display the total time the simulation spent on each simulation
component over the entire time range.
Average Frame Duration (s): Display the average time the simulation spent on
© 2015 Oasys Software Limited
193
MassMotion
each simulation component for each frame.
Maximum Frame Durations (s): Display the maximum time the simulation
spent on each simulation component for each frame.
Time range
The time period over which simulation statistics should be calculated.
Notes
A simple field that can be used to save comments or explanation about the table.
This will be saved, but will not be exported to CSV.
Each row of the table has information on one simulation run.
Agent Token Time Columns
Simulation
Run
Name of the simulation run.
Population
Data
Information about each simulation run's population over the specified time range.
Avg Population: The average population over the time range.
Avg Density: The average population density over the time range.
Max Population: The maximum population over the time range.
Max Density: The maximum density over the time range.
Timing
Information
Timing information from when the simulation was run. Aggregates of each
simulation component's run time are displayed here.
Entire Frame: The total time taken to process a frame. If the aggregation type is
"Total Duration", this column will list the total time the simulation took to run. If
the aggregation type is "Average Frame Duration", this column will list the average
time to simulate one frame. If the aggregation type is "Maximum Frame Duration",
this will list the longest time to simulate one frame.
Additional Debug Information:
Serial Components: The total time taken to process the serial components.
Threaded Components: The total time taken to process the threaded
components.
Update Factories
Create/Delete Agents
Agent Spatial Hash
Cache Agent State
Find Agent Neighbours
Update Events
Frame Begin
Execute Tasks
Update Queues
Update Controllers
Update Process Chains
Move Agents
Correct Agent Overlap
Correct Agent Height
Write Database
Process Agents
Assess Task Progress
Frame End
194
© 2015 Oasys Software Limited
MassMotion
4.3.3.8.10 Server Summary
Server summary tables can be used to measure the average, maximum or minimum values of
various server performance metrics over several simulation runs (e.g., several runs with different
random seeds used to check for random variation).
Server Summary Parameters
Name
The name of the table.
Simulation
run
The simulation runs over which server summaries will be calculated.
Aggregatio
n
How values should be aggregated across multiple simulation runs (average,
maximum or minimum).
Time range
The time period over which values should be calculated.
Agent Filter
Used to select a subset of agents to include in the table.
Servers
Which servers the table will refer to.
Notes
A simple field that can be used to save comments or explanation about the table.
This will be saved, but will not be exported to CSV.
Each row of the table has information on one server, aggregated across the given runs using the
given aggregation type. Only agents that satisfy the given filter will contribute to the computed
values.
Server Summary Columns
Server
Name
Server name.
Total
Agents
Processed
Total number of agents successfully processed by the server.
Mean
Population
Average number of agents at the server.
Mean PreContact
Wait
Average amount of time agents waited in the input buffer before being processed
by the server.
Mean
Contact
Wait
Average amount of time agents spent in contact being processed by the server.
Mean PostContact
Wait
Average amount of time agents waited in the output buffer after being processed
(until a space became available at a downstream server).
Mean Total
Duration
Average total amount of time agents spent waiting at the server (pre-contact +
contact + post-contact).
© 2015 Oasys Software Limited
195
MassMotion
Max
Population
Maximum number of agents ever at the server at one time.
Max PreContact
Wait
Maximum amount of time any agent waited in the input buffer before being
processed by the server.
Max
Contact
Wait
Maximum amount of time any agent spent in contact being processed by the
server.
Max PostContact
Wait
Maximum amount of time any agent waited in the output buffer after being
processed (until a space became available at a downstream server).
Max Total
Duration
Maximum total amount of time any agent spent waiting at the server (precontact + contact + post-contact).
Note that 'Mean' or 'Max' in each column name refers to a mean or max that is performed within
each run; these values are then aggregated across runs using the given aggregation type. For
example:
If aggregation type is set to 'Average over simulations', then the 'Max Queue Size' column has the
following interpretation: For a particular server, calculate the maximum queue size at the server
within each run, then take the average of those values to report in the table.
If the aggregation type is set to 'Maximum over simulations', then the 'Mean Queue Size' column
has the following interpretation: For a particular server, calculate the mean queue size at the
server within each run, then take the maximum of those values to report in the table.
4.4
Simulation
4.4.1
Running a Simulation
A new simulation can be started from the 'Run Simulation' button in the simulation & analysis ribbon
of the main window. The launch dialog provides the ability to specify the type of run and the
simulation run object in which to store the results.
Type
196
Standard
console
This will run a Console Simulation, which is the fastest option but does not include a
graphical window for viewing the simulation as it runs.
Debug
viewer
This will run a Debug Simulation, which will run more slowly than a console
simulation but has a scene view that allows interactive viewing and debugging of the
simulation as it runs. Additionally, a breakpoint can be set to pause the simulation
at the specified time. The breakpoint is useful when debugging problems that occur
late in the simulation at known times.
Multiple
runs
This will run several iterations of the same simulation with different random seeds
(see below for details). The results for each iteration will be placed in a different
simulation run object.
© 2015 Oasys Software Limited
MassMotion
Simulation Run
Create
new
Console/Debug: Create a new simulation run object with the given name. The
results from the simulation will be placed in the specified database file and
referenced by the new simulation run.
Multiple Runs: Create the specified number of simulation run objects. The objects
will be given unique names by appending numbers to the specified name stem.
Numbers are chosen so as not to collide with existing names in the project.
Database files will be named after the corresponding run and placed in the specified
path.
Overwrite
existing
Console/Debug: Use an existing simulation run object; the database file referenced
by the run will be overwritten.
Multiple Runs: Create or overwrite the specified number of simulation run objects.
If new simulation run objects are created, database files are named after the run and
placed in the specified path. If simulation run objects with the requested names
already exist they are used and their existing database files overwritten.
Random Seeds
In all cases, it is possible to either set the random seed used to run the simulation, or leave it at the
default value (which is taken from the project settings). Running a simulation twice with the same
random seed will produce identical results. Running a simulation with a different random seed will
introduce random variation in agent behaviour but should produce statistically similar overall
behaviour; varying the random seed is one way to determine the sensitivity of the model to small
changes.
In the case of a multi-run simulation, the specified random seed will be used for the first run, and will
then be used to generate a new random seed for the second run and so on. This is done in a
consistent way so if a second multi-run simulation is performed with the same initial seed, all
subsequent seeds will be the same as in the first multi-run simulation.
Threading
By default, MassMotion will run a fully multi-threaded simulation using all available CPU cores. This
will typically result in the shortest simulation time but other applications on the same computer may
become sluggish. To avoid this, it is possible to disable threading entirely (so that MassMotion will
only use one CPU core) or specify the number of threads that should be used. When setting the
number of threads to be used, there are two main considerations to keep in mind:
Specifying a number of threads greater than the number of CPU cores available can result in
slower performance.
Larger simulation populations are required to take full advantage of a larger number of threads. In
some cases when dealing with a small population over a long period of time, it is better to specify
a lower number of threads.
Stopping a Simulation
All simulation types provide a 'stop' button; closing a simulation window will also stop the simulation.
Stopping a simulation causes all current results to be written to the results database. As a result, a
simulation that is stopped early can still be used for playback and analysis, although care must be
taken when interpreting results.
© 2015 Oasys Software Limited
197
MassMotion
4.4.2
Console Simulation Window
The Console Simulation runs with minimal overhead, thereby maximizing use of available computing
resources to minimize run time. A console simulation runs faster than a debug simulation, however,
details of the simulation cannot be accessed while the simulation is running. The results of the run
become available for playback and analysis once the run is complete, or is stopped by the user
midway.
Console Simulation Window Components
4.4.3
Log Window
On the left side of the console simulation window is a live console that
displays diagnostic information, warnings, and errors about the initialization
and execution of the current project. The level of detail reported in the
console can be specified by right-clicking on the console or by selecting an
option from the drop-down menu above the console. The output can also be
saved to a text file with the 'save' icon above the console.
Issues Window
On the right side of the console simulation window is an embedded version
of the issues window that shows warnings and errors that were
encountered while running the simulation. The buttons along the top of the
issue window allow expanding or collapsing all items, saving the issues to
a file or clearing all current issues.
Simulation
Controls
At the bottom of the console simulation window is a progress bar showing
the current progress of the simulation and buttons for pausing the
simulation or stopping it entirely. The 'reload' button will reload any
changes made to the current project, and then restart the simulation with
those changes.
Debug Simulation Window
Running a debug simulation creates a new window that allows visual debugging of the simulation.
The debug simulation window includes all the functionality of the console simulation window,
including a console window for displaying information about simulation execution, an issues window
for displaying warnings/errors, and controls for reloading, pausing/resuming and stopping the
simulation; see Console Simulation Window for details.
In addition, the debug simulation window has a list view that works exactly the same way as the
main window list view to allow selection of objects in the simulation, and its own scene view similar
to the one in the main window but with additional functionality available only while simulating; see
Simulation Scene View for details. A properties pane is also available on the right-hand side to view
details about the state of the currently selected agent or scene object.
The debug simulation window toolbar contains buttons on the right-hand side for hiding and showing
the list view, scene view, console/issue windows and object details pane.
4.4.3.1
Simulation Scene View
The Debug simulation window has 3D view controls similar to those of the main window as described
in 3D Scene View. In addition, there are controls for pausing/stepping/resuming the simulation, and
options for displaying debug information about individual agents and scene objects.
Simulation Control
Simulation execution can be paused and controlled using the keyboard.
198
© 2015 Oasys Software Limited
MassMotion
Simulation Control
Space Bar/
Up Arrow
Key
Toggles the simulation paused state.
Left Arrow
Key
Advances the simulation by one frame at a time. This feature is only available when
the simulation is paused.
Agent Display Options
Right-clicking on one or more agents in a debug simulation window will bring up a context menu with
various options under the 'Display' sub-menu that are not available during playback. These include:
Agent Display Options
Neig
hbou
rhoo
d
Displays the local area vision bounds and indicates
neighbouring agents within the selected agent's
awareness. Note: The information displayed is for the
previous simulation frame.
Yello Lines from central agent to surrounding
w
neighbours.
Line
Pink Displays geometric bounds of agent's
Ring awareness.
Turq Velocity of neighbouring agent.
uois
e
Arro
w
Dark Velocity of central agent.
Blue
Arro
w
Rout
e
Costi
ng
Displays instantaneous costs (distance, queue,
vertical, total) that the agent is subjected to. Red lines
connect selected agents to other waypoints on the
floor.
D Dista Total distance cost
nce
cost
Q Queu Total queue cost (proportional to size of
e
queue)
cost
O Opp Cost proportional to the magnitude of the
osin flow in the opposing direction
g
cost
V Verti Total vertical cost (proportional to vertical
cal stair/ramp/escalator height)
cost
© 2015 Oasys Software Limited
199
MassMotion
Agent Display Options
T
Total Cumulative cost
cost
*
*Note: Total cost may not always equal the sum of
individual costs, as only significant individual costs
are shown.
Agents can be presented with multiple choices (e.g. 3
doors), meaning more than one exit on a floor can
have an associated route cost. Different colours of
text indicate different messages.
Gre This route has been chosen as the target.
en
Red This route is not an available.
Yell This object has already been crossed.
ow Backtracking costs may be applied.
Whi This route has not been chosen to travel. Slightly
te/ different pale colours are used for each route to
pal allow them to be distinguished from each other.
e
col
our
Soci
al
Forc
es
200
Displays the "social forces" to which the agent is
subjected.
Bright Goal
Pulls neighbour towards desired
Green force
destination
Bright Obstacle Repels from surrounding
Yellow constrain neighbours
ed
neighbour
force
Purple Drift force Drifts an agent in direction of bias
when interacting with oncoming
crowd
Turqu Collision Veers agent towards direction bias
oise
veer force in a head-on collision
Orang Collision Slows down and torques agent to
e
yield
avoid perpendicular collision
force
White Cohesion Attracts agents together within a
force
crowd.
Grey Orderly Pushes agents towards the front of
Queuing the goal to which they are targeted,
Force
helping to ensure a straight and
orderly queue.
Brown Corner
Orients agent motion with respect
Force
to near corners, other agents, and
veer direction bias. (Also note the
white and green arrows showing
corners of interest)
© 2015 Oasys Software Limited
MassMotion
Agent Display Options
Blue
Obstacle Resulting net force
constrain
ed net
force
Pink Panic
Strong force pulling agent back to
force
walkable surface when an agent
has lost track of its surface
Black Obstacle Resulting velocity
constrain
ed
velocity
Surfa
ce
Prob
e
Displays agent awareness of surrounding space as it
relates to obstacle avoidance and the direction of
goal.
Bla Displays directions of potential forward routes
ck
Gre Displays direction of best forward route
en
Gol Points to nearby obstacles/boundaries
d
Red Points to closest obstacle/boundary
Scene Object Display Options
The right-click context menu for scene objects during a debug simulation has the same display
options as in authoring/playback, plus the following:
Scene Object Display Options
Obst
acle
Map
(surf
aces
)
4.4.3.2
Displays the obstacle surface map for the selected
scene object. Areas that are unavailable to agents
(obstacles, floor edges) are coloured red. Note: The
map may require several seconds to calculate and
display after pressing the button. Be cautious when
using this attribute on very large objects.
Object Properties
The properties tab is available in the Information Pane at the right-hand side of the Simulation
window. It can be used to monitor property values for selected agents and scene objects in the
simulation. Information is unique to the type of object currently selected.
Agents
© 2015 Oasys Software Limited
201
MassMotion
Properties Tab
202
ID
The unique agent ID.
Age
How long this agent has been in the simulation.
Avatar
The avatar currently used by this agent. This is initially assigned by
the schedule which created the agent, but may be modified midsimulation by an action.
Profile
The name of the profile used by this agent.
Radius (m)
The current body radius of the agent.
Tokens
A list of tokens currently held by the agent - this can change over
the course of the simulation.
Active Task
The current task being performed by the agent. In the case of the
Seek task, the ultimate goal of the agent is also listed.
Active Dispatch
The name of the dispatch currently controlling the agent.
Next Waypoint
B -> C: The agent's next floor transition (moving from B to C where
C is considered the local goal).
Current Floor
The floor, link, stair, escalator, or ramp that the agent believes it is
standing on.
Last Waypoint
A -> B: The agent's previous floor transition (moving from A to B).
Speed Current (m/s)
The current speed of the agent.
Speed Current Max
(m/s)
The current maximum speed the agent could achieve (affected by
local limits imposed by the current floor, link, escalator, ramp, or
stair, or by density related constraints).
Speed Default/Natural
Walkway (m/s)
The natural walking speed of the agent if on flat ground and
unconstrained by neighbours.
Activity
What kind of activity the agent is currently involved in. Possible
values are:
In Input Buffer (wait): The agent is waiting for a gate to open.
In Input Buffer (queue): The agent is queueing to reach the next
waypoint.
In Input Buffer (free): The agent is freely moving towards the next
waypoint.
Being Processed: The agent has reached and is currently being
processed by the next waypoint.
In Output Buffer: The agent has finished processing and is
waiting for downstream capacity.
Waiting: The agent has been put in a wait state by an action.
Not Registered: Agent is in an error state and may be deleted.
Waiting?
True if the agent has chosen a gated link as its next waypoint, and
is currently waiting for the gate to open.
© 2015 Oasys Software Limited
MassMotion
Queuing?
True if the agent is queuing to reach the next waypoint.
Time in Queue (s)
If queuing, this is the time the agent has so far spent queuing for
the next waypoint.
LOS Letter Value
The Fruin LOS letter grade given the stated density (always uses
walkway mapping - never queue or stair mappings).
Density (ppl/m 2)
The current density immediately around the agent.
Space (m 2/ppl)
The personal space immediately around the agent (inverse of
density).
Created By
The agent schedule or timetable that generated the agent.
Notes
Any notes from the agent creation. If generated by a timetable, this
will include the corresponding timetable schedule file name and line
number.
Start Floor
The floor or portal where the agent entered the simulation.
Start Time
The time at which the agent entered the simulation.
Tasks Tab
ID
The unique agent ID.
Task Stack
The queue of tasks that are currently part of the agent's itinerary.
Tasks are executed in order from top to bottom with new tasks
added to the top of the list. The current task is indicated in bold.
Tokens Tab
ID
The unique agent ID.
Token List
Enumeration of all the tokens that the agent is currently holding.
Actions Tab
ID
The unique agent ID.
Action List
A list of the actions that have been applied to the selected agent.
Each action is represented as an expandable group, with the title of
the group containing the time at which the action was applied, the
name of the action, and the manner in which the action was
triggered (e.g. entering a zone, from an event). The expandable
group contains a record of the operations carried out by the action,
including TEST, DO, MODIFY, and TASK.
Floors
© 2015 Oasys Software Limited
203
MassMotion
ID
The unique object ID.
Name
The unique object name.
Type
The type of object.
Zones
Zones of which this floor is a member
Travel Type
Indicates if agents will traverse floor instantly (virtual), ignoring
barriers, or normally.
Surface Resolution
Sampling frequency for goal and obstacle distances on this floor.
Population
Current number of agents on floor.
Route Information
See the description of Waypoint Route Information in the table below.
Portals
ID
The unique object ID.
Name
The unique object name.
Type
The type of object.
Zones
Zones of which this portal is a member.
On Floor
The name of the floor under the portal.
Is Entrance?
True if the portal is configured as an entrance.
Is Exit?
True if the portal is configured as an exit.
Exit Information
See the description of Waypoint Route Information in the table below.
Links, Stairs,
Escalators, Ramps
204
ID
The unique object ID.
Name
The unique object name.
Type
The type of object.
Zones
Zones of which this connector is a member.
Travel Type
Indicates if agents will traverse floor instantly (virtual), ignoring
barriers, or normally.
Surface Resolution
Sampling frequency for goal and obstacle distances on this object.
Population
Current number of agents on object.
Rise Angle (deg)
The angle of inclination for the stair, ramp, or escalator (not available
for links).
© 2015 Oasys Software Limited
MassMotion
Distance Penalty (m)
The distance penalty added to all distance based route costs for this
object.
Queue Penalty Factor
The cost factor applied to all queuing at this object.
Perimeter
Indicates perimeter membership.
Bank
Indicates bank membership.
Is Gated?
True if the object is configured as a gate and can be opened or
closed.
Wait Style
The agent behavior when waiting for a gate.
Route Information
See the description of Waypoint Route Information in the table below.
Waypoint Route
Information
4.4.4
Available Width (m)
The width of the goal line between the connected floors.
Flow Limit (ppl/min)
Cap (if any) on the allowed flow rate through the waypoint.
Flow Average (ppl/min)
The average flow rate through the waypoint over the previous 5
seconds.
Total Processed
The number of agents who have successfully been processed by this
waypoint.
Approaching
The number of agents currently approaching (but not queuing or
waiting for) the waypoint.
Queuing
The number of agents currently queuing for the waypoint (an agent is
only considered queuing if it has the waypoint as its 'Next Waypoint'
and has a speed below a certain threshold).
Running from the Command Line
A simulation can be executed using MassMotionConsole from a DOS command prompt. This is
useful when running multiple projects in sequence, or when running the same project multiple times
with different random seeds.
How to Run
1. From a DOS command console, navigate to the MassMotion installation folder (by default C:
\Program Files\Oasys\MassMotion 8.0).
2. Run MassMotionConsole.exe with the desired parameters (see table below).
3. Note all diagnostic information will be written to the simulation log text file which will be placed
alongside the generated database file.
Arguments / Parameters
Parameters are prefixed with a hyphen "-". Some parameters require values separated from the
parameter name by a space (e.g., -seed 5).
© 2015 Oasys Software Limited
205
MassMotion
206
Option
Description
Example
-dump
Write diagnostic information to a
'debug' folder in the project's
working folder (see Project
Settings).
-dump
fullscre
en
If used in combination with -vis,
the 3D viewer is drawn in fullscreen mode.
-fullscreen
-help
Displays the list of available
parameters and exits.
-help
nothrea
ds
Disable the use of threads during
the simulation.
-nothreads
popscal
e
A number greater than 0, used to
scale the number of agents
generated by all events.
-popscale 2.0
-project
#
Specify the MassMotion project
file (.mm file) to open and run.
-project C:\mm\testproject\testproject.mm
-results
#
Specify the output database file
for results. If the path is relative it
is assumed to be relative to the
folder containing the project file.
-results C:\mm\Testproject\firstrun.mmdb
-seed #
Override the seed value from the
project settings with the given
seed value. The same project run
multiple times with the same
seed value will always produce
the same results. If no seed value
is specified, the seed value from
the project settings is used.
-seed 44321
threads
#
Use the specified number of
threads in executing a simulation.
By using multiple threads,
multiple operations can be
performed at the same time,
greatly improving performance.
The default number is equal to
the number of system processors
(e.g., 4 for a quad-core
computer). A value of 1 will
disable multithreading. Note that
more threads does not
necessarily mean faster
execution given the overhead
required to start, stop, and
manage each thread. The default
-threads 1 (all operations are performed in the main
thread)
-threads 8 (8 threads are used)
© 2015 Oasys Software Limited
MassMotion
value is recommended.
4.4.5
verbosit
y#
Control the number and verbosity
of messages written to the
project log.txt file. Possible
values include ERROR (only log
error messages), WARNING (log
error and warning messages),
APPLICATION (log errors,
warnings, and standard
messages), VERBOSE, DEBUG.
The default is APPLICATION.
-verbosity DEBUG
-verbosity APPLICATION
-vis
Display a 3D view of the scene.
The view can be navigated and
controlled using the same
controls as the regular
MassMotion 3D scene view, but
there are no menus and it is not
possible to run more than one
project. Running with the 3D view
shown will have a negative impact
on performance.
-vis
Generated Simulation Files
The following files can be produced when execution a simulation:
Output Type
DefaultRun.mmdb
An sqlite database file containing all of the information required to analyse
and playback a single simulation run. For information on the database see
Simulation Data. For information on using map, table, and graph queries to
interrogate the database, see Analysis.
DefaultRun.txt
A text log file is created each time a simulation is run. The file contains
diagnostic information on project initialization, execution, and general
performance. All output displayed in the MassMotion console is also
written to the log file. The file is created in the same folder as the database
file and given the same name.
A simulation can be configured to generate debug information about the project. The files are placed
in a 'debug' folder created inside the project's working path.
Debug File
Obstacle Map (*.
jpg)
© 2015 Oasys Software Limited
File (.jpg) containing a visual map of the available space on the given
surface and the distance from every point to the nearest obstacle or
surface edge.
207
MassMotion
White - Point farthest from obstacle or surface edge, or indicates the
presence of a corner
Black - Point closest to an obstacle or surface edge
Red - Covered by obstacle or not on the surface
Note: this file is only generated if the dumping of surface maps is enabled
in the debug tab of the project settings.
Approach Map (*.
jpg)
File (.jpg) containing a visual map of the distance from every point on a
surface to the connected destination object.
Green - Goal line
White - Point farthest from the destination goal line
Black - Point closest to the destination goal line
Red - Covered by an obstacle or not on the surface
Blue - Indicates an unreachable area not connected to the goal line
Note: this file is only generated if the dumping of surface maps is enabled
in the debug tab of the project settings.
CostTree (*.csv)
A file which describes the distance from every decision point in the scene
to the specified goal.
Note: this file is only generated if the dumping of route costs is enabled in
the debug tab of the project settings.
4.4.6
Randomness
Random Seed
MassMotion uses random numbers throughout the simulation. All random numbers are generated
from an initial integer seed value (see Project Settings). A project simulated multiple times with the
same random seed should produce exactly the same results. Changing the seed or any element in
the project will result in different random numbers during the simulation and so different simulation
results.
Distributions
4.4.6.1
Agent
Start
Duration based distribution used by journey and circulate events to determine when
agents enter the simulation.
Single
Value
Distributions used nearly everywhere, influencing how agents may interact with the
scene.
Duration Distributions
A duration distribution is used to determine agent arrival times within an interval. There are fewer
options than with a standard distribution as the min and max are taken automatically from the event
start time and duration. The specified distribution automatically uses 0 as the min and the event
duration as the max. Values generated by the distribution are added to the event start time to
produce an agent's ultimate arrival time.
208
© 2015 Oasys Software Limited
MassMotion
Possible distributions are as follows:
Distribution Types
Uniform
Agents are assigned random start times according to a uniform
distribution. With a large enough number of agents, this should converge
on results similar to the constant distribution.
Normal
Agent start times will follow a normal distribution.
Mean: The mean of the normal distribution relative to the start of the
event.
Std: The standard deviation.
Triangular
Agent start times will follow a triangular distribution.
Mode: The mode of the triangular distribution is relative to the start of the
event.
Log Normal
Agents will have start times as if they were assigned by a log normal
single value distribution with "Shift" as the event start time and "Max" as
the event duration in seconds.
Mu: The normal mean.
Sigma: The normal standard deviation.
Exponential
Agents will have start times as if they were assigned by an exponential
single value distribution with "Shift" as the event start time and "Max" as
the event duration in seconds.
1 / Lambda: The mean start time relative to the start of the event.
4.4.6.2
Standard Distributions
Many object numeric properties are described using a distribution. These properties resolve to single
values based on the probability function of the distribution. For example, a profile defines agent
speed according to a distribution, with each agent given a single speed value according to the
distribution.
For information on duration based distributions used by some events in describing agent arrival
times, see Duration Distributions.
The following single value distribution types are supported:
Distribution Types
Constant
The distribution will always produce the same constant value.
Value: A single number.
Resultant Mean: value
Uniform
© 2015 Oasys Software Limited
The distribution will produce a random number between the minimum and
maximum value. All values within the range are equally likely.
209
MassMotion
Min: The minimum possible value.
Max: The maximum possible value.
Resultant Mean: (max - min) / 2.0
Normal
A value is produced by iteratively generating numbers using a boundless
normal distribution and rejecting any values that lie outside of the allowed
range.
Min: The minimum possible value.
Max: The maximum possible value.
Mean: The mean of the normal distribution.
Std: The standard deviation.
Resultant Mean: Mean
Triangular
The distribution will produce a random number between the minimum and
maximum value according to a regular triangular distribution, with values
being more likely around the mode.
Min: The minimum possible value.
Max: The maximum possible value.
Mode: The mode of the triangular distribution.
Resultant Mean: ( Min + Max + Mode ) / 3.0
Log Normal
A value is produced by iteratively generating numbers using the given
boundless log normal distribution, shifting the resulting values by the
minimum, and rejecting any values that are greater than the maximum.
Shift: The minimum possible value. This value is added to the number
produced by a regular log normal distribution.
Max: The maximum possible value.
Mu: The normal mean.
Sigma: The normal standard deviation.
Resultant Mean: Min + e ^ ( Mu + ( (Sigma ^ 2) / 2 ) )
Exponential
A value is produced by iteratively generating numbers using the given
boundless exponential distribution, shifting the resulting values by the
minimum, and rejecting any values that are greater than the maximum.
Shift: The minimum possible value. This value is added to the number
produced by a regular exponential distribution.
Max: The maximum possible value.
1 / Lambda: The average (inverse of the lambda rate).
Resultant Mean: Min + ( 1.0 / Lambda )
210
© 2015 Oasys Software Limited
MassMotion
4.5
Analysis & Reporting
Analysis is accomplished through the creation and evaluation of graph, map, and table objects.
These objects rely on simulation results made available through one or more simulation run objects.
This section expands on a number of concepts that are important to many of the analysis functions
in MassMotion. This section also details how to export agent position data, images, and videos. For
a comprehensive description of all the available analysis functions please refer to the Analysis
Objects section.
4.5.1
Agent Observer
The Agent Observer window is used to view properties about a particular agent from a recorded
simulation run. The window can be shown by right-clicking on an agent and choosing 'Observe', or by
selecting an agent and using the main window's View -> Observer Agent menu.
The focus button at the top of the window will focus the window on the currently selected agent. The
agent ID and simulation run are displayed immediately below the focus button. The target button to
the right of the simulation run can be used to find the agent in the scene. It is possible to change the
simulation run or manually enter a new agent ID. Manually entering an ID is useful when trying to find
agents mentioned by errors during the simulation.
Right-click on an object in the agent's route to find the object in the scene or jump to the time when
the agent enters or leaves the object.
Agent Observer
Created by
The event which created the agent.
Profile
The profile used by the agent.
Start time
The time at which the agent entered the simulation.
End time
The time at which the agent exited the simulation.
Age
The amount of time the agent has been in the simulation.
Avatar
The avatar used by the agent.
Density
The density currently experienced by the agent ( ppl / m2 )
Speed
The current speed of the agent ( m/s )
State
The state of the agent:
Waiting: The agent is executing a wait task.
In Transit: The agent is moving freely towards its target.
Queuing: The agent is queuing for its target.
Waiting for Access: The agent is waiting for access to its target (waiting
for a gate to open).
Pre-Contact Wait: The agent is queuing for a server.
In-Contact: The agent is being processed by a server.
Post-Contact Wait: The agent is being held by a server until there is
capacity downstream in the process chain.
Target
© 2015 Oasys Software Limited
The object to which the agent is moving.
211
MassMotion
Tokens
A list of tokens held by the agent over the course of its life. Tokens
currently held by the agent are indicated with an arrow.
Route
An ordered list of objects on which the agent walked over the course of its
life. The object that the agent is currently on is marked with an arrow.
Actions:
A list of all actions applied to the agent, identified by the source of the
action. Actions that have already been applied are marked with a check.
Actions that are being applied in the current frame are marked with an
arrow.
The first column is the object which applied the action. The second
column further clarifies the source (see Where to Use Actions). Most
values in the second column are self explanatory, with the exception of '
Zone Event'. When an agent receives an action from an action event as it
fires, it is recorded as 'Action Event'. However, if the action event targets a
zone, and the agent receives the action as it enters the zone while the
event is active, the action is recorded as 'Zone Event' and references the
zone instead of the action event.
4.5.2
Areas
Various types of analysis objects such as agent filters, transitions, trips and population count
graphs use the concept of 'areas'. For the purposes of analysis, several types of objects can be
used as areas:
4.5.3
Area Type
Agents Considered 'In'
Walkable
object
Agents currently on the walkable object (floor, link, escalator, ramp or stair).
Analysis
Region
Agents with the point at the centre of their feet contained within the region.
Zone
Agents on any of the walkable objects that are part of the zone.
Collection
Collections which contain area objects can be used as areas themselves; they
will be displayed using the '.Areas' suffix. Agents are 'in' the collection area if
they are in any of the member's areas. Any members which are not areas will
be ignored.
Transition
The concept of a transition is used within MassMotion to mean a point in time when an agent moves
from one location or state to another. Transitions can be used to define a flow count graph or an 'At
transition' agent filter.
Transitions are defined by selecting a transition type in a drop-down menu. Depending on the type of
transition selected, other entry fields will be made available to define the transition.
Collections in transitions
Collections can be used to define complex transitions.
212
© 2015 Oasys Software Limited
MassMotion
Transition Types
At portal
Transition occurs when an agent enters at a portal, exits at a portal, or
reaches a portal that they have been given as a target (such as by a 'Seek
Portal' task).
With a collection: Agents at any portal within the collection are at the
transition.
Between objects
Transition occurs when an agent steps from one given object to a second
given object.
With a collection as the from object: Agents stepping off any walkable in
the collection to the to object are at the transition.
With a collection as the to object: Agents stepping off the from object to
any walkable in the collection are at the transition.
With collections as both from and to objects: Agents stepping off any
object in the from collection onto any walkable in the to collection are at
the transition. The same collection can be used for both from and to to
track internal transitions.
Crossing cordon
Transition occurs when an agent passes through a given analysis cordon.
With a collection: Agents crossing any cordon in the collection are at the
transition.
Entering area
Transition occurs when an agent enters a given area, or enters the
simulation in the given area.
With a collection: Agents entering the areas in the collection are at the
transition. Internal transitions between areas in the collection are not
counted.
Entering
simulation at
Transition occurs as soon as agent enters simulation from a given portal.
With a collection: Agents entering the simulation at any of the portals in
the collection are at the transition.
Exiting area
Transition occurs when an agent exits a given area (possibly by exiting the
simulation).
With a collection: Agents exiting the areas in the collection are at the
transition. Internal transitions between areas in the collection are not
counted.
Exiting simulation
at
Transition occurs when an agent exits the simulation at the same time as
reaching a portal. This usually occurs when simply exiting at a destination,
but may also happen when removed by an action as an agent reaches a
portal they have been given as a target.
With a collection: Agents exiting the simulation at any of the portals in the
collection are at the transition.
© 2015 Oasys Software Limited
213
MassMotion
Transition Types
Server begin
Transition occurs when an agent enters the pre-contact stage of a given
server.
With a collection: Agents entering the pre-contact stage of any server in
the collection are at the transition.
Server end
Transition occurs when an agent leaves a given server.
With a collection: Agents leaving any server in the collection are at the
transition.
4.5.4
LOS Colour Mapping
Colour mapping describes how density values are converted into colours in maps and graphs.
Density colour mapping can also be used to colour agents during playback through the simulation
run. Values are taken from standard Fruin and IATA (International Air Transport Association) LOS
mappings. When used in maps, black is used to indicate 'no data' (no agent walked in that area).
LOS Colour Mapping Values
Fruin Walkways
Area of circle used to calculate density: 3.24m2.
LOS
A
B
C
D
E
F
Fruin Stairways
A
B
C
D
E
F
2.32
1.39
0.93
0.46
Density (person/m2) Space (m2/
person)
x <= 0.541
x >= 1.85
0.541 < x <= 0.719 1.85 > x >=
0.719 < x <= 1.076 1.39 > x >=
1.076 < x <= 1.539 0.93 > x >=
1.539 < x <= 2.702 0.65 > x >=
2.702 < x
0.37 > x
Colour
1.39
0.93
0.65
0.37
Area of circle used to calculate density: 1.21m2.
LOS
A
B
214
Colour
Area of circle used to calculate density: 1.81m2.
LOS
Fruin Platforms
(Queuing)
Density (person/m2) Space (m2/
person)
x <= 0.309
x >= 3.24
0.309 < x <= 0.431 3.24 > x >=
0.431 < x <= 0.719 2.32 > x >=
0.719 < x <= 1.075 1.39 > x >=
1.075 < x <= 2.174 0.93 > x >=
2.174 < x
0.46 > x
Colour
Density (person/m2) Space (m2/
person)
x <= 0.826
x >= 1.21
0.826 < x <= 1.075 1.21 > x >= 0.93
© 2015 Oasys Software Limited
MassMotion
C
D
E
F
IATA Wait/
Circulate
x <= 1.538 0.93 >
x <= 3.571 0.65 >
x <= 5.263 0.28 >
x
0.19 >
x >= 0.65
x >= 0.28
x >= 0.19
x
Area of circle used to calculate density: 2.70m2.
LOS
A
B
C
D
E
F
4.5.5
1.075 <
1.538 <
3.571 <
5.263 <
Density (person/m2) Space (m2/
person)
x <= 0.370
x >= 2.70
0.826 < x <= 0.435 2.70 > x >=
0.435 < x <= 0.526 2.30 > x >=
0.526 < x <= 0.667 1.90 > x >=
0.667 < x <= 1.00 1.50 > x >=
1.00 < x
1.00 > x
Colour
2.30
1.90
1.50
1.00
Alembic Export
Alembic is an open computer graphics interchange framework. Alembic distils complex, animated
scenes into a non-procedural, application-independent set of baked geometric results. For more
information please visit www.alembic.io.
MassMotion provides the ability to export Alembic files (*.abc) containing animated agent meshes
that can be imported into visualization software such 3DS Max or Maya for inclusion in rendered
scenes. The Alembic export option can be found on the Simulation & Analysis tab of the main
window. Note that the exported data does not currently include the scene geometry (floors, walls
etc.); if desired, scene geometry can exported separately from the main menu.
© 2015 Oasys Software Limited
215
MassMotion
Alembic Export Options
4.5.6
Output file
What Alembic (.abc) file to export to.
Simulation run
Which simulation run to use as the source for agent data.
Time range
The time range over which to export agent data.
Agent filter
Which agents to include in the output.
Agent Position Export
The agent position and other physical attribute data generated by a MassMotion simulation can be
exported to a CSV file using the "Agent Position Table Export" dialog. This dialog can be accessed
through a button in the analysis tab of the main window's ribbon.
The exported table will include the frame number, agent ID and XYZ position of each agent.
Additional data can be included by checking the "Optional columns" options.
Columns are in the following order:
Frame Number, Agent ID, X Position, Y Position, Z Position, Clock Time (optional), Speed (optio
Options
Option
Name
Description
File
The CSV file to which the table will be written.
Simulatio
n run
The simulation run for which data will be written to the table
Time
range
The time period over which agent positions will be included.
Sampling
period
Modifies the number of samples included in the table. By default, every frame will
be sampled, producing data for every agent for every frame. However, the number of
samples can be reduced to once per second or more.
Agent
Filter
Used to select which agents will be included in the table.
Optional
columns
Additional information can be included in the agent position table, toggled by the
following options:
Clock time: The simulation clock time corresponding to the frame number.
Speed: The agent's speed in m/s.
Heading: The agent's heading in degrees. An agent facing the same direction as
the Z axis will have a heading of 0, and the angle increases as the agent turns
counterclockwise.
Move State: The agent's move-state as a number. The meaning of move state
values is listed below.
Animation time: The time an agent has spent in a given move state, useful for
controlling the speed of animations. When walking on flat ground, the value is the
number of strides taken by the agent.
216
© 2015 Oasys Software Limited
MassMotion
Move State
4.5.7
Integer
Value
Description
0
Walking on a flat surface
1
Shuffling (occurs in crowded places)
2
Standing still
3
Walking Up
4
Walking Down
Movie and Image Export
Movies and images of the scene can be produced from within MassMotion using the movie/image
export window. The export window can be accessed from the analysis tab of the main window's
ribbon.
Default settings for movie/image export can be set in the application preferences available through
the main window menu bar.
Project and scene changes
When the export window is first opened, the scene's appearance is copied from the scene in the
main window. This includes agent appearance, background colour and camera position. These can
be further changed within the export window without affecting the main window.
The export window operates on a copy of the current project and so any modifications within the
main window will not affect the export window. However, simulation databases are locked and
existing simulation runs cannot be re-run while the export window is open.
Both the appearance of the scene and the project in general can be reloaded from the main window
by pressing the "Reload" button.
Toolbar
Reload
Reload changes to the project and scene's appearance from the main window.
Render
Start rendering a movie or frames. This process may take some time.
Pause
Pause current render.
Abort
Stop current render and possibly discard any progress.
Single
Image
Take a single image. The user will be prompted for a file name. The following file
formats are supported: *.png, *.jpg, *.tiff
File Options
Save Movie
© 2015 Oasys Software Limited
A movie file will be produced with the desired quality setting. Increased quality
will increase file size. The following file formats are supported: *.mov, *.mp4, *.
217
MassMotion
m4v, *.wmv
Save
Individual
Frames
Individual frames will be produced and placed in the specified directory. All
images will have the *.png format.
Save Movie
and Frames
Both a movie file and individual frames will be produced.
Timing
Time
Range
The period of time to export.
Frame
Rate
The frame rate of the movie to be exported. A higher frame rate will increase the movie
file size and the number of frames produced.
Play
Speed
How fast the movie will appear to play.
Appear
ance
Resoluti
on
The resolution of movies, frames and images produced. Can dramatically affect the
size of file outputs.
Changing the resolution will darken regions at the edges of the scene. These regions
are cropped in the outputs to fit the desired resolution.
Backgr
ound
The background colour to use.
Overlay
218
Text
The colour to use to display overlay text (if any).
Populati
on count
Whether to include text which shows the current population.
Simulati
on time
Whether to include overlay text that shows the current simulation time.
Map
legend
Whether to include a legend for the displayed map (if any).
Referenc
e axes
Whether to include the reference axes in the top right corner.
© 2015 Oasys Software Limited
Index
Index
-GGraph
165
Graph Structure
164
© 2015 Oasys Software Limited
219
220
MassMotion
Endnotes 2... (after index)
© 2015 Oasys Software Limited
Back Cover