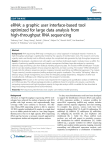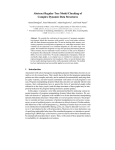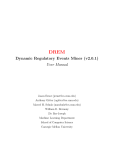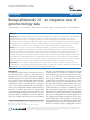
1
Kozhenkov et al. BMC Bioinformatics 2010, 11:610
http://www.biomedcentral.com/1471-2105/11/610
SOFTWARE
Open Access
BiologicalNetworks 2.0 - an integrative view of
genome biology data
Sergey Kozhenkov1, Yulia Dubinina1, Mayya Sedova1, Amarnath Gupta1, Julia Ponomarenko1,2, Michael Baitaluk1*
Abstract
Background: A significant problem in the study of mechanisms of an organism’s development is the elucidation
of interrelated factors which are making an impact on the different levels of the organism, such as genes,
biological molecules, cells, and cell systems. Numerous sources of heterogeneous data which exist for these
subsystems are still not integrated sufficiently enough to give researchers a straightforward opportunity to analyze
them together in the same frame of study. Systematic application of data integration methods is also hampered
by a multitude of such factors as the orthogonal nature of the integrated data and naming problems.
Results: Here we report on a new version of BiologicalNetworks, a research environment for the integral
visualization and analysis of heterogeneous biological data. BiologicalNetworks can be queried for properties of
thousands of different types of biological entities (genes/proteins, promoters, COGs, pathways, binding sites, and
other) and their relations (interactions, co-expression, co-citations, and other). The system includes the buildpathways infrastructure for molecular interactions/relations and module discovery in high-throughput experiments.
Also implemented in BiologicalNetworks are the Integrated Genome Viewer and Comparative Genomics Browser
applications, which allow for the search and analysis of gene regulatory regions and their conservation in multiple
species in conjunction with molecular pathways/networks, experimental data and functional annotations.
Conclusions: The new release of BiologicalNetworks together with its back-end database introduces extensive
functionality for a more efficient integrated multi-level analysis of microarray, sequence, regulatory, and other data.
BiologicalNetworks is freely available at http://www.biologicalnetworks.org.
Background
As substantial amounts of data concerning expression,
interactions/pathways, sequences, and other types of
information for a variety of tissues, developmental stages,
stimuli and organisms are generated, it becomes difficult
for researchers with no background in bioinformatics
and statistics to extract the information they seek. Successful data integration is hampered by the orthogonal
nature of the integrated data and by the multitude of
controversies and name/ID conflicts in public databases.
Examples of conflicts that cannot be automatically
resolved include the situations when genes with the same
name point to different chromosome locations or a gene/
protein in different modification states has different
names; for example, p53, p53(361-393), p53(modified:
* Correspondence: [email protected]
1
San Diego Supercomputer Center, University of California, San Diego, 9500
Gilman Drive, La Jolla, CA, 92093, USA
Full list of author information is available at the end of the article
Thr:212), or pCMX-mutant-p53. Among the name/ID
conflicts that can be resolved is, for example, the conflict
between different genes/proteins having the same synonym or the conflict between two databases naming
the same gene differently - these and similar name/ID
conflicts can be automatically resolved if there are other
databases that recognize the conflicting names. To analyze and visually integrate publicly available data on the
systems level, several web-based tools have been developed: Genomatix [1,2], GeneGO [3], STRING [4], Cytoscape [5], VisANT [6], Ingenuity [7], Pathway Studio [8],
PipelinePilot [9], and BiologicalNetworks [10]. Workflow
systems, like Taverna [11], GenePattern [12] and Galaxy
[13], have been designed for the automatic application of
the computational methods and data provenance management rather than visual integration, representation,
querying and analysis of the data which are addressed in
BiologicalNetworks. Each of the mentioned tools has a
distinct set of features, which are highlighted in Table 1,
© 2010 Kozhenkov et al; licensee BioMed Central Ltd. This is an Open Access article distributed under the terms of the Creative
Commons Attribution License (http://creativecommons.org/licenses/by/2.0), which permits unrestricted use, distribution, and
reproduction in any medium, provided the original work is properly cited.
Kozhenkov et al. BMC Bioinformatics 2010, 11:610
http://www.biomedcentral.com/1471-2105/11/610
Page 2 of 14
Table 1 Web-accessible tools for microarray pathway and DNA sequence regulation analysis
Features/Tools
Pathway/Networks
Microarray
DNA Sequences
Comparative Genomics
GG
PS
PP
BN
Curated Pathways Content
+
+
-
+
-
-
-
-
-
-
+/-
+/-
Biological Themes/Functional Enrichment
+
-
-
+
-
+
-
+
-
-
-
+
Back-end Database
General
IN
PA
CS
GE
VS
GX
TV
Build Pathways/Networks inference
+
+
+
-
-
+
+
+
-
-
-
+
Multi-Experiment Support
-
+
-
+
+
-
-
-
+
+
+
+
Search of Public Expression Compendiums
-
-
-
-
+
-
-
-
+/-
+/-
+
+
Microarray-Pathway-Sequence Integration
-
-
-
-
+
+/-
-
-
+/-
+/-
-
+
General
+/-
-
+
-
+
-
+
-
+
+
+
+
Gene Regulation
+
-
+
-
+
-
+
-
+/-
+/-
+
+
Regulatory regions
-
-
-
-
+
-
+
-
+/-
+/-
-
+
Sequence search
-
-
-
-
-
-
+
-
+
+
+
+/-
Sequence Annotation
-
-
-
-
-
-
+
-
-
-
-
+/-
-
-
+
-
+
-
+
-
+
+
-
+
Homology Search
#
3D Structure/Drug design
ST
Search for homologous TFBS
-
-
-
-
+
-
+
-
-
-
-
+
Visualization
-
-
+
-
-
-
-
-
-
-
+
+
Ligand search
+
+
+
+
-
-
-
+
-
-
+
+
General
+
+
+
+
+
-
+
+
+/-
+/-
+
+
Integration of user’s data
+
?
-
?
?
-
-
-
-
-
+
+
Scalability
-
?
+
?
?
-
?
-
?
?
?
+
OBO ontologies integration
-
-
-
-
-
-
-
-
-
-
-
+
Project Workspace, Data Sharing
+
+
-
+
+
-
+
+/-
+
+
+
+
API/Plugins
+
+
-
+
+
+
-
+
+
+
+
+/-
Free for Academic Use
-
-
+
-
-
+
-
+
+
+
-
+
IN, Ingenuity; GG, GeneGO suite; PS, Ariadne Genomics Pathway Studio; GE, Genomatix suite; ST, STRING; CS, Cytoscape; VS, VisANT; PA, Partek; PP, PipelinePilot;
GX, Galaxy; TV, Taverna; BN, BiologicalNetworks.
+, a feature is present; -, not present; +/-, present but not fully; ?, unknown/cannot be determined;
#, TFBS, transcription factor binding site.
facilitating functional analysis of networks/pathways as
well as comparative gene sequence analyses, including
cis-element prediction, expression profiling and coexpression analysis.
In this work, the application BiologicalNetworks 2.0
for integration of functional genomics data with biological networks is presented. In comparison with other
tools (Table 1; only features that are present in BiologicalNetworks are shown), BiologicalNetworks integrates
much more different types of data and provides broader
analytical capabilities. The developed system minimizes
the need for prior knowledge of existing nomenclatures
and data formats representing microarrays, networks/
pathways, sequences, and other types of data. BiologicalNetworks allows integral visualization and analyses of
over 100,000 features from multiple different data types
that are integrated in IntegromeDB [14,15] and provide
information concerning pathways, molecular interactions, gene function, expression data, sequences, transcription factor binding sites, promoters and other gene
regulatory regions, orthology, mutations and disease
relations for thousands of eukaryotic, prokaryotic and
viral organisms. Querying capabilities implemented in
BiologicalNetworks allows accessing all integrated data
simultaneously, from specified databases only, or in conjunction with the user’s data. BiologicalNetworks provides an interactive and user-friendly interface with a
strong emphasis on graphical data representation. This
paper aims to describe BiologicalNetworks 2.0 and its
application to navigating through the sea of integrated
data and extracting biological knowledge.
Implementation
BiologicalNetworks 2.0 is built on the NetBeans platform from SUN Microsystems [16]. The system has a
modular architecture and an intuitive and customizable
user interface and has been tested for robustness to system failure and big data loads. A typical user of BiologicalNetworks loads large (GBs) datasets from files and
analyzes these data in conjunction with publicly available data integrated in our database. Data uploads to
the program are limited only by the user’s computer
capabilities. Now, by default, a 32-bit Java can upload
(from local files or from the database) ~2GB of data,
and 64-bit Java has practically no limits and can go up
to 64 GB (and more) in modern computers.
Kozhenkov et al. BMC Bioinformatics 2010, 11:610
http://www.biomedcentral.com/1471-2105/11/610
BiologicalNetworks integrated database
The backend database of BiologicalNetworks, called IntegromeDB [14], is a semantic graph base ‘deep-web’ data
integration system, or data warehouse, that automatically
captures, integrates, and manages publicly available data
concerning transcriptional regulation, along with other
relevant biological information. IntegromeDB integrates
over 100 experimental and computational data sources
providing genomics, transcriptomics, genetics, functional
and interaction data in eukaryotes and prokaryotes. The
example databases integrated in IntegromeDB include
NCBI nucleotide and protein databases [17], metabolic
and signaling pathway databases, such as KEGG [18],
interaction networks database, such as STRING [4], and
databases of transcription factors and gene regulatory
regions, such as TRANSFAC [19] (the full list of
integrated databases is provided at http://www.biologicalnetworks.org/Database/tut5.php). IntegromeDB data is
stored in a Postgres database under the MetaGraph
schema and is updated monthly, being synchronized with
the latest changes in most current databases. Detailed
information on the statistics, integrated databases
catalog, and organism list can be found at http://www.
integromedb.org.
The procedure of data integration and mapping to the
internal database is fully automated and is based on the
Semantic Web technologies, such as the Resource
Description Framework (RDF) http://www.w3.org/RDF/
and the Web Ontology Language (OWL) http://www.
w3.org/TR/owl-ref/. IntegromeDB also enables researchers to integrate their own data into the database as
described in the section ‘Integration of User’s Data.’
The IntegromeDB schema is based on BioNets Ontology, the core of which is Basic Ontology that was manually developed by the authors. Basic Ontology describes
classes from different domains, such as, protein, gene,
pathway, interaction, disease, cell, tissue, drug, chromosome, COG functional group, gene set (e.g., operon, regulon). Basic Ontology is manually mapped onto 25 OBO
ontologies, including Sequence Ontology, GeneOntology,
Human Disease, CheBI, BRENDA Tissues, that were
selected from the best curated and regularly updated
ontologies provided by the OBO consortium http://www.
bioontology.org. The mapping among the OBO ontologies, which is provided by OBO, allows for the automatic
integration of 98 ontologies in BioNets Ontology. The
basic.owl file with Basic Ontology and mappings from it
to other ontologies can be downloaded at http://www.
integromedb.org/bionetsonto.php.
Due to the generic schema of the database and ontology-driven mapping, during integration, new objects and
their properties are automatically added in the database.
For example, if the database stored information about the
interaction between the two objects, proteins × and Y,
Page 3 of 14
new information about this interaction will be integrated
as a new property(s), e.g., a property ‘p-value from the
experiment A’, and the ‘experiment A’ will be added in
the database as a new object. If a clear evidence of, or
reference to, a class from the BioNets ontology is absent
(missed), an automatic procedure to statistically evaluate
the content of the integrated table and assign a term
from the ontology is applied. The procedure takes each
word and word combination in the table, search for them
in the BioNets ontology, calculates the statistical significance of the occurrence, and assigns the most significant
term to the table.
Upon the integration of a new data source, the database
automatically identifies conflicts in names, name synonyms and IDs of all objects in the database (genes, proteins, organisms, etc.) among various databases and
identification systems. All names/IDs are weighted and
sorted by the number of integrated data sources, supporting the name/ID. When the user searches the database,
names/IDs appear in the search result in the descending
order by weight; the potential conflicts will appear in the
bottom of the list. Thus, if one database, for example,
names the specific gene as × and another database, as Y,
both names, × and Y, will be equally searchable; while in
the search result, the name that is the most common
among all integrated databases will appear first. However,
no conflict data are removed or become invisible to the
user, since the data sources are not weighted or judged.
Inconsistencies among the names/IDs of all objects in
the database that were found for human, mouse and rat
are provided at http://www.integromedb.org. If the user
searches the http://integromedb.org page for an object
for which inconsistencies were calculated and found, they
can be seen on the result search page by clicking the ‘red
button’.
The IntegromeDB data can be searched at http://www.
integromedb.org; however, in comparison with the
application BiologicalNetworks, described in this work,
the web site provides only general quick search capabilities and no extensive data analysis, dynamic integration,
and visualization capabilities.
Integrative View of data in BiologicalNetworks
The typical user of BiologicalNetworks starts with loading the file or searching the integrated database for a list
of genes (e.g., tab-delimited text-file), networks (.sif-file),
curated pathways (.SBML), microarrays, proteomics data
(tab-delimited file), or sequence data (.gbk, FASTA, or.
gbs-file). BiologicalNetworks provides an Integrative
View of the found data (Figure 1), opening the modules
of the system (Network, Sequence, Microarray, Ontology, and other modules) in separate windows. All
opened modules are synchronized and interconnected
by object/gene/protein IDs, so that changing the state of
Kozhenkov et al. BMC Bioinformatics 2010, 11:610
http://www.biomedcentral.com/1471-2105/11/610
Page 4 of 14
Figure 1 Integrative view of data in BiologicalNetworks.
the object/gene/protein in one module of the system
automatically changes the states of the respective
objects/genes/proteins in all opened modules. This
makes it possible, for example, to map color-coded
expression data or ontology annotations onto any collection of genes/proteins as well as pathways and interaction/relation networks or chromosomal sequence view
that are currently opened in the project. The modules
are described in detail in the subsequent sections.
Microarray data search and analysis
Most current web-based tools are focused on retrieving
expression and/or co-expression patterns for individual
genes from particular microarray experiment. Multiexperiment/multi-gene co-expression analysis is a laborintensive and computationally challenging task, involving
collecting suitable datasets, data downloads, preprocessing,
normalization, and gene annotation management, the integration of different datasets, merging cross-platform data,
Kozhenkov et al. BMC Bioinformatics 2010, 11:610
http://www.biomedcentral.com/1471-2105/11/610
and handling ambiguous mappings between genes and
probe sets. Microarray databases Gene Expression Omnibus (GEO) [20] and ArrayExpress [21] provide tools for
finding and analyzing most relevant datasets, but neither
currently provides a comprehensive gene co-expression
search over many datasets simultaneously. We have
refined and extended the process of multi-experiment/
multi-gene co-expression analysis in the Microarray Analysis window. BiologicalNetworks database integrates tens
of thousands microarray experiments from GEO, ArrayExpress and other public data sources (see the Nucleic Acids
Research list of databases on microarray data and other
gene expression data [29]). Data from every experiment
are normalized, so every expression vector is subtracted
from the mean and divided by the standard deviation of
the experimental expression values. Since different experiments have different numbers of time points and conditions, the Pearson correlation calculation is FDR-corrected
so that the p-Values calculated for PCC take the length of
the expression vectors into account.
The user can upload the microarray data files and
analyze them in conjunction with the integrated compendium of publicly available microarray data using the
Microarray Analysis window. When searching in the
Microarray Analysis window, the user can select the
‘Default’, ‘Co-expression pairs’ or ‘Co-expression Triples’
search modes. In the first case the search will return all
available microarray experiments in which genes from
the input gene list are over- or under-expressed. In the
second case, it will return experiments and gene pairs
where genes are co-expressed; and in the third case, it
will return gene triples and experiments where these
gene triples are co-expressed. This last option is especially important for discovering gene regulatory modules
(e.g. a set of transcription factors regulating a set of coexpressed genes), since several studies exploit the fact
that co-expressed and/or functionally related genes may
be transcriptionally coordinated [22-24] (see the
Demonstration study below). The results are presented
in highly interactive graphical format with strong
emphasis on further data mining. In the resulting tree
the user can pick the datasets manually and visualize it
in the main window with the description of the experiment, annotations and metadata. Datasets in the query
results can be ordered by highest co-expression to input
genes. In addition, to search functionalities the platform
provides the user with clustering and functional enrichment analysis tools.
Integrated visualization of Biological ‘Themes’ and gene
list enrichment analysis
The implementation of the Biological ‘Themes’ within
the BiologicalNetworks framework provides a set of
tools for giving the researcher a biological interpretation
Page 5 of 14
of gene clusters based on the indices provided in the
input data set and information linking those indices to
biological ‘themes’ (e.g. GO, cell types, diseases, etc.).
Our gene list functional enrichment analysis currently
uses as many as 8 annotation categories including 3
categories of GO terms, curated (e.g. KEGG) pathways,
diseases, cell types, tissue gene expression, phenotypes
and human anatomy (Figure 2). Hypergeometric distribution with Bonferroni correction is used as the standard method for determining statistical significance [27].
The result of the analysis is a group of biological themes
that are represented as gene clusters by themes. Statistical reports show the probability that the prevalence of a
particular theme within the cluster is due to chance
alone given the prevalence of that theme in the population of genes under study.
Although ontologies are stored as DAGs (directed
acyclic graph) in our internal database, we visualize
them as tables (’Themes’ Tables) for the sake of usability
and easier navigation (Figure 2). Since BiologicalNetworks provides Integrative View of the visualized data,
all windows of the system and data inside them are synchronized and interconnected by IDs. In the ‘Themes’
Tables, this is exemplified by the simultaneous highlighting of all gene/protein instances in all opened pathways, networks, experiments, sequences etc. representing
the same ‘Theme’ whenever one of them is chosen.
Terms under different categories are highlighted using
different colors. All clusters of genes/proteins discovered
for enriched biological terms are organized by ‘themes’
under the subfolder Analysis in the Project Panel on the
left. Clicking on the expansion symbol or double-clicking over Project Panel tree nodes will expand or collapse
it. Other information, such as the number of genes
directly annotated under the term, connections microarray experiments, network, sequence data if any etc. are
also provided.
Sequence Annotation and Sequence Analysis Browser
Sequence data together with annotation data, including
binding sites, promoters, and other regulatory regions,
that have been integrated in the BiologicalNetworks
database represent the collection of interval trees; a single interval tree is created per chromosome instead of
per annotated DNA sequence regions. Nodes of the
interval (RI)-trees, or sequence intervals. are connected
to the BioNets Ontology http://www.integromedb.org/
bionetsonto.php nodes (Figure 3C) through the internal
Objects and Attribute values tables that list a huge
amount of objects and attributes of different types integrated in the BiologicalNetworks system. BioNets Ontology is implemented as a directed labeled meta-graph
data structure that serves as a general-purpose ‘labeled
join index’. The general-purpose OWL schema of the
Kozhenkov et al. BMC Bioinformatics 2010, 11:610
http://www.biomedcentral.com/1471-2105/11/610
Page 6 of 14
Figure 2 Biological Themes. Biological Themes (GO terms, diseases, cell types, tissues, curated pathways, phenotypes and human anatomy)
representation in BiologicalNetworks.
BioNets ontology integrates Sequence Ontology, GeneOntology, BioPAX, Disease Ontology, Chemical Ontology, the Functional Genomics Ontology (FUGO) and
the Phenotype and Trait Ontology (PATO) and other
ontologies provided by OBO consortium at http://www.
bioontology.org. It is implemented so that any individual
ontology describing another type of biological knowledge (for example epidemiology or pharmacology
e.g. PharmGKB) can be introduced and modified with
minimal impact on the rest of the system. This is implemented through ‘ontology mapping’ [30]: for every new
adapted ontology (for ex. SequenceOntology) that maps
a class (for example class Gene, ‘SO:12345’) a new class
that maintains mapping to source ontology is generated
(i.e. class ‘mappingSO:012345’) which is connected to a
Gene in our BioNets ontology through ‘same_as’
Figure 3 Genomic Sequence Analysis Browser and Annotations. (A) Using the Sequence Search (at the left) box, the user finds genes in
Sequence Browser. In addition to gene related information, all regulatory regions integrated in the database are represented in Sequence
Analysis Browser. (B) In addition to annotations integrated from public databases, BiologicalNetworks allows users to annotate genomic
sequences. Annotation Tab and two ontologies used for annotation are represented. (C) Sequence intervals are connected to BioNets Ontology
(in this case to Sequence Ontology) nodes through the internal Objects and Attribute values tables that list objects and attributes of different
types integrated in the BiologicalNetworks database.
Kozhenkov et al. BMC Bioinformatics 2010, 11:610
http://www.biomedcentral.com/1471-2105/11/610
relation. This is done to not modify BioNets ontology
classes every time new ontology is ingested, thus while
‘unifying’ different biological data types to keep specificity of every member schema of our integrated database.
Examples of operations on RI-trees that will apply on all
substructures (e.g. sequence intervals), called SUB_X,
are represented below:
ifOverlap function: SUB-X * SUB_X - > {0, 1}, returns
true if the two interval substructures overlap.
Next function: SUB_X ->SUB_X is applicable on data
types for which there is a strict ordering on the domain;
it returns the sub-structure encountered next in the
ordering input substructure. The semantics of ‘next’
depends upon the data types (sequence, anatomical/geographical region, etc.).
Intersect function: SUB_X * SUB_X ->SUB_X, returns
the intersection of two SUB-X. This operation is valid
for convex data types such as sequences and rectangles.
These operators are extensively used in Sequence
Analysis Browser for Navigation (scroll upstream/downstream, get_next gene/operon/chromosome or next gene_regulatory region) (Figure 3) and Annotation of
multiply overlapping gene regulatory regions (binding
sites, composite regulatory elements, TATA-box, etc.)
(Figure 3B). Figure 3 represents different types (binding
site, TATA-box, operon, etc.) of segment elements and
different annotations (properties) integrated from many
data sources for one gene or gene upstream region.
Genomic Sequences are integrated with the meta-graph
schema of Biological-Networks database through an ElementId-ObjectID connection table, where elements are
sequence elements, for example, a core promoter,
TATA box, or binding site, that are attributed to a particular gene by means of known localization in the gene,
according to the GenBank global position. Internal enumerations in the integrated databases-TRANSFAC, for
example, provides localization of regulatory regions in
respect to the transcription start-are recalculated
accordingly. The connection table assigns sequence elements to meta-graph objects, so that sequence elements,
represented as a RI-tree structure, become graph objects
within the meta-graph database. All heterogeneous data,
for example gene properties in the Property Panel
(Figure 3 top right), integrated in the meta-graph database thus appear to be mapped on genomic intervals
and vice versa. In the result, DNA sequences, molecular
interaction graphs, 3D protein structures, images of
expression, and other types of data integrated in the
BiologicalNetworks become connected and annotated
within the same context. The sequence part of BiologicalNetworks integrated database is updated monthly
from the primary public servers: GenBank, Ensembl and
the UCSC Genome Browser database.
Page 7 of 14
In the Sequence Analysis Browser, the user can upload
(from the local files or retrieve from the database) large
(GBs) volumes of sequence data and analyze them
together with the integrated data on gene sequences,
annotations, orthologs and cross-references to the major
biological databases displayed in the Sequence Annotation Browser (Figure 3). The browser window allows
any sequence region within specific gene loci or whole
genome to be displayed (Figure 1), using the set of navigation tools that are functionally similar to the tools in
UCSC Genome Browser [28]. The rich collection of
sequence features, such as exons, introns, the transcription start site, repetitive elements, conserved sequence
regions and transcription factor binding sites, are colorcoded in the browser window. The whole genome Chromosome Viewer (Figure 1, bottom) is a chromosomal
representation of the entire genome of a sample. This
view, integrated with experimental data (e.g. microarray), provides easy identification of large-scale abnormalities and the overall aneuploidy of a sample. The
display consists of a number of bars (Figure 1), each
representing a chromosome. Each bar is composed of a
series of colored linear segments, each representing a
probe. The user can click on any clone in the chromosomal viewer to see its clone name and chromosome,
and all properties (e.g. RefSeq IDs) from integrated database.fho
Comparative Genomics Browser
BiologicalNetworks provides the ability to investigate
transcriptional cascades by integrating and visualizing
transcription factor gene regulation networks, relevant
transcription factor binding sites and target genes with
multiple sequence annotations, thus facilitating validation experiments (e.g. primer design applications)
(Figure 4). A fundamental problem in building transcription factor (TF)-gene networks based on binding
motifs in DNA sequences of putative target genes is the
rate of false positive predictions of TF binding sites
(TFBSs). To reduce the false positive rate of TFBSs predictions, phylogenetic footprinting methods are used
that search only for genomic DNA sequences, which are
conserved among species. Phylogenetic footprinting
methods still have a high false positive rate because,
although a TFBS might be correctly predicted, binding
of the respective factor might only occur in certain cells
or tissues. The BiologicalNetworks’ Comparative Genomics Browser addresses both these problems of TFBS
prediction via 1) integrating TFBSs predicted by phylogenetic footprinting methods [25,26]; 2) integrating all
available experimental and computational data sources
on transcriptional regulation, transcription factor binding sites, together with scores (p-Values) [31] (user can
Kozhenkov et al. BMC Bioinformatics 2010, 11:610
http://www.biomedcentral.com/1471-2105/11/610
Page 8 of 14
Figure 4 Screen-shot of Comparative Genomix Browser. Comparative Genomix Browser shown together with the pathway window that
depicts transcription factor-DNA binding network for CREB, NRSF, GATA-1, ATF-1 (green squares) and their targets (red circles). In Comparative
Genomix Browser (right window), for selected species, TFBSs collected from public data and predicted using phylogenetic footprinting are
shown aligned as provided by phylogenetic footprinting. The user can zoom in/out, scroll the sequences and network regions for respective TFs
and genes to see the binding sites, relative chromosomal positions of target genes and respective sequence events.
filter interactions by p-value in the Build Pathway
Wizard when constructing gene regulatory networks) of
binding event for each transcription factor and a gene
or a pair of genes; and 3) filtering the final TF-gene
interaction networks by tissue- and cell type-specificity
in order to correct the probability of binding and thus
reduce the false positive rate of TFBSs prediction and
narrow the list of potential target genes for further
investigation. Described methods can be applied to
those genes and species for which data on TFBSs and
gene homology are available in the BiologicalNetworks
integrated database; if such data are available, gene regulatory regions can be visualized in the browser as it is
shown in Figure 4 (right window). The homology information is imported from the COGs database [32]; we
extend the COG groups to cover all organisms available
in the IntegromeDB database of BiologicalNetworks.
The Comparative Genomics Browser can be explored
together with other modules/windows of BiologicalNetworks. For example, Figure 4 shows how the browser
can be used in tandem with the network/pathway window on the example of four transcription factors, CREB,
NRSF, GATA-1, ATF-1, in three species, human, mouse
and rat. Other species, including prokaryotes, can be
also studied, subject to data availability. Because if the
user intends to explore specific genes/species in these
two modules simultaneously, all these types of data,
interaction networks/pathways, TFBSs and gene homology, must be available. The browser displays regions
surrounding orthologous genes, highlighting orthology
relations among them and cases of synteny (co-localized
orthologs). The user may change the stringency of evolutionary conservation of TFBSs and apply tissuespecific and cell type-specific filters; in the results, data
and their representation visualized in both windows will
change synchronically. The Comparative Genomics
Browser together with other modules of BiologicalNetworks forms a valuable tool for investigating transcriptional cascades as it is described in the section
‘Demonstration Study’ below.
Data Querying
The BiologicalNetworks interface contains multiple search
and build pathways/networks capabilities (Figure 5), allowing the simultaneous querying of and the building of pathways/networks, using microarray or proteomics data,
networks, curated pathways, sequences, sequence annotations, gene regulatory regions, and other data. The user
can start searching for an entity of interest and then query
for relations to that entity. Alternatively, the user can
Kozhenkov et al. BMC Bioinformatics 2010, 11:610
http://www.biomedcentral.com/1471-2105/11/610
Page 9 of 14
Figure 5 BiologicalNetworks data querying environment. (A) BuildPathwayWizard (BPW) assists the user in finding regulatory paths and
functional links, between selected objects, searches for common targets or regulators for the group of molecules, finds connection to curated
pathways (e.g. KEGG). BPW can find functional links between proteins in the lists imported from other programs (e.g. gene expression clusters).
(B) Specialized Search Boxes are available on the Microarrays, Curated Pathways and Networks panels. (C) Search by attributes provides an
advanced querying facility for retrieving the data of user’s interest by querying Objects and Properties types. User friendly querying interface
allows user to make query with any logical combination of conditions both on Node and Property types. (D) Organism Filter on 21 mostly used
organisms and organism groups.
import a list of entities and search for relations among
them and other entities in the database.
The seven querying options listed below allow for the
specification and search for any logical combination of
entities, processes/relations and their properties. The first
four options are available from Quick Search Box at the
top right corner of the program (Figure 5) and allow
searching the entire database. The next three query
options define more specific searches; they are accessible
by clicking the buttons to the left and right of the search
boxes in the correspondent windows (Figure 5A-C). The
search results appear in the bottom list panel (Figure 5,
bottom).
1. Simple Gene/Protein search (default search). For
example, the search for the three genes/proteins
‘p53, egfr, esr1’ returns these three genes in all specified species and gene properties. The list of genes/
proteins can be uploaded from the file.
2. Keyword search. For example, the keyword search
‘p53, egfr, esr1’ returns all database objects, including experiments, publications, pathways, and all
properties of all objects that contain either p53, egfr,
or esr1.
3. Wild card search. For example, the search ‘neurodeg*’ returns all objects related to neurodegenerative, neurodegeneration, and all words in the
databases beginning with ‘neurodeg’.
4. Multi-word search. For example, the search ‘obesity diabetes’ (no comma separating ‘obesity’ and
‘diabetes’; comma means OR) returns the results for
‘obesity AND diabetes’ and ‘obesity OR diabetes’.
5. Build Pathway Wizard: Path Queries. Build Pathway Wizard contains dozens types of pathway and network searches (in the opened networks/pathways or
integrated database) in protein-protein interactions,
transcription factor-DNA networks, relational (coexpression, co-citation, etc.) networks and curated
pathways (e.g. KEGG) (Figure 5A). The three wizard
windows (Figure 5A) allow users to specify:
a) algorithm type for pathway building;
b) select the directionality of relations;
c) types of objects and property values (e.g., specific proteins from specific species or specific database/dataset) to be included in the pathway; and
d) relations (e.g., p-value of the protein-protein
interactions for all or selected experiments) to be
included in the new pathway.
Kozhenkov et al. BMC Bioinformatics 2010, 11:610
http://www.biomedcentral.com/1471-2105/11/610
6. Specialized search (Figure 5B). These Search
Boxes are available on the Microarrays, Curated
Pathways and Networks and Sequence panels. They
are for quick retrieval the most popular public data
sets.
7. Search by attributes (Figure 5C). The search by
attributes allows the user searching the database, as
well as user’s data files, for specific entities, using
many types of data as search conditions. These
include, for example, node type, effect (positive,
negative, unknown), mechanism (transcription, phosphorylation), tissue type, description, user-defined
attributes text, and so forth. (Figure 5C). These types
of queries can contain logical operators on the attributes (a detailed description is provided in the
online Tutorial).
Search Boxes accept lists of gene names (that can be
loaded from files), accession numbers from public databases (SwissProt, UniGene, GenBank, etc.) or GEO
experiments (Series and Datasets). The system recognizes most of the currently available gene/protein IDs
and synonyms for thousands of organisms integrated
from over 100 data sources. To perform a search in the
microarray, pathways/networks, sequence annotations
and PubMed repositories, the user can specify any combination of keywords, including authors names, tissue
types, diseases, gene/protein names. The Search Box
contains different configuration options and filters and
enables limiting searches on specific species, opened
network/pathway and sequences. The organism dropdown menus in each search window include 21 model
organisms, which are mostly represented in the database, and the following options to narrow down the
search and subsequent data analysis: All Organisms,
Eukaryotes, Prokaryotes and Viruses. Eukaryotes are
subdivided into Plants, Fungi, Protists, Archea, and
Metazoa/Animals, which in turn are subdivided into
Vertebrate, Invertebrate and Mammals.
Loading files and Output results in BiologicalNetworks
In BiologicalNetworks, the user can load/open files in
the following standard formats:
• networks: SIF (Simple Interaction Format), PSI-MI,
Tab-delimited network file, SBML and BiGG model
format;
• microarray data: tab-delimited file format, Illumina
tab-delimited and Affymetrix file formats;
• sequences: GenBank (GBK, GBS) and FASTA
formats.
The results of analysis and visualization in BiologicalNetworks can be saved at any moment as the BioNets
Page 10 of 14
XML Project file and then opened at other computers;
the user’s settings, data files, results of search, built networks, clustering, colorings and all other visualizations
will appear exactly how they were at the moment of the
file saving. The project can be also saved/exported to
the SIF and SVG formats.
Integration of users’ data
BiologicalNetworks allows the user to work with his/her
own data, and to integrate them into the system database (IntegromeDB). The integration procedure is different from the procedure of loading/opening data files
described above in that the loaded data are available to
the user and also to whoever obtains the BioNets XML
Project file that includes the user’s data. The integration
procedure allows the data to be made public; they
become integrated in IntegromeDB as any other database and become searchable in the BiologicalNetworks
application and at the web-page http://integromedb.org.
The user can integrate the data at http://integromedb.
org under “User’s Data Integration” menu (Figure S2 in
Additional File 1). The data will become public, but
unless it is already curated by the data administrators, it
will remain ‘tagged’ as ‘uncurated’ under the contributor’s name. The integration procedure consists of
3 steps (see Figure S2 in Additional File 1): 1) Registration, 2) Data Mapping and 3) Data Integration. Data
mapping and integration is done automatically; it follows the same procedure as one described in the section
‘BiologicalNetworks integrated database.’ The user
can accept or not accept the resulting mapping. To be
integrated, the data needs to be in the table format. Any
type of data can be integrated, given that they are provided in the tab-delimited format.
User support and Problem Handling
To address the critical need for user support, we developed Bug and Problem Report Tools. This tool allows
the user to report problems or bugs, while working in
BiologicalNetworks. During the installation of BiologicalNetworks and the initial run of the program, the user
is asked for the agreement for permission to send from
his computer any future bug reports. If the user agrees,
Bug Reports will be automatically generated and sent to
our support server; it will include the environment settings and the last user’s steps before the program gave
an error. To report the problem, the user needs to use
Problem Report Tool that is located in the ‘Tools’ menu
of the program. The Sun NetBeans Report and Bugzilla
mechanisms are employed in the Bug/Problem Report
Tools. Our experience shows that most of the user
(especially beginners) problems are minor problems that
can be quickly fixed by the developers, if the Bug and
Problem Report Tools are used.
Kozhenkov et al. BMC Bioinformatics 2010, 11:610
http://www.biomedcentral.com/1471-2105/11/610
Results
The BiologicalNetworks analytical and querying functionality were applied to and tested in a number of different biological systems/projects, both eukaryotic and
prokaryotic: host-pathogen interactions, specifically, the
influenza and Streptococcus pneumoniae -human/mouse/
rat interactions [33], ‘meta-genomics’ CAMERA project
[34], yeast meiosis [35], whole-genome metabolic reconstruction in Humans and E. coli [36], parasite studies in
Giardia lamblia [37], and microbial metabolism in Thermatoga maritime [38]. All described projects are accessible from BiologicalNetworks main page under “Driving
Projects” panel or upon launching the BiologicalNetworks application, on the Welcome Screen. These studies
can be replicated by running the respective projects.
In this section, we demonstrate a case study of the
search for potential therapeutic targets for hypertension.
Specifically, it is shown how, using BiologicalNetworks
and starting with a single microarray experiment in the
model organism Rattus norvegicus [39], one can identify
regulatory regions in the hypertension essential genes and
investigate transcriptional modules and gene regulatory
networks describing multi-factorial nature of hypertension
(Figure 6). Below the case study is described step-by-step.
First, among about 1000 genes significantly perturbed
in hypertension in the microarray experiment [39]
(Figure 6-1), we found 25 over-expressed and 110
under-expressed genes that showed the maximal fold
change of expression in hypertension (Table S1 in Additional File 1) (Figure 6-2). For the demonstration purpose of this study, we focused only on over-expressed
genes. Further, using the multi-experiment/multi-gene
Microarray Search Panel, we searched the microarray
experiments for co-expressed pairs containing the
selected over-expressed genes (Figure 6-3). Data in every
experiment was normalized; that is, the expression vector was subtracted with the mean of the expression
values in the experiment and divided by the standard
deviation. Since different experiments have different
number of time points and conditions, calculation of
Pearson correlation coefficient (PCC) was FDR-corrected, so that calculated p-values for PCC took into
account the length of the expression vectors (experiments). For further analysis, only pairs that were coexpressed in more than 10 experiments were chosen
(Figure S3, Section S1.4, in Additional File S1).
Second, we built a network of 20 selected genes,
selected at the previous step, that were co-expressed
and at the same time over-expressed in hypertension,
together with TFs that might potentially regulate transcription of these genes [40]. To search for TFs, we considered that gene regulation is controlled to a significant
degree by TFBSs within proximal promoters and the
fact that in orthologous promoters, the relative order
Page 11 of 14
and spacing among TFBSs expected to be conserved
during evolution [22-24]. For the 20 selected genes, we
first identified orthologous promoter regions in human,
mouse and rat (Figure 6-4). We considered the regions
from -6 kb to 500 bp relative to the transcription start
sites and used Comparative Genomics Browser, which
was described in the above section and shown in Figure
4. Then, we searched for TFBSs that were conserved in
the orthologous promoters (Figure 6-5). Binding sites
were filtered at p-values below 10 -3 and examined
visually for consistency. In the result, we obtained 103
TFs that might potentially regulate transcription of 18
hypertension-specific genes (Figure S3B, 3C, Section
S1.5 in Additional File S1). To construct the final network, we searched for all reported interactions among
identified 103 TFs and 20 genes (Figure 6-6). The
obtained network is shown in Figure 7; it consists of
78 TFs/proteins/genes since depicts only those of analyzed TFs/proteins/genes for which at least one pairwise
interaction/relation was reported in the databases integrated in Biological-Networks.
Third, to investigate the constructed network, we
searched the GEO compendium for co-expressed TF-gene
pairs; we found pairs that are connected by red lines in
Figure 7. We also investigated whether more disease information related to the found genes/TFs can be obtained
from OMIM database. Using the keyword search mechanism, we first searched the integrated database for MeSH
terms related to ‘hypertension’ and then searched for these
terms in the OMIM database. Among all human genes,
hypertension-associated MeSH terms were found in 504
genes, or about 1.6% of all human genes. While in the set
of 103 transcription factor found in this study (20 genes
were not considered), 32 genes, or 31%, had hypertension
associated terms (Table S2 in Additional File S1).
Figure 7 shows the integrated picture, visualizing in
BiologicalNetworks, of the network of found genes/proteins/TFs and interactions among them. Well-known
genes and TFs associated with hypertension are depicted
in blue and green squares in Figure 7; while other
genes/TFs can be suggested for further experimental
investigation on association with hypertension and considered as drug target candidates for hypertension. Similar analysis can be done, using the genes that were
under-expressed in the considered microarray experiment. The described project can be seen and further
analyzed launching BiologicalNetworks and opening
‘BMC Bioinformatics Demo Project’.
Conclusions
The new release of BiologicalNetworks introduces
extensive functionality for a more efficient integrated
analysis and visualization of diverse data in studies of
different biological systems concerning human diseases,
Kozhenkov et al. BMC Bioinformatics 2010, 11:610
http://www.biomedcentral.com/1471-2105/11/610
Page 12 of 14
Figure 6 Systems analysis in BiologicalNetworks.The figure details the strategy that was used to systematically search for co-expressed
(co-regulated) genes and promoter frameworks linked to the co-regulation of genes significant in hypertension in human, mouse and rat.
host-pathogen interactions, metagenomics, meiosis in
fungi, microbial metabolism, and whole-genome metabolic reconstruction in eukaryotes and prokaryotes. The
BiologicalNetworks database has a general purpose
graph architecture and is data-type neutral, thus there is
the prospect of further data integration for more complete systems biology studies. The integration of additional, orthogonal sources of information, such as
Kozhenkov et al. BMC Bioinformatics 2010, 11:610
http://www.biomedcentral.com/1471-2105/11/610
Page 13 of 14
Figure 7 Integrated molecular interaction network of human/mouse/rat hypertension. Red rectangles - highly co-expressed (red lines)
and over-expressed genes in hypertension. Yellow triangles - TFs potentially regulating hypertension-specific genes, which TF binding sites are
conserved in human, mouse and rat. Black lines - physical protein/TF/kinase - protein/TF/kinase interactions. Green and Blue squares - genes/
proteins/TFs that are well known from literature to be essential in hypertension. Red lines - co-expressed genes/proteins. Dashed lines predicted TFs and their target genes. Numbers (1-4) correspond to gene/protein groups functionally enriched by particular GO terms, shown in
the upper left corner.
clinical data, will enable quantitative associations of clinical variables with the activities of molecular pathways
and processes. We also demonstrated how BiologicalNetworks can be used to find disease-specific interaction
networks, through the application of multi-level analysis
of microarray, sequence, regulatory, and other data.
Besides customization on the level of selecting analysis
methods/tools in BiologicalNetworks, the user has an
option to change the parameters of each method; for
example, specify the homology level in the “Build
Homology Wizard” when building the clusters of homologous genes/proteins or specify data sources, types of
interactions, species, and p-values in the “Build Pathway
Wizard”. We are also customizing BiologicalNetworks
constantly adding new features, methods, data formats
and sources by the users’ requests.
To allow for the replication and comparison of the
results presented in this work with other related analysis,
all available demonstrated examples and data can be
accessed in ‘BMC Bioinformatics Demo Project’, upon
launching the BiologicalNetworks application. Additionally, the BiologicalNetworks Welcome Screen and front
page of the web site contains a list of “driving” biological
projects (for various species and types of analysis) which
can be replicated by simply running the respective project.
BiologicalNetworks, along with the user Manual and
Video tutorials and Quick Start Guide, is available at
http://www.biologicalnetworks.org.
Availability and requirements
Project name: BiologicalNetworks
Project home page: http://www.biologicalnetworks.
org
Operating systems: Windows 2000/XP/Vista/7,
Linux/Ubuntu/Redhat, MacOSX
Programming language: Java
License: Free for academic purposes
Other requirements: 2GB RAM
Additional material
Additional file 1: Methods. Detailed description of the methods and
data types used in the BiologicalNetworks system.
Acknowledgements and Funding
We would like to thank our colleagues from UCSD Medical School Daniel
O’Connor and Ryan Fries and Animesh Ray from KGI for valuable discussions
of Hypertension case study and Ching-Wai Tan for critical reading of the
manuscript.
This work is supported by National Institutes of Health R01GM084881 to MB
and AG and R01GM085325 to JP.
Author details
1
San Diego Supercomputer Center, University of California, San Diego, 9500
Gilman Drive, La Jolla, CA, 92093, USA. 2Skaggs School of Pharmacy and
Pharmaceutical Sciences, University of California, San Diego, 9500 Gilman
Drive, La Jolla, CA, 92093, USA.
Kozhenkov et al. BMC Bioinformatics 2010, 11:610
http://www.biomedcentral.com/1471-2105/11/610
Authors’ contributions
MB, AG and MS contributed to system concept. SK, YD, MS and MB
implemented the system and performed major programming work. MB and
JP coordinated this work, contributed to data analysis and wrote the
manuscript. All authors read and approved the final manuscript.
Received: 12 October 2010 Accepted: 29 December 2010
Published: 29 December 2010
References
1. Werner T: Regulatory networks: Linking microarray data to systems
biology. Mech Ageing Dev 2007, 128:168-72.
2. Genomatix Suite. [http://www.genomatix.de].
3. GeneGO Suite. [http://www.genego.com].
4. Jensen LJ, Kuhn M, Stark M, Chaffron S, Creevey C, Muller J, Doerks T,
Julien P, Roth A, Simonovic M, Bork P, von Mering C: STRING 8-a global
view on proteins and their functional interactions in 630 organisms.
Nucleic Acids Res 2009, 37:D412-6.
5. Shannon P, Markiel A, Ozier O, Baliga NS, Wang JT, Ramage D, Amin N,
Schwikowski B, Ideker T: Cytoscape: a software environment for
integrated models of biomolecular interaction networks. Genome
Research 2003, 13(11):2498-504.
6. Hu Z, Hung JH, Wang Y, Chang Y, Huang C, Huyck M, DeLisi C: VisANT 3.5:
multi-scale network visualization, analysis and inference based on the
gene ontology. Nucleic Acids Res 2009, 1(37 Web Server):W115-W121.
7. IPA:[http://www.ingenuity.com].
8. Nikitin A, Egorov S, Daraselia N, Mazo I: Pathway Studio–the analysis and
navigation of molecular networks. Bioinformatics 2003, 19:2155-2157.
9. PipelinePilot. [http://accelrys.com/products/pipeline-pilot/].
10. Baitaluk M, et al: BiologicalNetworks: visualization and analysis tool for
systems biology. Nucleic Acids Res 2006, 34:W466-471.
11. Oinn T, Addis M, Ferris J, Marvin D, Greenwood M, Carver T, Pocock MR,
Wipat A, Li P: Taverna: a tool for the composition and enactment of
bioinformatics workflows. Bioinformatics 2004, 20:3045-3054.
12. Reich M, Liefeld T, Gould J, Lerner J, Tamayo P, Mesirov JP: GenePattern
2.0. Nature Genetics 2006, 38(5):500-501.
13. Goecks J, Nekrutenko A, Taylor J, The Galaxy Team: Galaxy: a
comprehensive approach for supporting accessible, reproducible, and
transparent computational research in the life sciences. Genome Biology
2010, 11:R86.
14. Baitaluk M, Ponomarenko J: Semantic Integration of Data on
Transcriptional Regulation. Bioinformatics 2010, 26(13):1651-1661.
15. Baitaluk M, et al: PathSys: integrating molecular interaction graphs for
systems biology. BMC Bioinformatics 2006, 7:55.
16. NetBeans platform. [http://www.netbeans.org].
17. Wheeler DL, Barrett T, Benson DA, Bryant SH, Canese K, Chetvernin V,
Church DM, Dicuccio M, Edgar R, Federhen S, et al: Database resources of
the National Center for Biotechnology Information. Nucleic Acids Res 2008,
36:D13-D21.
18. Kanehisa M, Goto S: KEGG: Kyoto Encyclopedia of Genes and Genomes.
Nucleic Acid Res 2000, 27:29-34.
19. Matys V, et al: TRANSFAC and its module TRANSCompel: transcriptional
gene regulation in eukaryotes. Nucleic Acids Res 2006, 34:D108-110.
20. Barrett T, Troup DB, Wilhite SE, Ledoux P, Rudnev D, Evangelista C, Kim IF,
Soboleva A, Tomashevsky M, Edgar R: NCBI GEO: mining tens of millions
of expression profiles - database and tools update. Nucleic Acids Res 2007,
35:D760-D765.
21. Parkinson H, Kapushesky M, Shojatalab M, Abeygunawardena N, Coulson R,
Farne A, Holloway E, Kolesnykov N, Lilja P, Lukk M, Mani R, Rayner T,
Sharma A, William E, Sarkans U, Brazma A: ArrayExpress - a public
database of microarray experiments and gene expression profiles.
Nucleic Acids Res 2007, 35:D747-D750.
22. Fessele S, Maier H, Zischek C, Nelson PJ, Werner T: Regulatory context is a
crucial part of gene function. Trends Genet 2002, 18:60-63.
23. Liu R, McEachin RC, States DJ: Computationally identifying novel NFkappaB-regulated immune genes in the human genome. Genome Res
2003, 13:654-661.
24. Dohr S, Klingenhoff A, Maier H, Hrabe de Angelis M, Werner T, Schneider :
Linking disease-associated genes to regulatory networks via promoter
organization. Nucleic Acids Res 2005, 33:864-872.
Page 14 of 14
25. Qiu P, Qin L, Sorrentino RP, Greene JR, Wang L, Partridge NC: Comparative
promoter analysis and its application in analysis of PTH-regulated gene
expression. J Mol Biol 2003, 326:1327-1336.
26. Halfon MS, Grad Y, Church GM, Michelson AM: Computation-based
discovery of related transcriptional regulatory modules and motifs using
an experimentally validated combinatorial model. Genome Res 2002,
12:1019-1028.
27. Huang DW, Sherman BT, Lempicki RA: Systematic and integrative analysis
of large gene lists using DAVID Bioinformatics Resources. Nature Protocol
2009, 4(1):44-57.
28. Rhead B, Karolchik D, Kuhn RM, Hinrichs AS, Zweig AS, Fujita P, Diekhans M,
Smith KE, Rosenbloom KR, Raney BJ, Pohl A, Pheasant M, Meyer L, Hsu F,
Hillman-Jackson J, Harte RA, Giardine B, Dreszer T, Clawson H, Barber GP,
Haussler D, Kent WJ: The UCSC Genome Browser database: update.
Nucleic Acids Res 2010, 38:D613-9.
29. Cochrane GR, Galperin MY: The 2010 Nucleic Acids Research Database
Issue and online Database Collection: a community of data resources.
Nucleic Acids Res 2010, 38:D1-4.
30. The Open Biomedical Ontologies. [http://www.obofoundry.org/index.cgi?
show=mappings].
31. Lee T, et al: Transcriptional regulatory networks in Saccharomyces
cerevisiae. Science 2002, 298:799804.
32. Tatusov RL, Fedorova ND, Jackson JD, Jacobs AR, Kiryutin B, Koonin EV,
Krylov DM, Mazumder R, Mekhedov SL, Nikolskaya AN, et al: The COG
database: an updated version includes eukaryotes. BMC Bioinformatics
2003, 4:41, 3.
33. Kozhenkov S, Sedova M, Dubinina Y, Ponomarenko J, Gupta A, Ray A,
Baitaluk M: BiologicalNetworks - tools enabling the integration of multiscale data for the host-pathogen studies. BMC Systems Biology 2010.
34. Seshadri R, Kravitz SA, Smarr L, Gilna P, Frazier M: CAMERA: A Community
Resource for Metagenomics. PLoS Biol 2007, 5(3):e75.
35. Yeast meiosis. [http://www.biologicalnetworks.org/analysis/tut0.php].
36. Becker SA, Feist AM, Mo ML, Hannum G, Palsson BO, Herrgard MJ:
Quantitative prediction of cellular metabolism with constraint-based
models: The COBRA Toolbox. Nat Protocols 2007, 2(3):727-738.
37. Birkeland SR, Preheim SP, Davids BJ, Cipriano MJ, Palm D, Reiner DS,
Svärd SG, Gillin FD, McArthur AG: Transcriptome analyses of the Giardia
lamblia life cycle. Mol Biochem Parasitol 2010.
38. Microbial metabolism. [http://www.biologicalnetworks.org/analysis/tut6.
php].
39. Fries RS, Mahboubi P, Mahapatra NR, Mahata SK, Schork NJ, SchmidSchoenbein GW, O’Connor DT: Neuroendocrine transcriptome in genetic
hypertension: multiple changes in diverse adrenal physiological systems.
Hypertension 2004, 43:1301-1311.
40. Chang LW, Fontaine BR, Stormo GD, Nagarajan R: PAP: a comprehensive
workbench for mammalian transcriptional regulatory sequence analysis.
Nucleic Acids Res 2007, 35:W238-W244.
doi:10.1186/1471-2105-11-610
Cite this article as: Kozhenkov et al.: BiologicalNetworks 2.0 - an
integrative view of genome biology data. BMC Bioinformatics 2010
11:610.
Submit your next manuscript to BioMed Central
and take full advantage of:
• Convenient online submission
• Thorough peer review
• No space constraints or color figure charges
• Immediate publication on acceptance
• Inclusion in PubMed, CAS, Scopus and Google Scholar
• Research which is freely available for redistribution
Submit your manuscript at
www.biomedcentral.com/submit