1
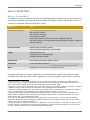
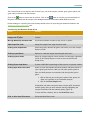
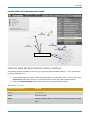
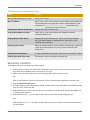
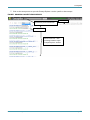
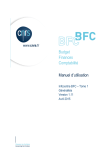
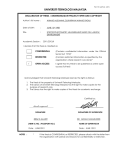
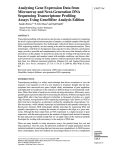
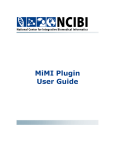
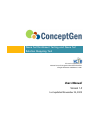
Gene Set Enrichment Testing and Gene Set
Relation Mapping Tool
This work is supported by the
National Center for Integrative Biomedical Informatics
through NIH Grant# 1U54DA021519-01A1
Users Manual
Version 1.0
Last updated November 24, 2009
ConceptGen
CONTACTS
ConceptGen Help
[email protected]
Website: http://conceptgen.ncibi.org
National Center for Integrative Biomedical Informatics (NCIBI)
The University of Michigan Medical School
Palmer Commons Room 2017, Palmer Commons
100 Washtenaw Avenue
Ann Arbor, MI 48109-2218
Phone: 734-615-5510
Fax: 734-615-6553
Website: http://www.ncibi.org
Email: [email protected]
National Center for Integrative Biomedical Informatics: NIH Grant # U54 DA021519 01A1
Page 1
ConceptGen
Table of Contents
CONTACTS .......................................................................................................................... 1
TERMS OF USE ..................................................................................................................... 3
General Use Policy ..................................................................................................................................3
For academic and non-profit institutions: ..........................................................................................3
For commercial and for-profit institutions: ........................................................................................3
Disclaimer ...................................................................................................................................................3
ABOUT CONCEPTGEN ......................................................................................................... 4
What is ConceptGen? .............................................................................................................................4
What Can You Do with ConceptGen? ..................................................................................................5
Tested Platforms .......................................................................................................................................5
Suggested Citation ...................................................................................................................................5
METHODS USED FOR CONCEPTGEN ................................................................................... 5
Concept Building .......................................................................................................................................5
Enrichment Testing (Overlap Possibilities) ............................................................................................6
Private concepts ........................................................................................................................................7
Background sets ........................................................................................................................................7
Gene Expression Analysis .......................................................................................................................7
Gene Set Relation Mapping- Network Graph ...................................................................................8
Gene Set Relation Mapping- Heatmap View ....................................................................................8
Gene-Gene Enrichment Analysis............................................................................................................8
USER REGISTRATION AND LOGIN ...................................................................................... 9
User Registration.......................................................................................................................................9
Login ............................................................................................................................................................9
Forgotten Password .................................................................................................................................9
UPLOADING GENE LISTS (PRIVATE CONCEPTS) ............................................................... 10
VIEWING RELATED CONCEPTS TO UPLOADED OR QUERIED GENE SET ........................... 11
Upper Left Concept Explorer Screen ............................................................................................ 11
Comparing Enriched Concepts to Uploaded or Queried Gene Set ............................................ 13
FILTERING ENRICHED CONCEPTS ...................................................................................... 14
VIEWING NETWORK RELATIONSHIPS ............................................................................... 15
Network Graph Viewer ....................................................................................................................... 16
Concept Detail .................................................................................................................................... 16
Customizing the Network Graph View ........................................................................................... 17
VIEWING GENE SET RELATIONSHIPS USING A HEATMAP ................................................ 18
Heatmap Viewer ................................................................................................................................... 18
Customizing the Heatmap View.......................................................................................................... 19
BROWSING CONCEPTS ...................................................................................................... 19
National Center for Integrative Biomedical Informatics: NIH Grant # U54 DA021519 01A1
Page 2
ConceptGen
TERMS OF USE
Supported through a grant from the NIH, the National Center for Integrative Biomedical Informatics (“NCIBI”)
is one of seven National Centers for Biomedical Computing (“NCBC”) in the NIH Roadmap. Based at the
University of Michigan, part of the UM Center for Computational Medicine and Biology (“CCMB”), the NCIBI
develops efficient software tools, data integration methods, and systems modeling environments. This Suite of
Tools and Data (the “Tools”) allows the Center to provide researchers with web-accessible knowledge
analysis, collaborative work environments to create and utilize computationally-enabled models, and
workflows to better understand complex biomedical processes. By agreeing to these Terms of Use governing
the use of the NCIBI tools, you agree as follows:
General Use Policy
For academic and non-profit institutions:
•
•
•
•
Permission is granted to access, use and/or download the Tools for internal use only;
If the user desires to create derivative works of the Tools, source code or access to databases maybe
made available through request to the NCIBI by e-mailing: [email protected];
Users must inform NCIBI of any derivative works of the Tools created (e-mail: [email protected]);
Use of the Tools must be acknowledged in resulting publications (see citation policy below).
For commercial and for-profit institutions:
•
•
Permission is granted to access, use, and/or download the Tools for internal use only;
To create derivative works of the Tools for commercial purposes, source code or access to databases
may be permitted through negotiation for a commercial license. Please send request through: [email protected]
Disclaimer
THE USER AGREES THAT THE TOOLS ARE PROVIDED AS IS, WITHOUT REPRESENTATION OR WARRANTY BY
THE UNIVERSITY OF MICHIGAN OF ANY KIND, EITHER EXPRESS OR IMPLIED, INCLUDING WITHOUT
LIMITATION THE IMPLIED WARRANTIES OF MERCHANTABILITY AND FITNESS FOR A PARTICULAR PURPOSE.
The Regents of the University of Michigan shall not be liable for any damages, including special, indirect,
incidental or consequential damages, with respect to any claim arising out of, or in connection with, the use of
these Tools, even if it has been or is hereafter advised of the possibility of such damages. Nothing in this
license shall be deemed to grant any rights of the University of Michigan except as expressly stated herein.
The names and trademarks of the University of Michigan may NOT be used in advertising or publicity
pertaining to your use of the Tools, except as expressly stated herein.
National Center for Integrative Biomedical Informatics: NIH Grant # U54 DA021519 01A1
Page 3
ConceptGen
ABOUT CONCEPTGEN
What is ConceptGen?
ConceptGen is a gene set enrichment and gene set relation mapping tool that can help you identify, explore,
and visualize relationships and significant overlaps among sets of genes (concepts). ConceptGen is built on a
repository of conceptual data drawn from diverse areas.
Data Type
Source
Functional annotations
Gene Ontology (GO) Biological Process 1
GO Molecular Function
GO Cellular Component
Protein Domains (Pfam) 2
Kyoto Encyclopedia of Genes and Genomes (KEGG) 3 Pathways
The Protein ANalysis THrough Evolutionary Relationships (Panther) 4 database
Biocarta Pathways
Literature derived
Medical Subject Headings (MeSH)
Online Mendelian Inheritance in Man (OMIM) 5
Targets
Drug Bank target sets
transcription factor binding targets
microRNA predicted targets
Experimental
Gene Expression Omnibus (GEO) datasets 6
Interactions
Protein-interaction databases – Michigan Molecular Interactions (MiMI) 7
Other
Metabolites and Cytoband (chromosomal locations)
ConceptGen finds gene sets that are significantly overrepresented from among the sub-categories (topics)
comprising each of the above data sources. Significance of over-representation is measured by a modified
The Gene Ontology Consortium. Gene ontology: tool for the unification of biology. Nat. Genet. May 2000; 25(1):25-9.
Finn R., Tate J., Mistry J, Coggill PC, Sammut JS, Hotz HR, Ceric G, Forslund K, Eddy SR, Sonnhammer EL, Bateman A. The
Pfam protein families database. Nucleic Acids Res. 2008; Database Issue 36:D281-D288.
3 Kanehisa M., Araki M., Goto S, Hattori M, Hirakawa M, Itoh M, Katayama T, Kawashima S, Okuda S, Tokimatsu T, Yamanishi
Y. KEGG for linking genomes to life and the environment. Nucleic Acids Res. 2008. 36:D480-D484.
4 Thomas PD, Campbell MJ, Kejariwal A, Mi H, Karlak B, Daverman R, Diemer K, Muruganujan A, Narechania A. PANTHER: a
library of protein families and subfamilies indexed by function. Genome Res. 2003. 13: 2129-2141.
5 Online Mendelian Inheritance in Man, OMIM. McKusick-Nathans Institute of Genetic Medicine, Johns Hopkins University
(Baltimore, MD) and National Center for Biotechnology Information, National Library of Medicine (Bethesda, MD). World
Wide Web URL: http://www.ncbi.nlm.nih.gov/omim/
6 Barrett T, Troup DB, Wilhite SE, Ledoux P, Rudnev D, Evangelista C, Kim IF, Soboleva A, Tomashevsky M, Marshall KA,
Phillippy KH, Sherman PM, Muertter RN, Edgar R. NCBI GEO: archive for high-throughput functional genomic data. Nucleic
Acids Res. 2009 Jan; 37 (Database issue):D5-15.
7 Tarcea VG, Weymouth T, Ade A, Bookvich A, Gao J, Mahavisno V, Wright Z, Chapman A, Jayapandian M, Ozgur A, Tian Y,
Cavalcoli J, Mirel B, Patel J, Radev D, Athey B, States D, Jagadish HV. Michigan molecular interactions r2: from interacting
proteins to pathways. Nucleic Acids Res. 2008; 37(Database issue):D642-6.
1
2
National Center for Integrative Biomedical Informatics: NIH Grant # U54 DA021519 01A1
Page 4
ConceptGen
Fisher's exact test (p-value) and is also shown by q-values. Q-values take into account the estimated
proportion of false positives incurred (the false discovery rate) based on p-values.
What Can You Do with ConceptGen?
Gene Set Enrichment Testing
• Upload a list of genes (larger lists tend to yield better results) to find other pre-defined concepts that
are significantly enriched with genes in your uploaded set
• Find relationships among those concepts
Gene Set Relation Mapping
• Enter a term/topic to retrieve and display predefined concepts that are semantically close to your
entry
• Find other concepts from the retrieved results that contain an over represented number of genes
contained in the chosen Concept
• Explore the network of relationships
Gene – Gene Enrichment Analysis
• Query a gene symbol to find related genes that share a significant number of annotations with the
query gene (can be used to predict the pathway of action of genes with unknown function)
• Query a gene symbol to identify all concepts to which that gene is assigned in ConceptGen
Tested Platforms
This software was developed and tested in Internet Explorer, Safari, and Opera on MAC and PC computers.
In other browsers, and on other operating systems, i.e. Linux, results may differ. However, we will be glad to
hear of any problems a user experiences and attempt to fix them. Email ConceptGen Help at:
[email protected]
Suggested Citation
Sartor MA, Mahavisno, V; ConceptGen [Internet]. Ann Arbor (MI): National Center for Integrative Biomedical
Informatics. 2009 Sept.
Available from http://conceptgen.ncibi.org/core/conceptGen/index.jsp
METHODS USED FOR CONCEPTGEN
Concept Building
ConceptGen defines concepts (gene sets) based on a wide variety of types of biological knowledge (concept
types) with the goal of being able to identify novel relationships among diverse sources. Concepts and
concept types are downloaded automatically or manually from various genomic resource centers, entries are
converted to NCBI Entrez Gene IDs if necessary, and concepts are uploaded and stored in an Oracle
database. In order to avoid non-informative or overly-vague concepts we limit the scope to between 5 and
1000 genes per concept. Gene Ontology, KEGG pathway, Biocarta Pathway, Panther Pathway, and Pfam
information was downloaded from their respective source. Chromosomal location was determined by NCBI
cytoband assignment, and gene expression signatures were defined as detailed in the Gene Expression
Analysis Methods below. Other concept types were built as detailed here:
National Center for Integrative Biomedical Informatics: NIH Grant # U54 DA021519 01A1
Page 5
ConceptGen
Literature-derived concepts: Gene2MeSH (http://gene2mesh.ncibi.org) identifies gene-MeSH term pairs by
testing whether the number of co-occurrences of each pair in the literature is significantly more than expected
at random. MeSH concepts were generated from Gene2MeSH using a p < 0.001 cutoff for gene-MeSH term
pairs.
Human diseases: Online Mendelian Inheritance in Man® (OMIM®) was downloaded and manually curated
to form unique concept names.
Drug Targets: Data was downloaded directly from DrugBank (Wishart, et al., 2008).
Transcription factor targets: TRANSFAC® 2008.3 database was used to directly assign transcription factors
to their target genes.
Protein-interactions: For protein-interactions we used the MiMI (Michigan Molecular Interactions) database,
which deep-merges several sources of interactions, resulting in a comprehensive database of human protein
interactions and thus great power/coverage to detect significant enrichments. MiMI concepts are defined by
the protein-protein interactions centered at a specified gene, and were formed by including a central gene
and all of its direct interactions (Tarcea, et al., 2008).
MicroRNA targets: miRBase (Griffiths-Jones, et al., 2006) human predicted targets were downloaded and
converted to Entrez IDs to form the miRNA target concept type.
Metabolite-centered concepts: Metabolite concepts were defined using Edinburgh Human Metabolic Network
database (Ma, et al., 2007). Each metabolite concept is comprised of genes encoding metabolic enzymes that
catalyze reactions involving the respective metabolite.
Enrichment Testing (Overlap Possibilities)
Public concepts: All pairs of concepts from all concept types are tested for whether there exists a larger
number of overlapping genes than is expected by chance. We use a slightly modified Fisher's exact test,
termed the "Ease score" (Hosack DA, et al. Gen Biol. 2003 4(6):P4.) (see Figure below for how this is
displayed in a 2-by-2 table). P-values are adjusted for multiple testing by calculating q-values using the FDR
method (Benjamini & Hochberg. J of the Royal Stat Soc B. 1995. 57:289-300.) The default display is those
concepts with q-value < 0.05, but the user may choose a different q-value or p-value cutoff.
# in
category
# not in
category
# signif
# not
signif
A-1
B
10
40
C
D
200
9800
The hypergeometric distribution is used
to calculate probabilities for overlap
𝑝𝑝 =
(𝐴𝐴 − 1 + 𝐵𝐵)(𝐶𝐶 + 𝐷𝐷)(𝐴𝐴 − 1 + 𝐶𝐶)(𝐵𝐵 + 𝐷𝐷)
(𝐴𝐴 − 1)! 𝐵𝐵! 𝐶𝐶! 𝐷𝐷! (𝐴𝐴 − 1 + 𝐵𝐵 + 𝐶𝐶 + 𝐷𝐷)
Notice the test is invariant to switching
rows and columns
National Center for Integrative Biomedical Informatics: NIH Grant # U54 DA021519 01A1
Page 6
ConceptGen
Private concepts
Private Concepts (gene lists) uploaded by the user are converted to Entrez Gene IDs if necessary, and stored
and tested in a private concept type. The identical modified Fisher's exact test is implemented, and q-values
are calculated for the experimental list versus each concept type separately.
Background sets
A background set is defined as all genes (Entrez IDs) that were interrogated in creating the concept type. For
example, for Gene Ontology concept types, the background set is all genes that are assigned to at least one
ontology term. Users are provided the option for uploading a background set for each of their private
concepts (gene sets). It is important to use the correct background gene set for each enrichment test, and for
that we use the intersection of the background gene sets for the two concept types of the concepts being
tested. Thus, for example, if we are testing a GO term versus a miRNA target list, we use all genes that are in
both the GO background set and the miRNA target background set.
Gene Expression Analysis
In order to define expression-based concepts, we developed a custom-built gene expression analysis pipeline
that uses a carefully chosen statistical method for each step. The gene expression concept type is populated
with human Affymetrix experiments in Gene Expression Omnibus (GEO). We plan to update and expand this
periodically. The analysis pipeline performs the following tasks:
1. Downloads the raw Affymetrix CEL files from GEO and the relevant experimental design information.
2. Using R, Probes are mapped to probe sets based on the relevant Entrez ID centered CDF package
(Dai M, et al. NAR, 33, 2005).
3. Data is pre-processed and normalized using RMA.
4. Quality control output is manually observed, and only data passing our quality control standards
proceeds.
5. Based on automatically extracted sample names provided by the author, comparisons are set up
manually through a pipeline interface.
6. Differential expression is tested using an empirical Bayes, intensity-based moderated t-test (IBMT)
(Sartor MA, et al. BMC Bioinf, 7, 2006), which provides better estimates of variance and improved
ranking of significant genes compared to a standard t-test, especially for experiments of small sample
size.
7. Gene sets (concepts) are defined by the top ranked genes, ranked by p-value, using the criteria fold
change > 20% and p-value < 0.05, and limited to no more than 1000 genes. Note: We do not use
the adjusted p-value for concept creation because, as opposed to identifying individual genes as
significantly differentially expressed (when adjusting the p-values is necessary), identifying enriched
concepts is improved by using a more relaxed significance cut-off (Sartor MA, et al., Bioinformatics,
2008).
National Center for Integrative Biomedical Informatics: NIH Grant # U54 DA021519 01A1
Page 7
ConceptGen
Gene Set Relation Mapping- Network Graph
The graphical networks for gene set relation mapping are displayed using Adobe® FLEX/FLASH, and the
force directed layout algorithm, which groups nodes that have a high degree of interconnectivity. The network
has the following attributes: the concept type of each concept node is shown by the color as indicated in the
legend, the size of the concept node is based on the number of genes in the concept, the thickness of the edge
lines is based on the number of common genes.
Gene Set Relation Mapping- Heatmap View
The values used in creating the heatmap are defined by the counts of the enrichment concept pairs that a
gene belongs to, and the genes and concepts are clustered using complete linkage hierarchical clustering with
the Euclidean distance measure. Color of columns range from black (gene belongs to no enriched concepts) to
bright red (genes belonging to the most enriched concepts.)
Gene-Gene Enrichment Analysis
Similar to gene set enrichment testing, a series of modified Fisher's exact tests are performed, but with genes
replacing concepts, and concept membership replacing genes. For the application, q-values are calculated
and a q-value < 0.01 cutoff is used as default. The gene-to-gene enrichment analysis provides a statistical
measure of the closeness of any two genes by annotations, and can be reached through a link on the main
ConceptGen website. It can also be used simply to query all concepts that any specific gene is assigned to in
ConceptGen.
National Center for Integrative Biomedical Informatics: NIH Grant # U54 DA021519 01A1
Page 8
ConceptGen
USER REGISTRATION AND LOGIN
ConceptGen is available at:
http://conceptgen.ncibi.org
User Registration
In order to upload and save your private concepts (gene lists), you will need to register to create a user
account.
1. Click on Register in the upper right hand corner.
2. On the User Registration form, fill in all fields (First Name, Last Name, Title, Institution, Department,
Email, Password, Re-type Password).
3. Click the Register button.
Login
If you have already registered with ConceptGen previously, then proceed with the login procedures.
1. Click on Login in the upper right hand corner.
2. On the User Login page, fill in your email address that you used for registration and your password.
3. Click the Login button.
Forgotten Password
If you have forgotten your password:
1. On the User Login page (click on Login in the upper right hand corner), click on the “Forgot
Password?” link.
2. Fill in your email address.
3. Click on the Submit Request button.
Your password will be emailed to you.
National Center for Integrative Biomedical Informatics: NIH Grant # U54 DA021519 01A1
Page 9
ConceptGen
UPLOADING GENE LISTS (PRIVATE CONCEPTS)
Once you have logged in, previously saved concepts will appear on the My Concepts screen. If you have not
yet saved any concepts, this screen will be empty.
1. Click on Upload Concept in the upper right hand corner or the
button next to the My Concepts
header.
2. Fill in a new Gene List Name.
3. Select the radio button appropriate for the format of your gene identifiers.
a. Entrez Gene Id (Human)
Select this option for National Center for Biotechnology Information (NCBI) Entrez Gene IDs
for humans
b. Mouse or Rat
Select this option for mouse or rat genes. Because ConceptGen is human-centric, mouse and
rat genes will be converted to human homologs before they are uploaded. If you select this
option, an additional screen appears to convert your gene list.
i. Select the radio button appropriate to your species: Mouse or Rat.
ii. Select the radio button appropriate for the format of your gene identifiers: Entrez
Gene Id or Official Gene Symbol
iii. Paste in the gene identifiers into the left box.
iv. Click on the Convert to human homolog button.
v. Copy the converted gene list that appears in the right box and paste in the
appropriate box in the main window.
c. Official Gene Symbol
Select this option to upload official gene symbols.
If you have a compound(s) rather than a predefined gene list, you can use the Compound to Gene
converter which will create a gene list related to your compound(s) for you. Click on the
[Compound to Gene] link.
I.
II.
III.
IV.
Start to fill in the “Look up compound name” box. A drop down list of available
compounds will display.
Click on the compound of interest in the drop down list.
Click on the
button.
Repeat until finished.
OR
4.
5.
6.
7.
Enter one or more compounds directly into the “Enter compound name here” box.
V.
Click on the Find Genes button.
VI.
Copy the gene list that appears in the box.
Paste gene identifiers into Gene List box.
Select the Background set appropriate for your gene species in the Background set dropdown menu.
(Optional) If you are uploading microarray datasets or other datasets for which the complete human
gene list was not assessed/measured, then select the Background Set Name radio button.
(Optional) Fill in a new Background Set Name.
National Center for Integrative Biomedical Informatics: NIH Grant # U54 DA021519 01A1
Page 10
ConceptGen
8. (Optional) Paste in the gene identifiers for the human genes background set in the Background Set List
box.
9. Click on the Upload Gene List button.
VIEWING RELATED CONCEPTS TO UPLOADED OR QUERIED GENE SET
After clicking on the Upload Gene List button, the Concept Explorer screen appears with your gene list and its
related concepts as shown in Figure 1. By default, only concepts with q-value < 0.05 are displayed.
FIGURE 1. CONCEPT EXPLORER SCREEN
Concept slices = proportionate #
Protein–protein
interactions
Your gene list sorted by name
Filter Tab
Enriched Concepts Tab View –
Details on Overrepresented Concepts for your gene
Concept Type
Test Statistics
Upper Left Concept Explorer Screen
The upper left corner of the Concept Explorer screen displays a gene list summary including the Queried
Concept Name, Concept Type, and Gene List size and your gene list sorted by name. You also have the
option to export the gene list to Excel by clicking the
icon next to the Action label.
Upper Right Concept Explorer Screen
The upper right corner of the Concept Explorer screen displays a proportionate view of the types of concepts
related to your gene list. Mousing over individual slices of the pie chart displays the Source, the percentage
National Center for Integrative Biomedical Informatics: NIH Grant # U54 DA021519 01A1
Page 11
ConceptGen
and number of related concepts. You can change the pie chart to view results as a bar chart by clicking on
the
icon underneath the pie chart and in the upper right corner of the Enriched Concept Tab portion of the
Concept Explorer Screen.
Enriched Concepts Tab of the Concept Explorer Screen
The lower section of the Concept Explorer screen displays the default view of the Enriched Concepts tab. This
tab shows details of the overrepresented concepts for your gene list.
Sort results in the Enriched Concepts tab by clicking on the column header for the column by which you would
like to sort. A small black arrow appears next to the sorted column and indicates the direction of the sort
function.
Export results in the Enriched Concepts tab by clicking on the
icon in the upper right corner of the Enriched
Concept Tab portion of the Concept Explorer Screen (next to the chart icon).
National Center for Integrative Biomedical Informatics: NIH Grant # U54 DA021519 01A1
Page 12
ConceptGen
Comparing Enriched Concepts to Uploaded or Queried Gene Set
In order to compare a specific concept to your gene set:
1. Click on the desired concept of exploration in the Enriched Concepts tab on the Concept Explorer
screen.
2. The Upper Left Corner of the Concept Explorer screen will display the enriched concept summary next
to your gene list summary and includes the Enriched Concept name, Concept Type, Gene List Size
(Figure 2). Your gene list summary will also be updated to include the Overlap number of genes
between your gene list and the enriched concept.
3. Export the overlapping gene list to Excel by clicking on the
enriched concept summary section.
icon next to the Action label in the
OR
Go to the data source for the selected concept by clicking on the
icon.
OR
View the protein interactions in the Michigan Molecular Interactions (MiMI) NetBrowser application by
clicking on the
icon.
FIGURE 2. INDIVIDUAL ENRICHED CONCEPT CONCEPT EXPLORER SCREEN
Your gene list summary
Enriched concept summary
National Center for Integrative Biomedical Informatics: NIH Grant # U54 DA021519 01A1
Page 13
ConceptGen
FILTERING ENRICHED CONCEPTS
You may filter the enriched concepts for your gene set by setting your filter preferences in the Filter Concepts
tab of the Concept Explorer screen.
1. Click on the Filter Concepts tab in the lower portion of the Concept Explorer screen (Figure 3).
2. By default, all of the concept types in the Concept Type column are selected. To exclude any of these
concept types, uncheck the box next to the concept type you would like to exclude.
3. Set the values for p- or q- values by sliding the arrows on their respective scales.
4. To activate the filters you have modified, click on the Execute Filter button.
a. The chart in the Concept Explorer screen automatically updates to adjust for your filtered
preferences. In order to view individual concepts, click on the Enriched Concepts tab to return
to the Enriched Concepts tab view in the Concept Explorer screen.
To reset the filtering function back to the standard settings, click on the Remove Filter button.
FIGURE 3. FILTER CONCEPTS TAB CONCEPT EXPLORER SCREEN
Filter Concepts Tab
Stringency
sliders
National Center for Integrative Biomedical Informatics: NIH Grant # U54 DA021519 01A1
Page 14
ConceptGen
VIEWING NETWORK RELATIONSHIPS
To view relationships between concepts,
1. Select the concept types whose relationships you would like to explore in the Enriched Concepts tab
view of the Concept Explorer.
a. Select individual concepts by clicking on the check box next to the concept.
OR
b. Select concept types by clicking on the appropriate concept type on the chart in the upper
right hand corner of the Concept Explorer screen (either the pie or the bar chart can be used
to select concept types).
2. Click on the Draw complete interactions box if you would like to view links between all selected
concepts and not just the links between your gene list and the enriched concepts (Figure 4).
3. Click on the Draw Network Graph button.
FIGURE 4. NETWORK GRAPH OPTIONS FOR CONCEPT EXPLORER SCREEN
Check to display
cross concept links
National Center for Integrative Biomedical Informatics: NIH Grant # U54 DA021519 01A1
Page 15
ConceptGen
Network Graph Viewer
Network Graph Viewer Symbols
Meaning
Node size
Number of genes associated with that concept
Node color
Type of concept. See legend for specific concept types
Edge thickness
Number of overlapping genes
Concept Detail
To view the genes associated with a specific concept, double click on the node for that concept. The concept
Detail screen will appear (Figure 5). The selected concept node will turn red. The genes that appear in the
Concept Detail screen are all of the genes associated with that specific concept not just those genes from your
original gene list.
FIGURE 5. CONCEPT DETAIL IN NETWORK GRAPH VIEWER
Selected node
highlighted in red
National Center for Integrative Biomedical Informatics: NIH Grant # U54 DA021519 01A1
Page 16
ConceptGen
The Concept Detail screen displays: the Concept Type, size of the concept, and the genes (gene symbol and
gene name) associated with that concept.
Click on the
button to export the list to Excel. Click on the
button to view the protein interactions of
the genes associated with this concept in the Michigan Molecular Interactions (MiMI) NetBrowser tool.
Double clicking on a specific gene in the Concept Detail screen will open the gene detail information in the
Michigan Molecular Interactions tool.
Customizing the Network Graph View
Action
Function
Click and dragging nodes or the
background of graph
Move nodes to desired location; move entire graph to a desired
location
Moving Motion-Stop Threshold slider
Forces the movement of nodes to stop slower or quicker
Adjust Graph Size slider
Adjusts the length of the edges between nodes
Clicking Clear Graph button
Clears the graph; deselects all genes and returns you to the Concept
Explorer screen
Clicking Legend button
Removes or adds the legend describing the node colors
Clicking Explorer button
Brings up Concept Explorer screen (click the X in the upper right hand
corner of the Concept Explorer screen to return to the Network
Graph View)
Clicking Export Graph button
Creates a PNG file format image of the screen in a separate window
Clicking Open Gene Filter button
Opens a screen that includes the Gene Symbols and Gene Names of
your original gene list from which you can select specific genes to
filter out which concepts are associated with that specific gene or
genes.
1. Click on the box next to the gene symbol of the gene(s) for
which you would like to see associated concepts.
2. Click on the Filter Graph button.
ConceptGen will make transparent those concepts NOT associated
with the gene(s) that you have selected, thereby highlighting the
concepts associated with the selected gene(s) (Figure 6).
To clear the filter selection, click on the Clear Filter button.
Click on Close Gene Filter button
Closes the Gene Filter screen
National Center for Integrative Biomedical Informatics: NIH Grant # U54 DA021519 01A1
Page 17
ConceptGen
FIGURE 6. GENE FILTER IN NETWORK GRAPH VIEWER
Filtered out concepts
VIEWING GENE SET RELATIONSHIPS USING A HEATMAP
ConceptGen provides a heatmap view of the your gene set and its enriched concepts. To view relationships
by using a heatmap view:
1. In the Concept Explorer window, select the concepts that you would like to view. You may click on the
Select All link in the chart area if you would like quickly to select all of the enriched concepts.
2. Click on the Draw Heatmap button on the bottom of the Concept Explorer window.
Heatmap Viewer
Heatmap Characteristics
Meaning
X-axis
Your gene list
Y-axis
Enriched concepts
Color
Redness indicates number of enriched concepts that include a specific
gene
National Center for Integrative Biomedical Informatics: NIH Grant # U54 DA021519 01A1
Page 18
ConceptGen
Customizing the Heatmap View
Action
Function
Moving Adjust Heatmap Size slider
Resizes the heatmap
Draw Tool button
Allows you to draw a box around an area of interest and display the
corresponding network graph (Draw Network Graph button) or the
interactions in Michigan Molecular Interactions (Mimi NetBrowser)
Clicking Draw Network Graph button
Displays the Network Graph view
Clicking Mimi NetBrowser button
Opens a new window that displays the Michigan Molecular
Interactions NetBrowser
Clicking Network View button
Displays the Network Graph view. When in the Network Graph
view, this button changes to HeatMap View which allows you to
switch between both views.
Clicking Explorer button
Brings up Concept Explorer screen (click the X in the upper right hand
corner of the Concept Explorer screen to return to the Network
Graph View)
Clicking Export Graph button
Creates a PNG file format image of the screen in a separate window
Clicking Open Gene Filter button
This function is only for the Network Graph view
BROWSING CONCEPTS
ConceptGen allows for browsing of pre-built concepts.
1. From the main search screen (click on the ConceptGen logo), type in a keyword into the search box. A
drop-down list of matching terms will appear as you type.
2. Select a term from the drop-down list or finish typing all or part of your keyword.
OR
Click on the “Click here to browse all concepts” to browse all concepts organized by concept type.
3. Click the Search Concepts button.
4. Concepts matching your search criteria display with the gene list size and number of enriched concepts
using a q-value of less than 0.5.
5. Click the drop-down arrow in the Sort By box to sort the list by Name, Gene List Size, Enrichment size,
or Concept type (Figure 7).
6. Click the down arrow
to the right of each result to export the corresponding gene list
OR
Click the right arrow
for that concept.
to the right of each result to open a new window with the source information
National Center for Integrative Biomedical Informatics: NIH Grant # U54 DA021519 01A1
Page 19
ConceptGen
7. Click on the concept name to open the Concept Explorer window specific to that concept.
FIGURE 7. BROWSING CONCEPT SEARCH RESULTS
Partial keyword search term
Result total
Sorting options
Search results list – click
on concept name to open
Concept Explorer window
National Center for Integrative Biomedical Informatics: NIH Grant # U54 DA021519 01A1
Page 20