1
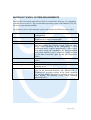
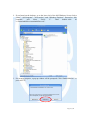
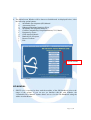
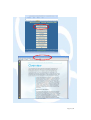
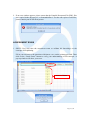
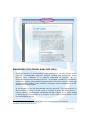
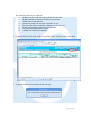
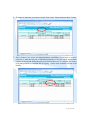
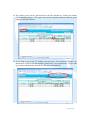
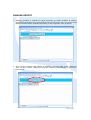
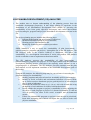
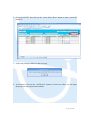
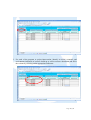
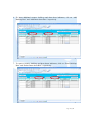
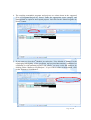
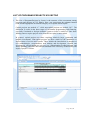
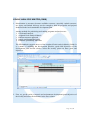
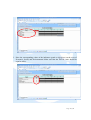
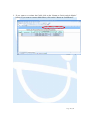
User Manual for
Sustainable
Development
Interactive Tutorial
Software
© copyright December 2008
Philippine Council for Sustainable Development
(PCSD)
TABLE OF CONTENTS
User Manual for Sustainable Development Interactive Tutorial
Software..............................................................................................................1
TABLE OF CONTENTS................................................................................................ 2
INTRODUCTION .......................................................................................................... 3
MICROSOFT EXCEL SYSTEM REQUIREMENTS ................................................... 4
MS EXCEL WORKING WINDOW .............................................................................. 5
HOW TO ACCESS THE SD-ITS: ................................................................................. 5
SD MANUAL................................................................................................................. 7
ASSESSMENT EXAM .................................................................................................. 9
ENHANCED SITUATIONAL ANALYSIS (ESA)..................................................... 11
RANKING REPORT.................................................................................................... 17
SUSTAINABLE DEVELOPMENT (SD) ANALYZER ............................................. 18
CONFLICT-COMPATIBILITY-COMPLEMENTATION (CCC) MATRIX............. 24
LIST OF PROGRAMS/PROJECTS BY SECTOR...................................................... 28
GOALS ANALYSIS MATRIX (GAM)....................................................................... 31
RANKED LIST OF PROPOSED PROJECTS FOR INVESTMENT
PROGRAMMING ........................................................................................................ 35
Page 2 of 36
INTRODUCTION
The National Economic Development Authority – Agriculture Staff with financial
assistance from Philippine Council for Sustainable Development (PCSD) has introduced
to government agencies the Handbook for Mainstreaming Sustainable Development in
Public Sector Decision Making or Sustainable Development (SD) Handbook which will
aid planners in their decisions and actions to make a development plan in a sustainable
way achieving intergenerational wellbeing or the wellbeing of all present and future
Filipinos.
In addition, this SD Interactive Tutorial Software (SD-ITS) was conceptualized as a tool
to make it easier for SD planning.
Page 3 of 36
MICROSOFT EXCEL SYSTEM REQUIREMENTS
The SD-ITS is developed using Microsoft Excel version 2003. However, it is compatible
with MS Excel version 97. The recommended operating system is MS Windows XP. The
file size is approximately 800KB.
For reference, below is the minimum system requirements for MS Excel release 2003:
Processor
Operating system
Memory
Disk space
Monitor
Disk drive
Pointing device
Note
Pentium 233 MHz or higher processor; Pentium III
recommended
Microsoft Windows 2000 Service Pack 3 or later, or
Windows XP or later (recommended)
64 MB RAM (minimum); 128 MB RAM (recommended)
245 MB, including 115 MB of available space on the hard
disk that contains the operating system. Hard-disk space
usage varies depending up the configuration. A local
installation source requires approximately 2 GB of harddisk space during the installation; the local installation
source that remains on users' computers requires as much
as 240 MB of hard-disk space beyond that required for
Office.
Super VGA (800 x 600) or higher resolution with 256
colors
CD-ROM drive
Microsoft Mouse, Microsoft IntelliMouse, or compatible
pointing device.
None of the Microsoft Office editions in the 2003 release
runs on the Microsoft Windows Me, Windows 98, or
Windows NT operating systems. If any client computers
are currently running one of these operating systems, you
must upgrade the operating system before installing
Microsoft Office.
Page 4 of 36
MS EXCEL WORKING WINDOW
Microsoft Excel working window has the same features of working windows found on
other Microsoft Office Applications such as Word and Powerpoint. Below are marked
items such as Title Bar, Menu Bar, Toolbar, Control Box, mouse pointer, etc.
Menu Bar
Menu
Options
Icon
Control Box:
(Minimize,
Restore,
Exit)
Toolbar
Vertical
Scroll Bar
Cells
Row
Heading
Horizontal
Scroll Bar
Column
Heading
Navigation
Bar
Sheet tab
Status Bar
HOW TO ACCESS THE SD-ITS:
1. On your desktop, double–click the MS Excel icon with label “Shortcut to
sustainableDevt.xls”.
Page 5 of 36
2. If not found on the desktop, go to the lower left of the MS Windows Screen. Select
“Start”, “All Programs”, “Accessories”, and “Windows Explorer”. Proceed to “My
computer”
and
select
“Drive
C”.
Then
double–click
on
“c:\SustainableDevt\sustainableDevt.xls”.
3. For security purposes, a pop-up window will be prompted. Click “Enable Macros”. or
press ALT+E.
Page 6 of 36
4. The Main Screen Window will be shown as Switchboard. As displayed below, it has
the following option buttons:
a.
Sustainable Development (SD) Manual
b. Assessment Exam
c.
Enhanced Situational Analysis (ESA)
d. Sustainable Development Analyzer
e.
Conflict-Compatibility-Complementation (CCC) Matrix
f.
Programs by Sector
g. Goals Analysis Matrix
h. Ranked List of Projects
i.
Restore Toolbars
j.
Exit
Option buttons
SD MANUAL
1. SD-ITS user is expected to have read the modules of the SD Handbook prior to the
usage of the system. If you are not yet familiar with the said modules, the
“Sustainable Devt Manual” button allows user to view the SD Handbook using the
Adobe Acrobat Reader.
Page 7 of 36
Page 8 of 36
2. If an error window appears, please ensure that the Portable Document File (PDF) files
were copied in the directory of “c:\SustainableDevt”. For the soft copies of said files,
please consult your PCSD focal person.
ASSESSMENT EXAM
1. SD-ITS User may take the assessment exam to validate his knowledge on the
concepts of SD planning.
Fill in your answers to the questions with letters a to e on the column provided. Then
click on the “Grade Exam” button to verify your understanding of SD concepts. A
pop-up window will show your score.
Answer Column
Page 9 of 36
2. Based on the grading system below, SD-ITS User may proceed to Enhanced
Situational Analysis (ESA) Module if he is already satisfied with the score.
3. If not satisfied with the score, you may review the 1st Module by selecting the “View
Module 1”. Once finish, click on the “Return to Switchboard”.
Page 10 of 36
ENHANCED SITUATIONAL ANALYSIS (ESA)
1. Situational Analysis is an assessment of the conditions of a locality and the social,
economic, environmental, physical, political, cultural and institutional factors
affecting these conditions. It is primarily undertaken to determine the key
development issues and concerns of an area – its strengths, weaknesses, opportunities
and threats – and the factors that brought about these issues and concerns. A thorough
and correct understanding of the situation is important in the formulation of an SDenhanced development plan.
In this module, we use the determinants-outcome approachi. This approach tells us
that a situation is likely to be the result or outcome of many interacting factors -social, economic, environmental, institutional and other factors. It is a useful method
of analyzing the determinants of an outcome or the result of interventions of the
previous planning period.
i
Also known as POPDEV approach (NEDA-IPDP, 1993, Training Module on the Integrated
Population and Development Planning)
Page 11 of 36
The following steps may be followed:
a.
Identify a sector or sub-sector desired outcome or result
b. Identify indicators of each sector/sub-sector outcome
c.
Obtain data of each indicator
d. Determine whether the outcome is desirable or not
e.
Find out what factors caused the situation to be the way it is
f.
Identify the population affected by the situation
g. Use projections (population or area)
h. Validate SA with local community
2. Using the SD-ITS, first click on the “Clear Entire Sheet” button to start a clean ESA.
3. A pop-up window will be shown for the next step.
Page 12 of 36
4. As instructed, click on the “Add outcome” button to insert blank outcome rows. Input
outcomes/results relative to concerned localities.
5. To enter the indicators per outcome/result, click on the “Add Indicator Row” button.
Also, for each indicator record the corresponding values/weights and its standard
reference points on the next two columns to the right.
Page 13 of 36
6. To delete an indicator per outcome/result, click on the “Delete Indicator Row” button.
7. Since resources are scarce and implementation capabilities are limited, we need to
prioritize or rank the long list of identified problems to find out which among them
ought to be dealt with during the plan period. From these two (2) columns, we need to
record the problems or strength and its urgency / extent as the common concern of the
locality.
Page 14 of 36
8. A determinant is a factor influencing or causing an outcome. There are two types of
determinants – proximateii and underlyingiii.
9. Specify population groups, by age and sex or specific areas as they will be affected by
the problem situation.
ii
iii
A proximate determinant affects an outcome directly.
An underlying determinant affects an outcome indirectly by directly affecting the proximate determinant
Page 15 of 36
10. The ranking report can be generated from the ESA Module by clicking the button
“Show Ranking Report”. The report will sort the identified problems with the given
values on the rank column.
11. If you want to review the 2nd Module, just select the “View Module 2” button. For
instructions on how to use this module, click on the “View Instructions”. If you want
to go back to Main Menu, click on the “Return to Switchboard”.
Page 16 of 36
RANKING REPORT
1. Ranking problems is intended to guide decisions on which problems to address
immediately and which ones to put on hold. Here SD-ITS user may view Sectoral and
Multisectoral Problems identified depending on the magnitude of the problems.
2. If you want to improve the ranking of problems, you may click on the “Return to
ESA” for the revisions. Otherwise, select the “Return to Switchboard” to proceed to
next module.
Page 17 of 36
SUSTAINABLE DEVELOPMENT (SD) ANALYZER
1. The module aims to deepen understanding of the planning process from the
sustainable development perspective. It also allows gaining of experience in the
formulation of an SD-enhanced Development Plan (SDDP) by assessing the
sustainability of its vision, goals, objectives and targets, and various interventions
(policies,strategies, programs and projects) that address development concerns in the
SA.
The project planning process includes the following steps:
a.
Problem identification and specification of objectives;
b. Identification and designing of project activities;
c.
Planning project implementation; and
d. Identifying monitoring and evaluation procedures.
SDDP introduces a way to assess the sustainability of plan interventions –
policies/strategies, programs and projects – through the use of the SD Analyzer. The
SD Analyzer looks at the resource build-up or drawdown, and hence, the
sustainability of a development intervention to assist policymakers and planners
decide on whether or not to implement such an intervention.
The SD Analyzer assesses the sustainability of plan interventions –
policies/strategies, programs and projects. It is an improvement from the traditional
development planning process, which does not explicitly assess whether or not a
program/project is sustainable. The SD Analyzer provides assurance that the plan
interventions we will implement contribute to the sustainable development goals of
the locality.
Using the SD Analyzer, the following steps may be your reference in assessing the
programs and projects sustainability:
a.
Identify programs and projects based on sustainable policies and strategies.
b. Identify its social, economic and environment indicators of resource buildup as well as resource drawdown (project goals/objectives or effects/impact
may be used as indicators).
c.
Determine the numerical values (e.g.,1-10 or 1-100 with 10 and 100 being
the highest) of each indicator of resource build-up/drawdown.
d. Decide whether the program or project is sustainable or not by adjusting the
net effect of each program or project. It is deemed sustainable if it has an
over all positive net effect in the social, economic and environmental
sectors.
e.
If there are unsustainable programs or projects which need to be prioritized,
input some mitigating interventions and adjust the net effect to make said
projects sustainable.
Page 18 of 36
2. Using the SD-ITS, first click on the “Clear Entire Sheet” button to start a clean SD
Analyzer.
3. Follow the prompt window for the next step.
4. As instructed, click on the “Add Project” button to insert rows where you can input
the programs and projects/interventions.
Page 19 of 36
5. For each of the program or project/intervention, identify its social, economic and
environment indicators of resource build-up as well as resource drawdown and fill in
the column by selecting on the appropriate indicators.
Page 20 of 36
6. To insert additional resource build-up and draw-down indicators, click on “Add
Build-up Row” and “Add Draw-down Row” respectively.
7. To remove resource build-up and draw-down indicators, click on “Delete Build-up
Row” and “Delete Draw-down Row” respectively.
Page 21 of 36
8. For each build-up and draw-down indicator, determine the numerical value such as
1-10 or 1-100% with 10 and 100 being the highest. The Net Effect of each program or
project is computed by deducting the value for resource drawdown from the value of
resource build-up in each of the dimensions (social-economic-environmental).
9. The Net Effect of each program or project is computed by deducting the value for
resource drawdown from the value of resource build-up in each of the dimensions
(social-economic-environmental).
Page 22 of 36
10. If there are unsustainable programs and projects/interventions which need to be
prioritized, input some mitigating interventions and adjust the numerical values of the
resource build-up and resource draw-down so that the net effect will be recomputed
to make said projects sustainable.
11. From this module, the Conflict-Compatibility-Complementation (CCC) Matrix can be
generated by clicking on the “View CCC” button. The programs and
projects/interventions are further assessed to see whether they are compatible,
conflicting or complementary.
Page 23 of 36
12. If you want to review the 3rd Module, just select the “View Module 3” button. For
instructions on how to use this module, click on the “View Instructions”. If you want
to go back to Main Menu, click on the “Return to Switchboard”.
CONFLICT-COMPATIBILITY-COMPLEMENTATION (CCC)
MATRIX
1. In the suggested Conflict-Compatibility-Complementation (CCC) Matrix, the projects
that are conflicting are marked ‘X’. Complementary projects are marked ‘O’ while
compatible projects are marked ‘N’.
Projects that are not in harmony with many or most of the other projects are taken out
of the master list. Those that clash with some projects but are compatible or
complementary with others may be redesigned to remove conflicting project
components. Complementary projects may be repackaged, if needed. Repackaging
projects means that two or more complementary projects may be integrated into one
proposal. This applies especially for multidisciplinary and multi-sectoral projects
(e.g., projects on poverty alleviation, minimum basic needs, or ecological security).
Conflicting projects have expected benefits that tend to nullify the gains of others or
the implementation of which obstructs the execution of another.
Page 24 of 36
Complementary projects are those whose activities, components or objectives
mutually support each other.
Compatible projects are neutral, neither conflicting with nor complementing each
other. These can be implemented without affecting the costs or benefits of the
other projects.
2. SD-ITS User must select the suitable value in comparing, consolidating, integrating
and repackaging the programs and projects/interventions.
Page 25 of 36
3. Select the suitable sector to which the programs and projects/interventions may be
characterized. Then, generate the CCC Matrix Summary to view by group the
programs and projects/interventions.
Page 26 of 36
4. The resulting sustainable programs and projects are written down in the suggested
“List of Programs/Projects by Sector” under the appropriate sector category and
distinguished as capital or non-capital projects. Just click on the “Show Programs by
Sector” button.
5. If you want to review the 4th Module, just select the “View Module 4” button. For the
repackaging/redesigning of the programs and projects/interventions established as
conflicting or with potential negative side effects, you may revisit SD Analyzer by
clicking on the “Return to SD Analyzer”. If you want to return to Main Menu, click
on the “Return to Switchboard”.
Page 27 of 36
LIST OF PROGRAMS/PROJECTS BY SECTOR
1. The List of Programs/Projects by Sector is the outcome of the assessment among
programs and projects in CCC Matrix. Here, user must input the estimated annual
costs and the appropriate investment category as to capital or non-capital.
Capital projects are marked “C” while non-capital projects are marked “NC”. The
distinction is useful in the latter stages of investment programming and financing,
especially if national or foreign assistance (grant or loan) is availed of, since these
funding sources require projects to be classified as capital or non-capital.
In general, capital projects are those requiring relatively large, permanent and
tangible investments. Non-capital projects are those related to the installation or
improvement of services and systems. These include the introduction or adoption of
new methodologies, reorganization, staff training and development, research and
development, various health care services (e.g., immunization, feeding program, and
family planning) and other interventions that add to the efficiency of the locality and
improve people’s welfare.
Page 28 of 36
2. The user must input the estimated annual costs of each program and
project/intervention.
3. Categorize the program and project/intervention as to capital or non-capital
investment.
Page 29 of 36
4. The new master list is now ready for Stage 3 of the investment programming process,
i.e., prioritizing and ranking programs and projects using the weighted Generate the
Goals Analysis Matrix (GAM). Click on the “Generate GAM” button to process the
matrix.
5. If you wan to modify the CCC Matrix because of certain program and
projects/intervention, click on the “Return to CCC Matrix”. If you want to return to
Main Menu, click on the “Return to Switchboard”.
Page 30 of 36
GOALS ANALYSIS MATRIX (GAM)
1. Prioritization is necessary because available resources, especially capital resources,
are scarce and limited and may not be enough to fund all programs and projects
identified in the local sustainable development plan.
Among methods for prioritizing and ranking programs and projects are:
9 Cost-benefit analysis
9 weighted Goals Analysis Matrix
9 Problem structure approach
9 Supply and demand projection
9 Economic profitability indicators
The SD handbook suggests the use of the weighted Goals Analysis Matrix (GAM). It
is a means of validating the development priorities (goals and objectives) of the
development plan and the relative values the locality places on these goals and
objectives.
2. First, we get the social, economic and environment development goals/objectives of
the locality and select the indicators in the first column.
Page 31 of 36
3. Place the corresponding values of the indicators (goals or objectives) on the rows of
Economic, Social, and Environmental. Make sure that the TOTAL value should be
equal to 100%.
Page 32 of 36
4. Input the values of the indicators (goals or objectives) on the columns of the programs
and projects/interventions.
5. To insert more rows for the indicators, click on the “Add Indicator Row”.
Page 33 of 36
6. Select on “Show Ranked List of Projects” button, to view the new list of sustainable
programs and projects/interventions. On this list are programs and
projects/interventions sorted according to the Total Weighted Score.
7. If you want to modify the programs by sector, click on the “Return to Programs by
Sector”. If you want to return to Main Menu, click on the “Return to Switchboard”.
Page 34 of 36
RANKED LIST OF PROPOSED PROJECTS FOR INVESTMENT
PROGRAMMING
1. The projects are ranked according to their total scores from the GAM. The highest
score is ranked number one, the next highest, number two and so on. This ranking
represents the collective evaluation of the proposed project by the locality’s various
sector planners. The ranked list of projects is transferred to the final list of programs
and projects/interventions as “Ranked List of Proposed Projects for Investment
Programming”. This now becomes the final investment plan of the locality which will
be programmed for budgeting.
The values on the columns of Cost Estimates and the Capital or Non-Capital
originated from the table of “List of Programs/Projects by Sector”.
Page 35 of 36
2. If you want to re-evaluate the GAM, click on the “Return to Goals Analysis Matrix”
button. If you want to return to Main Menu, click on the “Return to Switchboard”.
Page 36 of 36