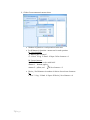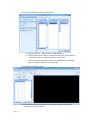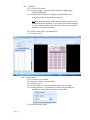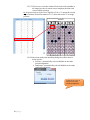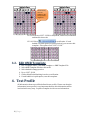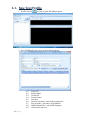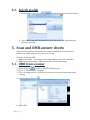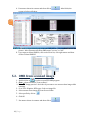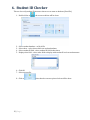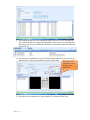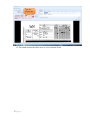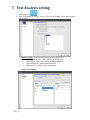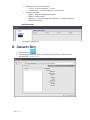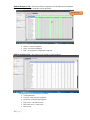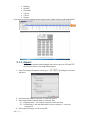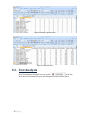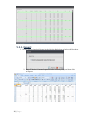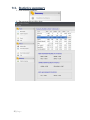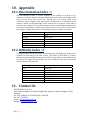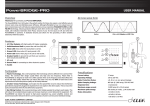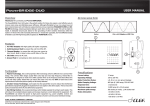
1
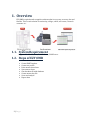
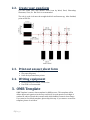
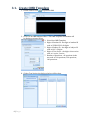
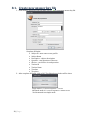
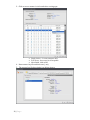
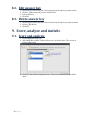
USER MANUAL Ezy OMR Contents 1. Overview .................................................................................................................................................... 3 1.1. System Requirement ...................................................................................................................... 3 1.2. Steps of EZY OMR ............................................................................................................................ 3 2. Create answer sheet form .................................................................................................................. 4 2.1. Use default form ............................................................................................................................... 4 2.2. Create your own form .................................................................................................................... 5 2.3. Print out answer sheet form ....................................................................................................... 5 2.4. Writing equipment .......................................................................................................................... 5 3. OMR Template ......................................................................................................................................... 5 3.1. Create OMR Template .................................................................................................................... 6 3.2. Edit OMR Template ....................................................................................................................... 11 4. Test Profile .............................................................................................................................................. 11 4.1. New Test Profile ............................................................................................................................. 12 4.2. Search profile .................................................................................................................................. 13 5. Scan and OMR answer sheets ......................................................................................................... 13 5.1. OMR from scanner ........................................................................................................................ 13 5.2. OMR from scanned image .......................................................................................................... 14 6. Student ID Checker .............................................................................................................................. 15 7. Test Analysis setting ........................................................................................................................... 18 8. Answer Key ............................................................................................................................................. 19 8.1. Create new answer key file ....................................................................................................... 20 8.2. Edit answer key .............................................................................................................................. 22 8.3. Delete answer key ......................................................................................................................... 22 9. Score, analyze and statistic .............................................................................................................. 22 9.1. Score and analysis ......................................................................................................................... 22 9.1.1. Export .................................................................................................................................... 24 9.2. Test Analysis .................................................................................................................................... 25 9.2.1. Export .................................................................................................................................... 26 9.3. Statistics summary ........................................................................................................................ 27 10. Appendix .................................................................................................................................................. 28 10.1. Discrimination Index : r .......................................................................................................... 28 10.2. Difficulty Index : P ..................................................................................................................... 28 11. Contact Us ................................................................................................................................................ 28 2 | P a g e 1. Overview EZY OMR is optical mark recognition software that is very easy, accuracy, fast and flexible. This is total solution for university, college, school, test center, research company, etc. 1.1. System Requirement Support OS – Win XP, Vista, 7, 2003 Server, 2008 Server. 1.2. Steps of EZY OMR • • • • • • • • • 3 | P a g e Create answer sheet form. Create OMR Template. Create test profile. Print answer sheet form. Scan answer sheet. Check student ID with database. Create answer key file. Score and analyze. Export data. 2. Create answer sheet form 2.1. Use default form A4 , 120 questions, simplex A5, 140 questions, duplex 4 | P a g e 2.2. Create your own form You can create your own answer sheet form by Word, Excel, Photoshop, Illustrator, Visio, etc. But Visio is recommended. The rule is each circle must be straight both left and bottom tag. After finished, print as PDF file. 2.3. Print out answer sheet form • • • Open answer sheet file (PDF File). Use paper 80 grams. Print out by normal laser printer. 2.4. Writing equipment • • Both pen and pencil which is dark color. Pencil 2B is recommended. 3. OMR Template OMR Template is answer sheet template for OMR process. This template will be define about total questions in the test, total choice in each question, each digit of student ID, subject ID and choice match with which bubble in answer sheet image. If you want to use default template, please skip this step. If you want to create new template, please do as follow. 5 | P a g e 3.1. Create OMR Template 1. Double clicks at icon to open EZY OMR. 2. Go to File Æ OMR template editor. The OMR Template Information will be display as picture below: 3. Select New OMR Template 4. Digits of Student ID – the digits of student ID such as 3502613213=10 digits. 5. Digits of Subject ID – the digits of subject ID such as 001 = 3 digits. 6. Digits of Test Series – the digits of test series such as 1 series, 2 series. 7. Number of Questions – all questions in the test such as 100 questions, 120 questions, 140 questions. 8. Click at Test Setting, the dialog as below will be show. 6 | P a g e 9. Click at Create automatic answer sheet • • • 7 | P a g e Number of Questions – total questions in the test. Set Of Answer/ Question – answer set for each question Ex. 1 set of answer Q – What is part of house? A – 1. Roof 2. Leg 3. Hand 4. Paper Æ Set of answer = 1 Ex. 2 sets of answer Q – Match the correct color with fruit? Answer 1 – banana, apple Answer 2 – yellow, red Æ Set of answer = 2 Choice / Set Of Answer is number of choices for each set of answer Ex. 1. Roof 2. Leg 3. Hand 4. Paper Æ Choice / Set of Answer = 4 10. Click OK, the dialog as below will be show: Add question No. – add question in OMR template. Click at question No. that you want in the left pane Æ click Add set of answer in order to add set of answer as you want. • Click set of answer that you want in the middle pane Æ click Add Choice in order to add choice as you want. 11. Click OK, the dialog as below: • • 12. Scan answer sheet into program, you can import answer sheet image “From file” or “From scanner” 8 | P a g e 12.1. From file 12.1.1. Click at “From file”. 12.1.2. Source Image – select the answer sheet file’s path (image should be BMP file). 12.1.3. Mark point threshold – set darkness (%) of bubbles that program can detect (the student response). Ex. Mark point threshold is 40% means program can detect the bubbles which are darkness >= 40%, these are student response. For others that less than 40% will not be detect, these are blank bubble or not student response. 12.1.4. Min = 20% (50% is recommended) 12.1.5. Click at “Save”. 12.2. From scanner 12.2.1. Click at “From scanner” 12.2.2. Source scanner – select scanner 12.2.3. Click at scan 12.2.4. If the image is correct, clear and straight, click at Apply 12.2.5. Image preview – select default in order to automatically set position for each bubble, just click at each bubble. 12.2.6. Select Student ID tab 9 | P a g e 12.2.7. Click at one row in the student ID tab, then click at bubble in the image in order to match correct template position with correct bubble position. Ex. As picture below, click at row “Digit No.=2, No. = 0” means the second digit of student ID and first numeric is “0”, then click at the “0” in image preview. 12.2.8. After that mark point matching dialog box will be show as below picture. • Portrait – automatically select all bubbles in the same portrait alignment. • Landscape – automatically select all bubbles in the same Landscape alignment. 10 | P a g e Automatically select all bubbles in the same Landscape alignment Automatically select all bubbles in the same portrait alignment 12.2.9. Do as step 12.2.7‐12.2.8 for Subject ID, Test Series, Student ID and Answer sheet tab. to verification. If each 12.2.10. Click at bubble is in pink square (as picture below), you can save this template. If not, please redo 12.2.7‐12.2.8. 3.2. Edit OMR Template 1. 2. 3. 4. 5. 6. File‐>Template Editor‐>Edit OMR Template ‐> OMR Template File. Select OMR Template file then click at OK. Select default in Image preview. Do as 12.2.7‐12.2.8 Click at Mark Point Matching in order to verification. If each bubble is in pink square, save this template. 4. Test Profile All information about test will be defined in test profile. Please note that the information in test profile is very important because this information will be involved with every step. So please complete it with correct information. 11 | P a g e 4.1. New Test Profile 1. Double clicks at in order to open EZY OMR program. 2. Go to FileÆProfile, the screen as below will be shown. 2.1. 2.2. 2.3. 2.4. 2.5. 2.6. 2.7. 2.8. 2.9. 12 | P a g e Subject ID Subject Name Teacher ID Teacher Name Test Date Amount of student – total student in that test. Save in Folder – the path to save OMR file. OMR Template File – select OMR Template. Click at save and close. 4.2. Search profile 1. From profile screen, click at , the dialog box as below will be shown. 2. Select field from profile drop down list, enter keyword in the right blank, and then click at Search. 5. Scan and OMR answer sheets After finish test, all answer sheets must be scanned and OMR to check that which bubbles are student response (not correct or wrong). There are 2 ways for OMR; 1. OMR From scanner – scan answer sheets while OMR process in the same time. 2. OMR From scanned image – OMR from scanned answer sheet image. 5.1. OMR from scanner 1. Double clicks at in order to open EZY OMR program. 2. Tick Din “From scanner” check box. 3. Tick Din “Image preview” check box if you want to see answer sheet image while scanning. 4. Select profile by click at 5. Click at OK. 13 | P a g e . . After finish, the 6. Put answer sheets in scanner and then click at screen as below will show. 1 7. The answer sheets that already scan and OMR will be in No.1 in the above picture. After file name will show OMR status “success” or “fail”. 8. If you want to delete OMR file, click at the file in list, click right mouse and then click at “Delete OMR file” 5.2. OMR from scanned image 1. Double clicks at in order to open EZY OMR program. 2. Clear D from check box “From scanner”. 9. Tick Din “Image preview” check box if you want to see answer sheet image while scanning. 3. Go to Tool Æ Option ÆFile type. Select as image file. 4. Select answer sheet image file from Source folder. 5. Select profile by click at 6. Click OK 7. Put answer sheets in scanner and then click at 14 | P a g e . 6. Student ID Checker This use for verify student ID in answer sheets are as same as database (Excel file). 1. Double clicks at 2. 3. 4. 5. , the screen as below will be show. Select student database – as Excel file. Select sheet – select sheet which are student database. Select student ID field – select student ID field in that sheet. Display other field – select other field to display with student ID such as student name. 6. Click OK. 7. Select test profile. 8. Click at 15 | P a g e , after that the screen as picture below will be show. 9. The student ID that are correct matching will be show in Correct checking tab. The student ID that are wrong matching will be show in Incorrect checking tab, these may caused by no student ID in database, incomplete student ID, duplicate student ID, etc. 10. For the incorrect student ID, you can edit them by double clicks at each row (as above picture). The screen as below picture will be show. Type keyword in the blank to search for the correct student ID 11. Type the correct student ID in “New student ID” and then click at Save. 16 | P a g e Type the correct one 12. The edited student ID will be move to correct student ID tab. 17 | P a g e 7. Test Analysis setting 1. Double clicks at 2. From Test analytic & statistic screen. Go to ToolÆ Setting. The screen as below will be show. Import setting‐ for import student information (Excel file). • Import student data – select student database’s path. • Select sheet – select sheet which is student database. • Select student ID – select student ID field. • Map data field – display other information. Scale score setting Math Science Geographic 18 | P a g e • • Define score for correct response. o 1 score ‐ 1 correct response = 1 score. o Custom score ‐ 1 correct response = custom score. Learning objective o Import – import learning objective list. o Subject – subject name. o Objective – 1 question supports 5 objectives. 1 subject supports unlimited objective. Analysis setting Set upper‐lower group. 8. Answer Key 1. Double clicks at 2. Test analytic & statistic screen. Go to File Æ New Æ Project. The screen as below picture. จะไดหนาจอตามภาพ 19 | P a g e 8.1. Create new answer key file 1. Click at Select answer key tab and then click at to create new answer key file. Parabola Complete all blanks. • Subject ID – must same as test profile. • Subject Name • Description – subject description. • Question – total questions in the test. • Choices – total choice in each question. • Teacher ID • Teacher Name • Test date • Test place 2. After complete all blanks, click at OK. The dialog box as below will be show. Single mode is 1 correct response = 1 score Advanced mode is 1 correct response = custom score *In this manual use simple mode. 20 | P a g e 3. Click at correct answer in circle and select scoring type. • Single choice – 1 correct answer only. • Free Score – free score for all response. • After finish, click at OK. 4. Name answer key file and then save (*.azt) 5. The answer key file description is as below picture. 21 | P a g e 8.2. Edit answer key 1. 2. 3. 4. Click at Select answer key tab. Select answer key file which you want to edit. Click at , the answer key screen will be show. Edit answer key. Click OK. 8.3. Delete answer key 1. Click at Select answer key tab. Select answer key file which you want to delete. 2. Click at to delete. 3. Click OK. 9. Score, analyze and statistic 9.1. Score and analysis 1. Click at OMR directory tab. 2. Select OMR file at folder “subject ID\success” in the left pane. The screen as below will be show. 3. Click OK. After finish analyzed process. The screen as below picture will be show. 22 | P a g e Student Response Tab – this report shows response of each student, total students that are correct/ incorrect response in each question. Answer key • • • • The top row is answer key of each question. Green – correct response. Gray – incorrect response. Red – no response or duplicate response. Student Statistics Tab – this shows score statistic of each student. This provides score and statistic as follow; • Total questions • Correct – total correct response. • Incorrect – total wrong response. • Free score – total free score. • Full scale score – total score. • Raw score. 23 | P a g e • Ranking. • Quartile. • Percentile. • Z‐Score. • T‐Score. • Stannie. If you want to preview student answer sheet image, double clicks at each student field. 9.1.1. Export The student response and evaluated data can be export to .CSV and .TXT file format in order to use with SPSS program. 1. From Test analytic & statistic screen, go to will show. , the dialog box as below 2. Select data tab; Student response or Student Statistics 3. Select export data; response data or evaluated data. 3.1. Response data – the student response in each question. 3.2. Evaluate data – the data shows that correct response = 1, incorrect response =0 4. Select export file type; csv file or text file 24 | P a g e Export student response data Export evaluated data 9.2. Test Analysis From Test Analysis & Statistic screen, click at in the left, then click at Test Analysis Report, the dialog box as below will be show. 25 | P a g e 9.2.1. Export 1. Click at Export Analysis Report in the left, the dialog box as below will be show. 2. Mark 5 before “Comma Separated value format (.CSV) and then click at Export. 26 | P a g e 9.3. Statistics summary 1. Click at Statistic Summary. 2. The screen as below will be show. 27 | P a g e 10. Appendix 10.1. Discrimination Index : r The discrimination index is a basic measure of the validity of an item. It is a measure of an item's ability to discriminate between those who scored high on the total test and those who scored low. Though there are several steps in its calculation, once computed, this index can be interpreted as an indication of the extent to which overall knowledge of the content area or mastery of the skills is related to the response on an item. Perhaps the most crucial validity standard for a test item is that whether a student got an item correct or not is due to their level of knowledge or ability and not due to something else such as chance or test bias. Discrimination ( R ) 1 0.8‐0.99 0.6‐0.79 0.4‐0.59 0.2‐0.39 >0.19 Meaning Best Very Good Good Moderate Low No 10.2. Difficulty Index : P Teachers produce a difficulty index for a test item by calculating the proportion of students in class who got an item correct. (The name of this index is counter‐ intuitive, as one actually gets a measure of how easy the item is, not the difficulty of the item.) The larger the proportion, the more students who have learned the content measured by the item. Difficult (p) Meaning 0.8‐1 0.6‐1.8 0.5‐1.6 0.5 0.4‐0.49 0.2‐0.39 0‐0.19 Very easy easy Nearly Easy Moderate Nearly difficult Difficult Too difficult 11. Contact Us WAC RESEARCH CO.,LTD. 9 Soi Ladpraowanghin 33, Ladpraowanghin Rd., Ladprao, Ladprao, Bangkok, 10230, Thailand Tel : 66 2 5303809, 66 2 5381038, 66 2 5399352 Fax : 66 2 538 3098 E‐mail : [email protected] Website : www.wacinfotech.com 28 | P a g e