1
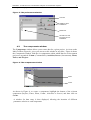
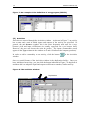
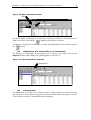
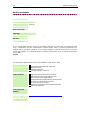
Module 019 WinDASI: A Software for Cost-Benefit Analysis of Investment Projects Inserting and Managing Data WinDASI: A Software for Cost-Benefit Analysis of Investment Projects Inserting and Managing Data by Lorenzo Giovanni Bellù, Agricultural Policy Support Service, Policy Assistance Division, Food and Agriculture Organization of the United Nations, FAO, Rome, Italy for the Food and Agriculture Organization of the United Nations, FAO About EASYPol EASYPol is a an on-line, interactive multilingual repository of downloadable resource materials for capacity development in policy making for food, agriculture and rural development. The EASYPol home page is available at: www.fao.org/tc/easypol. EASYPol has been developed and is maintained by the Agricultural Policy Support Service, FAO. The designations employed and the presentation of the material in this information product do not imply the expression of any opinion whatsoever on the part of the Food and Agriculture Organization of the United Nations concerning the legal status of any country, territory, city or area or of its authorities, or concerning the delimitation of its frontiers or boundaries. © FAO November 2005: All rights reserved. Reproduction and dissemination of material contained on FAO's Web site for educational or other non-commercial purposes are authorized without any prior written permission from the copyright holders provided the source is fully acknowledged. Reproduction of material for resale or other commercial purposes is prohibited without the written permission of the copyright holders. Applications for such permission should be addressed to: [email protected]. Acknowledgements This module draws upon the TCAS publication: WinDASI User Manual, Training Materials for Agricultural Planning, 43 FAO - Rome 2000, whose main contributors are Carlo Cappi, who is also the main designer of the computer software, and Lorenzo Giovanni Bellù. The author would like to acknowledge with thanks the contribution of Francesca Petrina, who volunteered for reviewing the first draft of this module and to all the others who contributed in different ways to this final version. The WinDASI software was developed by Laurent Cazalet and Gilles Cappella under the supervision of Mahmoud Allaya at the “Institut Agonomique Méditerraneén de Montpellier (IAMM)-France. WinDASI: A Software for Cost-Benefit Analysis of Investment Projects Inserting and Managing Data Table of contents 1 Summary ......................................................................................1 2 Introduction ...................................................................................1 3 The structure of the data .................................................................2 3.1 The components ............................................................................. 2 3.2 The “Without project” facility OF WinDASI........................................... 5 4 Inserting, editing and printing project datA.........................................6 4.1 The main toolbar............................................................................. 6 4.2 Definitions of the units used in the project .......................................... 6 4.3 The components window .................................................................. 7 5 Editing and printing data................................................................ 14 5.1 To view a component on the screen ................................................. 14 5.2 To edit, modify or remove a component ........................................... 14 5.3 Duplication of a commodity or an investment .................................... 15 5.4 Printing data................................................................................. 15 6 Project data management .............................................................. 16 6.1 file Saving project data in a data file and loading project data from a data .................................................................................................. 16 6.2 The use of WinDASI in conjunction with a spreadsheet ....................... 16 6.3 Quitting WinDASI .......................................................................... 16 7 Readers’ notes ............................................................................. 16 7.1 EASYPol links................................................................................ 17 Module metadata.............................................................................. 18 WinDASI: A Software for Cost-Benefit Analysis of Investment Projects Inserting and Managing Data 1 1 SUMMARY This module explains how data should be organized and entered into the WinDASI software to run Cost-Benefit Analysis (CBA) of investment projects. In particular, as regard as data entry, it illustrates how the “components” window works. After, it shows the facilities the program has to check for mistakes, such as data omitted or entered incorrectly. In the last part of this module, it is explained how to manage project data, such as saving and loading project data. 2 INTRODUCTION Objectives This module aims at driving the user to organize data for Cost-Benefit Analysis (CBA) of investment projects and to load them into WinDASI and to manage them (e.g. saving printing, changing deleting data). In particular, as regard as data entry, it exemplifies how the components window works. Then it shows how to check for mistakes, such as data omitted or entered incorrectly. Target audience This module targets current or future practitioners in Cost-Benefit Analysis (CBA) of investment projects, working in public administrations, in NGO’s, professional organizations or consulting firms. Also academics can find this material useful to support their courses in CBA and development economics. Furthermore, students can use this material to improve their skills in CBA and complement their curricula. Required background To fully understand the content of this module the user must be familiar with: a) Concepts of project cycle management; b) Concepts of project financial analysis; and c) Concept of project economic analysis. Selected EASYPol modules can be used to strengthen users’ background and to further expand their knowledge about investment projects and cost-benefit analysis. Links with relevant EASYPol modules, further readings and references are reported both in the text and in the last section of the module1. 1 EASYPol hyperlinks are shown in blue, as follows: a) training paths are shown in underlined bold font; b) other EASYPol modules or complementary EASYPol materials are in bold underlined italics; c) links to the glossary are in bold; and d) external links are in italics. 2 EASYPol Module 019 Analytical Tools 3 THE STRUCTURE OF THE DATA 3.1 The components To run a Cost-Benefit analysis of an investment project in WinDASI, the user has to start by defining the basic elements of the project i.e. inputs and outputs, called “commodities” in WinDASI. Then he/she has to combine them to create more complex project elements (e.g. project activities), that in turn may be combined to build more and more complex elements (e.g. project components, project geographical zones, groups of stakeholders etc). In fact, the WinDASI approach is to go from simple to complex2 element, in figure 1 and explained in the following paragraphs. (i) Commodities The basic elements in WinDASI are inputs and outputs, which in the WinDASI terminology are called “commodities”. For example, in an agricultural project, they may be seeds, hay, fertilizers, wheat, milk etc. In WinDASI each commodity is defined by: a code (max 11 characters, e.g. WHEAT, STRAW, SEEDS, MILK, HAY) a unit of measure (e.g. TONS, KILOS, LITRES) a unit price, which may be constant or variable over the time span of the project. For instance, assume that the project under investigation includes the production of wheat. The analyst has to first list all inputs and outputs of wheat production, then to choose a suitable code and unit of measure for each of them, and finally to figure out their unit prices. Commodities are inserted in WinDASI by following the procedures illustrated in section 4 below. (ii) Activities Inputs and outputs (commodities) are basic elements that, appropriately combined, are used to model project activities. For an agricultural project, an activity may be, for example, wheat production. An “activity” is defined by: 2 a code (max 11 characters, e.g. WHEAT-PROD, COWS-MILK) a unit of measure (e.g. HECTARE, HEAD) Note that when a project is conceived and formulated, the formulation team usually starts by defining the objectives of the project, then production plans, activities, outputs and inputs, following a path “from general to particular”. When making a model of a project for CBA in WinDASI this path is reversed; the analyst first inserts data on inputs and outputs, then activities, production plans, until the model of the whole project is completed. WinDASI: A Software for Cost-Benefit Analysis of Investment Projects Inserting and Managing Data 3 a set of inputs, each of them specified as a physical quantity per unit of activity, for each year3 of the project (e.g.: kilograms of seeds per hectare of wheat production per year; tons of hay per head of cow per year) a set of outputs, specified as above. For example, to model a wheat production activity, the project analyst has to choose a suitable code (e.g. WHEAT-PROD), a unit for the activity (e.g. hectare), specify the quantities of inputs/outputs in physical terms per hectare to be used/obtained on one hectare in each period of the project.4 Activities are inserted in WinDASI, by following the procedure illustrated in section 4 below. Figure 1: Hierarchy of the WinDASI components Commodities Investments Activities Plans Zones Projects (iii) Investments Besides inputs and outputs, other basic elements are “investments”. These are a specific category of project costs. For an agricultural project an investment could be a tractor. An investment, in WinDASI is essentially defined by: a code (max 11 characters, e.g. TRACTOR, IRRIGATION) a unit price (that may vary over the project span) 3 The unit of time is usually the year. However it is up to the user to choose it, i.e semester, quarter, month, etc. There is also the possibility of combyning different units of time in the same project. For example, one may choose to use the year as unit of time for his project and at the same time use monthly water inputs. In this case he will specify twelve water inputs (water1, water2, ....) one for each month, rather than a single water input item for the whole year. 4 Note that the same commodity (let’s say, hay) may enter two or more different activities (e.g., milk production, goat breeding and so on) without any need to duplicate the insertion of the commodity in WinDASI. 4 EASYPol Module 019 Analytical Tools the duration of the economic life, expressed in number of years a set of other parameters (e.g. maintenance costs, residual value etc.) For example, if a tractor is needed for the wheat production activity, the analyst has to choose a suitable code for this investment (e.g. TRACTOR), estimate its useful economic life, (say, five years), its price, and its maintenance costs, if any. Investments are inserted in WinDASI by following the procedures illustrated in section 4 below. (iv) Plans Basic elements such as commodities and investments and more complex elements such as activities can be combined to create plans. For an agricultural project, a plan may be a farm model. In WinDASI a plan is defined as: a code (max 11 characters, e.g. UPLAND-FARM) a unit of measure (e.g. one farm) a set of activities, each of them specified as quantity of activity units per period, for each period of the project (e.g.: number of hectares of wheat, number of cows) a set of commodities, specified as physical units per each period of the project span. a set of investments, defined as physical units of capital goods purchased in each period of the project span. For example, the plan “UPLAND-FARM” may include one or more activities (e.g., wheat production, milk production and so on) one or more commodities (e.g. power, gasoline etc.) and one or more investment (for instance, a tractor, a pump and so on)5. 5 Note that the same activity (e.g. wheat production) or the same investment (e.g. tractor) may enter two or more different plans (e.g. upland farm and lowland farm) without any need to duplicate the insertion of the activity or the investment in WinDASI. WinDASI: A Software for Cost-Benefit Analysis of Investment Projects Inserting and Managing Data 5 (v) Zones Following the same logic illustrated to create plans; plans and investments can be combined to create more complex aggregates, called “zones”. For an agricultural project, a zone may be, for example, a geographical zone of the project. In WinDASI a zone is defined as: a code (max 11 characters, e.g. UPLAND-AREA) a unit of measure (e.g. one zone) a set of plans, each of them specified as a quantity of plans per period, for each period of the project (e.g.: number of upland farms) a set of investments, defined as number of investment goods required in each period of the project span For example, a zone in an agricultural project may be, for example, a specific watershed, an upland area, etc. (vi) Project The overall project results from a combination of zones and investments. In WinDASI, a project is defined by: a code (max 11 characters, e.g. IMPROVED-AGRI) the project length (e.g. in years) a set of zones, each of them specified as a quantity of zones per period, for each period of the project (e.g. number upland areas) a set of investments, defined as number of investment goods required in each period of the project span An agricultural project may be a combination of different zones plus some investments required at project level, for example, cars, computers and so on. The data set of the project is organized according to the schematic layout shown in Figure 1, above. 3.2 The “Without project” facility OF WinDASI To analyze the viability of a project, the analyst usually looks at the incremental Net Benefits of the project, calculated with respect to the “without project situation” (WoP), i.e. the situation most likely to occur if the project is not implemented. Whenever the WoP is assumed to be constant for all the estimated time span of the project, the project analyst may use the WoP column, present in every data entry window, for inserting data like commodities, activities, plans etc. WinDASI will 6 EASYPol Module 019 Analytical Tools automatically provide the incremental Net Benefits and related indicators once the calculations are performed. In case the WoP situation cannot be assumed constant, the WoP facility of WinDASI cannot be used. Nevertheless, WinDASI allows easy calculations of incremental benefits by modeling the WoP situation year by year. 4 INSERTING, EDITING AND PRINTING PROJECT DATA 4.1 The main toolbar The Main Toolbar of the WinDASI software is shown in Figure 2. It provides access to the most common operations that you will need. Firstly, through the Main Toolbar Menu, you must select the language in which you want to work (French or English), by selecting: File, Language. Secondly, if you have a data set related to a project, you must open the related data file by selecting: File, Open. You will notice that the WinDASI data files have the extension .WDS. If you wish to introduce the data of a new project, you must first select File, New; you will then create the various Components (i.e., Commodity, Investment, Activity, Plan, Zone or Project) and finally, you will execute the relevant calculations. Figure 2: The Main Toolbar All icons that enable you to carry out operations are equipped with textual aid. When you point to an icon on a button, its name and function are displayed as a Tool Tip, and the same information is also displayed in the Status Bar, located at the bottom of the main window. All operations may be executed either by using your mouse or by using the keyboard directly. 4.2 Definitions of the units used in the project Before inserting commodities, investments, activities, etc, it is advisable to define the most common units in which consumed or produced commodities are measured. To insert these, click on the Preferences icon (6th from the right in the Main Toolbar). A dialogue box appears, allowing you to enter the units commonly used (see Figure 3). WinDASI: A Software for Cost-Benefit Analysis of Investment Projects 7 Inserting and Managing Data Figure 3: The preferences window Add a unit Validate or cancel modifications Delete a unit The units to be used in a project are to be inserted here 4.3 The components window The Components window allows you to enter data for a given project. An icon on the Main Toolbar (Figure 4), gives you access to this window at any time. Figure 4 shows the Components window, with the six components within which data for an investment project are organized: Comm. (Commodities); Activities; Invest. (Investments); Plans; Zones; and Projects. Figure 4: The components window Create Consult As shown in Figure 4, to create a component, highlight the button of the relevant component (Projects, Zones, Plans, Comm., Activities or Invest.) and then click on Create. A window for data entry is then displayed, allowing the insertion of different parameters relative to each component. 8 EASYPol Module 019 Analytical Tools (i) Commodities For Commodities you must insert the name, unit and the price for each year of the project’s life, including the prices related to the without-project (WoP) situation. When the price is constant between years, this time series can be easily entered by clicking on the button with the Red Arrow, which then automatically repeats the price for the rest of the time series. Prices can be entered for both financial and economic analyses. To enter for economic analyses click the Economic prices tab at the bottom of the Commodity window (see Figure 5). Figure 5: The commodity window (ii) Investments Investment items are characteristic of investment projects. WinDASI has technical facilities that allow you to generate flows of costs for each investment item on the basis of some parameters, i.e.: i. ii. iii. iv. v. the life duration of the investment item – Life (in years); lag of annual maintenance – M.Lag (in years); rate of maintenance – Maintenance; contingency rate – Unexpected cost; and rate of residual value – Residual value These parameters are inserted in the proper window, as illustrated in Figure 66. 6 For an explanation on the use of this information, see the EASYPol Module 020: WinDASI: A Software for Cost Benefit Analysis of Investment Projects. Calculations Performed by the Software. WinDASI: A Software for Cost-Benefit Analysis of Investment Projects Inserting and Managing Data 9 Figure 6: The investment window Note that investment items can be valued both with financial and economic prices, to be inserted by selecting the appropriate tab. (ii) Aggregates Commodities and investments can be aggregated the by categories by means of the “Aggregates” facility. The Aggregates button is located in the Components window, and it allows you to define an aggregate of commodities or investments. Commodities or investments may be added to an aggregate by: i. clicking on Create to create a new aggregate; ii. clicking on + the aggregate; to add a new component (commodity or investment) to iii. calling the commodities or investments windows; iv. selecting the required commodities and inserting the chosen commodity into the aggregate; and v. clicking the - button to delete a component from the aggregate. The coefficient of the component in the aggregate is initialized at 1. You may modify it if you so wish. 10 EASYPol Module 019 Analytical Tools Figure 7: An example of the definition of an aggregate (FERTIL) (iii) Activities Activities are entered through the Activities window. As shown in Figure 7, an activity has a name and a unit in which inputs and outputs of the activity are specified. In general, the unit hectare (symbol: ha) is the most frequently used unit for a crop, because yield and input coefficients are usually expressed on a per hectare basis. However, the user can choose the units he prefers. The inputs (commodities used) appear in the Type column in the window as C and a P indicates the outputs (products). In order to add a commodity to an activity, click the button window. + in the Activities One very useful feature of the Activities window is the duplication facility. Once you have introduced an activity, you just click the button indicated in Figure 7 to duplicate it and then edit it to adapt the input and output coefficients to another, similar activity. Figure 8: The activities window Duplication WinDASI: A Software for Cost-Benefit Analysis of Investment Projects Inserting and Managing Data 11 Each plan has a name and a unit. It usually contains activities, as in Figure 8, investment items as in figure 9, and commodities, as in figure 10. To select investment or commodity items, click the relevant tab at the bottom of the window. In order to add an activity to a plan, select the tab “Activities” then click the + button in the Activities window. A window named “add an activity” will pop up. Select then the activity to add from the proposed list, and click the button “OK”. For each period you then have to specify the “quantity” of that activity in the plan (e.g. how many hectares of sunflower how many tons of wheat etc). For the activities there is a Mode column, where you must indicate whether Normal or Phased calculations are to be applied. The letter N indicates that the Normal mode has been selected, while C indicates that the Phased Mode of calculation has been selected (see Part 2 for an explanation of the differences in the calculations). Figure 9: Activities contained in a plan In order to add an investment item to a plan, select the tab “Investments” then click the + button in the “Investments” window. A window named “add an investment” will pop up. Select then the investment item to add from the proposed list, and click the button “OK”. For each period you then have to specify the “quantity” of that investment item you want to insert in the plan (e.g. how many tractors you have to buy in each period). Note that when you insert an investment item in a period, WinDASI considers that the investment item is present in the plan also for all the periods of its life duration, as it appears in the column “life length” of the investment window. Therefore, you have to specify the “quantity” of the investment item only in the period in which the investment item is added to the plan, not for all the periods of the life length of the investment item. 12 EASYPol Module 019 Analytical Tools This would be interpreted by WinDASI as additional investment items in each of the subsequent periods. For example, in figure 9, the investment item “TRAC-I” is added to the plan in period 1 and will be present in thee plan for the periods from 1 to 8, as indicated by its “life length”. Figure 10: An example of an investment in a plan In order to add a commodity to a plan, select the tab “Comm.” Then + click the button in the “Commodity window. A window named “add a commodity” will pop up. Select then the commodity to add from the proposed list, and click the button “OK”. For each period you then have to specify the “quantity” of that commodity you want to insert in the plan. Remember that a commodity can be inserted as an input or as an output. In the “Type” column you put C if the commodity is an input or P if the commodity is an output. Note that in WinDASI, Type C commodities generate flows of costs and type P commodities generate flows of benefits. For example, the commodities included in the plan in Figure 10 are all inputs since they have C in the “Type” column7. Figure 11: An example of commodities contained in a plan 7 For an explanation on the use of this information, see the EASYPol Module 020: WinDASI: A Software for Cost Benefit Analysis of Investment Projects. Calculations Performed by the Software. WinDASI: A Software for Cost-Benefit Analysis of Investment Projects Inserting and Managing Data 13 (v) Zones A zone is composed of plans (Figure 11) and investments (Figure 12). It is defined by a name and a unit8. Figure 12: An example of a zone containing two plans The Mode column allows you to specify either Normal mode, N, or Phased Mode, C, for the calculations, as we have already seen under Activities. Figure 13: An example of a zone containing an investment (vi) Projects A project allows you to aggregate Zones and Investments, as shown in Figures 13 and 149. 8 To see how the software uses this information regarding zones, see the EASYPol Module 020: WinDASI: A Software for Cost Benefit Analysis of Investment Projects. Calculations Performed by the Software. 9 To see how the software uses this information regarding the Project, see the EASYPol module 020 (see above footnote). 14 EASYPol Module 019 Analytical Tools Figure 14: An example of a project containing two zones Figure 15: An example of a project containing an investment 5 EDITING AND PRINTING DATA Once you have entered the project data, you must check it for mistakes, such as data omitted or entered incorrectly, and ensure that the plans, activities, etc., selected are those required. To this end, the WinDASI program offers a number of facilities. 5.1 To view a component on the screen From the Components window, click the icon corresponding to the selected component (i.e., commodities, activities, plans, etc.). A list of the types of components will appear. Then double-click on the name of the component you wish to consult, or click the Open to display the window, which allows you to see the data of the component. 5.2 To edit, modify or remove a component Once the window of the data is displayed, you may modify or suppress a given component by simply carrying out the following steps: click on the Edit icon; modify the data as required; and then, validate the modifications by clicking on the Save button. WinDASI: A Software for Cost-Benefit Analysis of Investment Projects Inserting and Managing Data 15 Figure 16: Edit commands window Edit In order to add a Commodity to an Activity, an Activity to a Plan, or an Investment to a Plan or to a Zone, click on the button in the respective window. + To suppress a full line of coefficients, you must first highlight the line, and then click on the - button. 5.3 Duplication of a commodity or an investment To duplicate a Commodity, an Investment or an Activity, you simply click on the Duplicate button, and validate it by clicking Save (see Figure 17). Figure 17: The duplication command Duplication 5.4 Printing data The Print icon is present in all windows, and it is thus possible to print data at any given moment. The printout of a project will contain all the data of the project: Project, Zones, Plans, Activities, Commodities and Investments. 16 EASYPol Module 019 Analytical Tools 6 PROJECT DATA MANAGEMENT 6.1 Saving project data in a data file and loading project data from a data file It is possible to save the data of a project in a data file by selecting File from the Main Toolbar, and then selecting Save as and giving a name to the file. The WinDASI data file will be stored with a .WDS extension. Similarly, you can load a .WDS data file by selecting File from the Main Toolbar, and then selecting the option Open. This procedure can facilitate the work of project analysts, particularly when they need to analyze the financial and economic viability of different options. They can store different options in separate files, compare them, and then choose those options that are to be retained. The same procedure can be used for the entry of data for a new project. Since many prices and agricultural activities are similar and need few changes for their adaptation to a new project, it is much easier to save the data file of an old project with the name of the new project and then make the necessary changes, rather than enter all the new data set. 6.2 The use of WinDASI in conjunction with a spreadsheet In general, the results produced by WinDASI are presented in a form designed for project analysts, and so the results are not suitable for direct inclusion in a report, for which purpose tables and graphics have to be specifically designed. For this reason, the user might wish to work further on the results obtained through WinDASI in order to improve their readability and presentation before inclusion in a report. It is possible to click on the Copy button in the Results Window, whereupon the results are transferred to the clipboard. After opening Excel, you can paste these results from the clipboard to a spreadsheet. 6.3 Quitting WinDASI The user can leave the program by clicking the Quit button on the Main Toolbar, or by clicking on Quit in the File menu. 7 READERS’ NOTES To use the software application concretely, show the different functionalities and illustrate the examples. WinDASI: A Software for Cost-Benefit Analysis of Investment Projects Inserting and Managing Data 7.1 17 EASYPol links This module belongs to a set of EASYPol modules which illustrate how to use the WinDASI application for financial and economic analysis of projects. Before starting with the material presented in this module, the user should have downloaded and installed WinDASI on her/his computer. To this end, he is referred to the following EASYPol module: EASYPol Module 018: WinDASI-A Software for Cost-Benefit Analysis of Investment Projects: Installation Note EASYPol Module 020: WinDASI-A Software for Cost-Benefit Analysis of Investment Projects: Calculations Performed by the Software EASYPol Module 021: WinDASI Exercise: NGAMO1: An Irrigation Project: Impacts of Irrigation on Traditional Farms EASYPol Module 022: WinDASI Exercise: NGAMO2: An Irrigation Project. Impacts of Irrigation and Mechanization on Traditional Farms EASYPol Module 023: WinDASI Exercise: NGAMO3: Economic Impacts of an Irrigation and Mechanization Project EASYPol Module 024: WinDASI Exercise: NGAMO4: Starting a Coffee Plantation in a Phased Mode In addition, a case study presenting the use of WinDASI to analyze a real project is reported in the EASYPol module: WinDASI-A Software for Cost-Benefit Analysis of Investment Projects: Case Study – Crop Intensification and Coffee Plantation EASYPol Module 039: 18 EASYPol Module 019 Analytical Tools Module metadata 1. EASYPol module 019 2. Title in original language English WinDASI: A Software for Cost-Benefit Analysis of Investment Projects French Spanish Other language 3. Subtitle in original language English Inserting and Managing Data French Spanish Other language 4. Summary This module explains how data should be organized and entered into the WinDASI software to run Cost-Benefit Analysis (CBA) of investment projects. In particular, as regard as data entry, it illustrates how the “components” window works. After, it shows the facilities the program has to check for mistakes, such as data omitted or entered incorrectly. In the last part of this module, it is explained how to manage project data, such as saving and loading project data. 5. Date November 2005 6. Author(s) Lorenzo Giovanni Bellù, Agricultural Policy Support Service, Policy Assistance Division, Food and Agriculture Organization of the United Nations, FAO, Rome, Italy 7. Module type Thematic overview Conceptual and technical materials Analytical tools Applied materials Complementary resources 8. Topic covered by the module Agriculture in the macroeconomic context Agricultural and sub-sectoral policies Agro-industry and food chain policies Environment and sustainability Institutional and organizational development Investment planning and policies Poverty and food security Regional integration and international trade Rural Development 9. Subtopics covered by the module 10. Training path 11. Keywords Investment planning for rural development