1
SCHOOL OF PHYSICS
FINAL YEAR PROJECT REPORT
NAMES:
COURSE:
Sarah Buxton, Charles Hannigan, Fergus Kidd,
Nicholas Pestell
Physics BSc
TITLE:
Non-intrusive Measurement of Basal Metabolic
Rate using an Open System Calorimetry
Respirometer (OSCaR)
YEAR OF SUBMISSION:
2013
SUPERVISOR:
Professor Peter Barham
NUMBER OF WORDS:
10054
School of Physics
Tyndall Avenue
Bristol BS8 1TL
2012/13
Declaration and Acknowledgements
Most of the work for this project was conducted independently by the group, with little outside help – within
our group we split work up fairly and in a manner that played towards individual strengths. This report is
a continuation of our literature reviews of November 2012, with much of our prior research being revisited.
Notable exceptions to this were: Tom Kennedy in the lab who was very helpful in sourcing a lot of
project materials and was always available to discuss the merits of particular methods; Richard Exley and
Adrian Crimp in the UoB Physics Mechanical Workshop very kindly made the plywood cuts for our box and
Sam Wright, a fellow 3rd year physicist who generously took our instrument home with him to use with his
hamster, Mitchell. Finally, there’s all the staff at Bristol zoo who helped us along the way – specifically Dr.
Christoph Schwitzer for his guidance on lemur habits and previous projects; Dr. Sue Dow for administrative
issues and Sarah Hall and Simon Robinson from the keepers team, who met us every day so we could collect
data and change batteries.
i
Abstract
The aim of this project was to obtain a non-intrusive and indirect measurement of the basal metabolic rate
of the Grey mouse lemur (Microcebus murinus) using a custom built open system calorimetry respirometer.
No value of basal metabolic rate for a lemur was obtained, however, investigation with a Djungarian hamster
(Phodopus sungorus) yielded a basal metabolic rate of 22.4±2.8 kcal day-1 . This is close to the expected
energy expenditure of this species and is evidence that the calorimetry respirometer produced is a viable
method of measuring metabolic rate. The research was undertaken with a view to applying the calorimetry
respirometer to other species of mammals and birds. The theoretical size limitations of the device were
considered and several other species identified as potential candidates for investigation.
ii
Table of Contents
1 Introduction
1
2 Detailed Background
2.1 Basal Metabolic Rate . . . . . . . . . . .
2.2 Motivation and the Importance of BMR .
2.3 History . . . . . . . . . . . . . . . . . . .
2.4 Methods of Measurement . . . . . . . . .
2.4.1 Direct Calorimetry . . . . . . . . .
2.4.2 Indirect Calorimetry . . . . . . . .
2.5 Previous Work at the University of Bristol
.
.
.
.
.
.
.
.
.
.
.
.
.
.
.
.
.
.
.
.
.
.
.
.
.
.
.
.
.
.
.
.
.
.
.
.
.
.
.
.
.
.
.
.
.
.
.
.
.
.
.
.
.
.
.
.
.
.
.
.
.
.
.
.
.
.
.
.
.
.
.
.
.
.
.
.
.
.
.
.
.
.
.
.
.
.
.
.
.
.
.
.
.
.
.
.
.
.
.
.
.
.
.
.
.
.
.
.
.
.
.
.
.
.
.
.
.
.
.
.
.
.
.
.
.
.
.
.
.
.
.
.
.
.
.
.
.
.
.
.
.
.
.
.
.
.
.
.
.
.
.
.
.
.
.
.
.
.
.
.
.
.
.
.
.
.
.
.
.
.
.
.
.
.
.
.
.
.
.
.
.
.
.
.
.
.
.
.
.
.
.
.
.
.
.
.
.
.
.
.
.
.
.
1
1
1
2
2
2
2
3
3 Experimental Design
3.1 Device Design . . . . . . . . . . . . .
3.1.1 Nesting Box . . . . . . . . . .
3.1.2 Instrumentation Box . . . . .
3.1.3 The Arduino . . . . . . . . .
3.1.4 Data Storage . . . . . . . . .
3.1.5 Oxygen Sensors . . . . . . . .
3.1.6 Light Gates . . . . . . . . . .
3.1.7 Scales . . . . . . . . . . . . .
3.1.8 Power Source . . . . . . . . .
3.1.9 Waterproofing . . . . . . . .
3.1.10 Animal Proofing . . . . . . .
3.2 Code . . . . . . . . . . . . . . . . . .
3.3 Calculating BMR . . . . . . . . . . .
3.3.1 Fick’s Law . . . . . . . . . .
3.3.2 Diffusion Coefficient . . . . .
3.3.3 Derivation of Final Equation
3.4 Calibration and Design Testing . . .
3.4.1 Scale Calibration . . . . . . .
3.4.2 Testing Waterproofing . . . .
3.4.3 Power Source Testing . . . .
.
.
.
.
.
.
.
.
.
.
.
.
.
.
.
.
.
.
.
.
.
.
.
.
.
.
.
.
.
.
.
.
.
.
.
.
.
.
.
.
.
.
.
.
.
.
.
.
.
.
.
.
.
.
.
.
.
.
.
.
.
.
.
.
.
.
.
.
.
.
.
.
.
.
.
.
.
.
.
.
.
.
.
.
.
.
.
.
.
.
.
.
.
.
.
.
.
.
.
.
.
.
.
.
.
.
.
.
.
.
.
.
.
.
.
.
.
.
.
.
.
.
.
.
.
.
.
.
.
.
.
.
.
.
.
.
.
.
.
.
.
.
.
.
.
.
.
.
.
.
.
.
.
.
.
.
.
.
.
.
.
.
.
.
.
.
.
.
.
.
.
.
.
.
.
.
.
.
.
.
.
.
.
.
.
.
.
.
.
.
.
.
.
.
.
.
.
.
.
.
.
.
.
.
.
.
.
.
.
.
.
.
.
.
.
.
.
.
.
.
.
.
.
.
.
.
.
.
.
.
.
.
.
.
.
.
.
.
.
.
.
.
.
.
.
.
.
.
.
.
.
.
.
.
.
.
.
.
.
.
.
.
.
.
.
.
.
.
.
.
.
.
.
.
.
.
.
.
.
.
.
.
.
.
.
.
.
.
.
.
.
.
.
.
.
.
.
.
.
.
.
.
.
.
.
.
.
.
.
.
.
.
.
.
.
.
.
.
.
.
.
.
.
.
.
.
.
.
.
.
.
.
.
.
.
.
.
.
.
.
.
.
.
.
.
.
.
.
.
.
.
.
.
.
.
.
.
.
.
.
.
.
.
.
.
.
.
.
.
.
.
.
.
.
.
.
.
.
.
.
.
.
.
.
.
.
.
.
.
.
.
.
.
.
.
.
.
.
.
.
.
.
.
.
.
.
.
.
.
.
.
.
.
.
.
.
.
.
.
.
.
.
.
.
.
.
.
.
.
.
.
.
.
.
.
.
.
.
.
.
.
.
.
.
.
.
.
.
.
.
.
.
.
.
.
.
.
.
.
.
.
.
.
.
.
.
.
.
.
.
.
.
.
.
.
.
.
.
.
.
.
.
.
.
.
.
.
.
.
.
.
.
.
.
.
.
.
.
.
.
.
.
.
.
.
.
.
.
.
.
.
.
.
.
.
.
.
.
.
.
.
.
.
.
.
.
.
.
.
.
.
.
.
.
.
.
.
.
.
.
.
.
.
.
.
.
.
.
.
.
.
.
.
.
.
.
.
.
.
.
.
.
.
.
.
.
.
.
.
.
.
.
.
.
.
.
.
.
.
.
4
4
4
4
4
5
5
5
6
6
6
7
7
7
7
7
7
8
8
9
9
4 Experimental Method
4.1 Testing with a Domestic Hamster . . . . . . . . . . . . . . . . . . . . . . . . . . . . . . . . . .
4.2 Bristol Zoological Gardens . . . . . . . . . . . . . . . . . . . . . . . . . . . . . . . . . . . . . .
4.3 Size Limitations . . . . . . . . . . . . . . . . . . . . . . . . . . . . . . . . . . . . . . . . . . . .
9
9
10
10
.
.
.
.
.
.
.
.
.
.
.
.
.
.
.
.
.
.
.
.
.
.
.
.
.
.
.
.
.
.
.
.
.
.
.
.
.
.
.
.
.
.
.
.
.
.
.
.
.
.
.
.
.
.
.
.
.
.
.
.
5 Results
10
5.1 Waterproofing Tests . . . . . . . . . . . . . . . . . . . . . . . . . . . . . . . . . . . . . . . . . 10
5.1.1 Weathering Test . . . . . . . . . . . . . . . . . . . . . . . . . . . . . . . . . . . . . . . 10
5.1.2 Dunk Tests . . . . . . . . . . . . . . . . . . . . . . . . . . . . . . . . . . . . . . . . . . 11
5.2 Battery Life Testing . . . . . . . . . . . . . . . . . . . . . . . . . . . . . . . . . . . . . . . . . 11
5.3 Hamster BMR Investigation . . . . . . . . . . . . . . . . . . . . . . . . . . . . . . . . . . . . . 11
5.4 Results from Bristol Zoological Gardens . . . . . . . . . . . . . . . . . . . . . . . . . . . . . . 11
5.5 Size Limitations . . . . . . . . . . . . . . . . . . . . . . . . . . . . . . . . . . . . . . . . . . . . 12
5.5.1 Paraffin Wax Burner - Effective BMR . . . . . . . . . . . . . . . . . . . . . . . . . . . 12
5.5.2 Oxygen Concentrations in Varying Box Dimensions and Varying Oxygen Consumption 12
iii
6 Discussion
6.1 Field Suitability . . . . . . . . . . . . . . . . . . . . . . . . . .
6.1.1 Weatherproofing . . . . . . . . . . . . . . . . . . . . . .
6.1.2 Power Supply . . . . . . . . . . . . . . . . . . . . . . . .
6.1.3 Solar Panel Investigation . . . . . . . . . . . . . . . . .
6.2 Hamster BMR Investigation . . . . . . . . . . . . . . . . . . . .
6.3 Zoological Gardens . . . . . . . . . . . . . . . . . . . . . . . . .
6.4 Size Limitations . . . . . . . . . . . . . . . . . . . . . . . . . . .
6.4.1 Paraffin Wax Burner - Effective BMR . . . . . . . . . .
6.4.2 Oxygen Concentrations in Varying Box Dimensions with
6.5 Further Work . . . . . . . . . . . . . . . . . . . . . . . . . . . .
6.6 Market Research . . . . . . . . . . . . . . . . . . . . . . . . . .
6.6.1 Motivation . . . . . . . . . . . . . . . . . . . . . . . . .
6.6.2 Survey . . . . . . . . . . . . . . . . . . . . . . . . . . . .
6.6.3 Results . . . . . . . . . . . . . . . . . . . . . . . . . . .
6.6.4 Conclusion . . . . . . . . . . . . . . . . . . . . . . . . .
. . . . .
. . . . .
. . . . .
. . . . .
. . . . .
. . . . .
. . . . .
. . . . .
Varying
. . . . .
. . . . .
. . . . .
. . . . .
. . . . .
. . . . .
. . . . . . . . . . . .
. . . . . . . . . . . .
. . . . . . . . . . . .
. . . . . . . . . . . .
. . . . . . . . . . . .
. . . . . . . . . . . .
. . . . . . . . . . . .
. . . . . . . . . . . .
Oxygen Consumption
. . . . . . . . . . . .
. . . . . . . . . . . .
. . . . . . . . . . . .
. . . . . . . . . . . .
. . . . . . . . . . . .
. . . . . . . . . . . .
7 Conclusion
13
13
13
13
14
14
15
15
15
15
16
16
16
16
17
17
17
Appendices
Appendix I - Circuit Diagram . . . . . . . . . . . . . . .
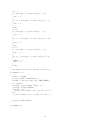
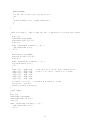
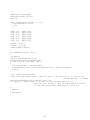
Appendix II - Complete Arduino Code . . . . . . . . . .
Appendix III - Financial Report . . . . . . . . . . . . .
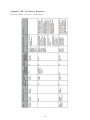
Appendix IV - Parts List with Suppliers . . . . . . . . .
Appendix V - Travelling With Lead-acid Batteries . . .
Appendix VI - Table of Component Power Consumption
Appendix VII - Tables of Steady State Waiting Times .
Appendix VIII - Zoo Survey Responses . . . . . . . . .
Appendix IX - User Manual . . . . . . . . . . . . . . . .
Appendix X - Meeting Minutes . . . . . . . . . . . . . .
Appendix XI - Certification of Ownership . . . . . . . .
References
.
.
.
.
.
.
.
.
.
.
.
.
.
.
.
.
.
.
.
.
.
.
.
.
.
.
.
.
.
.
.
.
.
.
.
.
.
.
.
.
.
.
.
.
.
.
.
.
.
.
.
.
.
.
.
.
.
.
.
.
.
.
.
.
.
.
.
.
.
.
.
.
.
.
.
.
.
.
.
.
.
.
.
.
.
.
.
.
.
.
.
.
.
.
.
.
.
.
.
.
.
.
.
.
.
.
.
.
.
.
.
.
.
.
.
.
.
.
.
.
.
.
.
.
.
.
.
.
.
.
.
.
.
.
.
.
.
.
.
.
.
.
.
.
.
.
.
.
.
.
.
.
.
.
.
.
.
.
.
.
.
.
.
.
.
.
.
.
.
.
.
.
.
.
.
.
.
.
.
.
.
.
.
.
.
.
.
.
.
.
.
.
.
.
.
.
.
.
.
.
.
.
.
.
.
.
.
.
.
.
.
.
.
.
.
.
.
.
.
.
.
.
.
.
.
.
.
.
.
.
.
.
.
.
.
.
.
.
.
.
.
.
.
.
.
.
.
.
.
.
.
.
.
iii
.
iii
.
iii
. xiii
. xiv
. xiv
. xv
. xv
. xvi
. xviii
. xxxiv
. xli
xlii
iv
1
Introduction
also be in a thermoneutral zone, which is defined as
a temperature range at which an animal’s heat proWorking in conjunction with Bristol Zoological Gar- duction is equal to heat loss to its surroundings[3] .
dens (BZG), the aim of this project was to build an
instrument capable of measuring the basic energy
There are many alternative metabolic indices,
expenditure of the grey mouse lemur (Microcebus
such
as the field metabolic rate (FMR), which is the
murinus), a small nocturnal primate indigenous to
cost
of
free existence in the wild, and includes other
Madagascar. BZG is heavily involved in the conenergy
penalties such as locomotion, thermoregulaservation of endangered species of lemur and the
tion,
reproduction
and tissue growth. Although FMR
development of breeding programs, which are degives
a
more
accurate
picture of real world energy
signed to create a self-sustaining captive population
consumption,
BMR
is
a
widely used and important
for study and possible future reintroduction projects.
parameter
as
it
allows
for
comparison across species
The knowledge gained from metabolic research at
[4]
and
higher
taxa
.
the university will allow zookeepers a much greater
insight into the physiology and nutritional needs of
the animals they house and, in turn, will also inform
the conservation measures of lemurs in the wild.
2.2
The measurement device that that was commissioned was to be used both in the zoo and in the
wild and so must be able to withstand the extremes
in temperature and humidity expected in Madagascar. The device was to be portable and cost-effective
but, most importantly, nonintrusive. The protection
of wildlife is of paramount importance to BZG, which
is why work was carried out in accordance with the
zoo’s mission statement:
Motivation and the Importance of
BMR
Animals housed in European zoos are frequently
overfed which can lead to obesity and its associated health problems, such as diabetes and coronary
heart disease. The problem of overfeeding is particularly pronounced in lemurs due to their low BMR,
which is often overlooked by gamekeepers[5] . Obesity
in mammals can cause infertility or miscarriage[6]
“Bristol Zoo Gardens maintains and deand this is a major concern in the conservation of
fends biodiversity through breeding enendangered species; reduced reproductive efficiency
dangered species, conserving threatened
due to overfeeding would be counterproductive to the
species and habitats, and promoting a
vital conservation work carried out at zoos. Nutriwider understanding of the natural world.”
tion plans in zoos are to a large extent based on trial
and error. Gamekeepers have no accurate method of
knowing an animal’s daily energy expenditure and it
can take a period of time before the negative impact
2 Detailed Background
of overfeeding becomes apparent. Using a calorimeter avoids this lag time and provides a live value of
2.1 Basal Metabolic Rate
BMR. It is also a useful tool for zoologists as drug
In theory, a metabolic rate can be calculated from a dosages can be administered based on an animal’s
balance sheet of energy gain and loss, as detailed in metabolic rate[7] . Dr. Schwitzer, Head of Research
formula 1[1] :
at BZG, has also expressed interest in using the device to conduct research into daily torpor, which is
rate of energy intake − rate of energy expenditure =
the regular period of decreased physiological activity
metabolic rate
(1) (and thus metabolic rate), which lemurs undergo in
order to conserve energy.
The basal metabolic rate (BMR) of an animal is
the energy it requires just to maintain vital organs;
it is the minimum cost of living[2] . The BMR of an
There is no product like this on the market. There
animal is defined as the energy expenditure of a non- are invasive (and expensive) methods of calorimetry
growing individual per unit time when at complete available, but even if BZG was prepared to use these,
rest in a post absorptive state, which means that its they contravene Home Office regulations. This is
digestive system is not active. The animal must be an exciting project: if successful in creating a nonunder no physiological or physical stress, as this can invasive measurement device, it will be the first of its
significantly raise its metabolism. The animal must kind.
1
2.3
History
2.4
2.4.1
The earliest and simplest measurement device was developed by Antoine Lavoisier and Pierre de Laplace
and was built in the 1780s. It consisted of a wellinsulated chamber surrounded by densely packed ice.
The apparatus was completely sealed save for a modest air pipe, which allowed the occupant to breath.
The animal was placed inside the chamber and heat
(and therefore energy) lost by the subject was calculated from the mass of the collected water and the
latent heat of melting ice[3] . In principle this method
was simple, though in practice it was cumbersome
and expensive[8] .
Methods of Measurement
Direct Calorimetry
Methods of measurement can broadly be split into
two groups: direct and indirect calorimetry. Direct
calorimetry involves measuring the total amount of
heat produced by an animal and equating this to
its energy usage. The method relies on Hess’s law,
which states that the total energy released in the
breakdown of a fuel to a given set of end products
is always the same, irrespective of the intermediate
steps or pathways used. The corollary of this is that,
when no physical activity is being carried out and
no new molecules are being synthesized, the total
chemical energy released by an animal in performing
its metabolic functions ultimately appears as heat[1] .
The earliest measurement via direct calorimetry was
that of Lavoisier and Laplace discussed in section 2.3.
The main problem with direct calorimetry is that it
is invasive, as the animal does not enter and leave the
chamber under its own free will; this necessitates capturing the animal, which will artificially raise its BMR
due to the physiological stress of handling. Studies
have shown that metabolism of some mammals is elevated by up to 65% for two hours after human contact, and measurements taken during this relaxation
period will not be true indicators of BMR[12] . This
necessitates the use of the indirect calorimetry discussed next.
Historically the BMR of an animal has been estimated using formulae based on allometric laws – that
is to say, laws which relate the geometry of a creature to its physiology. The earliest equations proposing BMR as a function of body mass were devised
by Max Rubner in 1883, who concluded that BMR
scaled with mass to the power of two thirds. Rubner’s derivation was underpinned by the theory that
BMR is proportional to heat output, and thus surface
area[9] . He made numerous assumptions, including
that an animal is spherical, and his work fell under
experimental scrutiny. Half a century later, in 1932,
Max Kleiber empirically showed “a closer relation of
basal metabolism to the three quarter power of body
weight than to the geometric surface of [an] animal ”
2.4.2 Indirect Calorimetry
– a relation that came to be known as Kleiber’s law:
Indirect calorimetry is widely regarded as the gold
standard method for measuring BMR[13] . It depends
on the measurement of some parameter related to
3
(2) energy expenditure other than heat production.
BM R = αM 4
Among the techniques of indirect calorimetry
respirometry is one, by which measurements of the
rate of oxygen consumption or the rate of carbon
dioxide production are related to energy expenditure.
In the process of aerobic respiration Animals inhale
oxygen from the air in order to oxidize organic compounds, which in turn releases the chemical energy
stored in the bonds[1][9] .
Kleiber found α, the constant of proportionality,
3
to be an average of 70kcal kg- 4 day-1 for mammals[10] .
This exponent was the most commonly accepted value
of the scaling factor for the majority on the 20th
century, but the validity of the Kleiber exponent
has recently been under further scrutiny. The intercept and exponent are of course both approximations, with 34 chosen as much for convenience as for
accuracy, and have been shown to be (sometimes significantly) different depending on species[4] ; The evidence varies so much that some experts have rejected
both exponents[11] . Whether data supports a power
of 23 or 34 , there is certainly no unilateral agreement
on the relation, and markedly less agreement on the
explanations behind the relations. For this reason it
is necessary to experimentally measure, rather than
estimate, an individual’s metabolic rate.
C6 H12 + 6O2
◦
∆G
(3)
→ 6CO2 + 6H2 O
=
−686kcal. mol
−1
The total amount of energy released in the oxidation of 1mol of glucose (shown above) is 686kcal,
(Gibb’s free energy). In cellular respiration, 420kcal
is released as heat and the remaining 266kcal is transferred as chemical energy to the molecule ATP, to be
2
used for other physiological functions[14] .
enter of its own volition. Not only is this in keeping
with the BZG research policy, but it also allows for
Much of the difference in oxygen necessary to a more accurate measurement of BMR by ensuring
metabolise the three predominant food groups is that the animal is under minimal stress and therefore
counteracted by differing releases of energy from is as close as possible to basal conditions.
their oxidation. This means that the calorific value
per litre of oxygen consumed only varies by around
2.5 Previous Work at the University
10% between them: being 5 kcal l-1 , 4.8 kcal l-1
of Bristol
and 4.5 kcal l-1 for carbohydrates, fats and proteins
[15].
respectively
Schmidt-Nielsen states that it is “cus- This project is a continuation of similar work cartomary to use an average value of 4.8kcal l-1 O2 as a ried out by three previous groups at the University
measure of metabolic rate. The largest error resulting of Bristol. Most recently, progressions were made in
from the use of this mean figure would be 6% ” [15] . In 2011, by G. Cohen and J. Humphries[17][18] . The aim
practice, a balanced diet is likely to mean this error of their project was to develop an instrument capable
is smaller than the maximum and perhaps insignifi- of measuring the BMR of the Grey Mouse Lemur
cant in the face of larger experimental uncertainties. in the zoo and in their natural habitat of Western
Using the average value stated by Schmidt-Nielsen Madagascar. 2011 was the first year it was proposed
we arrive at the following equation describing the that the device should be taken to Madagascar for
relationship between BMR (in kcal s-1 ) and oxygen use in the field; hence, notable developments were to
consumption:
be made in portability and durability.
δ(V O2 )
× 4.8
δt
Following the trend from previous work, an open
system respirometry chamber was developed, which
The amount of energy released per litre of car- aims to mimic the nesting box used by Grey Mouse
bon dioxide produced varies more greatly than that Lemurs at BZG. The instrument comprises of two
of oxygen consumed. For instance, the difference boxes, the first of which houses all circuitry, a data
between the conversion rates across three predomi- storage device and an Amicus18 board with an innant food groups causes a maximum discrepancy of build PIC microcontroller, which is programmed to
34%[9] contrasted with 6% for oxygen consumption. manage the functions of the instrument. Connected
This makes oxygen consumption a far more suitable to this is the lemur nesting box. On both the inside
method for measuring BMR.
and the outside of the nesting box is an EC410 electrochemical oxygen sensor. The sensors are used in
Two specific types of respirometry exist: In closed combination to measure the oxygen consumption of
system respirometry the animal is confined to a sealed animals within the box.
chamber which is maintained at a constant pressure.
A steady controlled supply of oxygen is entered into
Cohen and Humphries experienced several issues,
the system which is an indication of the oxygen con- throughout building the instrument and testing it
sumption of the animal [16] . In contrast, in open at BZG, which ultimately resulted in a lack of data:
system respirometry, gas is able to flow in and out throughout the two days of testing the lemurs only
of the chamber. The difference between inflow and entered the nesting box for short periods of time, afoutflow is a measure of oxygen consumption.
ter being encouraged by placing food within the box.
Most likely, the lemurs never became familiar or comIn their traditional forms both open and closed fortable enough with the device, owing to the lack of
system respirometry offer the same disadvantages as time for which it was inside their enclosure. Moreassociated with direct calorimetry, that is, to enclose over, the nesting box built by Cohen and Humphries
an animal in an unfamiliar environment, which is is a poorly-considered replica of those which are used
likely to increase stress and remove the animal from by lemurs at the zoo; this may have been a factor in
lemurs’ reluctance to use the box.
basal conditions[12] .
BM R =
(4)
As a variation to the closed system respirometry
technique, for small animals using nesting boxes, such
as the Grey Mouse Lemur, the system can be built
around a nesting box similar to that which the animal would normally use. Thus, the animal should
Cohen and Humphries were unable to implement
a portable storage device due to difficulties in programing the Ammicus18 board. The solution was
to use an LCD screen connected to the instrument
which outputted oxygen concentrations. This method
3
required constant observation, thus rendering the instrument impractical for use in the field, something
which Cohen expressed strongly in his report: “Collecting data was extremely hard, this is because it is
difficult to maintain focus on a screen so small for
hours.” [17]
For the instrument to be capable of measuring
BMR it needed a pair of oxygen sensors – one measuring O2 concentration outside the nesting box and
one inside – and a small computing unit. Additionally, light gates at the nest box entrance provided
presence detection and built in scales allow extensions of research to allometric scaling laws, which
rely on knowing an animal’s mass [9] .
A single light gate system was implemented to determine if the nesting box was occupied. Readings
were taken for one hour after the light gate was triggered. This technique neglects to consider whether 3.1.1 Nesting Box
a lemur is entering or leaving the box, meaning data
collection opportunities are lost, or conversely data is The design of the nesting box was based very closely
on one BZG uses with their lemurs, with all dimencollected needlessly[17] .
sions being as close as possible to the box that was
already in use – this was to maximise the familiarity
3 Experimental Design
of a new box to the lemurs. Some instruments necessitated slightly different measurements, which are
3.1 Device Design
mentioned in sections 3.1.6 and 3.1.7. Each change
was approved by Dr Schwitzer, who was capable of
The instrument was designed with the project aims in
judging what, if any, impact the difference would
mind, the overarching themes being those of durabilmake on the lemur’s welfare and likelihood to use the
ity, portability, accuracy and animal comfort/welfare.
next box.
Within each of these areas, simplicity and cost efficacy were also considered in order to be able to make
The material used was plywood (the same matethe device easy and cheap to reproduce or fix.
rial as the zoo’s box); specifically it was water and
boil proof (WBP) plywood, which is resilient to water
The basic idea for the design, which differs from
– a necessity should it be taken to the tropical climes
previous works, was to have the box containing the
Madagascar. Finally, the whole box was painted
electronics and instrumentation attached but comblack to match that of the zoo.
pletely separable from the nesting box – this was
achieved by tightly bolting the two parts together.
This would allow the instrument to be removed and
then attached to another nest box so that a different 3.1.2 Instrumentation Box
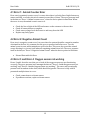
species can be researched. Furthermore, for remote As with the nest box, the box containing the elecfield work it would be possible take just the instru- tronics was also constructed of WBP plywood. It
ment and then attach a nest box in-situ, thus saving was designed to have the capacity to fit all the esweight and space, which may be restricted when trav- sential electronics plus a power supply, the size was
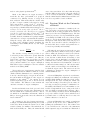
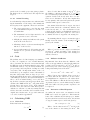
elling. The design of the nest and instrumentation made as compact as possible to ensure portability.
box is shown below in figure 3.1.
The interior was then to have wooden dividers to
keep components separate and prevent damage from
excessive movement of parts within the box. Much
of the design of the instrument box centred on it
being made waterproof for use in the field, which is
discussed in section 3.1.9.
3.1.3
Figure 1:
Basic design
instrumentation box.
of
the
The Arduino
The project aims lend themselves to a small, cheap
microcontroller unit that can take inputs from several
different sensors, perform calculations and logic and
is able to store data. After research, it appeared that
the product that best fitted these characteristics was
an Arduino UNO, which has 20 I/O pins (digital and
nest-
4
analogue), costs under £20 and has a wide variety of
LuminOx works on a completely different princiattachments that can be used for various functions ple to most other oxygen sensors: being based on the
including data storage.
principle of fluorescence quenching by oxygen. While
the exact technology behind the sensor is proprietary,
The microcontroller chip on the Arduino UNO is a high level view of the process is as follows[21] :
an ATmega328, which has a flash memory of 32kb
1. An LED is pulsed into a fluorescent material,
and, with its 20MHz operating frequency, can achieve
which excites it.
[19]
nearly 20MIPS (million instructions per second)
.
32kb of memory was deemed to be appropriate to
2. The excited matrix fluoresces at a different
contain all of the project code, assuming it was efwavelength to the LED, with the intensity of
ficient, while 20MIPS was definitely in excess of the
fluorescence detected with an optical sensor.
speed needed to run this project.
3. If, instead of returning to a non-excited state
by emitting a photon, an excited molecule encounters an oxygen molecule its energy can be
3.1.4 Data Storage
transferred non-radiatively to the oxygen thus
preventing (quenching) fluorescence.
Arduino electronics are designed so that they can be
used with a wide variety of add-ons (called shields)
4. The amount the material fluoresces is inversely
produced both by Arduino and also by third party
proportional to the probability of an excited
manufacturers. Among these there is the Arduino
molecule encountering an O2 molecule. This
Ethernet Shield, which primarily allows the controller
is directly proportional to the concentration of
to communicate via an Ethernet cable; however, it
oxygen in the fluorescent complex, which is itis the secondary function of this shield, its SD card
self directly proportional to (and in dynamic
interface, that made it attractive for this project.
equilibrium with) the concentration of oxygen
in the atmosphere.
The Ethernet Shield has a micro-SD port built in
to it, which allows data to be passed from the Arduino onto a micro-SD card, which is a high-density
storage medium. As mentioned in section 2.5, in previous years, remote storage has been an issue but by
using the shield[17] , what would otherwise be a hardware and software problem became a matter of just
software: i.e. programming the Arduino to write to
the SD card.
Two LuminOx sensors were used in OSCaR – one
was fed from the instrument box into the nest box to
measure interior oxygen concentration while the other
was placed through the floor of the instrument box to
measure exterior concentration for comparison.
3.1.6
Light Gates
Grey mouse lemurs, especially the females, tend to
nest in groups; this means that there could be several
Previous iterations of this project have used the animals in one nest box at a time. Consequently, a
EC410 analogue electrochemical oxygen sensor but way of counting the number of lemurs in the box was
have consistently had problems with calibration. This necessary so a BMR for each animal could be calparticular sensor also needs an accompanying am- culated; this had the additional advantage of being
plifying circuit, further complicating matters. The able to tell when the nest box was unoccupied, thus
problems with the EC410 galvanised a search for a meaning that recordings would only be taken when
better sensor, which was found in the form of a Lu- an animal was present and also allowing a power savminOx Oxygen Sensor, which is cheaper, has better ing mode to be entered in the meantime.
resolution, a longer expected lifetime and contains no
hazardous materials. These advantages were in addiIn this project, a pair of light gates were set into
tion to the LuminOx sensor’s digital communication false panels at the front of the nest box entrance but
abilities and pre-calibration by the manufacturer[20] . were placed with at different depths within the enAdditionally, the sensor has the ability to measure trance hole (these panels necessitated increasing the
atmospheric pressure and temperature, which is an depth of the nest box entrance hole). This allowed
advantage to calculate the diffusion constant of air the direction in which the animal moved through the
were to maximum precision.
hole to be ascertained depending on what order the
two gates were triggered; intermediate stages, such
3.1.5
Oxygen Sensors
5
as if an animal entered the entrance hole but turned
back could also be discerned, further reducing any
This output then needed to be calibrated to corerrors in animal count.
respond to a mass placed on the scales, which is
explained in section 3.4.1.
Each light gate was made up of an infrared LED
directly opposite a Schmitt Trigger, which is an optical sensor that reads a binary state depending on the 3.1.8 Power Source
flux of the infrared light falling on it – a high voltage
at high flux and vice versa; this means any blocking, The Arduino computer requires a power source of beeven slight, of the LED by an animal sets off the trig- tween 6V and 15V, which it then regulates down to
ger. The gates were positioned in a cross shape to 5V to run its own systems and also power any atprevent any ‘blind spots’ in the entrance that the an- tached sensors. Initially this was provided by two
imals could inadvertently slip through and said cross 9V PP9 batteries, which have a high energy density
was orientated such that no sensor or LED was posi- (5000mAh each) but are only single use, making powtioned directly at the bottom of the entrance where ering the device for long periods of time expensive.
This meant that the majority of experimentation was
it could easily become blocked by debris.
carried out using 6V lead-acid batteries, which have a
slightly lower energy density but are easily recharge3.1.7 Scales
able – the major disadvantage of these batteries was
that a capacity of only 4000mAh could fit into the
Finding a set of commercial scales that was small battery compartment of OSCaR, which was designed
enough to fit into the base of the nest box and then with PP9s in mind. Also, while lead-acid batteries are
integrating them in with the Arduino electronics was technically suitable for air travel, complications can
deemed to be unnecessarily complex, instead it was easily arise – refer to appendix V for more details.
decided to extract essential parts from commercially
available scales and assemble a new set - though this
still necessitated an increase in the height of the nest 3.1.9 Waterproofing
box to comfortably accomodate the mechanism.
In order to be used in the field, the delicate electronics had to be waterproofed to prevent failure. The
The specific part needed was a load cell, which main challenge in this case was keeping everything
can be found in most kitchen scales. A load cell is sealed, while still running electronics between the two
essentially a Wheatstone bridge made up of strain separable parts of the equipment. This was achieved
gauges, which are fixed to a flexible metal bar; two by attaching rubber washers around any opening in
strain gauges are fixed to the top of the bar and two the instrumentation box – these would then form a
to the bottom. When it is fixed at one end and a good seal when the instrumentation and nest boxes
load is applied at the other, the bar bends slightly – were bolted tightly together. The nest box oxygen
this changes the resistance of the strain gauges de- sensor was also contained within a small piece of pipe
pending on their position and creates a voltage across protruding from the side of the instrumentation box
the Wheatstone bridge that varies linearly with load to add further protection.
applied.
The design of the instrument box itself was
The voltage that occurred across the bridge was planned so as to give minimal skywards facing joins,
on the order of microvolts, which is too small for the where water may seep through. To add further waArduino to directly resolve. Consequently the sig- terproofing to the joins they were sealed on the inside
nal needed to be amplified by a custom circuit: this of the box with silicone sealant. This is also how
consisted of an INA125P amplifier through which the the light gate LEDs and sensors were secured and
output voltage of the Wheatstone bridge was run. waterproofed. The door to the box had rubber seals
The amplifying circuit – which is shown in the full attached and was fastened with compression clips to
circuit diagram in appendix I – then outputted a give a secure seal.
single voltage to Arduino with reference to ground.
The gain of the amplifier could be adjusted dependThe wood of the instrumentation box also needed
ing on the gain resistance applied across it: a 10Ω protection from the long term effects of rain, such
resistor was added in this case, giving a gain of ap- as warping, delamination and boils, which could afproximately 6000 and amplifying the voltage into the fect the structural integrity and water-tightness of the
range of volts.
container. This was achieved by coating the wooden
6
panels of the box with epoxy resin, giving a plasticwhere J is the flux in units of mol m-2 s-1 , D is
∂c
like finish to the wood that was both tough and wa- the diffusion coefficient in units of m-2 s-1 and ∂x
is
-2
terproof.
the concentration gradient in units of mol m . This
equation describes the steady state flow of a substance in one dimension. Steady state implies that
3.1.10 Animal Proofing
for any quantity of the system in question, the partial
Several animal proofing measures were taken in build- derivative with respect to time is zero.
ing the instrument - for the safety of the animals and
the longevity of the equipment. These were as follows:
If it assumed that the flow of oxygen, associated
with a lemur inside the calorimetry chamber, has
reached steady state, i.e. the concentration at any
point from just outside to well within the nesting box
is unchanging in time, then equation 5 can be used
• The instrument box had clips attached to its to estimate the flow of oxygen into the nesting box.
door to prevent access to electronics.
By assuming that the oxygen concentration varies
• All light gate wiring was built into false panels linearly across the entrance to the nesting box, ∂c is
∂x
at the front of the nest box.
given by the formula:
• The oxygen sensors were covered in wire mesh
to prevent animals being able to come into contact with them.
• All wiring related to scales was run through the
false floor of the nest box.
C2 − C1
∂c
=
(6)
∂x
X
• As previously mentioned, all circuitry was well
Where C1 and C2 are the oxygen concentrations
waterproofed to prevent electrical dangers to in moles m-3 outside and inside of the nesting box
animals.
respectively and X is the length of the nesting box
entrance in metres.
3.2
Code
3.3.2
The Arduino was coded in a language very similar to
C. The code comprises of a set of switch functions,
able to determine the direction of movement through
the LED gate setup for the first animal to enter. After
an animal is detected, a loop is entered in which oxygen percentage and temperature readings are taken
every 10 seconds. An important feature of the code
is that the loop is comprised of tens of thousands of
tiny time delays, rather than one large one per reading interval, which allows for the constant monitoring
of the LED gate system, so the system will always be
able to detect an animal leaving, or a second entering. In these events the system averages all the data,
calculates the BMR in kcal day-1 , and prints all the
relevant data to the storage device. If the animal is
the last to leave, the scales’ zero-value intercept is recalibrated to take into account any nesting material
added to the nest box and the device is returned to its
original, more inactive state. A copy of the annotated
code can be found in appendix II.
3.3
3.3.1
Experimental data shows that the diffusion coefficient, as an approximation, varies linearly with temperature from (17.9±0.895) × 10−6 m2 s-1 at 0°C to
(22.7±1.135) × 10−6 m2 s-1 at 40 °C[23] , giving the following relationship between D and T:
D = 1.2 × 10⁻⁷ × T − 1.488 × 10⁻⁶
3.3.3
Derivation of Final Equation
As outlined in section 2.4.2, an estimation for the
BMR can be made via equation 4. This forms the
basis of the calculation used in this project. Assuming the system has reached steady state, the amount
of oxygen consumed per second in 4 is given by:
Fick’s Law
Fick’s first law is as follows[22] :
∂c
∂x
(7)
Where T is in degrees Kelvin. There is an error
associated with the two values in 7, however these
are insignificant in comparison to the values themselves. The diffusion coefficient also has a dependence
on pressure; however, over the altitude range at which
this device will be used, the pressure dependence can
be neglected.
Calculating BMR
J = −D
Diffusion Coefficient
O2 consumption = JA
(8)
Where J is the flux in mol m-3 s-1 and A is the
(5) area of the entrance to the nesting box in m2 . The
7
flux is calculated using Fick’s law as described in section 3.3.1. A few subtleties in the formula for J arise
∂c
due to unit conversions: ∂x
should be in units of mol
-2
m , however oxygen concentration provided by the
LuminOx sensor is as a percentage, hence, the following adaption of Fick’s law is used:
J=
C2 − C1
100X
P
D
RT
(9)
Where C1 and C2 are oxygen concentrations, in
parts per hundred, outside and inside of the nesting
box respectively, P is the pressure in Pa, R is the gas
constant in JK-1 mol-1 and T is the temperature in
K. The factor of 100 in the denominator converts the
oxygen concentrations to fractions and the quantity
is the number of moles per m3 of air from the ideal
gas law. By substituting for J into equation 6, the
oxygen consumption in mol s-1 can be found.
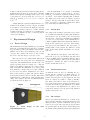
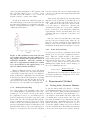
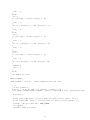
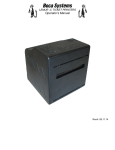
Figure 2: Initial calibration graph for the load
cell, showing the measured voltage for a given
mass. Voltage on the Arduino is measured in
arbitrary increments of 205V-1 .
In order to use the newly found oxygen consumption in equation 4, it must first be converted into units
of litre per second, this is performed as follows:
O2 Consumption (l s−1 )
=
×
=
RT
P
O2 Cons. (mol s−1 ) (10)
C2 − C1
AD
10
X
1000
3
The quantity RT
P converts moles into m and 1000
3
is the conversion factor for m into litres.
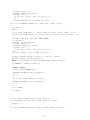
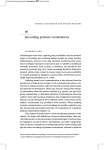
Figure 3: Calibration graph for the load cell,
showing mass vs. voltage - the gradient of the
Substitution of oxygen consumption into equation line of best fit is 0.785±0.011 and the intercept
4 gives the final equation for BMR as used in this is -24.51±0.35. Error bars are present but too
project:
small to be seen.
−1
BM R (kcal s
3.4
3.4.1
) = 48
C2 − C1
X
AD
It can be seen in figure 2 that there is a prominent kink in the data set of mass versus voltage – the
voltage goes up very slowly, staying almost constant
until about 200g at which point the gradient becomes
much steeper. The reason for this is hard to consider
but suggests there are two flexing regimes in the scale
mechanism. This is probably due to the wood and
plastic support underneath the load cell, which may
flex before the load cell does. This discontinuity in
the graph gradient complicated matters and reduced
the resolution of the scales at low masses; it was therefore decided to load the scales with enough weight
to reach the point at which the gradient steepens.
This was achieved by attaching approximately 200g
in mass to the underside of the weighing platform.
With this extra mass attached, the calibration was
(11)
Calibration and Design Testing
Scale Calibration
Once the scales were installed in the base of the nest
box, they needed calibrating against a set of test
masses. This was done by connecting the scales and
accompanying amplifying circuit to the Arduino and
creating a graph of voltage against mass, from which
an equation linking the two could be found. This
graph is shown in figure 2 below:
8
carried out again, giving figure 3. The equation of the from the elements. The expected result was that the
line of best fit of figure 3 (mass = 0.785V − 24.51) control piece would swell and warp much faster than
was then used in the Arduino code to convert the the coated piece.
measured voltage to a mass of the animal.
After several days submerged it was realised that
As well as the kink in the calibration graph, an- this was not true weathering, as generally the wood
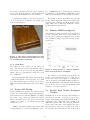
other interesting property of the scale system was that will be only periodically wetted followed by dry perithe values it gave fluctuated, not randomly, but in the ods – which may in fact put greater stresses on the
fashion of a damped harmonic oscillator – an example wood and cause it to deform more. Therefore the
experiment was changed to recreate such conditions;
of this is shown in figure 4:
the wood was left to soak during the working day
(approximately 8 hours) and then taken out to dry
overnight. This gave a rough ratio of dry time to wet
time of 2:1.
Once the control box was built, the overall design
was also tested for weatherproofing. This test consisted of a prolonged submersion (approximately 30
minutes) of the box in a tank of water, followed by
measuring how much water had managed to seep in.
3.4.3
Power Source Testing
To get an idea of how long a particular battery would
Figure 4: The oscillation of the load cell volt- run the device for, its power consumption was meaage reading with time after the addition of a sured. This was a simple measure of the current
50g weight, showing the exponential decay in being drawn from the battery using a multimeter.
oscillation amplitude. The time constant in This current was then easy to change into a time
this case is approximately 100ms but is likely – this is because battery capacity is measured in
to be proportional to the applied mass, as is milliamp-hours (mAh) and the current drawn is on
the order of milliamps, therefore:
the case with harmonic oscillators.
Battery Capacity
(12)
Battery Lif e =
This is a well-known artefact of load cells, known
Current Drawn
[24]
as ‘ringing’ , which is due to the physical vibration
This knowledge was important for knowing how
of the metal bar that makes up the cell. With haroften battery packs needed changing in order to maxmonic oscillation the equilibrium point of the fluctuaimise data-collection time.
tions is the true value for the given mass; so averaging
over a significant period of time smooths out the variation and gives an accurate value, which was done in
4 Experimental Method
the section of code responsible for measuring mass.
4.1
3.4.2
Testing Waterproofing
Testing with a Domestic Hamster
To test the system with a live subject, a domesticated Djungarian hamster (Phodopus sungorus) was
used. The reason for using a domesticated hamster
is that they are handleable, and much faster to accept changes to their smaller enclosures, while being
of a similar size to a mouse lemur. The device was
placed into the hamster’s cage, with all other distractions and sleeping compartments were removed. The
OSCaR was then powered on and left for a period
of 48 hours, taking readings every ten seconds after
detection of animal entry. The hamster was then left
to freely enter and exit the device at will, so that the
As a crude measure of the durability of the control
box, a small qualitative experiment was carried out –
a sample piece of wood was coated in epoxy resin (as
the equipment box was to be) and submerged in a
beaker of warm water along with a control piece that
had no resin on it. The reasoning was that being submerged constantly in water for long periods of time
would accelerate any weathering that may occur in
the field, particularly in warm, wet Madagascar, and
thus show us the efficacy of the epoxy resin in protecting the wood and therefore the electronic equipment
9
animal was not under stress when measurements were box are shown in appendix VII.
taken.
4.2
5
Bristol Zoological Gardens
The OSCaR was left in the Lemur enclosure in Twi- 5.1
light world at BZG for 4 weeks, as a stand-alone sys5.1.1
tem where batteries were changed, and data collected,
every 48 hours when PP9 batteries were used, and every 24 hours when the rechargeable lead acid batteries
were used.
4.3
Results
Waterproofing Tests
Weathering Test
Size Limitations
The technique conceived through this on-going
project has the potential to be implemented on numerous species besides the Grey Mouse Lemur. As
an extension to the design of the OSCaR, the scope
of the technique was examined with respect to size of
the animal.
To model the respiratory rate of an animal, the
oxidation of paraffin wax by combustion was used.
This reaction both consumes oxygen at a given rate,
as well as exuding heat, much the same as a warm
blooded mammal of the type under investigation.
Using this model it is possible to test the theory and
equipment without using live animals in the laboratory.
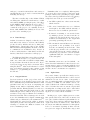
Figure 5: The epoxy treated wood shows little
sign of degradation, while the non-treated control piece has become discoloured and has had
pieces fall off around the edge upon handling
after the experiment, suggesting fragility.
Firstly, an effective BMR was calculated for a
single 10g paraffin wax burner - that is, the value
obtained from equation 11 from a single paraffin wax
burner inside the OSCaR. This is so that a comparison between a particular animal and a certain
number of paraffin wax burners can be made. Three
10g paraffin wax burners were measured and an average value was used.
To simulate animals with different sizes, cardboard boxes of varying volume (V), entrance hole
area (A), and entrance hole length (L) were used
in replacement of the OSCaR nesting box. Varying
numbers of paraffin wax burners (N) were placed
inside the boxes, to simulate animals of varying resFigure 6: It is clear that cracks have appeared
piratory rates.
parallel to the grain lines in the original pieces
For 14 different combinations of box dimensions of wood that make up the laminations. It
and number of burners, 5 plots of oxygen concentra- should also be noted that delamination of the
tion vs. time were made. The plots were studied layers in beginning to occur.
to assess the feasibility of using the technique on animals with similar oxygen consumption and similar The accelerated weathering of the differently treated
nest box dimensions. The dimensions of the boxes wood types yielded significantly different results afand the number of paraffin wax burners used in each ter 2 weeks of wet-dry cycling. Figure 5 shows a
10
side-by-side comparison of the two pieces. Other is- fore a 10000mAh pair of PP9 batteries would last
sues become apparent with the control sample when approximately 33 hours while the 4000mAh lead-acid
viewed along the laminations, as seen in figure 6.
batteries used would give about 13 hours of operation.
Comparatively, neither of the effects in figure 6
The measured current draw tallies very well with
can be seen in the wood that was coated with epoxy the theoretical estimation obtained by adding up the
resin, shown in figure 7:
specified power consumption of all the system components, which came to 298.5mA. A full table of these
results is shown in appendix VI.
5.3
Hamster BMR Investigation
The hamster test subject used the device readily and
became comfortable in the device for the duration of
the test period, entering and exiting the device at will,
and crucially spending a reasonable amount of time
in the device.
Figure 7: The epoxy coating appears to have
kept water out of the wood, leaving it in a better condition after weathering.
5.1.2
Dunk Tests
The dunk test of the control box was carried out
twice. The first test yielded approximately 6mm of
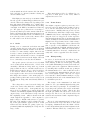
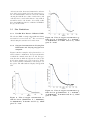
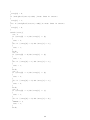
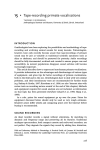
Figure 8: Oxygen level vs. time for hamster.
water in the bottom of the box after 30 minutes,
Error bars from sensor resolution.
which equates to approximately 135ml and a flow
-1
rate of 0.075ml s .
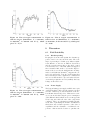
The variation of oxygen in the device from the respiration
of the hamster is as expected. The drop to
It was thought that this leakage was most likely
steady
state
can be seen in figure 8, occurring after
coming in through the corner seals of the door, which
only
about
190
seconds. BMR calculations that were
were subsequently improved and the box re-tested.
made
after
this
190
seconds using the methods shown
This test yielded less than 1mm of water after 30 minin
sections
3.2
and
3.3.3, and gave the BMR of this
utes.
hamster to be 22.4±2.8 kcal day-1 .
5.2
Battery Life Testing
Using a multimeter to measure the current from the
power source to the Arduino suggests that the whole
system draws between 270 and 300mAh – the higher
the voltage of the battery, the higher the current.
This is most likely due to the power loss from the
regulation of voltage to 5V, which increases with
voltage above 5V.
5.4
Results from Bristol Zoological
Gardens
Originally the device directly replaced the nesting box
already in the enclosure, secured to a section of tree
branch. Unfortunately the branch itself was unable to
safely support the weight of the device, leading to the
immediate removal of the device from the branch after two days for the safety of the animals. The device
Taking a conservative estimate, this current yields was then placed on supports on a shelf at the back of
a battery lifetime of 3.3 hours per 1000mAh – there- the enclosure where the lemurs are fed. In the period
11
of these four weeks, the mouse lemurs in the enclosure
were only logged as in the box by the system for a total of around 6 minutes. Most records of the animals
entering the OSCaR were visits of under 20 seconds
each and most occured in the first two days, while it
was still secured to the branch. As a result of this,
there was insufficient data for calculation of BMR for
the grey mouse lemur.
5.5
5.5.1
Size Limitations
Paraffin Wax Burner - Effective BMR
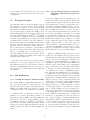
The effective BMR of a single 10g paraffin wax burner Figure 10: Plot of oxygen concentration vs.
was found to be 13±1.5 kcal day-1 . The error was cal- time for box 8 (dimensions: V = 0.0353m3 ;
culated using the standard error in the mean.
A=0.001963m2 ; L=0.04m and N=3), which
gives T = 210s.
5.5.2
Oxygen Concentrations in Varying Box
Dimensions and Varying Oxygen Consumption
Figures 9-14 show examples of the plots made for certain box-burner combinations. T1 represents the time
at which the animal enters the box and T2 represents the time at which steady state is reached. The
steady state waiting period (T) is given by T2-T1.
For each box-burner combination, T is averaged over
the 5 plots. The full results are displayed in appendix
VII.
Figure 11: Plot of oxygen concentration vs.
time for box 9 (dimensions: V = 0.0734m3 ;
A=0.001963m2 ; L=0.017m and N=3), which
gives T = 496s.
Figure 9: Plot of oxygen concentration vs.
time for box 6 (dimensions: V = 0.00670m3 ;
A=0.001963m2 ; L=0.04m and N=3), which
gives T = 131s.
12
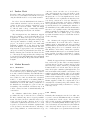
Figure 12: Plot of oxygen concentration vs.
time for box 11 (dimensions: V = 0.0734m3 ;
A=0.0177m2 ; L=0.017m and N=3), which
gives T = N/A.
Figure 14: Plot of oxygen concentration vs
time for box 14 (dimensions: V = 0.0734m3 ;
A=0.0177m2 ; L=0.15m and N=7), which gives
T = 230s.
6
6.1
6.1.1
Discussion
Field Suitability
Weatherproofing
Keeping the electronics safe against the elements appears to have been a success in lab tests. The technique of preserving wood with epoxy makes a significant difference to the rate at which it deteriorates
and the general waterproofing of the whole control
box was achieved too. The first dunk test suggested
there was still a little work to do but after improvements to the door seals, the small amount of leakage
in the second dunk test (0.01ml s-1 ) suggests the control box is well sealed. It is also worth noting that
these tests subjected the equipment to conditions far
more severe than would be expected in the field; under normal precipitation it is very unlikely that any
leakage at all would occur.
6.1.2
Power Supply
The longest lasting power supply available was a pair
Figure 13: Plot of oxygen concentration vs. of 9V PP9s, which could power the system for around
time for box 12 (dimensions: V = 0.0734m3 ; 33 hours – this was good, but fell far short of the 72+
A=0.0177m2 ; L=0.017m and N=7), which hour lifetime that was hoped for. This was for a variety of reasons, the first being the power consumption
gives T = 128s.
of the Ethernet shield, which can be seen in appendix
VI as being more than all of the other components
combined. There are alternatives available though:
at the time of purchasing the Arduino and Ethernet
shield, there was a relative ignorance of the device’s
capabilities and the abundance of additional components – this meant the decision to purchase the
13
Ethernet shield was rushed as it was an Arduino pro- it was decided to carry out an investigation as to
duced add-on with the necessary functions.
practicalities and cost efficacy of adding solar cells to
the instrument that could charge the battery when
Were it known that there were other shields avail- it was sunny. A typical circuit for this is shown in
able from third party manufacturers that were solely figure 15.
SD card interfaces without the energy wasting Ethernet chip, one of these would have been chosen –
Such a set up could be created for around £60
furthermore, just after purchase, Arduino released (using Solarex 7.5V Solar Cells from RS Components)
a new version of their wireless shield with an SD and would greatly extend the running time of the sysinterface; this too would have been perfect as this tem. A small simulation was run using climate data
particular shield did not come with a wireless chip from the west of Madagascar (a typical field location
and antenna as standard (it had to be purchased for the box) to calculate how long the device could
separately) so was essentially a bare-bones SD card last with a 15Ah battery and 300mA of solar cells.
reader/writer – a device like this could approximately Depending on the time of year, this could extend bathalve power draw to 150mAh. A separate advantage tery life to be between 8 and 41 days, with 21 days (3
of one of the third party options is that they use weeks) being the average, which should be adequate
normal sized SD cards, which are much cheaper than for most field studies. It is also likely that these estitheir micro-SD counterparts.
mates are conservative, as they were made using just
sunshine hours, not considering the fact that solar
The other reason for short battery life was that at cells will still generate some power even when it is
the time of finalising cuts for the instrumentation box, cloudy.
a combination of a lower expected power usage and
unrealistic expectations about battery technology (in
terms of energy density) led to too little space being 6.2 Hamster BMR Investigation
allocated for batteries. If the control box were made The result of the measured BMR can be directly
approximately 50mm longer, it would give space for a compared to a previous more in depth investiga15Ah lead-acid battery, which, when combined with tion of the BMR of the Djungarian hamster using
power saving measures outlined above could give a flow through gas respirometry. The result from this
running time of 100 hours (approximately 4 days).
method gave a BMR of 17.28 kcal day-1[25] . This
6.1.3
result is slightly lower than the observed result in
the OSCaR of 22.4±2.8 kcal day-1 . However this is
expected as the hamster subject was not in the device
long enough to be truly at rest, and had not been isolated from food to neglect effects of digestion. These
factors would have caused the actual metabolic rate
of the hamster to have been raised from its BMR,
which is represented in the results recorded.
Solar Panel Investigation
The error value of ±2.8 kcal day-1 was calculated
by combining the errors associated with each variable in equation 11. As mentioned in section 2.4.2,
the error associated with using a value of 4.8 kcal
l-1 is ±6%. The error in oxygen concentrations and
temperature are assumed to be the resolution of the
LuminOx oxygen sensor, ±0.01% and ±2 degrees reFigure 15: An example circuit for solar charg- spectively. The errors in the radius of the entrance
ing the instrument batteries. The Zener diode hole and the entrance hole length are ±0.05mm. The
prevents the batteries discharging over the error in the diffusion coefficient was calculated using
cells at night and also helps prevent overcharg- regression analysis of the straight line given by equaing by allowing charge flow to reverse if the tion 7.
battery voltage becomes too high.
The hamster test also proved the capability of
The estimated battery life, even with a larger battery the animal detection system with live animals, which
and lower power consumption, was still not ideal, so worked flawlessly, but raised issues of power capabil-
14
ity as potential data was forfeited due to the device 6.4.2
loosing power earlier than expected in the 48 hour
testing period.
6.3
Oxygen Concentrations in Varying Box
Dimensions with Varying Oxygen Consumption
To use the technique developed in this project, the
system must satisfy certain conditions. Firstly, it is
required that the system reaches steady state before
any measurements of oxygen concentrations can be
used in the calculation of BMR. Therefore, it is necessary that T is relatively small in comparison to the
time for which the nest box is occupied. By analysis of the table in appendix VII, it is seen that T is
decreased by decreasing N, decreasing V, decreasing
L and increasing A. While the time taken to reach
steady state is an important factor in considering
whether this technique may be applied to a certain
species, within the range of these tests T remains
within a practical value, so long as the species in
question typically occupies their nesting box for periods longer than 10 minutes. T may become too large,
however, for animals that use large nest boxes with
small entrance holes or for very large animals.
Zoological Gardens
The main issue with recording data with the mouse
lemurs in the zoo enclosure was neophobia. Animals
in captivity are known to be more neophobic than
wild animals, and this neophobia has been recorded
in previous attempts to measure the BMR of these
lemurs, although this device was left for a much longer
time period than in these attempts[17][18] . The lemurs
were much more inquisitive about the box whilst it
was in the position that they are accustomed to using
a standard nest box. However, after the original position became unsafe for the animals, and the device
was moved to the feeding shelf, a part of the enclosure where they were not used to using a nesting box,
they became far more reluctant to even investigate
the device for brief periods of time. The keepers were
asked to occasionally place food inside the box to
entice the lemurs in, but it is clear from the collected
Much more significant, is the consequence of backdata that the animals would simply retrieve this food ground noise. The difference between oxygen concenand immediately exit the box.
trations inside and outside the box must be large with
respect to the level of fluctuations. Ultimately, the
Even after four weeks of the box being present, the technique developed through this project will become
lemurs were not noticeably using the box any more unsuitable for species where the level of BMR is low
than when it was moved, and would have unfortu- and the volume of the nesting box is comparatively
nately needed significantly more time to become ac- large, as is modelled by box 11. Figure 12 shows that
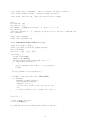
customed to the box in its position on the shelf than for this type of system, fluctuations in the oxygen
was available.
concentrations are too great to establish steady state.
Box 12 has the same dimensions as box 11 however,
it contains 4 more burners. It can be seen from figure
13 that steady state is established in box 12 and the
6.4 Size Limitations
fluctuations are relatively small in comparison to the
6.4.1 Paraffin Wax Burner - Effective BMR difference between oxygen concentrations inside and
outside of the box. Box 12 contains 7 burners; this is
The effective BMR of a 10g paraffin wax burner does representative of an animal with a BMR of approxnot represent the number of calories that are com- imately 91 kcal day-1 . This corresponds to a mass
busted by the burner, rather it suggests what the of 1.4kg, using equation 2. It is therefore concluded
BMR of an animal, with the same rate of oxygen that, to use the technique developed in this project,
consumption, would be, as calculated by the OSCaR. 1.4kg is an approximate lower bound for the mass
of an animal inside a box of volume approximately
If Kleiber’s law, as described in section 2.3, is 0.1m3 . Animals of lower mass may be considered by
assumed to be accurate, then using equation 2, we lowering V, as demonstrated by the lower levels of
find that the effective BMR of the 10g paraffin wax noise observed in figure 9 compared with figure 10.
burner (13±1.5 kcal day-1 ) is approximately equal to Alternatively, animals of lower mass may be considthe BMR that would be calculated for an animal of ered by lowering A, demonstrated by the lower levels
mass 0.12kg. The mass of the Grey Mouse Lemur of noise observed in figure 11 compared with figure
ranges from 58-67g[26] . This suggests that two mouse 12, or by increasing L demonstrated by the lower levlemurs can well be modelled by a single paraffin wax els of noise observed in figure 14 compared with figure
burner.
13.
15
6.5
Further Work
From the results of the investigation in section 6.1.3,
it is clear to see that further research into solar powering the OSCaR would be a very useful extension.
In order to leave the OSCaR inside the lemur enclosure without attendance and for extended periods
of time, it may prove useful to investigate powering the device from the mains. This can simply
be achieved with a cheap, commercially available
adapter, which plugs directly into the Arduino.
The investigation into size limitations suggests
that the technique conceived through this project
is applicable to many other species. It is proposed
that further exploration into using this technique with
other specific animals is a fitting extension to the
project. It would be practical for use with small
mammals of similar size to the Grey mouse lemur
such as the Kangaroo rat and the Kowari. The technique may also be appropriate for use on many different species of birds, in particular the Inca Tern, the
Lilacine Amazon parrot and the Red-Vented Cockatoo. The study also suggests that the technique may
be practical for use with significantly larger mammals
and birds, specifically the Red panda and the African
Penguin.
6.6
6.6.1
Market Research
Motivation
The motivation behind building the calorimeter was
as an industrial project, which prompted consideration of the commercial viability of the OSCaR. Once a
working device was created a market research survey
was conducted to find out whether the calorimeter
would be a viable method of measuring BMR for
researchers and gamekeepers at other zoological establishments across the UK. Other potential uses of
the OSCaR were investigated to gain a better understanding of how useful the calorimeter may be in
a wider context, in terms of animal husbandry and
conservation.
Dr. Schwitzer outlined three distinct groups of
specialists who may be interested in a calorimeter,
the first of which being other zoological gestablishments. He advised, however, that there may not get
a huge response from his colleagues; most zoos are
conservative organizations and tend not to be overly
receptive to new ideas. Dr. Schwitzer explained that
a new product is often first showcased, following a
paper being published, at an international zoology
16
conference, but it can take over a decade and require endorsement from a respected member of the
scientific community, such as him, before it will be
integrated into zoos on any significant scale. In addition, BZG is a rare organisation in that they have
very strong connections to both the University of
Bristol and the University of the West of England
and is particularly research led. Most zoos are not
specifically interested in optimising the nutrition of
the animals they house; unlike in livestock husbandry,
there is no cost or quality benefit to tailoring nutrition
plans as animals are primarily there for decoration.
Nonetheless, there is a distinct group of zoos that
specialize in nutrition and/or research that would be
worth contacting.
Dr. Schwitzer also suggested targeting American universities; Zoos in the US tend to outsource
nutrition plans to universities who have specialised
animal nutrition departments. He noted that broadly
speaking, European zoos feed animals a fresh diet
that includes a wide variety of fruit and vegetables,
whilst animals in American zoos are mainly fed in the
form of pellets. It would be interesting to compare
the BMR of captive lemurs raised on very different
diets.
Finally, he suggested that feed manufacturers may
have a use for the product. There are many nutrition
problems that are specific to lemurs, such as obesity
and iron storage disease, which are potentially fatal.
Lemurs should not be fed the same diet as other primates and require a nutrition plan high in fibre, low
in iron and with readily available carbohydrate. As a
nutrition and lemur specialist, other zoos frequently
ask Dr. Schwitzer what they should feed their captive
lemurs and he imagines there would be a large market for a lemur-specific range of feed. He highlighted
Mazuri, supplier to BZG, as a company who do not
currently have a lemur-specific pellet available. They
may be interested in using a calorimeter to develop a
new range of feed.
6.6.2
Survey
Primarily this investigation involved an online survey sent to various establishments who we identified
as potential users of such a device. The survey also
aimed to find out if these establishments already had
devices for measuring BMR, whether using open or
closed calorimetry, and any issues they had with the
device they had, and the expected cost of such a device. A subsequent set of questions included details
questioning what the device may be used for and what
species each establishment would have specific interest in.
and all responses have been included in the appendix
VIII.
6.6.4
6.6.3
Results
An encouraging 25% of establishments invited to partake in the survey responded. Zoological institutions
with research departments were specifically targeted,
of which 100% of the replies indicated that they would
have use for such a device for various purposes for a
range of species. The majority of species indications
were for small nesting mammals and birds. Interestingly, two institutions expressed direct interest in
measuring the metabolic rates of large cats (in dens)
with such a technique.
Conclusion
From the responses to this survey it can be assumed
that their is an interest and a market for an open system metabolic calorimeter both in zoological and academic establishments. Cost would be the main issue,
but this device is much cheaper to produce than most
respondents would expect to pay, indicating that this
device could be a viable option for many establishments, and therefore could be a marketable device.
7
Conclusion
The project was successful in creating a device capable of providing a non-intrusive and indirect measurement of the BMR of the Grey mouse lemur using
an open system calorimetry respirometer. Unfortunately no value of BMR for a lemur was obtained,
as the lemurs did not use the nest box for periods of
time long enough to retrieve useful data. Investigation into the BMR of the Djungarian hamster yielded
Only one academic institution responded and gave a result of 22.4±2.8 kcal day-1 , which is close to
limited information about the closed system calorime- the expected value for this species, and was evidence
ters they currently had in use. They also indicated that the device is a viable method of measuring BMR.
that they would still be interested in an open system
The project achieved the objectives outlined by
device.
BZG, which were that the calorimeter should be
While it is excellent that 100% of the replies in- portable, inexpensive, able to withstand the extremes
dicated a use for the device, it is important to con- of temperature and humidity expected in Madagascar
sider a bias where representatives of institutions not and, most importantly, be non-intrusive.
immediately interested in the idea as outlined in the
letter sent to them may have not been willing to spare
The theoretical size limitations of the device were
time from their busy schedules to fill in the survey at considered and several other species were identified
all, whereas representatives interested have taken the as potential candidates to which this method of open
time to express this interest. The full set of questions system calorimetry respirometry could be applied.
None of the zoological institutions that responded
already had a device capable of measuring the BMR
of an animal, and many indicated that tight budgets
may prevent the purchase of such a device. Most
institutions expected such a device to cost thousands
of pounds, but all indicated they would not buy such
a device at this expected cost.
17
Appendices
Appendix I - Circuit Diagram
Circuit diagram showing the electronic layout of components that make the instrument.
Appendix II - Complete Arduino Code
#i n c l u d e <Arduino . h>
#i n c l u d e <SD . h>
#i n c l u d e <S o f t w a r e S e r i a l . h>
#d e f i n e
#d e f i n e
#d e f i n e
#d e f i n e
rxPininside 2
txPininside 3
rxPinoutside 5
txPinoutside 6
SoftwareSerial mySerialin ( rxPininside , txPininside ) ;
SoftwareSerial mySerialout ( rxPinoutside , txPinoutside ) ;
// The two v a l u e s below MUST be i n d i v i d u a l i s e d f o r a n e s t box
iii
c o n s t d o u b l e Area = 0 . 0 0 2 2 0 6 ; // Area o f e n t r a n c e i n m e t r e s s q u a r e d
c o n s t d o u b l e Length = 0 . 0 3 6 ; // e n t r a n c e l e n g t h i n m e t r e s
c o n s t d o u b l e i n t e r v a l =10; // time i n t e r v a l between r e a d i n g s
long t ;
i n t s e n s o r 0 = A0 ;
i n t s e n s o r 1 = A1 ;
i n t lemnum = 0 ,numnow=0, i n i t i a l = 1 , s t a t e = 1 , i = 0 ;
int array [ 2 ] ;
c o n s t i n t c h i p S e l e c t = 4 ; / / c h i p S e l e c t p i n needed f o r i n t e r f a c e with SD c a r d
File dataFile ;
d o u b l e mass , masssum ;
d o u b l e i n t e r c e p t O f f s e t =0;
d o u b l e BMR,BMRsum,BMRnow, BMRday, D, avtemp ;
d o u b l e P e r c e n t a g e ( ) , Temp ( ) ;
d o u b l e p e r c e n t i n , p e r c e n t o u t , tempin , tempout ;
i n t h , j , k , E , Run ;
c h a r c [ 8 ] , c2 [ 6 ] , d [ 8 ] , d2 [ 6 ] ;
void setup ( ) {
S e r i a l . begin (9600);
pinMode ( 1 0 , OUTPUT) ;
S e r i a l . p r i n t l n ( " I n i t i a l i z i n g SD c a r d . . . " ) ;
i f ( ! SD . b e g i n ( c h i p S e l e c t ) )
{
S e r i a l . p r i n t l n ( " c a r d f a i l e d , o r not p r e s e n t " ) ;
return ;
}
S e r i a l . p r i n t l n (" card i n i t i a l i z e d " ) ;
}
d a t a F i l e = SD . open ( " data . t x t " , FILE_WRITE ) ;
i f ( dataFile )
{ d a t a F i l e . p r i n t l n ( " Setup " ) ;
S e r i a l . p r i n t l n ( " Setup " ) ;
dataFile . close ( ) ; }
// i f t h e f i l e doesn ’ t open , pop up an e r r o r
else
{ S e r i a l . p r i n t l n (" e r r o r opening f i l e . txt " ) ; }
void loop ( ) {
// s t a r t animal d e t e c t i o n
t =0; k=0; BMRsum=0;
i f ( analogRead ( s e n s o r 0 ) <600)// mouse lemur i n e n t r a n c e
{
iv
array [ 0 ] = 1;
}
e l s e i f ( analogRead ( s e n s o r 0 ) >=600)// no mouse lemur i n e n t r a n c e
{
array [ 0 ] = 0;
}
i f ( analogRead ( s e n s o r 1 ) <600) // mouse lemur i n e n t r a n c e
{
array [ 1 ] = 1;
}
e l s e i f ( analogRead ( s e n s o r 1 ) >=600)// no mouse lemur i n e n t r a n c e
{
array [ 1 ] = 0;
}
switch ( s t a t e ){
case 1:
i f ( ( a r r a y [ 0 ] == 1 ) && ( a r r a y [ 1 ] == 0 ) )
{
state = 2;
}
e l s e i f ( ( a r r a y [ 0 ] == 0 ) && ( a r r a y [ 1 ] ==
{
state = 5;
}
break ;
case 2:
i f ( ( a r r a y [ 0 ] == 0 ) && ( a r r a y [ 1 ] == 0 ) )
{
state = 1;
}
e l s e i f ( ( a r r a y [ 0 ] == 1 ) && ( a r r a y [ 1 ] ==
{
state = 3;
}
break ;
case 3:
i f ( ( a r r a y [ 0 ] == 1 ) && ( a r r a y [ 1 ] == 0 ) )
{
state = 2;
}
e l s e i f ( ( a r r a y [ 0 ] == 0 ) && ( a r r a y [ 1 ] ==
{
state = 4;
}
break ;
case 4:
i f ( ( a r r a y [ 0 ] == 1 ) && ( a r r a y [ 1 ] == 1 ) )
{
state = 3;
}
e l s e i f ( ( a r r a y [ 0 ] == 0 ) && ( a r r a y [ 1 ] ==
{
lemnum+= 1 ;
v
1))
1))
1))
0))
state = 1;
}
break ;
case 5:
i f ( ( a r r a y [ 0 ] == 0 ) && ( a r r a y [ 1 ] == 0 ) )
{
state = 1;
}
e l s e i f ( ( a r r a y [ 0 ] == 1 ) && ( a r r a y [ 1 ] == 1 ) )
{
state = 6;
}
break ;
case 6:
i f ( ( a r r a y [ 0 ] == 0 ) && ( a r r a y [ 1 ] == 1 ) )
{
state = 5;
}
e l s e i f ( ( a r r a y [ 0 ] == 1 ) && ( a r r a y [ 1 ] == 0 ) )
{
state = 7;
}
break ;
case 7:
i f ( ( a r r a y [ 0 ] == 1 ) && ( a r r a y [ 1 ] == 1 ) )
{
state = 6;
}
e l s e i f ( ( a r r a y [ 0 ] == 0 ) && ( a r r a y [ 1 ] ==0))
{
lemnum−=1;
state = 1;
}
break ;
}
// end animal d e t e c t i o n
numnow=lemnum ;
w h i l e ( lemnum == i n i t i a l ) // w h i l e animal p r e s e n t t a k e data
{
t +=1;
// S e r i a l . p r i n t l n ( t ) ;
d e l a y ( 1 ) ; // s l o w s t h e time l o o p s l i g h t l y ( 1 m i c r o s e c o n d )
i f ( ( t !=0)&& ( t %6500==0)&&(t <13000)) // i g n o r e s v a l u e s taken below e q u i l i b r a t i o n time
{
Percentage ( ) ;
S e r i a l . p r i n t ("%O2 i n s i d e ="); S e r i a l . p r i n t ( p e r c e n t i n ) ; S e r i a l . p r i n t ( " %\t \ t " ) ;
S e r i a l . p r i n t ("%O2 o u t s i d e ="); S e r i a l . p r i n t ( p e r c e n t o u t ) ; S e r i a l . p r i n t l n ( " %");
d a t a F i l e = SD . open ( " data . t x t " , FILE_WRITE ) ;
i f ( dataFile )
{ dataFile . print ( percentin ) ;
vi
dataFile .
dataFile .
dataFile .
// i f t h e
else
{ Serial .
p r i n t ("\ t " ) ;
println ( percentout ) ;
close (); }
f i l e doesn ’ t open , pop up an e r r o r
p r i n t l n (" e r r o r opening f i l e . txt " ) ; }
}
e l s e i f ( ( t >13000)&&( t %6500==0)) // main data r e a d i n g s e q u e n c e .
{
Percentage ( ) ;
Temp ( ) ;
S e r i a l . p r i n t ("%O2 i n s i d e ="); S e r i a l . p r i n t ( p e r c e n t i n ) ; S e r i a l . p r i n t ( " %\t \ t " ) ;
S e r i a l . p r i n t ("%O2 o u t s i d e ="); S e r i a l . p r i n t ( p e r c e n t o u t ) ; S e r i a l . p r i n t l n ( " %");
d a t a F i l e = SD . open ( " data . t x t " , FILE_WRITE ) ;
i f ( dataFile )
{ dataFile . print ( percentin ) ;
d at aF i le . p r i n t ("\ t " ) ;
dataFile . println ( percentout ) ;
dataFile . close ( ) ; }
// i f t h e f i l e doesn ’ t open , pop up an e r r o r
else
{ S e r i a l . p r i n t l n (" e r r o r opening f i l e . txt " ) ; }
avtemp =(( tempin+tempout ) / 2 ) + 2 7 3 . 1 5 ; / / c o n v e r t t o K e l v i n
D= ( 0 . 1 2 ∗ ( avtemp ) −14.878)∗ pow ( 1 0 , − 6 ) ;
BMRnow=(( p e r c e n t o u t −p e r c e n t i n ) / Length ) ∗D∗ 4 8 . 5 7 ∗ i n t e r v a l ∗ Area ;
i f ( (BMRnow >= 0)&&( p e r c e n t i n >5))
{
BMRsum+=BMRnow;
S e r i a l . p r i n t l n (BMRsum, 1 0 ) ;
masssum+=massFinder ( i n t e r c e p t O f f s e t ) ;
k+=1;
}
}
e l s e i f ( ( p e r c e n t i n >5)&&( p e r c e n t o u t >5))
{
masssum+=massFinder ( i n t e r c e p t O f f s e t ) ;
k+=1;
}
i f ( t ==26000)
{
t =19500;
}
// s t a r t monitor animal d e t e c t i o n i n t h i s l o o p
i f ( analogRead ( s e n s o r 0 ) <600) // mouse lemur i n e n t r a n c e
{
array [ 0 ] = 1;
}
e l s e i f ( analogRead ( s e n s o r 0 ) >=600)// no mouse lemur i n e n t r a n c e
vii
{
array [ 0 ] = 0;
}
i f ( analogRead ( s e n s o r 1 ) <600) // mouse lemur i n e n t r a n c e
{
array [ 1 ] = 1;
}
e l s e i f ( analogRead ( s e n s o r 1 ) >=600)// no mouse lemur i n e n t r a n c e
{
array [ 1 ] = 0;
}
switch ( s t a t e ){
case 1:
i f ( ( a r r a y [ 0 ] == 1 ) && ( a r r a y [ 1 ] == 0 ) )
{
state = 2;
}
e l s e i f ( ( a r r a y [ 0 ] == 0 ) && ( a r r a y [ 1 ] ==
{
state = 5;
}
break ;
case 2:
i f ( ( a r r a y [ 0 ] == 0 ) && ( a r r a y [ 1 ] == 0 ) )
{
state = 1;
}
e l s e i f ( ( a r r a y [ 0 ] == 1 ) && ( a r r a y [ 1 ] ==
{
state = 3;
}
break ;
case 3:
i f ( ( a r r a y [ 0 ] == 1 ) && ( a r r a y [ 1 ] == 0 ) )
{
state = 2;
}
e l s e i f ( ( a r r a y [ 0 ] == 0 ) && ( a r r a y [ 1 ] ==
{
state = 4;
}
break ;
case 4:
i f ( ( a r r a y [ 0 ] == 1 ) && ( a r r a y [ 1 ] == 1 ) )
{
state = 3;
}
e l s e i f ( ( a r r a y [ 0 ] == 0 ) && ( a r r a y [ 1 ] ==
{
lemnum += 1 ;
state = 1;
}
break ;
viii
1))
1))
1))
0))
case 5:
i f ( ( a r r a y [ 0 ] == 0 ) && ( a r r a y [ 1 ] == 0 ) )
{
state = 1;
}
e l s e i f ( ( a r r a y [ 0 ] == 1 ) && ( a r r a y [ 1 ] == 1 ) )
{
state = 6;
}
break ;
case 6:
i f ( ( a r r a y [ 0 ] == 0 ) && ( a r r a y [ 1 ] == 1 ) )
{
state = 5;
}
e l s e i f ( ( a r r a y [ 0 ] == 1 ) && ( a r r a y [ 1 ] == 0 ) )
{
state = 7;
}
break ;
case 7:
i f ( ( a r r a y [ 0 ] == 1 ) && ( a r r a y [ 1 ] == 1 ) )
{
state = 6;
}
e l s e i f ( ( a r r a y [ 0 ] == 0 ) && ( a r r a y [ 1 ] ==0))
{
lemnum −= 1 ;
state = 1;
}
break ; }
}
// end animal d e t e c t i o n m o n i t o r i n g i n t h i s l o o p
i f ( lemnum != 0 )
{
i n i t i a l = lemnum ;
S e r i a l . p r i n t l n ( " lemnumchange " ) ;
d a t a F i l e = SD . open ( " data . t x t " , FILE_WRITE ) ;
i f ( dataFile )
{ d a t a F i l e . p r i n t ( " lemnum change \ t " ) ;
d a t a F i l e . p r i n t l n ( lemnum ) ;
dataFile . close ( ) ; }
// i f t h e f i l e doesn ’ t open , pop up an e r r o r
else
{ S e r i a l . p r i n t l n (" e r r o r opening f i l e . txt " ) ; }
}
S e r i a l . p r i n t l n ( lemnum ) ;
i f ( lemnum==0)
{
ix
i n t e r c e p t O f f s e t=analogRead (A2 ) ;
}
// v a r i a b l e t o r e c a l i b r a t e t h e s c a l e t o z e r o when no
// l e m u r s a r e p r e s e n
E=0;
i f ( lemnum>=15) // c o u n t e r e r r o r , happens when t h e l i n e o f s i g h t
// between LED and d e t e c t o r i s on a s l i g h t a n g l e
{
E=1;
lemnum=0;
}
i f ( lemnum<0) // c o u n t e r e r r o r , happens when t h e l i n e o f s i g h t
// between LED and d e t e c t o r i s on a s l i g h t a n g l e
{
E=2;
lemnum=0;
}
i f ( ( t != 0 ) && ( k ! = 0 ) ) // c a l c u l a t e s and p r i n t s BMR a f t e r l a s t animal l e a v e s
{
d a t a F i l e = SD . open ( " data . t x t " , FILE_WRITE ) ;
// i f t h e f i l e i s a v a i l a b l e w r i t e t o i t
i f ( dataFile )
{
Run+=1;
BMR=(BMRsum/k ) /numnow ;
BMRday=(86400/ i n t e r v a l ) ∗BMR;
// p r i n t a l l data c o l l e c t e d t o SD
S e r i a l . p r i n t (Run ) ; d a t a F i l e . p r i n t (Run ) ;
S e r i a l . p r i n t ( " Number o f a n i m a l s :
" ) ; S e r i a l . p r i n t (numnow ) ;
d a t a F i l e . p r i n t ( " Number o f a n i m a l s :
" ) ; d a t a F i l e . p r i n t (numnow ) ;
S e r i a l . p r i n t ( " BMR="); d a t a F i l e . p r i n t ( " \tBMR=");
S e r i a l . p r i n t (BMRday, 1 0 ) ; d a t a F i l e . p r i n t (BMRday, 1 0 ) ;
S e r i a l . p r i n t ( " \ t with " ) ; d a t a F i l e . p r i n t ( " \ t with " ) ;
Serial . print (k ) ; dataFile . print (k ) ;
S e r i a l . p r i n t ( " r e a d i n g s taken " ) ; d a t a F i l e . p r i n t ( " r e a d i n g s taken " ) ;
mass=(masssum/k ) /numnow ;
S e r i a l . p r i n t ( " \ tmass ="); S e r i a l . p r i n t ( mass ) ;
d a t a F i l e . p r i n t ( " \ tmass ="); d a t a F i l e . p r i n t ( mass ) ;
Temp ( ) ;
S e r i a l . p r i n t ( " \ tT ="); S e r i a l . p r i n t ( tempout ) ;
d a t a F i l e . p r i n t ( " \ tT ="); d a t a F i l e . p r i n t ( tempout ) ;
i f (E==0)
{ Serial . println ( ) ; dataFile . println ();}
e l s e i f (E==1)
{ S e r i a l . p r i n t l n ( " \ t E r r o r 1 : Animal c o u n t e r e r r o r " ) ;
d a t a F i l e . p r i n t l n ( " \ t E r r o r 1 : Animal c o u n t e r e r r o r " ) ; }
e l s e i f (E==2)
{ S e r i a l . p r i n t l n ( " \ t E r r o r 2 : N e g a t i v e animal count " ) ;
d a t a F i l e . p r i n t l n ( " \ t E r r o r 2 : N e g a t i v e animal count " ) ; }
dataFile . close ( ) ;
x
numnow=lemnum ;
}
// i f t h e f i l e doesn ’ t open , pop up an e r r o r
else
{
S e r i a l . p r i n t l n ( " e r r o r o p e n i n g lemur . t x t " ) ;
}
}
}
d o u b l e P e r c e n t a g e ( ) // Here b e g i n s t h e l i s t o f f u n c t i o n s f o r v a r i o u s data c a p t u r e
{
h=0; j =0;
mySerialin . begin (9600);
m y S e r i a l i n . w r i t e ("%\ r \n " ) ;
delay ( 1 3 ) ;
while ( mySerialin . a v a i l a b l e ( ) > 0) {
c [ h]= m y S e r i a l i n . r e a d ( ) ;
h+=1;
}
mySerialout . begin (9600);
m y S e r i a l o u t . w r i t e ("%\ r \n " ) ;
delay ( 1 3 ) ;
while ( mySerialout . a v a i l a b l e ( ) > 0) {
d [ j ]= m y S e r i a l o u t . r e a d ( ) ;
j +=1;
}
c2 [ 0 ] = c [ 2 ] ; d2 [ 0 ] = d [ 2 ] ; // c u t s t h e l e t t e r o f f t h e data r e t u r n e d by t h e
c2 [ 1 ] = c [ 3 ] ; d2 [ 1 ] = d [ 3 ] ; // s e n s o r s o i t can be c o n v e r t e d t o a d o u b l e
c2 [ 2 ] = c [ 4 ] ; d2 [ 2 ] = d [ 4 ] ;
c2 [ 3 ] = c [ 5 ] ; d2 [ 3 ] = d [ 5 ] ;
c2 [ 4 ] = c [ 6 ] ; d2 [ 4 ] = d [ 6 ] ;
c2 [ 5 ] = c [ 7 ] ; d2 [ 5 ] = d [ 7 ] ;
}
p e r c e n t i n = a t o f ( c2 ) ; // c o n v e r s i o n from s t r i n g t o d o u b l e
p e r c e n t o u t = a t o f ( d2 ) ;
return ( percentin , percentout ) ;
d o u b l e Temp ( )
{
h=0; j =0;
mySerialin . begin (9600);
m y S e r i a l i n . w r i t e ( "T\ r \n " ) ;
delay ( 7 ) ;
while ( mySerialin . a v a i l a b l e ( ) > 0) {
c [ h]= m y S e r i a l i n . r e a d ( ) ;
h+=1;
xi
}
mySerialout . begin (9600);
m y S e r i a l o u t . w r i t e ( "T\ r \n " ) ;
delay ( 7 ) ;
while ( mySerialout . a v a i l a b l e ( ) > 0) {
d [ j ]= m y S e r i a l o u t . r e a d ( ) ;
j +=1;
}
c2 [ 0 ] = c [ 2 ] ;
c2 [ 1 ] = c [ 3 ] ;
c2 [ 2 ] = c [ 4 ] ;
c2 [ 3 ] = c [ 5 ] ;
c2 [ 4 ] = c [ 6 ] ;
c2 [ 5 ] = c [ 7 ] ;
d2 [ 0 ] = d [ 2 ] ;
d2 [ 1 ] = d [ 3 ] ;
d2 [ 2 ] = d [ 4 ] ;
d2 [ 3 ] = d [ 5 ] ;
d2 [ 4 ] = d [ 6 ] ;
d2 [ 5 ] = d [ 7 ] ;
tempin = a t o f ( c2 ) ;
tempout = a t o f ( d2 ) ;
r e t u r n ( tempin , tempout ) ;
}
i n t massFinder ( d o u b l e o f f s e t )
{
i n t mass =0;
d o u b l e l o a d C e l l V a l u e A v e r a g e =0;
l o a d C e l l V a l u e A v e r a g e=analogRead (A2 ) ;
f o r ( i n t count =0; count <200; count++)
{
i n t l o a d C e l l V a l u e = analogRead (A2 ) ;
l o a d C e l l V a l u e A v e r a g e= 0 . 9 5 ∗ l o a d C e l l V a l u e A v e r a g e + 0 . 0 5 ∗ l o a d C e l l V a l u e ;
delay ( 1 ) ;
}
const double gr a d ie n t =0.7852;
d o u b l e i n t e r c e p t =24.513+ o f f s e t ; / / adds t h e o f f s e t t o t h e i n t e r c e p t t o a c c o u n t f o r any
// n e s t i n g m a t e r i a l , o r s i m i l a r ,
mass=( l o a d C e l l V a l u e A v e r a g e ∗ g r a d i e n t )− i n t e r c e p t ;
i f ( mass <10) // s i m p l e c l a u s e t o s e t any v e r y low measured masses t o z e r o :
// t h i s l i n e won ’ t u s u a l l y be used i n normal f u n c t i o n a s mass
i s o n l y taken when l e m u r s ( mass>10g ) a r e i n t h e box
{
mass =0;
}
r e t u r n ( mass ) ;
}
xii
Appendix III - Financial Report
Group industrial projects are allocated £100 budget per person, making a total budget of £400. The budget is generally used for travel expenses but in this case the industrial partner was based in Bristol and
the project itself needed to purchase many items not found in the lab; therefore the budget was lent less
to travel and more to procurement, with a small amount spent on refreshments for meetings and presentations.
A full income/expenditure table is shown on the following page, with the total expenditure being £274.59.
This includes purchases of multipack items, often where only a fraction of the pack was used and also of
items that were later found not to be needed for the project. For those reasons total expenditure is not a true
reflection of the cost of building one OSCaR, instead simply taking the cost of necessary parts (not including
tools and power source, which is subject to user choice) the cost of one instrument comes to £144.35. A full
list of equipment is given in Appendix XI along with their supplier of origin.
xiii
Appendix IV - Parts List with Suppliers
A list of components used to build the instrument.
Appendix V - Travelling With Lead-acid Batteries
Most modern lead acid batteries are suitable for air travel but this does not necessarily mean they will be
cleared to go on-board. The important specifications to look for in the datasheets for the battery (which can
be found on the manufacturer’s website) are that:
• It is sealed or non-spillable
• It has gas recombination technology
• It has a power capacity of less than 100Wh (equivalent to 16600mAh for a 6V battery or 8300mAh for
12V).
If attempting to take batteries while air travelling, the battery should be taken in hand baggage, its terminals
should be insulated (e.g. by taping them) and the battery data sheet should be carried with it along with a
print out of the air-carrier’s restrictions to demonstrate it is an allowable item. It may also be advisable to
contact the carrier regarding this before flying.
Unfortunately, it is at the discretion of security as to what goes through the checkpoints and they have
the power to confiscate anything they deem to be dangerous or potentially alarming to other passengers; so
these precautions do not guarantee being able to travel with the battery. A safer idea is to send a battery
ahead to its destination with a courier such as FedEx or UPS.
A further note: Lithium Ion batteries of the necessary capacity to run the device are not permissible in
any form on-board aircraft due to current regulations.
xiv
Appendix VI - Table of Component Power Consumption
Table of power consumption of components that make up the OSCaR.
Appendix VII - Tables of Steady State Waiting Times
Results of equilibrium time for each box-burner combination, with details of dimensions of the boxes and the
number of 10g paraffin wax burners used in each box. All errors calculated using standard error in mean.
xv
Appendix VIII - Zoo Survey Responses
Below is the full set of responses to market surveys
xvi
xvii
Appendix IX - User Manual
The following pages contain a user manual written to accompany the OSCaR, which helps to fulfil one of the
initital aims of having an easy to use metabolic chamber.
xviii
Open System
Calorimetry
Respirometer (OSCaR)
User Guide
Version 1.3
Hello!
We understand that electronic instrumentation can be intimidating at
times, especially when there is no documentation to accompany it. This is
why we have created this guide to accompany the instrumentation box for
measuring the BMR of animals; including information on adapting the
equipment for different animals and building duplicate apparatus from
scratch as well as the more basic day to day functions.
We hope that this guide helps you with any enquiries you may have
regarding the equipment and therefore furthers any health or
conservation goals you may have regarding the observed animal.
Sarah Buxton
Charlie Hannigan
Fergus Kidd
Nick Pestell
Designers and creators, OSCaR BMR Instrumentation Box
Table of Contents
1 Introduction................................................................................................................................................................. 1
1.1 Background....................................................................................................................................................... 1
2 Setup................................................................................................................................................................................ 2
2.1 If the initial setup has been completed ............................................................................................... 2
2.2 Adapting an animal nest box for the device...................................................................................... 2
2.2.1 Measurement of the new box .................................................................................................... 3
2.2.2 Light gates .......................................................................................................................................... 4
2.2.3 Scales..................................................................................................................................................... 6
3 Retrieving Data .......................................................................................................................................................... 9
4 Troubleshooting ..................................................................................................................................................... 10
4.0 Error 1: No data ........................................................................................................................................... 10
4.0.1 No setup............................................................................................................................................ 10
4.0.2 Multiple steps ................................................................................................................................ 10
4.1 Error 1: Animal Counter Error ............................................................................................................. 11
4.2 Error 2: Negative Animal Count .......................................................................................................... 11
4.3 Error 3 and Error 4: Oxygen Sensor Not Working ..................................................................... 11
5 Appendices ................................................................................................................................................................ 12
5.1 Appendix I - Code........................................................................................................................................ 12
5.2 Appendix II – Components list ............................................................................................................. 26
User Guide
UoB GIP 2012/13
1 Introduction
The OSCaR has been designed to measure the Basal Metabolic Rate of an animal (or
animals) in a non-invasive manner and return the data to the user in the simplest possible
way.
Even with its simple design, there are still some pitfalls to be wary of and information that
needs to be provided in order to facilitate any duplication of or changes to be made to the
equipment.
A short description of the reasoning and science behind the device is provided in section
1.1 below but is not necessary knowledge for the operation of the instrument box and can
be skipped with no loss to the reader.
Later sections will cover:
Setting up the equipment to take readings
Retrieving and interpreting data
Adaptation of the OSCaR to new nest boxes
Common issues and their resolution
1.1 Background
OSCaR effectively turns an animal’s nest box into an open system respirometry chamber. It
works by measuring the oxygen concentrations inside and outside a nest box while an
animal is present, which allows the oxygen consumed to be calculated. Due to an
approximately constant amount of oxygen consumed per unit energy, knowing oxygen
consumed allows for BMR to be calculated. OSCaR leaves no fiddling around with complex
data sets or further calculation – it simply gives the animal’s BMR, no fuss.
The device also incorporates light gates in the nest box entrance that act as advanced
presence detectors. These allow not only the presence of an animal in a nest box to be
discerned but also the number of animals in the box at any one time – a real advantage
when animals nest in pairs or groups. Furthermore, a scale is also incorporated seamlessly
into the base of the nesting box, allowing masses of single or multiple nesting animals to be
measured – this can be important for telling animals in a population apart and also for
trying to ascertain allometric scaling laws for the BMR of a species. Advanced logic allows
animals to bring food or nesting material into their nest without this affecting any weight
measurements. Naturally, along with the BMR of the animal(s) in a nesting box, the number
of animals and their mass is also given.
1
User Guide
UoB GIP 2012/13
2 Setup
The electronics and accompanying computer code have been designed to be as easy to set
up as possible, though there are several steps needed to get everything up and running.
2.1 If the initial set up has been completed
If everything above has been completed but you disconnect the device from its power
source or, equivalently, the batteries run out, then pressing the red reset button once
power has been restored will start the device running again, with the results then showing
multiple instances of a ‘setup’ – this is completely normal.
2.2 Adapting an animal nest box for the device
When looking to change the animal, and therefore nest box, that the device will be
measuring, there are several factors to take into account. Attaching the instrumentation
box means first altering the nest box it will be attached to – the OSCaR has several holes
through which instruments protrude or instrument wiring runs and appropriate holes
must also be made in the adapted nest box. One hole should be made for the internal
oxygen sensor, which has a bore of 22mm, one at the bottom for the scale wiring and
another for the light gate wiring. There should also be three small holes made for the bolts
that attach OSCaR to the nest box. The approximate positions and sizes of these holes on a
nest box are shown in figure 1 but accurate alignment should be carried out with the
OSCaR in-situ. While the oxygen sensor can simply be slipped into the wall of the nest box
the light gates and scales need to be fitted.
Light gate
false front
panels
Light gate
wiring hole
Oxygen
sensor hole
Scale
wiring hole
Bolt hole
Figure 1: Diagram of hole positioning on an adapted nest box, which has three
front panels housing the light gates – the nest box is denoted by the solid box
while the OSCaR Device outline is shown as dashed. This shows how OSCaR can
be attached to larger nest boxes than itself provided that it is aligned with the
front-bottom corner of the nest box.
2
User Guide
UoB GIP 2012/13
2.2.1 Measurement of the new box
Before fitting any hardware, let’s deal with the
software: firstly the area of the animal hole in the box
and the depth of this hole must be measured. The
measurement of the depth of the hole (shown in figure
1) can be carried out simply with a ruler. The trickier
measurement is that of the area of the animal hole, for
which the calculation changes depending on the shape:
for a circular hole the diameter of the opening is
measured and the following equation is then applied to
find the area:
Where D is the diameter and π is a constant roughly
equal to 3.142.
Hole
Depth
Figure 1: Demonstration of what is
meant by hole depth.
If the opening is square or rectangular then the area is simply equal to the length of the two
sides multiplied together.
These two measurements must then be inputted into the code in the Arduino. The Arduino
is accessed through a custom program which is downloadable from the Arduino website
(http://arduino.cc/en/Main/Software) along with instructions on how to set it up for use.
After installing the program, open a blank file and copy the code from Appendix I into it,
inserting the variables that you measured previously in the relevant places, which are
found near the top of the program:
const double Area = (e.g. 0.0022); //Area of entrance in m^2
const double Length = (e.g. 0.002); //entrance length in metres
The Arduino can then be plugged into the computer using a USB cable; at this point there is
no need for an external power supply for the Arduino as it is powered through the
computer. Once the Arduino is connected, the upload button (a circular button with an
arrow pointing right) should be pressed to send the altered code to the device – if the
program asks you to save the sketch before uploading, do so.
The Arduino can now be disconnected from your computer and connected to the outside
power source, usually a battery.
3
User Guide
UoB GIP 2012/13
2.2.2 Light Gates
When changing the OSCaR onto a new nest box the false panels that conceal the light gates
in the entrance to the nest box need to be replaced with appropriately sized ones.
The steps for this are as follows:
1. Cut two panels identical to the existing entrance panel on the front of the
nest box, including the entrance hole.
2. On one panel, mark out where the first set of light gates will lie across the
box’s entrance hole. They should be directly opposite to each other as they
rely on line-of-sight.
3. On the front panel of the nest box do the same, ensuring that the position of
these light gates is approximately 90° offset from those in step 2.
Note: For this step it is important to be aware that the light gates in the
nest box front panel are set into the outside while those in the
separately cut panel will be set on the inside – i.e. you must think about
the rotational geometry of the situation. These instructions may seem
confusing at first but using the existing altered nest box should clarify
what is said here.
4. Additionally, channels should be marked out on both panels where the light
gate wiring will run. These channels should start at the markings made in
previous steps and terminate in the same area near the edge that will be
adjacent to the OSCaR control box, in the area where the light gate wiring
hole in OSCaR is.
5. Use a chisel to form the channels and holes marked out previously, making
them deep enough to contain the necessary LEDs, light sensors and wiring –
in practice this means channels about 5mm deep.
6. In the third, un-chiselled panel, cut a small square out of the edge in line with
the appropriate hole in OSCaR. This square should also line up with the ends
of the wiring channels cut in step 5.
7. Now insert the LEDs and light sensors that make up the light gates into the
channels – there should be one light sensor and one LED in each of the two
panels and they should be placed opposite each other. The wiring should
then be run down the channels, followed by the whole set-up being secured
with silicone sealant. This helps keep everything in place, as well as
waterproofing the electronics.
8. As the silicone dries it is important to make sure the light gates are finely
aligned. Do this one panel at a time:
a. First plug the Arduino into a computer using a USB cable.
b. Power up the LED; this means connecting a 470Ω resistor to the black
wire (ground) then connecting this to the pin marked GND on the
Arduino. The red wire (positive) should be attached to the pin marked
5V on the Arduino.
4
User Guide
UoB GIP 2012/13
c. Likewise, the light sensor also needs power. As in step b, the black
wire of the light sensor should be connected to the second GND pin via
a 470Ω resistor and as there is only one 5V pin on the Arduino, the red
wire of the light sensor should be connected to digital pin 7. The
white, signal wire should then be connected to analogue pin A0.
d. Now open the Arduino software and paste in the following code:
int lightSensor = 7;
void setup() {
Serial.begin(9600);
pinMode(led, OUTPUT)
}
void loop() {
digitalWrite(lightSensor, HIGH);
int sensorValue = analogRead(A0);
Serial.println(sensorValue);
}
e. Upload the code to the Arduino and then open the serial monitor
(Ctrl+Shift+M).
f. If the LED is properly aligned with the sensor then you will see a fairly
constant list of high numbers (>1000) printed in the serial monitor –
this should be double checked by blocking the LED with a finger and
checking the listed numbers step to a much lower value (<750).
g. If the numbers are low or very variable initially then the LED and
sensor aren’t properly aligned – you should adjust their positions
within the channel until you are happy they are aligned as in step f.
h. Repeat the above steps for the other light gate panel.
9. The panels can now be secured to the front of the nest box and the relevant
wires inserted into the instrument box.
10. The light gates now need to be permanently wired in: inside the OSCaR
control box, there is a circuit board with several screw pin terminals
soldered on to it. There should be two free screw-pin terminals marked with
a+ and a-, the red wires of the light gates should be attached to the + side of
these terminals and the black wires to the - side. The two white signal wires
of the light gate pair should be attached directly into analog pins A0 and A1.
5
User Guide
UoB GIP 2012/13
2.2.3 Scales
As with the light gates, the scales cannot be taken straight from one nest box and inserted
into another. The platform of the scale must fit snugly into the bottom of a nest box, so as to
minimize detritus getting into the scale mechanism and make the box as ‘normal’ as
possible for the animal.
The scale consists of a wooden platform screwed to a load cell, which is then combined
with a plastic base and bolted to the bottom of the nest box. The steps for altering this set
up for a new box are as follows:
1. Measure the internal dimensions of the bottom of the nest box and cut a piece
of plywood to be one or two millimetres smaller in each dimension.
2. Unscrew the previous platform from the load cell and screw in the one that
was cut in the previous step. The load cell should be approximately centred on
the platform, and the wooden spacer between the platform and the cell should
be used – this allows the load cell to flex freely, which is how weight is
measured.
3. At the opposite end of the load cell to where the platform was attached there
are two more holes, which will be used to attach the scales to the box. Measure
where these two holes lie in relation to the base of the nest box and then drill
appropriately sized holes in the base at these points.
Note: steps 2 and 3 can be conducted in either order, depending on
what you find easier.
4. Now secure the full apparatus into the nest box with the screws provided,
ensuring you run the wires from the load cell though the appropriate hole.
Warning: if the weighing platform is in contact with the sides of the nest box,
this will cause poor measurements. In this case, the platform should be
removed and sanded or planed down to ensure a good fit.
5. As with the light gates, the scales must be calibrated with the Arduino, this also
requires the use of a spreadsheet program, such as Microsoft Excel. Due to the
ubiquity of Excel, all instructions referring to spreadsheets will use Excel
commands but most other spreadsheet programs are very similar. Calibration
is as follows:
a. First plug the Arduino into a computer using a USB cable.
b. Inside the OSCaR control box there is a circuit board with several
screw pin terminals soldered on to it. Connect the terminal marked +V
to the 5V pin of the Arduino and the terminal marked –V to the ground
(GND) pin.
6
User Guide
UoB GIP 2012/13
c.
d.
e.
Power the load cell, this means connecting the red wire of the load cell
to the E+ screw pin on the circuit board and the black wire to the Escrew pin.
Connect the signal wires: attach the white wire from the load cell to
the screw pin marked S+ and the green wire to the pin S-. Then
connect the analog 2 pin on the Arduino to the screw pin on the board
marked ‘Signal’.
Now open the Arduino software and paste in the following code:
void setup() {
Serial.begin(9600);
}
void loop() {
int loadCellValue = analogRead(A2);
float massVoltage = loadCellValue;
Serial.println(massVoltage);
}
f.
g.
h.
i.
Upload the code to the Arduino and then open the serial monitor
(Ctrl+Shift+M).
Calibrating the scale involves adding known masses to the scale and
comparing with what the Arduino reads – this means having a set of
masses or more likely a pre-calibrated set of scales (e.g. kitchen
scales) that can be used to measure an object before it is placed in the
nest box scale. If no masses are on hand, a great way to create a mass
is with a lightweight vessel filled with varying amounts of water.
With no weight on the scales, the serial monitor should read relatively
low values, but is unlikely to be zero. You should add a range of
masses from 0 to around 500g on your scales and note down said
mass and the corresponding serial monitor value in adjacent columns
in the spreadsheet. Around 10 data points should suffice.
Now collate this data into a scatter graph. On Excel, this means
selecting the two columns your data is stored in then going to the
Insert tab Scatter Scatter with only markers.
Note: The known masses should be along the y-axis and the measured
values along the x-axis – if this is not the case, delete the graph, switch
the column order in the spreadsheet and then re-create the graph
j.
Nest, right click on one of the data points on the chart and click ‘Add
Trendline’ then check the box ‘Display Equation on chart’ and click
close. This should give you a formula for the line of best fit in the form
y=mx+c, where m is the gradient of the line and c is the y-axis
intercept.
7
User Guide
UoB GIP 2012/13
k.
These two values now need to be inserted into the main code, so an
accurate mass of the animals entering the nest box can be found. The
full code for OSCaR can be found in appendix I at the back of this guide
and in the final few lines is the code for the scales. Within this code
there should be this couple of lines:
float gradient= m;
float intercept= c + offset;
Where m and c are actual numbers from previous calibrations. The
values for the intercept, c, and the gradient, m, should be inserted in
place of these previous values and the full code uploaded to the
Arduino.
6. Calibration of the scales is complete and the OSCaR device is ready for use with
a new animal.
8
User Guide
UoB GIP 2012/13
3 Retrieving Data
The data generated by the electronics is stored on a standard 2GB micro SD card which is
housed in a small metal adaptor slot on the Ethernet shield of the Arduino.
Make sure the device is powered OFF.
To remove the card, gently push the card into the Arduino – the card holder is spring
loaded, and the card should decouple itself from the slot. Gently pull the card out from the
slot.
The data on the card is stored in a standard plain text file (.txt) which can be read by any
personal computer. To retrieve this file, named “DATA” the micro SD card must first be put
into an adaptor that can fit into a personal computer. Examples include a micro SD card to
standard SD card adaptor, which will fit into devices with SD card slots, or micro SD to USB
adaptors, which fit all modern computers.
When the file is opened, the top line should read “Setup” indicating that the system has set
up correctly and established connection to the SD card. If this is not shown, refer to section
5.
Under this should read the recorded data, if an animal has used the device for more than
the allotted equilibration time. The data takes the form of:
X Number of animals: X BMR=X.XXXXXXXXXX with
taken
mass=X.XX T=XX.XX
9
XX
readings
User Guide
UoB GIP 2012/13
Where X represents a digit. The first Number displayed is the number of the data set taken.
Number of animals represents how many animals were in the box during the readings. The
BMR is the average BMR per animal in the box per day, displayed in kCal day -1. The number
of readings taken is the number of useful, non-anomalous readings taken after the waiting
period that contributed to the average BMR. The higher this number the more accurate the
BMR reading. The mass is the mass per animal in the box, and is displayed in grams, and
the temperature ‘T’ is displayed in degrees Celsius.
10
User Guide
UoB GIP 2012/13
4 Troubleshooting
This section of the guide highlights common issues users may encounter and offer simple
solutions. The device is able to self identify a limited number of issues, which present
themselves as error codes within the saved data on the storage device. There are also a few
other issues which can be easily diagnosed.
4.0 No Data
If the device has not read any data there could be a variety of problems. If the data file
reads “Setup” and no additional information text, then the device has been powered and
successfully initiated, but no animals have been present in the box.
4.0.1 No Setup
If the data file does not read “setup” on the first line then the device has had no power, or
been unable to establish a connection to the micro SD card. First put the micro SD card in
the device and power it on, making sure the Arduino LEDs are visibly on. Wait around 30
seconds before turning it off again. Remove the micro SD card and open the data file. If the
device still does not read “Setup” on the top line, the micro SD card or the Arduino shield
may be faulty.
If it does now read “Setup” then the device was either incorrectly powered, or the micro SD
card was not inserted into the Ethernet shield properly
4.0.2 Multiple Setups
The card should read “Setup” each time the device is powered on. If the data reads “Setup”
multiple times, or more times than the device has been powered on and off without the
data being deleted from the micro SD card then there may be a faulty connection in the
power circuit which is causing the device to be powered down.
Check all connections in the power circuit are strongly connected and able to carry
current
Check that the black power connector is fully inserted into the main Arduino board
11
User Guide
UoB GIP 2012/13
4.1 Error 1: Animal Counter Error
Error one is an animal counter error. It occurs when there is a faulty line of sight between a
sensor and LED, or a faulty electrical connection on either of these. The error presents itself
in the data, as “Error 1: Animal counter error” when the device prints its final data. When
the error occurs, the animal count is reset to 0.
Check the line of sight of the LED and sensor on the entrance to the nest box
Check all connections are complete
Check senor voltage levels both next to and away from the LED
Replace any faulty parts
4.2 Error 2: Negative Animal Count
Error two is a negative count error. It occurs when the system identifies a negative number
of animals in the box. It is common for this error to present itself after error 1, as the
animal count is reset, whilst animals are still in the box. This error also resets the animal
count, allowing it to correct itself when all remaining animals have left. The error presents
itself in the data, as “Error 2: Negative Animal Count” when the device prints its final data.
Discard Data with this Error
4.3 Error 3 and Error 4: Oxygen sensor not working
Errors 3 and 4 alert the user that one or both of the oxygen sensors are not functioning
correctly. The error presents itself amongst the data as "Error 3: Inside Oxygen sensor not
working" and "Error 4: Outside Oxygen sensor not working". The error may occasionally
present itself at random in the data, which should be ignored. The error is only valid if
presented multiple times in a row.
Check connections to relevant sensor
If problems continue, replace relevant sensor
12
User Guide
UoB GIP 2012/13
5 Appendices
The User Manual does contain appendices but they are duplicates of those already found
within the project report appendices.
13
Appendix X - Meeting Minutes
The following pages contain minutes from group meetings, which were compiled by the group secretary
(Fergus Kidd) as part of the Industrial Project.
xxxiv
School of Physics
Bristol Zoo Gardens Group Industrial Project
Meeting:
Initial Meeting
Date:
Location:
6/11/2012
H.H. Wills Physics Laboratory
Chairperson:
Secretary:
In Attendance:
Nicholas Pestell
Fergus Kidd
Professor. Peter Barham, Project Supervisor
Charles Hannigan, Treasurer
Sarah Buxton, Communications Officer
1. Project Brief
Professor Barham proposed that although the project brief was not certain yet, it would be about
metabolism, in the form of an electronics and programming exercise, and that the group should
investigate microprocessing and sensor types, as well as becoming familiar with a suitable
programming language.
Action: Group
2. Required Skills
Professor Barham suggested that the group assign internal roles, and acquire the relevant skills to
fulfilling the given role. Roles include, chairperson, treasurer, secretary, and communications
officer. He also suggested researching some level of zoology and biology to become familiar with
the basics that will be required to investigate metabolic rates.
Action: Group
2. Zoo Contact
Professor Barham proposed that Dr. Christoph Schwitzer, head of research at Bristol Zoo Gardens
be contacted for a meeting about possible project briefs.
Action: Sarah Buxton
School of Physics
Bristol Zoo Gardens Group Industrial Project
Meeting:
Project Brief
Date:
Location:
12/11/2012
Bristol Zoo Gardens
Chairperson:
Secretary:
In Attendance:
Apologies: Nicholas Pestell
Fergus Kidd
Dr. Christoph Schwitzer, Head of Research BZG
Prof. Peter Barham, Group Supervisor
Sarah Buxton, Group Contact
Charles Hannigan, Treasurer
N/A
1. Project Brief
Dr. Schwitzer proposed that the brief of the project be the design and production of a device to
measure the basal metabolic rate of the Grey mouse lemur. The device should be free standing, log
data, and withstand environmental conditions for use in the field in Madagascar. The device may be
tested using the Grey mouse lemurs at BZG.
Prof. Barham added that the project could be extended to adapt the instrumentation for different
types of animals, and calculate the theoretical limit to the size of animal suitable for
experimentation with the method.
Action: Members acknowledged.
2. Accessing Past Apparatus
Prof. Barham proposed that Tom Kennedy be contacted in order to obtain and examine equipment
used by previous students with similar brief.
Action: Sarah Buxton
3. Access to Zoo Resources
Dr. Schwitzer proposed access to zoo with research passes, and use of zoo literature.
Action: Deferred until required
4. Zoo Project Proposal
Dr. Schwitzer requested completion of a BZG project proposal form.
Action: Sarah Buxton
School of Physics
Bristol Zoo Gardens Group Industrial Project
Meeting:
Access to Zoo and Resources
Date:
Location:
12/01/2013
Bristol Zoo Gardens
Chairperson:
Secretary:
In Attendance:
Apologies: Nicholas Pestell
Fergus Kidd
Dr .Sue Dow, Research Officer Bristol Zoo Gardens
Sarah Buxton, Communications Officer
Charles Hannigan, Treasurer
N/A
1. Research Passes
Dr. Sue Dow organised for project members to be provided with research passes to gain access to
the zoo at any time.
Action: Members to collect research passes from BZG membership office
2. Accessing Keepers
Dr. Sue Dow proposed that she be point of contact for all zoo keepers, should members require any
information or action from keeping staff.
Action: Sarah Buxton
3. Zoo Familiarisation
Dr. Sue Dow proposed a brief tour of Bristol Zoo Gardens, specifically twilight world, to familiarise
project members with layout of the zoo, and the location of the test animals discussed in the
meeting of 12/11/2012.
Action: Members receive tour
4. Next Meeting
Deferred until further notice.
School of Physics
Bristol Zoo Gardens Group Industrial Project
Meeting:
Diffusion laws
Date:
Location:
20/02/2013
Centre for Nanoscience and Quantum Information
Chairperson:
Secretary:
In Attendance:
Apologies: Charles Hannigan
Fergus Kidd
Prof. Heinrich Hoerber, Professor of Nano-biophysics and supervisor
of previous Bristol zoo projects
Sarah Buxton, Communications Officer
Nicholas Pestell
1. Diffusion Laws
Sarah Buxton proposed discussion of gaseous diffusion models in application to experimental
corrections of BMR, and the use and application of Fick’s laws.
Action: Prof. Hoerber suggested Fick’s first law, although not strictly physically representative of
the actual system, would be enough to make initial estimations of the oxygen diffusion. He also
suggested researching the speed of diffusion of oxygen in air.
2. Calibration of oxygen sensors
Fergus Kidd proposed discussion of previously used methods for calibration of oxygen sensors, as
used by Guy Cohen in the 2011 project report of measuring the BMR of the Grey mouse lemur.
Action: Prof. Hoerber suggested contact with Prof. Rob Richardson and Dr. Adrian Barnes as their
equipment was used.
3. Next Meeting
Action: Sarah Buxton arrange meetings with Prof. Rob Richardson and Dr. Adrian Barnes if
necessary after initial contact.
School of Physics
Bristol Zoo Gardens Group Industrial Project
Meeting:
Interim Presentation
Date:
Location:
22/02/2013
H.H. Wills Physics Laboratory
Chairperson:
Secretary:
In Attendance:
Apologies: Nicholas Pestell
Fergus Kidd
Professor. Ashraf Alam, Professor of Physics and Project Assessor
Dr. Christoph Schwitzer, Head of Research BZG
Sarah Buxton, Communications Officer
N/A
1. Presentation
The group gave the interim presentation of progress made on the project to date to Prof. Alam and
Dr. Schwitzer. The relevance of work to the given brief was shown, and practical demonstrations of
working light gate detection, oxygen and temperature sensing, as well as the load cell for mass
measurement were given. Detailed box designs were also shown, as well as a timetable for the
future work. This document addresses two specific issues that require relevant action that arose in
the question section at the end of the presentation.
2. Availability of Power Supply
Dr. Schwitzer expressed concern that the type of battery (9V PP9) used in the demonstration of
equipment would not be readily available in Madagascar, and that international air travel with
batteries would not be a suitable alternative.
Action: Group. Replace PP9 battery with a series of smaller PP3 batteries which Dr. Schwitzer
suggested are readily available in madagascar. Research more into the use of solar panelling.
3. Extended Applications of the Device
Dr. Schwitzer asked about the possibility of using the device with mains power in the zoo to
monitor BMR changes with varying temperature over a period of a year.
Action: Group. Research mains power adaptation to the system. Add a temperature reading on the
output data saved to the SD card.
4. Next Meeting
A preliminary window of dates for the final project presentation was given for the week beginning
the 13th of May. Meeting with Dr. Schwitzer to place equipment in enclosures at BZG to be
arranged at a convenient time.
Action: Sarah Buxton
School of Physics
Bristol Zoo Gardens Group Industrial Project
Meeting:
Extension Problems
Date:
Location:
28/02/2013
H.H. Wills Physics Laboratory
Chairperson:
Secretary:
In Attendance:
Nicholas Pestell
Fergus Kidd
Professor. Peter Barham, Project Supervisor
Charles Hannigan, Treasurer
Sarah Buxton, Communications Officer
1. Project Brief
Professor Barham proposed that although the project brief was not certain yet, it would be about
metabolism, in the form of an electronics and programming exercise, and that the group should
investigate microprocessing and sensor types, as well as becoming familiar with a suitable
programming language.
Action: Group
2. Required Skills
Professor Barham suggested that the group assign internal roles, and acquire the relevant skills to
fulfilling the given role. Roles include, chairperson, treasurer, secretary, and communications
officer. He also suggested researching some level of zoology and biology to become familiar with
the basics that will be required to investigate metabolic rates.
Action: Group
2. Zoo Contact
Professor Barham proposed that Dr. Christoph Schwitzer, head of research at Bristol Zoo Gardens
be contacted for a meeting about possible project briefs.
Action: Sarah Buxton
Appendix XI - Certification of Ownership
Project Report presented as part of, and in accordance with, the requirements for the Final Degree of BSc at
the University of Bristol, Faculty of Science.
I hereby assert that I own exclusive copyright in the item named below. I give permission to the University
of Bristol Library to add this item to its stock and to make it available for consultation in the library, and
for interlibrary lending for use in another library. It may be copied in full or in part for any bona fide library
or research worked, on the understanding that users are made aware of their obligations under copyright
legislation, i.e. that no quotation and no information derived from it may be published without the author’s
prior consent.
Authors
Title
Date of Submission
S. L. Buxton, C. S. Hanngian, F. E. Kidd and, N. J. Pestell
Non-intrusive measurement of Basal Metabolic Rate using an Open System
Calorimetry Respirometer (OSCaR)
09/05/2013
Signed: Sarah Buxton, Charles Hannigan, Fergus Kidd, Nicholas Pestell
Full names: Sarah Buxton, Charles Hannigan, Fergus Kidd, Nicholas Pestell
Date: 09/05/2013
This project is the property of the University of Bristol Library and may only be used with due regard to
the rights of the author. Bibliographical references may be noted, but no part may be copied for use or quotation in any published work without the prior permission of the author. In addition, due acknowledgement
for any use must be made.
xli
References
[1] D. Randell, W. Burggren & K. French, K, ‘Animal Physiology – Mechanics and Adaptions’, 4th Edition,
W.H. Freeman and Company, pp 666-667, 661, 674, 668, 79-81, 669h
[2] A.J. Hulbert and P. L. Else, ‘Basal Metabolic Rate: History, Composition, Regulation and Usefulness’,
Physiological and Biochemical Zoology 77(6):869-876 (2003)
[3] M. Gordon, ‘Animal Physiology – Principles and Adaptations’, Macmillan Publishing Co., pp 55, 47-48,
51, 53
[4] I. D. Hume, ‘Marsupial Metabolics’, Cambridge University Press, pp. 2-17 (1999)
[5] S. Goodchild and C. Schwitzer, ‘The Problems of Obesity in Captive Lemurs’, International Zoo News
Vol. 55, No. 6, pp. 353-357 (2008)
[6] E. Knobil, and J. D. Neill, ‘Physiology of Reproduction’, Gulf Professional Publishing, Ch. 47, pp.
2555-2563 (2006)
[7] S. Wolfensohn and M. Lloyd, ‘Handbook of Laboratory Animal Management and Welfare’, John Wiley
& Sons, Chapter 15 pp.330-333 (2012)
[8] S.C. Rastogi, ‘Essentials of Animal Physiology’, New Age International, p122 (1977)
[9] C. R. White and R. S. Seymour, ‘Allometric Scaling of Mammalian Metabolism’, Journal of Experimental Biology, 208, 1611-1619 (2005)
[10] M. Kleiber, ‘Body Size and Metabolic Rate’, Physiological Reviews, 27, 511-541 (1932)
[11] F. Bokma, ‘Evidence Against Universal Metabolic Allometry’, Functional Ecology, Volume 18, Issue 2,
pages 184–187 (2004)
[12] J. R. Speakman, R. M. McDevitt and K. R. Cole, ‘Measurement of Basal Metabolic Rates: Don’t Lose
Sight of Reality in the Quest for Comparability’, Physiological Zoology, Vol. 66, No. 6, pp. 1045-1049
(2003)
[13] R.C. Hill, ‘Challenges in Measuring Energy Expenditure in Companion Animals: A Clinicians Perspective’, The Journal of Nutrition (2006)
[14] D. Randell, W. Burggren & K. French, Animal Physiology – Mechanics and Adaptions, fourth edition,
W.H. Freeman and Company, p.674 (1997)
[15] K. Schmidt-Neilson, Animal Physiology: Adaptation and Environment, Cambridge University Press
(1997)
[16] P.J. Moors, ’A Closed-circuit respirometer for measuring the average daily metabolic rate of small
animals’, Copenhagen, Oikos 28:304-308 (1977)
[17] G. Cohen, ’An investigation into the basal metabolic rates of Grey mouse lemurs through non-invasive
automatic measurement of Oxygen concentrations’, Bristol, Department of Physics, University of Bristol
(2011)
[18] J. Humphreys, 2011, ‘A Portable Device for Measurement of Basal Rate of Metabolism’, University of
Bristol
[19] Arduino, Arduino Uno [Online]. Available: http://arduino.cc/en/Main/ArduinoBoardUno, accessed
01/05/2013
[20] SST Sensing, ’LuminOx Preliminary Datasheet’, SST Sensing Ltd (2011)
xlii
[21] P. L, K. P, G. H, S. L & J. C. R, ’Optical fiber fluorescence sensor system for measuring oxygen levels
in gas involves the use of a fiber-optic fluorescence oxygen sensor containing a ruthenium complex for
quenching the fluorescence by singlet oxygen atoms’, United States patent application (2001)
[22] H. Tyrrell, The Origin and Present Status of Fick’s Diffusion Law Journal of Chemical Education,
41:397–400 (1964)
[23] M. Denny, Air and Water: The Biology And Physics of Life’s Media, Precenton University Press (1993)
[24] B. Roebuck, M. Brooks, & M.G. Gee, ’Load cell ringing in high rate compression tests’, Advances in
Experimental Mechanics, 1-2, 205-209 (2004)
[25] R. Pannorfi, B.M. Zee, I. Vatnick, N. Berner & S.M. Hiebert, ’Dietary Lipid Saturation Influences
Environmental Temperature Preference but Not Resting Metabolic Rate in the Djungarian Hamster
(Phodopus sungorus)’, Physiological and Biochemical Zoology, 85, 405-414 (2012)
[26] R. Mittermeier, E.E. Louis Jr., M. Richardson, C.Schwitzer et al, Lemurs of Madagascar, Third edition,
Conservation International, p.116-117 (2010)
xliii