1
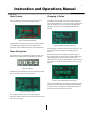
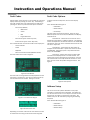
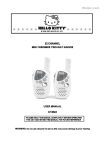
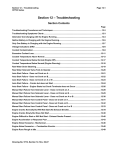
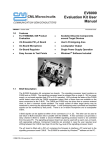
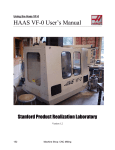
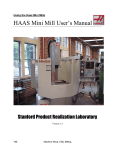
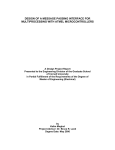
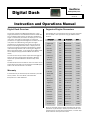
1
GARTECH
Digital Dash
Enterprises, Inc.
Rev 2
01-23-09
Instruction and Operations Manual
Digital Dash Overview
Supported Engine Parameters
The primary purpose of the Digital Dash display is to view
engine parameters that are broadcasted onto the J1939 data
bus. The display allows the user to select from 54 different
engine or transmission parameters and display up to 4 on the
user screen. The ability to view engine or transmission
parameters is a highly valuable diagnostic tool which can save
many hours of troubleshooting. Along with the engine
parameters that are displayed, the user can also scroll out
Active, Inactive Diagnostic Fault codes, or display the fault
lamps that are being transmitted on the datalink. A special
mode will change the fault code monitoring from Engine to
Allison transmission faults. In this mode, factory Allison codes
will be displayed (Only applicable for Model Year 08 and
above).
The following list is the parameters that are currently supported
with this device. Other parameters may get added for future
revisions.
Parameter
SPN
Parameter
Engine Spd
190
ExhTmp#1
1137
Throttle
91
ExhTmp#2
1138
Pct Load
92
ExhTmp#3
1139
Rmt Throt
974
ExhTmp#4
1140
I.M. Tmp
105
ExhTmp#5
1141
The user can also setup an alarm output which will trigger on
faults or real-time running engine parameters. (Datalink
adapter with provided software is needed to setup alarm
system).
Coolant Tp
110
ExhTmp#6
1142
Fuel Temp
174
ExhTmp#7
1143
Oil Temp
175
ExhTmp#8
1144
The Portable Test Cell is the ideal test tool to be able to run an
engine without the need to be connected into the OEM system
either in test cell environment or in-vehicle.
F.Rail Prs
157
ExhTmp#9
1145
Boost Prs
102
ExhTmp#10
1146
Coolant Pr
109
ExhTmp#11
1147
Amb Air Pr
108
ExhTmp#12
1148
Fuel Rate
183
ExhTmp#13
1149
Battery SW
158
ExhTmp#14
1150
Battery
168
ExhTmp#15
1151
Blowby Prs
22
ExhTmp#16
1152
Timing Prs
156
Out Sft Spd
191
Engine Hrs
247
In Sft Spd
161
Oil Prs
100
Slect Gear
524
OilFiltPrs
99
Curnt Gear
524
Warranty
A limited warranty on workmanship and materials is provided
for this product. For more details, contact GarTech
Enterprises Inc. at 812-794-4796.
SPN
Boost Prs3
1129
Tran Prs
127
ECM Tmp
1136
Tran Temp
177
I.M. Tmp2
1131
Req Gear
525
I.M. Tmp3
1132
Aux Tmp 1
441
I.M. Tmp4
1133
Aux Tmp 2
442
CompIn Tp2
1173
Aux Prs 1
1387
Exh Gas Tmp
173
Aux Prs 2
1388
Note: Not all engine control modules broadcast each of these
parameters. If you attempt to display a parameter which is not
supported or the unit has bad communications, a value of “N/A”
will be shown for those parameter values.
2
Instruction and Operations Manual
Main Display
Changing A Value
The main display is sectioned off into three areas. Main
menu, Fault window, and Bar Graph Gauge window.
To change a value or adjust a menu item, select the item by
pressing the Up and Down arrow keys and then press “ENT”.
The menu will appear for that item. For example, pressing the
“ENT” key while the arrow is on “This Addr” will display the
options for that feature. The following figure depicts this
example:
Figure 1. Main Display Window
The Main Menu area displays parameters and menu screens
and the Bar graph location displays the selected value
graphically. The Fault Window contains all fault information.
Selecting “Back” will take you back to the previous menu. For
more details on this menu refer to the “Address Setup”
section.
Menu Navigation
The menus can all be navigated by using the Up/Down and
ENT keys on the keypad that is located below the display.
Up
Down
Figure 4: Address Setup Menu Example
Enter
Once the options menu is displayed, as shown in Figure 4,
select the item that you want to adjust and press “ENT” again.
This will display the menu where the parameter can be
adjusted, For example, press “ENT” while the arrow is pointing
to “This Addr” to adjust the datalink address for the unit, see
Figure 5.
Fault
Figure 2. Keyboard
By Pressing the Up or Down key, the arrow located on the left
side of the display will move in that direction.
Figure 5. Options Menu Adjustment Screen
The value can be adjusted by pressing the Up/Down keys and
finally pressing “ENT” when done adjusting which will display
the previous menu. Holding down the Up/Down keys after a
few seconds will auto-repeat the key stroke.
Figure 3: Navigation Arrow
The navigation arrow is shown in a red box in Figure 3.
Pressing the “ENT” will open up the corresponding menu that
the arrow is pointing to.
3
Instruction and Operations Manual
Fault Codes
Fault Code Options
All fault codes, active/inactive, can be scrolled out of the fault
display window by pressing the “Fault” key. The following is
the order of which items can be displayed or scrolled out by
pressing the “Fault” key and the format options available:
To access the fault code options, from the main display
screen:
-
Fault Lamps (Default)
o
Malfunction
o
Amber
o
Red
o
Engine Protection
-
Active Faults (press “Fault” Key once)
-
Inactive Faults (press “Fault” Key twice)
The available formats that the fault codes can be display are:
-
Cummins Codes
-
Verbal
-
SPN/FMI
-
Allison Transmission Codes (MY08 or Greater)
The fault window can be seen in Figure 6.
From the Main Menu Navigate to:
) Main Menu
) Datalink Setup
) Fault Setup
The fault options are shown in Figure 9. There are three
different options that can be set, Fault Decode, Fault Display,
and Fault Scroll.
Fault Decode – Allows the user to force the unit to
decode the engine faults in a different scheme. The selection
number corresponds to the decode mode from the J1939 SAE
specification. Normally, this is auto-detected and the user will
not have to adjust this.
Fault Display – Controls how the fault codes are
displayed in the fault window. Options are: Cummins, Verbal,
and SPN/FMI. This display option is only used when Fault
Scroll is set for ENGINE.
Fault Scroll – Selects what source the fault codes
are received and displayed from in the fault window. The
options here are from the Engine or Transmission. Once the
user selects which source they would like the faults to come
from, the main screen will update stating the location. See
Figure 7.
Figure 6. Fault Window
The faults that are being collected and displayed will be from
the engine or transmission. The user can determine this by
the text above the Fault window. See figure 7 and 8.
Figure 9. Fault Options
Address Setup
Figure 7. Fault Source for Engine
The unit must look for specific addresses so the proper
messages on the datalink can be decoded. The address for
the unit must also be set so it can request a number of items
directly from the engine or transmission controllers. The
address setup can be accessed by navigating the following
sequence:
From the Main Menu Navigate to:
) Main Menu
) Datalink Setup
Figure 8. Fault Source Text
Depending on the Fault mode the user has selected, the text
for which faults are being monitored are listed in Figure 8.
) Address Setup
4
Instruction and Operations Manual
Address Setup contd.
Other Options contd.
The address setup options are shown in Figure 10. There are
three different options that can be set, This Addr, Engine Addr,
and Transmission Addr. The addresses that are displayed on
the screen are in Hexadecimal values.
Clear Inactive Faults – Sends a message to the
engine controller to clear all Inactive faults. Not all engine
controllers respond to this message.
This Addr – Sets the datalink address for the display.
Adjust this value if there is a conflict with this device and
another device on the network.
Setup Gauge – Allows the user to setup the bar
graph on the Main Display. The high and low limit can be
adjusted along with selecting which parameter uses the bar
graph. Figure 12 shows this menu.
Engine Addr – Sets the datalink address for the
Engine controller. Typically, engine’s have an address of “0”.
Transmission Addr – Sets the datalink address for
the transmission controller. Typically, transmissions have an
address of “3”.
Figure 12. Setup Gauge Options
The three options that the user can setup are Value at 100%,
Value at 0%, and Select Parameter.
Figure 10. Address Options
Other Options
The user can change the Display Units, Display Mode, Clear
Inactive Fault Codes, and Setup the bar graph gauge through
this menu. The Other Options can be accessed by navigating
the following sequence:
From the Main Menu Navigate to:
) Main Menu
) Other Options
Value at 100% - Sets the 100% range of the bar
graph in engineering units. In Figure 12, when Engine Speed
is at 2000 RPM, the bar graph will be at 100%.
Value at 0% - Sets the 0% range of the bar graph in
engineering units.
Select Parameter – Allows the user to select which
parameter they would like to be used for the bar graph.
Set Brightness
The user can change the brightness of the display. The
brightness option can be accessed by navigating the following
sequence:
From the Main Menu Navigate to:
) Main Menu
) Set Brightness
Figure 11. Other Options
The options that are shown in Figure 11 are:
Display Units – Changes the engineering units for
the data that is displayed. The user can select ENGLISH or
METRIC.
Display Mode – Changes the names of the
parameters that are displayed. The user can select SAE,
C_OLD (Cummins Old naming), or C_NEW (Cummins New
naming).
Figure 13. Set Brightness
There are four different settings of brightness for the display.
The default value is 4 and it’s the maximum brightness.
5
Instruction and Operations Manual
Display User Screen
Selecting this option from the menu will display the parameter
screen. The four parameters are displayed on the screen.
Figure 14. Parameter Screen
The parameters can be changed by moving the arrow to the
location that needs to be changed. Once the arrow is pointing
to the location that needs to be changed, press the “ENT” key
and then use the Up/Down arrows to pick the parameter.
When the parameter that needs to be displayed is listed,
simply press the “ENT” key again to set it. As the parameter
name changes, the value will automatically update. If that
parameter is not currently being broadcast then the symbol
N/A will be displayed. Figure 15 displays what the screen
looks like when the user is changing parameters.
Figure 15. Changing Parameters
6
Instruction and Operations Manual
Electrical Specifications
PC Software cont.
Input Voltage:
Operating Current:
Inrush Current:
Operating Temperature:
The two tabs located in the top left corner allow the user to
select between an alarm from a fault code or an alarm from a
parameter value. The fault code alarm simply looks for the
specified SPN/FMI combination and sets the alarm. The
parameter value will determine if the condition is met before
setting the alarm.
6-28 Volt DC
1.5 Amp
2.5 Amp
-40 to 80 Deg C
Electrical Connections
The Portable Test Cell version contains harnesses that are
required to connect the device to the engine. Please refer to
the harness instruction manual to connect these properly.
The Digital Dash has only one connection that is required. A 6
pin Deutsch connector is used on the back of the device with
the following pin out:
Pin 1:
Battery + (6-28 V DC)
Pin 2:
CAN HI
Pin 3:
CAN LO
Pin 4:
CAN SHIELD
Pin 5:
Alarm Output
Pin 6:
Ground
PC Software
The Alarm feature for Portable Test Cell can be set by using
the provided software along with a Peak adapter. This adapter
can be purchased from GarTech Enterprises Inc.
The user can add a fault by setting the items in either “Fault
Code” tab or the “Parameter Fault” tab and then pressing
“Add Fault” button. If there is room left in the fault table then
that new fault condition is added.
The user can delete a fault that is in the fault table by first
input the exact items into the “Fault Code” tab or “Parameter
Fault” tab and then clicking “Delete Fault”. If there is a fault
that is the exact same one in the device then its deleted.
The “Get Faults” button will request the current fault list from
the device and display it in the bottom grid.
The user can clear the entire fault table in the device by simply
clicking “Clear All”.
This feature has to be enabled by default which can be done
by clicking “Enable Shutdown” button. To disable this feature
click on “Disable Shutdown”.
When this feature is enabled and a fault condition occurs a
screen on the device will display which fault condition was
tripped. The user will have to press the “Ent” key to resume
normal device operations. This will also reset the alarm
output driver.
GARTECH
Enterprises, Inc.
3037 W. State RD 256
Austin, IN 47102
812-794-4796
Figure 25: PC Software for Alarm Feature
www.gartechenterprises.com