1
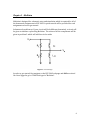
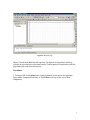
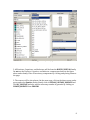
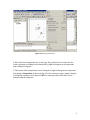
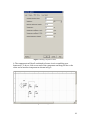
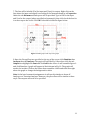
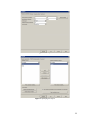
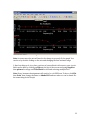
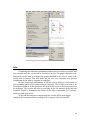
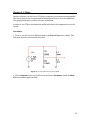
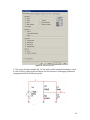
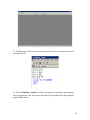
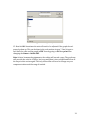
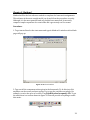
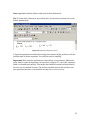
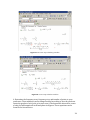
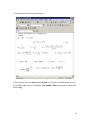
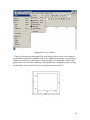
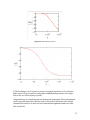
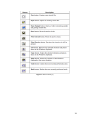
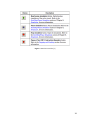
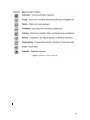
Hiren Patel School of Electrical and Computer Engineering Table of Contents 1. Introduction…………………………………………………………………………….……………………… 3 2. User Interface ……………………………………..…………………………………………………………...4 2.1 Multisim Interface ……………………………………………………………...........................4 2.2 LTSpice Interface ………………………………………………………………………………...4 2.3 Mathcad Interface………………………………………………………………………………...5 3. Chapter 1-‐ Multisim ……………………………………………………………………………………...….6 4. Labs ………………………………………………………………………………………………………………14 5. Chapter 2 – LTSpice …………………………………………………………………………………...…..15 6. Chapter 3 – Mathcad …………………………………………………………………………………...….22 7. Appendices ……………………………………………………………………………………………...…….28 7.1 Appendix A-‐ Multisim………………………………………………………………….……..28 7.2 Appendix B -‐ Mathcad……………………………………………………………….………..32 8. References …………………………………………………………………………………………...………..34 2 Introduction Intended audience The purpose of this manual is to provide ECE 3043 students a quick and easy guide on how to use Multisim, LTSpice, and Mathcad to aid in their homework assignments and labs. Non-‐ECE students willing to learn new softwares can also benefit from this guide because it provides step-‐by-‐step instructions. In ECE 3043, all of the homework assignments will be completed used Multisim, LTSpice, and Mathcad. Getting started on the first homework assignment can be difficult if you are not familiar with the softwares. This guide was created to help those struggling on getting started. It will also provide helpful hints on each homework assignment from labeling to determining what the output of the graph should look like. 3 User Interface The user interface provides brief background information about what each software is and what it does. Multisim Interface Multisim is the schematic capture and simulation application of National Instruments Circuit Design Suite, a suite of EDA (Electronics Design Automation) tools that assists you in carrying out the major steps in the circuit design flow. Multisim is designed for schematic entry, simulation, and feeding to downstage steps, such as PCB layout [1]. Figure 1. Multisim [1]. LTSpice Interface LTspice is Linear Technology Corporation's switch mode power supply synthesis and analog circuit simulation software [2]. LTspice IV is intended to be used as a general purpose schematic capture program with an integrated SPICE simulator. The idea is you draw a circuit(or start with an example circuit that's already drafted) and observe its operation in the simulator. The design process involves iterating the circuit until the desired circuit behavior is achieved in simulation [2]. Figure 2. LTspice [2]. 4 Mathcad Interface Mathcad is the industry standard calculation software for technical professionals, educators, and college students. Mathcad is as versatile and powerful as programming languages, yet it’s as easy to learn as a spreadsheet [3]. Mathcad lets you type equations as you’re used to seeing them, expanded fully on your screen [3]. But Mathcad equations do much more than look good. You can use them to solve just about any math problem you can think of, symbolically or numerically. You can place text anywhere around them to document your work. You can show how they look with Mathcad’s two-‐ and three-‐dimensional plots. You can even illustrate your work with graphics taken from another Windows application. Plus, Mathcad takes full advantage of Microsoft’s OLE 2 object linking and embedding standard to work with other applications, supporting drag and drop and in-‐place activation as both client and server [3]. Figure 3. Mathcad [3]. 5 Chapter 1 -‐ Multisim Multisim is designed for schematic entry and simulation which is required for all of the homework assignments in ECE 3043. A quick tutorial will be provided for each assignment on how to get started. In homework problem set 1(your circuit will look different from mine), a circuit will be given to simulate a plot using Multisim. The values of all the components will be given in problem 2 which will add later in the guide. Figure 1. Circuit design In order to get started, first navigate to the ECE 3043 webpage and click on virtual lab. Once logged in go to START and type in “Multisim”. 6 Figure 2. Multisim page Figure 2 shows how Multisim will open up. The figures in Appendix A will help provide an introduction to the main buttons. Take a minute to familiarize with this page and what each of the buttons do. Procedure: 1. To begin click on the place basic (symbol) button (as shown in the Appendix figure under Component toolbar) or click Place at the top of the screen then component. 7 Figure 3. Components page 2. All Resistors, Capacitors, and Inductors will be from the RATED_VIRTUAL family. Do not use the Resistor, Capacitor, and Inductor components shown in the figure above under family. Place all necessary components by clicking and placing them on the page. 3. The sources will be placed next. On the same page, click on the down arrow under group and select Sources. Under Family click on SIGNAL_VOLTAGE_SOURCES and click AC_VOLTAGE and also add the necessary number of grounds by clicking on POWER_SOURCES then GROUND. 8 Figure 4. Rotating components 4. Once all of the components are on the page, they will need to be rotated to the correct position according to the homework by right clicking on each component and rotating 90 degrees. 5. The values of the components can be changed by right clicking on the component then going to Properties as shown in Fig. 5. In the resistance space, simply change it to the given resistance value then hit OK. The same procedure will done on the Inductor and the Capacitor. 9 Figure 5. Adding component values 6. The components will be all combined to form a circuit resembling your homework. To do so, click on one end of the component and drag the line to the other end of another component as shown in Fig. 6. Figure 6. Creating circuit 10 7. The line will be labeled (Vin) for input and (Vout) for output. Right click on the line where the input and output is according to the homework and go to Properties. Under the tab Net name a blank space will be provided. Type in Vin for the input and Vout for the output (where specified on homework), then click check the box for it to show up on the circuit. Click OK. It should look like the figure below. Figure 7. Adding input and output for graph 8. Once the Vin and Vout are specified, at the top of the screen click Simulate then Analyses then AC Analyses. The page will look like Fig. 8. Once here click the tab Output then highlight the Vout and click Add in the center. It will resemble figure 9 and click Simulate. A graph will appear in black shown in Fig. 10. The graph will need to be in white. Click on the button that resembles a black and white box right above the graph to change the background to white. Note: In the later homework assignments it will specify whether to do an AC Analyses or a Transient Analyses. However, the procedure will be similar to these steps. The outputs will need to be specified. 11 Figure 8. AC analysis Figure 9. Specifying the output 12 Figure 10. Simulation of circuit Note: In some cases the axis will need to be change to properly fit the graph. You can do so by double clicking on the axis and changing the min and max range. 9. One last thing to do is to place a picture of yourself and a title next to your circuit. Both can be done by clicking on Place at the top of the screen and going Graphics then picture for image and Title Block for title and selecting example3.tb7. Note: Every homework assignment will need to be a in PDF form. To do so click File then Print then change the name to Adobe PDF and save where it can be found. Do the same thing for the Graph. 13 Figure 11. Adding Graphics and Title block Labs Completing the homework assignment before the lab can be very helpful and less stressful since the circuit will be created in the lab. The graph obtained in the homework can be used to compare the graph obtained in the labs to verify if the circuit built is correct. This will make the lab run a lot smoother and quicker considering the lab takes a long time to complete. In some homework assignments it will ask you to design a circuit based on your birthday, which will be converted to a frequency. The circuits wont have to be created out of thin air as the professor will provide the circuit in his lecture notes on his webpage. The circuits will also be provided in the lab manual along with the formulas needed to determine the values of the other components (i.e. resistors, inductors, and capacitors). As the labs become more complicated, the circuits will become bigger. Complete the homework before coming to lab to ensure a less stressful lab. 14 Chapter 2-‐ LTSpice Another software you will use is LTSpice to complete your homework assignments. The idea is observe the circuit drawn in Multisim and observe it in the simulation. The graph obtained here will be the same in Multisim. In order to use LTSpice determine the nodes and where the components are in the circuit. Procedure: 1. To do so, use the circuit in Multisim before the Vin and Vout were added. This will make it easier to determine the nodes. Figure 12. Circuit before the Vin/Vout added 2. Click on Options at the top of the screen and under Net names check the show all button and hit apply then OK. 15 Figure 13. Numbering nodes 3. The circuit should resemble Fig. 14. The nodes will be numbered making it easier to code LTSpice. Applying this technique for the later more challenging homework assignments will be useful and quicker. Figure 14. Circuit with nodes numbered 16 4. Next open up notepad. This is where the code will be written to use in LTSpice. The first line in the notepad should be your name. 5. For the second and so forth lines look at where the nodes are numbered. The nodes tell where the components lie. For example, in figure 14 the AC voltage source lies between 1 and 0. This means it starts at 0 and ends at 1. However, always start from the node and end at the ground. In the notepad write Vi 1 0 ac 1. AC 1 means it is a AC voltage source with 1kHz/1Vpk. Figure 15. Coding the circuit 6. Do the same for all the other components. Once done the code should resemble Fig.16 with the component values being different. Figure 16. Coding the components 7. The next line starts with .ac dec 10 10 100000k, however, the 100000k will be different for the circuit given in your homework. In order it means the graph will be an AC Voltage Analysis (as done in Multisim), dec meaning decimal for units, and number of points, starting point, and ending point (10 10 100000k). The last value can be changed if wanting a better looking graph. 17 Figure 17. Adding increments 8. The last two lines are .prode and .end. Do not forget the period before these lines as well as the one in step 7. This will ensure that LTSpice will graph. The .prode is added because it tells LTSpice to create the result in a AC Simulation done in Multisim. Some homework assignments will use DC, or Transient Simulation. (it will be specified in the homework). The last code .end is just added so LTSpice knows where to end. Figure 18. Final code 9. Last thing to do is to save it. Save the file as a .cir file because that is how LTSpice reads it. Simply save it was HW1.cir and place it somewhere you can easily find it because it will be needed to open in LTSpice. 10. Open LTSpice by going to Start and typing in LTSpice in the virtual lab. It will open with a blank page shown in Fig. 19. 18 Figure 19. LTSpice start page 11. In LTSpice go to file at the top left and open the file you recently saved. It will resemble Fig. 20. Figure 20. File opened in LTSpice 12. Click on Simulate and Run or click on the symbol resembling a man running. This will graph the code. The output will need to be specified since the graph will appear blank at first. 19 Figure 21. Blank graph in LTSpice 13. Right-‐click on the graph and go down to Add Trace. Figure 22. Adding a trace 14. The output was V(2) for this circuit (page 6). When the output is clicked it will be added under Expression(s) to add:. 20 Figure 23. Adding the output 15. Next hit OK. Sometimes the axis will need to be adjusted if the graph doesn't properly show up. This can be done in the code written in step 7. Don’t forget to save both the code and the graph in PDF form by going to file then print then changing the Name to Adobe PDF. Note: In later homework assignments, the coding will exceed a page. The professor will provide the code for LTSpice. Just copy and paste it into notepad and follow all the steps in this section again. The only values that will need to change are your component values and the range if needed. 21 Chapter 3-‐ Mathcad Mathcad will be the last software needed to complete the homework assignments. This software is the most complicated if you do no follow the procedure correctly. Although, it is the most powerful and very helpful once mastered. It can easily compute complex equations for certain labs and a great study tool for exams. Procedure: 1. To get started head to the start menu and type in Mathcad. A window with a blank page will pop up. Figure 24. Mathcad window 2. Type out all the component values given in the homework. To do this just click anywhere on the screen and start typing. Try to type the variables out neatly. For example, to write the value of resistor 1 say R1(shift-‐colon for equals) 47k. To get the units there is a toolbar shown in figure 25 that will provide everything to make this easier. Figure 25. Toolbar 22 Note: Appendix B further defines what each of those buttons do. Tip: To learn what a button on any toolbar does, let the mouse pointer rest on the button momentarily. Figure 26. Inputting component values 3. Input the equations calculated from doing the homework (the professor will also provide most of theses equations. You will just need to simplify). Important: Make sure the equations are entered in a correct manner. Mathcad is picky when it comes to importance of equations. In figure 27, two of the equations show a red undefined variable. This means that Mathcad cannot find that variable because it is not defined in order. The defined variable must be placed above the two equations that have a red variable in order for no error to occur. 23 Figure 27. Incorrect way to defining variables Figure 28. Correct way to define variables 4. Determine the frequency start, frequency stop, and number of points to your preference. These numbers can be changed around according to how the professor wants the graphs to look (refer to lecture notes). The homework also asks to create a bode plot and magnitude in dB and phase in degrees. These equations can be found in the lecture notes. 24 5. The final look should resemble Fig. 29. Figure 29. Final design in Mathcad 6. To graph go to the top Insert and X-‐Y plot. It will open up a blank graph. Specify the variables that need to be graphed. First double click on the graph to change the units to log. 25 Figure 30. Graphing in Mathcad 7. Figure 31 shows the blank graph. The small boxes can be clicked on to change to the variable needed to be graphed. Click on the middle black square, on the x-‐axis, to define it as well on the y-‐axis. Figure 32 shows M(fi) vs fi. When this is done it will graph on its own. The units and range of the graph can be changed by right-‐clicking on the graph. The same will be done for the phase shown in Fig. 33. Figure 31. Blank graph in Mathcad 26 Figure 32. Defined black squares Figure 33. Graphing phase 8. The last thing to do is to insert a picture of yourself anywhere on the software. Make sure all of your variables and graphs are NOT passing the line to the right. That is the cut-‐off line when you print. Congratulations on completing the first homework assignment. These assignments can be long and tedious but with the help of this guide it should provide enough information needed to do well on future homework assignments and even some labs. Good luck! 27 Appendix A: Multisim 28 Figure 1. Main Toolbar [1] 29 Figure 2. Simulation Toolbar [1] 30 Figure 3. Components Toolbar [1] 31 Appendix B: Mathcad 32 Figure 1. Functions of each symbol [3] 33 References [1]. “NI Multisim User Manual” [Online]. http://www.ni.com/pdf/manuals/374483d.pdf [July 10, 2014]. [2]. “LTSpice.” Linear Technology Corporation. http://eas.uccs.edu/wang/ECE2205_su_13/LTspice/LTspiceManual.pdf [July 10, 2014]. [3].”Mathcad User’s Guide.” Mathsoft, Inc. http://claymore.engineer.gvsu.edu/~jackh/eod/courses/egr345/media/mathcad.p df [July 10, 2014]. 34