1
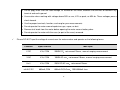
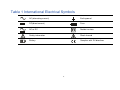
AT-H551C (5-in1) Handheld Tester
User’s Manual
INTRODUCTION
Thank you for purchasing ATTEN product - AT-H551C which is an Auto Oscilloscope 5-IN-1 Instrument (hereafter referred
to as “the meter”). The meter is called complex instrument for its function of “FIVE IN ONE”. It can be believed that it will give
you great convenient for its innovative function and humane design.
The meter is battery & adapter powered with a digital display.
The meter has been designed to storage the “HELP” information. For the information of help, you can open the HELP
window as the way stated in this manual.
1
CONTENT
Safety Information……………………………………….…………………………………….………………………………..…5
Description…………………………………………………………………………………..……………….…………………….9
Feature…………………………………………...………………………………………………………………………………9
Instrument overview …………………………..…………………………………………………….……………………......11
Basic Operation………………………………………………………………………………………………….…………..…....16
Turn on & turn off the meter………………………………………………………………………….……………………….16
Auto power-off…………………………………………………………………………………………………..……………16
Backlight display……………………………………………………………………………………………………………….16
Battery charging……………………………………………………………………………………………………………….17
Charging with adapter………………………………………………………………………………………………………...18
Resetting ……………………………………………………………………………………………..……………………….18
Oscilloscope Operation……………………………………………………………………………………………………...…..20
Basic content in oscilloscope mode……………………………………………………………………...………………….20
System setting and the menu………………………………………………………………..…………………………21
Normal Mode………………………………………………………………………………………………………………...25
Time base adjustment…………………………………………………………………………………..……………………28
Vertical amplitude control………………………………………………………………………………………...…………..29
Waveform auto triggering………………………………………………………………………...…………………………..29
Waveform measurement in Normal Mode………………………………………………….……………………………..29
2
Video Mode……………………………………………………………………..…………………………………………….30
Waveform measurement in Video Mode…………………………………………..………………………………………32
Single Mode………………………………………………………………………………………………………………….32
Time base setting………………………………………………………………………………….…………………………34
Amplitude setting…………………………………………………………………………………….………………………35
Trigger condition setting……………………………………………………………………………..………………………35
Horizontal displacement adjustment………………………………………………………………………………………...36
Cursor measurement reading-out function…………………………………...…………………………………………….36
Waveform measurement in Single Mode……………………………………………………….…………………………38
Signal waveform hold ………………………………………………………………….……………………………………39
Storage and reading out of the signal waveform……………………………………………………………………….…..39
Signal source Operation………………………………………………………………………………………………..….40
Signal generator setting………………………………………………………………..……………………………………40
Calibration for the oscilloscope signal……………………………………………………………………………………….42
Digital Multimeter Operation……………………………………………………………………………...……………...…..44
Display in digital multimeter mode………………………………………………………………………….………………..44
Basic function ……………………………………………………………………………………………….………………45
Manual ranging and auto ranging selection…………………….............…………………………………..……………..45
Data hold and list………………………………………………………….…………………………………………………..45
Auto record (threshold setting)………………………………………………………………………………………………47
Alternative and directive voltage measurements……………………………………………….………………………….48
3
Alternative and directive current (30mA/600mA) measurements……………………………….……………………….49
Operation for 10A adaptor …………………………………………………………………………………………………..50
Waveform display function…………………………………………………………………………………………………...51
Frequency and Duty Cycle measurements…………………………………………………………………………………52
Remote Control and Crystal detections…………………………………….……………………………………………..54
Resistance/ Continuity……………………………………………………..……………………………………………...55
Diode /Transistor tests…………………………………………….……………………………………………………...56
Capacitance measurement………………………………………..………………………………………………….....57
Inductance measurement…………………………………………………….……………………………………………..58
Relative value measurement mode……………………………………..……………………………………………….59
Peak value Detecting (P-D) and Hold (P-H) Mode...………………………………..…………………………………….60
Technological Specification …….………….………………………………….…………………………………………...….61
Specification and technological parameters……………………………………..………………………………………...61
General Specifications………………………………………..…………………………………………………………….. 61
DSO Specification ……………….………………………………………..………………………………………...62
DSO Probe Specification …………….…………………………………….………..……………………………………… 63
DMM Specification………………………………………..…………………………………………………………………64
Symbols and image icon……………………………………………………………………………………………………67
Standard accessories………………………………………………………………………………………………………68
Maintenance……..…..…………………………………..……………………….………………………………………………...70
4
SAFETY INSTRUCTIONS
The ATTEN AT-H551C complies with IEC1010-1 CATII-1000V overvoltage standards, See the specification Use the meter
only as specified in this manual, otherwise the protection provided by the meter may be impaired.
In this manual, a Warning identifies conditions and actions that pose hazards to the user.
A Caution identifies conditions and actions that may damage the Meter or the equipment under test.
International symbols used on the meter and in this manual are explained in Table1
Warnings and Precautions
To avoid possible electric shock or personal jury, and to avoid possible damage to the meter or to the
equipment under test, comply with the following practices:
Before using the meter, inspect the case. Do not use the meter if it is damaged. Look for cracks or missing
plastic. Pay particular attention to the insulation around the connectors.
Inspect the test leads for damaged insulation or exposed metal check the test leads for continuity. Replace
damaged test leads before using the meter.
Verify a meter’s operation by measuring a known voltage. Do not use the meter if it operates abnormally.
Protection may be impaired. When in doubt, have the meter serviced.
5
Do not apply more than the rated voltage, as marked on the meter, between the terminals or between any
terminal and earth ground.
Use caution when working with voltage above 30V ac rms, 42V ac peak, or 60V dc. These voltages pose a
shock hazard.
Use the proper terminals, function, and rang for your measurements.
Do not operate the meter around explosives gas, vapor, or dust.
Remove test leads from the meter before opening the meter case or battery door.
Do not operate the meter with the case (or part of the case) removed.
Please DO NOT input the voltage & current over the meter endure and operate as the following forms:
Function
Input Terminal
Max Input
V DC
V/Ω, COM
2000V DC not exceed 10secs, manual ranging measurement
V AC
V/Ω, COM
1000V AC rms not exceed 10secs, manual ranging measurement
Hz%
V/Ω, COM
250V DC/AC rms
mA AC/ DC
600mA,COM
600mA DC/ACrms
,
,
6
,not exceed 10secs
,250V/600mA fuse
V/Ω, COM
Ω
V/Ω
,COM
250V DC/AC rms
,not exceed 10secs
V/Ω
,COM
250V DC/AC rms
,not exceed 10secs
Cap
Lx
,
Lx COM
Adapter 10A DC/AC rms
, not exceed 10secs,build-in 250V/10A fuse
A AC/ DC
DO NOT input any voltage
Connect the test leads or the oscilloscope probe to the meter as the symbol indicator
When use the multimeter function, please disconnect the signal output line and the oscilloscope probe to the meter to
.
avoid high voltage electric shock.
Oscilloscope and the signal generator when used simultaneously, please keep the leave of oscilloscope probe being
the same with the signal output line to avoid damaging the meter or equipment
Do not measuring voltage if the voltage between COM and ground is up to 500V.
Do not measuring AC voltage if the voltage of the test circuit is up to 250V AC, except the external clamp accessory.
Do not connect to test leads and output line to voltage when in current, resistance, capacitance, inductance
measurements, as well as in signal output function.
Please turn off the meter when change the built-in fuse in current input terminal with the specified fuse.
When servicing the meter, use only specified replacement parts.
7
Table 1 International Electrical Symbols
AC(alternating current)
Earth ground
DC(direct current)
Fuse
AC or DC
Double insulate
Safety information
Shock hazard
Battery
Complies with EU directives
8
PRODUCT INTRODUCTION
Feature
50MHz Digital Storage Oscilloscope Meter (DSO) & 6600 count Auto Ranging Waveform Digital Multimeter (DMM) &
10Hz~156 kHz Function Generator (DDS)
60MHz frequency / duty cycle, 156kHz auto-ranging inductance/ 66000µF capacitance/ 60MΩ resistance(LCR),
remote control/ crystal detected measurements
Panel calibration without open the meter
The bandwidth of AC voltage is up to 20kHz and one key switch to waveform display, the max range is up to 2000V
In voltage range measurement, peak value detected and peak value hold, and display the MAX/MIN/current value
simultaneously on one screen.
In DSO mode, one key to switch auto-ranging measuring, automatically display the test waveform and automatically
ZERO calibrating.
Digital read out Vp-p, +Vp, -Vp, F, T, dV, dt and measuring parameters
Storage/ readout over 40 DSO waveform and 200 groups of DMM data; automatically record 200 groups of data for
detecting IC conveniently.
Generate Sine Wave, Triangle Wave, Saw Tooth Wave and Square Wave, and match using the DSO simultaneously
to found the test system.
9
200µS/400µS test square wave to detect the Ring signal generated by short circuit in Line output transformer
320 X 240 color liquid crystal display
Built-in 2000mAh Ni-Hi charge battery, external matched power adapter
USB interface
Function extended with optional accessories.
10
Instrument overview
Fig1. Panel of the meter
11
Instruction of every button, switch and keys
Item
Description
F1~F5 function key used to adjust the setting in DSO mode. Including system, menu settings and
1
2
settings in measuring mode
Code switch, matched F1~F5key and
to set the frequency of the output signal and to adjust
the measuring parameters in DSO mode
Power button; backlight display button. Press and hold this button no more than 2secs, the backlight
3
4
will be turned on, repeat the step again to turn off the backlight
Used to change the frequency of the output signal and test parameters in DSO mode
In DSO mode, this button used to enter or exit the systems setting; in DDM mode, this button used to
5
6
display waveform in V~ and mA~ measurement mode
Function rotary switch, used to select the range in DMM mode and DSO, DMM, DDS mode selection
Relative value measurement in DMM mode and used to choose voltage range manually in voltage
7
measurement range; press this button to select the mV range measurement.
8
AC/DC select button and continuity test, diode test and duty cycle test selection
9
Data hold/ waveform suspend
12
Fig2. Input terminal indicator
I/O Terminals
Item
Description
1
Input terminal for oscilloscope
2
Signal (sine wave, square wave, saw tooth wave, triangle wave )output terminal
3
Receive port for Remote Control
4
USB interface
5
Input terminal for inductance measurement
13
6
7
8
COM terminal for all DMM measurements
Input terminal for voltage, frequency, resistance and capacitance measurements and for
10A adapter measurement.
Input terminal for mA measurement (turn this jack with a coin to replace the spare fuse)
Back view of the meter
Fig3. Back view of the meter
14
Item
Description
1
Four screws for fixing the back lid
2
Spare fuse(open the small lid and fetch)
3
Terminal for Adapter charging the power and LED guide charging statues
4
Built-in reset switch
5
Back support lid
6
Scalable carry belt
15
BASIC OPERATION
Turn ON and Turn OFF the meter
Press the
button and hold for over one second to turn the meter on, press this button again to turn the meter off.
Auto power-off
The meter comes with auto switch-off function, 10mins after no change of the last selection function or rotary switch position.
This function can be selected to close in system setting where you can select manual power –off.
To protect the battery from excessive discharging, the meter will auto power-off when the capacity of the battery is low.
Buzzer alert following by consecutive 30secs before the power comes off.
Backlight display
Turn on the backlight in dark line environment to light the display reading. Press the
turning on the meter. Press this button again to turn off the backlight.
16
button to turn on the backlight after
Battery charging
Warning: Press the
button for many times will damage the battery, please avoid to pressing and holding this
button for long time.
When the meter is powered from the built-in battery/ adapter, the battery symbol icon
will be displayed on the right-up
corner of the screen. It can show you the capacity of the current battery.
The battery will be in charging mode or charging protection mode once the meter connected to the power adapter
The meter will automatically enter into charging mode and LED will show the charging statues when the meter is not supplied
the power. During charging, LED release orange light; when going to charge fully, LED release green light and flash; when
charging fully, LED release green light. If LED releases red light, power happens fault.
The adapter will supply power to the meter and charge the battery when the meter is turned on. The symbol icon
will be
displayed on the LCD.
If the meter is not used for a long period, please charge the meter every three months and the charging time should be longer
than 8hs.
17
Charging With Adapter
Warning: To avoid to damaging the meter permanently, please do not measure 250VAC or 360VDC when
connecting the adapter.
The main function of the AC adapter is charging the built-in battery. What's more, it also can supply power to the meter
directly and no consuming the battery. It can be connected to the meter any time.
The meter will change the statue from charging to working if press the power button
when the adapter is charging the
batter. Instead the step, the meter will change the statue from working to charging. To stop working, the meter should be
turned off and the adapter be disconnected.
The adapter is 12V/1A switch power type and has the feature of low ripple voltage, board voltage range, short circuit
protection and so on. Please change it with the same type.
18
Resetting
Warning: Before opening the back lid, please make the test probe away from the test point.
It may make the CPU to be down when measuring voltage. Resetting the meter will resolve the problem. Two resetting way
to choose: one is pressing the HOLD, SEL, REL buttons simultaneously; another is pressing the built-in switch (this way
needs to open the back lid with a screw, see the back view chapter).
19
OSCILLOSCOPE OPERATION
Basic content in oscilloscope mode
Warning: Do not touch the metal during the measuring process to avoid electric shock!
Display in oscilloscope mode (Fig 4.) ( here after called “DSO Mode”)
Sign al o utp ut
Aut o
Bat ter y in dicato r
1. 00k Hz
Se t up
s/ d is
Wavef or m d isp lay a re a
Disp
Ena ble
Save
Me nu
Freq
Dig ital re adin g o ut
Cycl e
System
No rm al
Tim e b ase /am plitud e
Fig4. Fig of the first time entering into DSO Mode
20
System setting and the menu
Turn the rotary switch to the DSO position and press the power button , the buzzer release in-continuous beep sounds and
the screen display analog bar indicating from 0% to 100%.
When the meter enters into the DSO mode, the current setting displayed. Press F5 key or wait for 30secs to exit and enter
into Normal Mode.
Press the DIS button to enter into DSO system setting window (Fig5.), the function of F1~F5 keys:
Key
Function settings
Selection
F1
Power-off
Manual/auto
F2
Coupling way
AC/DC
F3
Probe attenuation
1:1, 10:1, 100:1
F4
contrast
Rotary the Code switch or press the button
F5
Back
Back to the DSO mode
DIS
Open or close the buzzer
21
to adjust the contrast
Shu ton
Aut o
Co uple
Probe
Co ntr
Back
System set up
Fig5. Fig of system setting window
Tips for Key F1~F5 and button in DSO system setting:
1.
Press Key F1 to select manual/ auto power off. Auto power-off selected, the meter will power-off in 10 mins without any
action. The meter will not auto power-off if the meter is connected to the PC through USB.
2.
Press Key F2 to select couple way. When set DC couple, both DC and AC signal will pass; when set AC couple, only
AC signal will pass. If the percentage of DC signal is much bigger, the waveform of the test signal may displayed out of
the screen.
3.
Press Key F3 to set the probe attenuation. The setting will be the same as the probe’s attenuation. If the probe’s is x 1,
please set the probe attenuation to be 1:1; if x10, to be 10:1; if X100, to be 100:1(should purchase with this ratio probe).
If the setting of probe attenuation in system is different from the probe attenuation in the probe which may affect the test
reading.
22
4.
Press Key4 to adjust the contrast. Rotary the Code Switch or press the button
to adjust the contrast as the
working condition.
5.
Press Key5 to back. Press this key, “save” or “not save” will be showed for you to choose. Please choose “save” to save
the setting.
6.
Press DIS button (
) to close the buzzer. If the meter enters into continuity/ diode tests, the buzzer will be opened.
Press Key5 to enter into the menu on the Normal, Video, Single or Graphic mode (Fig 6.). The instruction of the Key1~Key5:
Key
Function setting
Selection
F1
Normal Mode
Measuring the repeatable waveform
F2
Video Mode
Detection of the waveform of the video
F3
Single Mode
Measuring complex waveform
F4
Function Extend
Spare function
F5
Graphic play
1~40 groups storage waveform
23
No rm al
Video
Sing le
Graph
System
Fig6. Fig of Menu
Tips for Key F1~F5 in Menu:
1.
Press Key1 to choose Normal Mode. When choosing auto ranging mode, the meter will automatically choose the
suitable Time base, the input amplitude control and the trigger level, and display many Cycles stable waveform and
digital readout Vp-p, +Vp, -Vp, frequency and Cycle simultaneously.
2.
Press Key2 to enter into Video Mode. Line and Field sync selection. Choose with the button.
3.
Press Key3 to select the Single Mode which is suitable to measure some complex waveform or capture sporadic signal.
Before measuring, Time base, Amplitude, Rising edge, Falling edge should to be set as the feature of the signal.
4.
Press Key3 to play the 1~40 stored waveform. Choose one by pressing the button
24
or rotary the Code Switch.
Normal Mode
When enter into Normal Mode, see Fig7. The function of the Key F1~F5, DIS and SEL button in this mode:
Button/key
Function
Selection
F1
Auto
Automatically set Time Base, Amplitude and Trigger
F2
Time Base/Amplitude
Manual adjust Time Base and Amplitude
F3
Digital read out
Display +Vp / -Vp / Vp-p Frequency and Cycle
F4
Save
Waveform save
F5
Menu
Choose the measuring mode or waveform readout
DIS
system
Couple way and attenuation setting
25
Aut o
Se t up
s/ d is
Disp
Ena ble
Save
Me nu
Freq
Cy cl e
System
No rm al
Fig7. Fig of Normal mode
Tips for operation of KeyF1 ~KeyF5:
1.
Press Key F1 to enter into automatically measuring. The meter will choose the suitable Time Base, Amplitude and the
Trigger condition and display stable waveform. During measuring, if Random Signal or Interference Signal comes on,
the sync may be unstable. Then please changing the measuring mode to the Single mode or press KeyF2 to manual
set the Time Base/ Amplitude.
2.
Press Key F2 to manual set the Time Base/ Amplitude. Select the suitable setting by turning the Code switch or
pressing the button
.
3.
Press Key F3 to display digital readout. Press Key F3 to open or close readout.
4.
Press Key F4 to save the current test waveform. (see Note1 and Fig 8. )
26
5.
Press Key F5 to enter into Menu. Then the measuring mode can be choose again.
Note1: press Key F4 to enter into save windows. The following form is the Function of Key F1~F5:
Key
Function
Selection
F1
Position No.
Choose by turn the Code Switch or press the button
F2
Save
Confirm to save
F3
Delete
Delete the choose Position No.
F4
Clear
Clear 1~ 40 of
F5
Back
Back to the mode before entering here
the stored waveform
Posi
Save
De l
Cle ar
Back
Posit io n 4 u nused
fig8. Fig of save window
27
Tips for Note1:
1.
Press KeyF1 to change the Number of the position. Every pressing Key F1 or
, the number of the position is
plus or subtract 1; or rotary the Code switch to choose the position quickly.
2.
Press KeyF2 to confirm saving. After press this button, the screen will show “be saving the data” and “saved
successfully”.
3.
Press KeyF3 to delete the selected position. Press this key and choose “Yes” or “No”.
4.
Press KeyF4 to clear all the stored waveform. Press this key and choose “Yes” or “No”.
5.
Press KeyF5 to choose “Yes” to confirm saving the data into the storage list and back to the current measuring mode.
Time base adjustment
In Normal Mode, press F2 to choose and set Time Base. Rotary the Code Switch or press the button
, the range of
Time Base change from 10ns/div ~ 1s/div. If measuring an un-known frequency signal, capture the waveform from the high
range of Time base and work down. Otherwise, because of “aliasing effect”, the waveform can not show the real waveform of
the signal.
To avoid Aliasing Effect, there are many ways: adjust the Time Base or press KeyF1 to choose auto measuring.
28
Vertical amplitude control
In Normal Mode, press F2 to choose and set Amplitude. Rotary the Code Switch or press the button
, the range of
Amplitude change from 20mV/div ~ 500V/div.
Waveform auto triggering
Waveform auto measuring adopts auto trigger mode. That is to say no detecting trigger condition but the meter still can
trigger. If no trigger condition, the meter will wait some time and self trigger to capture some data. Because of no setting
trigger level, the meter will show the rolling waveform or until capture the waveform. The waveform may be unstable if the
measuring signal includes interference signal, non-equal amplitude and unrepeatable waveform. At this time, press HOLD
button to show one waveform captured by high speed A/D for analysis of the feature of the signal. This function is called
“pause”. It had better choose Single Mode to measure no-rule signal.
Waveform measurement in Normal Mode
Connect the test signal to the oscilloscope input terminal. View LCD (system default setting probe attenuation ratio 10:1) to
check for the test waveform and press Key F1 to make the waveform to be stable (see note2). The digital read out area show
digital result. Press the button
or rotary the Code Switch to change the Time base setting. And press Key F2 to
29
change into the amplitude setting mode and the same way to change the amplitude setting.
The default setting is 1mV, 1ms( system setting 10:1)
When the meter display a stable waveform, the digital readouts +Vp
、-Vp、Vp-p directly displayed on the screen。If the
absolute value of +Vp equals –Vp’s which indicates the test wave is symmetrical wave; if choose DC Couple way, the margin
of +Vp and –Vp is the DC weight of the signal; if the amplitudes of the test wave are different, +Vp and –Vp is the max value
of the displayed wave. Therefore, getting the parameter readings of the test cycle signal should be computed as the reading
、
、
of CH xx(mV), M xx ms (s, ms, µs ns) under the display area. Every horizontal grip stands for xx ms (s, ms, µs ns) and every
vertical grip stands for xx (mV).
Note2: press KeyF2, the meter does not capture the stable waveform. There may be some reasons: A, the input amplitude of
the test wave is too low to capture; B, the frequency of the test signal is lower than 1Hz; C, the probe attenuation ratio setting
is wrong; D, the frequency is over the range; E, the weight of reference signal is larger than the test signal; F, the probe is
broken down or wrong connection; G, machine fault. (see the probe calibration way to check for the machine fault)
Video Mode
Before entering into the Video Mode, a safety information window will be opened. Press Key F5 to exit or wait for 30secs, the
meter will enter into Video measuring mode.
30
Key
Function
Selection
F1
Sync
Line, Field sync selection
F2
Polarity
Positive/negative
F3
Set
Time base/ Amplitude
F4
Save
Waveform saved
F5
Menu
Select the measuring mode and waveform playback
DIS
System
Attenuation and couple way setting
Tips for instruction of operation of the key & button in video mode:
1.
Press KeyF1 to enter into sync selection. Capture the Line or Field sync of the composite signal and display Line/ Field
sync.
2.
Press Key F2 to select the positive/negative polarity.
3.
Press Key F3 to set Time base/ amplitude setting. Adjust the setting by pressing the button or rotary the Code switch.
4.
Press KeyF4 to save the current waveform.
5.
Press KeyF5 to enter into menu.
6.
Press DIS button to enter into system setting mode.
31
Waveform measurement in Video Mode
Select the Video Mode Connect the test signal to the oscilloscope input terminal.
View LCD (system default setting probe
attenuation ratio 10:1) to check for the waveform of the Line/Field sync The digital read out area show digital result. Press the
button
or rotary the Code Switch to change the quantities of the displayed waveform. And press Key F3 to change
the Time Base setting mode into the amplitude setting mode and the same way to change the amplitude setting.
The default setting is 500mV, 25µs (system setting 10:1)
When getting a stable waveform, the parameter readings of the test sync signal should be computed as the reading of CH
、
、
xx(mV), M xx ms (s, ms, µs ns) under the display area. Every horizontal grip stands for xx ms (s, ms, µs ns) and every
vertical grip stands for xx (mV).
If the waveform is unstable, press the HOLD button and the screen will display one of captured waveform by high speed A/D
to analysis the feature of the signal.
Single Mode
In Single Mode (see fig9.), the function of KeyF1~F5:
Key
Function
Selection
F1
Single
Statues: start, wait
32
F2
Time Base/ amplitude/trigger
Time Base/ amplitude/trigger setting
F3
Trigger mode
Rising edge, falling edge
F4
Save
Save the waveform and stored in to the record list
F5
Menu
Select the measuring mode or waveform read out
DIS
System
Attenuation and couple
Parameters setting
Time Base/ Amplitude/ Trigger Level
Press to enter displacement
Display the stored waveform in the Buffer
Cursor measuring
Cursor measuring
Code switch
HOLD
Sta rt
Set
S/d iv
Shif t
Dis
Save
Me nu
System
Fig9: fig of Single Mode
33
Tips for KeyF1~F5 in Single Mode:
1.
Press KeyF1 to start measuring, the statues will changed form “start” to “waiting”. If the trigger level of the input signal
meets the setting condition, the screen shows the stable waveform. Press this key again to exit waiting mode
2.
Press KeyF2 to set the Time Base/ amplitude/Trigger mode. Turn the Code Switch or press the button to change the
setting value.
3.
Press KeyF3 to select trigger way. Rising edge or Falling edge selection
4.
Press KeyF4 to save waveform. Press this key to save the current test waveform
5.
Press KeyF5 to enter into menu
6.
Press DIS button to enter into system setting
7.
Press the Code Switch to enter into displacement setting. Rotary the Code Switch to change the setting.
Time base setting
Press Key2 to choose the Time Base, rotary the Code Switch or press the button
2.5µs ) and get the suitable waveform.
(Fig 10)
34
to change the setting (default
Sta rt
Sta rt
Set
S/d iv
Set
S/d iv
Trig
Trig
Save
Save
Me nu
Me nu
System
System
Fig10: Fig of Time base setting in Single Mode
Amplitude settings
Press Key F2 to choose Amplitude setting, rotary the Code Switch or press the button
,
:
to change the setting
(default 1V system 10 1 ) and get the suitable waveform.
Trigger condition settings
Press Key F2 to choose Trigger setting, rotary the Code Switch or press the button
condition and get the suitable waveform.
Press Key F3 to choose Rising Edge/ Fall Edge.
35
to change the Trigger
Horizontal displacement adjustment
When getting the stable waveform, press the Code Switch to enter into the horizontal displacement adjustment mode. Rotary
the Code Switch to change to adjust the displacement, and play back the waveform stored in the buffer. The sample reading
is displayed on the bottom of the displayed area.
Cursor measurement reading-out function
In the Single Mode, Press the HOLD button, the cursor will enter into the next window as the followings
Key
Function
F1
Top cursor
F2
Bottom cursor
Amplitude, bottom cursor moving
F3
Left cursor
Time, left cursor moving
F4
Right cursor
Time, right cursor moving
F5
Back
Back to Single mode
Cursor moving
Rotary the Code Switch to change the position of the cursor
Code Switch
Selection
Amplitude, top cursor moving
36
Up per
Lo wer
Le ft
Rig ht
Back
Sing le / curso r
M 1ms
CH 1 V
dv 4.0 0 0V
d t 4.5 0ms
Fig11: fig of cursor measurement
Tips for Key F1~ F5 in Cursor measurement reading-out function:
1.
Press KeyF1 to choose the top cursor and rotary the Code Switch to change the position
2.
Press KeyF2 to choose the bottom cursor and rotary the Code Switch to change the position
3.
Press KeyF3 to choose the left cursor and rotary the Code Switch to change the position
4.
Press KeyF2 to choose the right cursor and rotary the Code Switch to change the position
5.
Press Key F5 (or HOLD button) to exit and back to the single measuring mode menu
Press HOLD button to enter the cursor measuring mode. The reading dv/ dt will show the voltage difference and time
difference between two cursor.
37
Waveform measurement in Single Mode
Wait
Sta rt
Set
S/d iv
Set
S/d iv
Trig
Trig
Save
Save
Me nu
Me nu
System
System
Fig12. Fig of Waveform measurement in Single Mode
In Menu mode, press KeyF3 to select the Single Mode. Set the Time Base, Amplitude, Trigger way as the characteristics of
the test signal connected to the input terminal of the oscilloscope. Press Key F1, “waiting…” indicates. View the LCD to
check if a stable waveform displayed on the screen. Press the Code switch to adjust the displacement. Press the HOLD
button to enter into the cursor measuring mode and analysis the feature of the test signal. If the waiting time is too long,
please press Key F1 to exit waiting.
The default of Single measuring 1V 2.5µS (system setting 10:1)
38
Signal waveform hold
Continuative sampling the data, the waveform will be flushed. Hold the waveform is used to hold the current data or the wave
for analysis. Two ways can be applied to hold the waveform: press the HOLD button or sweep mode in single trigger
measuring.
Holding the waveform is different from saving the waveform. Waveform is used to hold the displayed reading, press this
button or change to other position, the data will be lost. If want to hold the waveform for long time, please use the saving
function.
Storage and reading out of the signal waveform
DSO database has 40 DSO waveform-data memory area. The operation of the storage/ read out:
1.
Waveform storing: in Normal Mode, Video Mode, Single Mode, press Key F4 to enter into saving window; as the
operation to choose to save the waveform.
2.
Waveform readout: in Normal Mode, Video Mode, Single Mode, press Key F5 to enter into the Menu to choose
Graphical Mode.
3.
Connect the meter to the PC, the stored waveform of DSO database will be displayed on the PC interface.
39
Signal source Operation
Signal source settings
Warning: In DMM current measuring mode, there will be high voltage danger if connect the output signal
to
the Ground terminal. And please do not connect any voltage signal to the signal source. Please keep the voltage
levels of the signal output line and the DSO probe are the same when simultaneously used the DSO and DMM.
Rotary the Function Switch to choose the DSO position, the meter is in Normal measuring mode.
Signal generating
The signal source adopts DDS Digital frequency synthesis technology and got a stable basic frequency through FPGA. The
frequency of the signal source is 156.25 kHz/n. Adjust the frequency of the signal as the following rule:
•
10Hz~100Hz, frequency step interval 1Hz.
•
100Hz~1000Hz, frequency step interval 10Hz.
•
1kHz~10kHz, frequency step interval 100Hz.
•
Above10kHz: 10427Hz, 11161Hz, 12019Hz, 13021Hz, 14205Hz, 15625Hz, 17361Hz, 19531Hz, 22321Hz,
26042Hz, 31250Hz, 39063Hz 52083Hz, 65500Hz, 65530Hz, 78125Hz, 156250Hz.
40
Signal source settings
In the Normal Mode, press and hold the Code switch for 2 secs until to hear the sound changing from “DI” to “DI DI”.
Release the button and the screen pop a window (Fig 12.)
Aut o
Se t up
s/ d is
Disp
Ena ble
S ignal so urce set t ing
S ignal so urce
Waveform
Freque ncy
Open
S quare T
853. 8Hz
F1
F2
Save
F5: yes
Me nu
System
No rm al
Fig12. Fig of signal source setting
Press KeyF2 to choose the type of the signal. The types of the wave: sine wave, triangle wave, positive saw tooth wave,
negative saw tooth wave, square wave and square T wave. The square T produce a special signal: 1kHz square wave
、
generated to be used to calibrate the probe; 200µs 400µs signal is used to match the DSO to detect the fault generated from
the Line output transformer.
41
Frequency selection
Press KeyF2 to choose the type of the signal. Press the button
or rotary the Code Switch to set the frequency of
the signal source. The adjustment range of the frequency is 10~15625Hz. Turn the Code Switch clockwise to set higher
frequency and counterclockwise to choose lower frequency. The higher the speed of the turning, the step interval is bigger.
Another way, press the button
to adjust the frequency. Press Key F5 to confirm the setting to be saved. The type
and the frequency of the setting signal source is showed on the left-top of the screen.
Close the output of the signal source
Repeat the above operation step to enter into signal source setting and press KeyF1 to choose closing the signal source
output. Then press Key F5 to confirm the changing setting again.
Calibration for the oscilloscope signal
If the probe is used at the first time, please calibrate it before using.
Rotate the Function switch to choose DSO Normal mode.
Choose the square T wave and turn the Code Switch and press the
to set the frequency to be 1.00kHz. Press
keyF5 to confirm saving the setting. Place the probe compensation switch to be X10 position and connect the head of the
42
probe to the signal output terminal. Press Key F1 to get a stable square wave.
Check the mode of the displayed waveform is “Over-compensation”“ Right compensation” ”Inadequate compensation”.
Please use the insulated screwdriver matched with the meter to adjust the capacitor in the front of the probe until the mode to
be “Right compensation” (see Fig13)
Right compensation
Over-compensation
Inadequate compensation
Fig13. Fig of compensation type
Tips: when the probe compensation is in X1position, the bandwidth is lower than 10MHz; after calibrating and the probe
compensation is in X10 position, the bandwidth can be up to 50MHz.
43
Digital Multimeter Operation
Turn the function switch to choose the DMM position
Warning:
To avoid the damage to the meter or the user, please make the probe away from the test point
when change the test range.
Display in Digital Multimeter (DMM) Mode
44
Basic function Instruction
Measuring function exchanging
Turn the function switch to choose the voltage V ; AC/DC voltage measurement(10A adapter, transistor hFE);
Remote Control/ Duty cycle/ Crystal oscillator; Ω
JxHz%:
: resistance/ continuity test/ diode test; Lx: auto ranging inductance test;
Cap (Cx): broad capacitance range; mA: auto ranging AC/DC current measurement
Manual ranging and auto ranging selection
In the AC/DC voltage measurement range: after turning the meter or changing the range, the setting is auto ranging
measurement. Press REL button to change to manual range and the “manu” displayed on the screen. The range changes
from 6.000V to 60.00V/600.0V/2000V/600.0mV. Press and hold the REL button for 2secs to back to auto-ranging and “Auto”
is displayed. (Note: in mV range, it’s normal that there are some digits on the screen)
600mV AC/DC voltage range is only manual ranging.
Data hold and list
1.
Press the HOLD button to hold the test reading and the symbol “H” is displayed. Press this button again to exit the hold
mode.
2.
Once the test reading is held, the measuring result is stored in the list and the stored position “ xxx(01~200) “ is
displayed.
3.
If change the function range, the meter will automatically exit hold mode.
45
In holding data mode, press KeyF3 to enter into the HOLD list.
Key
Function
Selection
F1
Storage
Store all the data
F2
Cursor↑
Move up
F3
Cursor↓
Move down
F4
Delete
Delete the current content
F5
Back
Confirm saving and back to the measuring mode
Pre./Nex.
Previous Page/ Next Page
Save
De lete
Back
Pgd n
Pgu p
Fig15. Fig of data list
46
Pg1
Tips of data hold list:
1.
Press Key F1 to put new record to the list. If not save, the data will be lost after changing the function.
2.
Press KeyF2 to move up the cursor
3.
Press Key F3 to move down the cursor
4.
Press Key F4 to delete the content of the current page.
5.
Press Key F5 to choose “yes” or “NO” to save the stored data. Press KeyF1 to exit.
6.
Press the button
7.
Turn the Code Switch to set the threshold. The setting range of threshold is 50~2000.Press this button to confirm
to view the stored data.( total pages: 10; every page 20 group data)
Auto record (threshold settings)
The smaller the threshold is, the sensitivity is higher (but easily referenced). If the threshold is 500 and the test range is
6.000V, when automatically record, if the reading is bigger than 500 digit (0.5V), the meter will judge the signal as an
effective reading; if the test range changed to 60.00V, the meter will judge the signal as the threshold is 5V(500 digit).
Continuously test and record 1~200 groups data. Only need to move the test point, the meter will automatically record the
test reading.
47
Alternate and direct voltage measurements
Fig16: Fig of AC/DC measurement
1.
Turn the function switch to choose the
2.
Plug the black test lead to the COM terminal and the red to V terminal.
position,
3.
Press the SEL button to choose AC/DC mode (AC mode will display “~” symbol)
4.
Connect the test leads to the test point and get the measuring result from the screen.
5.
Press the REL button to select manual ranging; press the HOLD button to hold the reading result and the Key F3 to
enter in to the HOLD list; press KeyF5 to enter into auto record mode.
48
Warning: To avoid to damage the meter, please do not input 1000V AC or 2000V DC to the test terminal for
10secs and please measuring the voltage of the electric circuit which is over 600V
Alternative and directive current (30mA/600mA) measurements
Fig17: Fig of mA measurement
1.
Turn the function switch to the
2.
Connect the test leads as the connection of Fig17 and the indicator in the screen. Plug the black test lead to the COM
jack and the red into the
position;
jack.
49
3.
Press the SEL button to select DC/AC mode (in AC mode, there will show the symbol “~”).
4.
Connect the test leads to the test point and get the measuring result from the screen.
5.
Press the REL button to do the relative value measurement; press the HOLD button to hold the reading result and the
Key F3 to enter in to the HOLD list.
Warning: Please DO NOT measure the AC current in AC 250V circuit to avoid the electric shock.
Operation of 10A adaptor
Fig18: Fig of 10A adaptor measurement
50
position;
1.
Select the
2.
Place the adaptor to the V and COM jack. And connect the test leads to the adaptor. Connect the black test lead to the
terminal of the adaptor connected to the COM jack and the red to the terminal connected to the V jack;
3.
Press the SEL button to choose AC/DC mode (in AC mode, the symbol “~” will be displayed); press the HOLD button to
hold data.
Tips for 10A adaptor measurement:
•
When measuring large current with the adaptor, the test time does not exceed 30 secs in every 15mins. Otherwise,
it may generate damage to the meter or the test line.
•
A fuse is built-in the adaptor. Please open the circuit to change the fuse.
Waveform display function
Fig19: fig of waveform display
1.
In the AC (voltage/ current) mode, press DIS button to display the waveform of the test signal. Press the KeyF1 “auto”
51
button to display the stable waveform. And the digital readings of the voltage/current and the frequency are displayed
under the waveform;
2.
Press KeyF5 to exit the waveform display mode and back to the voltage/current measuring mode.
3.
In the DC( voltage/current) mode, “non- AC mode!” is displayed.
Frequency and Duty Cycle measurements
Fig20: fig for frequency and duty cycle measurements.
1.
Select the
position;
52
jack;
2.
Connect the black test lead to the COM jack and the red test lead to the
3.
Press the SEL button to choose the measuring range: Hz / % ( the default setting is Hz measuring range); press the
HOLD button to hold data and KeyF3 to enter into the hold list.
Tips for frequency and duty cycle measurements:
•
In these two modes, the voltage of the test signal is no less than 500mVrms
•
REL function is not made function
Warning: Please DO NOT input the voltage exceeding 250Vrms.
53
Remote control and crystal oscillator detection
Fig21: figs for remote control (right) and crystal oscillator (left) measurements
1.
Select the
position; make the test remote control points to the receiver on the top of the meter. If the buzzer
built-in the meter release the sounds which indicates the remote control is good.
2.
Select the
position; connect the crystal accessory to the meter with plugging in COM,
and mA
jacks (see the right Fig of the Fig21). Replace the switch on the crystal accessory to the Jx position, plug the test crystal
oscillator and get the measuring result from the screen. The reading frequency is the Local Frequency of the crystal
oscillator. (test range: 32kHz~10MHz, wrong result reading will be displayed if larger than 10MHz ). If no reading on the
screen, there are some reasons as the following: a, bad connection for crystal oscillator; b, the frequency is not in the
test range; c, bad crystal oscillator; d, the fuse built-in the mA terminal is broken.
54
Resistance/ Continuity tests
Fig22: fig for resistance and continuity tests.
1.
Turn the function switch to select the
position. Connect the black test lead to COM jack and the red to the
jack. Press the SEL button to select the resistance range and connect the test lead probe to the test
resistance. Get the result displayed on the screen. Press REL button to get the relative value and Press the HOLD
button the hold the data and Key F3 to open the hold data list.
2.
Press the SEL button to select the continuity test range. If the test resistance is no more than 30Ω, the buzzer will
release the sounds. Press the HOLD button to hold the reading and Key F3 to open the hold data list. If the buzzer is
set to be closed, the buzzer will be open once the meter enters in to the continuity test/ diode test range.
55
Warning: Please disconnect the supplied power before measuring.
Diode /Transistor tests
Fig23: connection of diode and hFE tests.
1.
Turn the function switch to select the
position. Connect the black test lead to COM jack and the red to the
jack. Press the SEL button to select the diode test range. Connect the test lead probe to the test diode /
semiconductor PN junction. Change the connection in contrary and View the readings of the two connections on the
screen. If one of the reading is a voltage value( about 0.2~0.7V) and another is displayed “O.L”, which indicates the
56
diode / semiconductor PN junction is good; if the two readings are “O.L”, which indicates the diode is with open circuit; if
the two readings are zero or too low, which indicates the diode is with short circuit. Press the HOLD button to hold the
reading and Key F3 to open the hold data list.
2.
Turn the function switch to select the
position. (Connect as fig21). Press the REL button to select 6.000V range and
press SEL button to select DC mode. Select the hFE position and plug the transistor as the symbols “N” “P” “N”/
“P””N””P” printed on the crystal oscillator. The measuring reading is the amplify parameters of the transistor (1.000V –
1000 times).
Capacitance measurement
Fig24: connection of capacitance measurement.
57
position.
1.
Turn the function switch to select the
2.
Connect the black test lead to the COM jack and the red to the
3.
Make the test lead probe connect to the test capacitance. Get the measuring reading from the screen.
4.
Before measuring low capacitance, please press the REL button to release the reference. Press HOLD button to hold
jack.
the reading and KeyF3 to open the hold data list.
Warning: Please discharge the capacitor before testing to avoid damage the meter or the operator.
Inductance measurement
Fig25: connection of inductance measurement
58
position.
1.
Turn the function switch to select the
2.
Connect the black test lead to the COM jack and the red to the
3.
Make the test lead probe connect to the test inductance with the inductance test short line with crocodile clip. Get the
jack.
measuring reading from the screen.
4.
Press HOLD button to hold the reading and KeyF3 to open the hold data list.
Tips for inductance measurement:
The test frequency change in 300 Hz~156 kHz as the value of the inductance.
Relative value measurement mode
1.
The relative value measuring function can applied every range except the ranges including voltage, inductance,
frequency and duty cycle measurements.
2.
Press the REL button, the current value is save as the reference and the symbol will be displayed. The reading is the
difference equaling which the current value subtract the reference value.
3.
Press this button again to exit the REL mode and the symbol will disappear.
4.
When changing the range, this function will release.
59
Peak value Detecting (P-D) and Holding (P-H) Mode
Peak value detecting and measuring Mode can detect the max/min peak value, one screen displays the current reading. The
reading will flush as the measuring reading.
1.
Select the
2.
Press the SEL button to select the AC/DC mode; Press the REL button to select manual ranging and select the proper
position.
measuring range.
3.
Press the
button to enter into the Peak detecting Mode, the screen displays “P-D”, “Max0000/Min0000 “ and the
meter starts to detect and record the peak value.
4.
Press the
button to enter into the Peak Hold Mode, the screen displays” P-H”, the current test value and
Max/Min values which are the Max peak and Min peak values during the detection. ( During testing, do not broke the
detecting, otherwise, the Min value will be “0”).
5.
Press the
button to exit P-H Mode and enter into P-D Mode and the meter will go on to flushing the detecting
date.
6.
Press the
button to clear all the former record and begin new detection. If press and hold this button for over
2secs, the meter will exit P-H and P-D Mode. Press the SEL button, the meter will automatically exit the P-H/P-D Mode.
7.
Press the HOLD button, all the displayed readings will be held and show the symbol “H”. And the meter will store the
current readings and the position number. Press the HOLD button again to exit hold mode.
60
Technical Specification
General Specifications
Display
320 × 240 LCD
Battery
Built-in1600mAh Ni-Hi battery
Low Battery indicator
Used time
Approx. 3 hours
Work condition
0°C~+40°C;<75%RH
Dimension
200mm × 135 mm ×52mm
Operate height
0~2000m
Display area
78 mm x 58mm
Input impedance
DMM 10MΩ
Auto power-off
No action within 10mins
,
61
Charging time
More than 8hours
Memory
DMM 400groups data and DSO 40 waveform record
Storage condition
-10°C ~ +60°C; <90%RH
weight
Approx 1000g (Net weight)
Adaptor power
110V~250V 12V/1A, protection- switch power
,
Feature of Digital storage DSO
,sine wave response)
Analog bandwidth
DC ~ 50MHz, probe: X10; DC~6MHz, probe X1 (3db bandwidth
Max sampling rate
100Msps
Channel
1
couple
DC/AC
Input impedance
1MΩ//20pF
Div
vertical ±4 div
Vertical sensitivity
20mV/div ~ 50V/div 1-2-5
range
exchanging step
Time base
10ns/div ~ 1s/div 1-2.5-5 switch
Vertical amplitude
±(5%+ 0.1div)
Time base
±(0.01% + 0.1div)
Vertical
resolution
62
8 bits
horizontal 10 div
accuracy
accuracy
Auto-Zero calibrating
Trigger level
Trigger condition
Cursor measuring
Auto measuring
accuracy
Measuring
yes
Normal, Video, Single
mode
± 3.8 div (every step interval
Single slop of
0.04div)
selection
± 3.8div (every step interval
Auto setting
0.04div)
Vp-p +Vp -Vp f
measuring
±(5%+ 0.1div)
Auto setting time base and amplitude
、 、 、 、T
Auto
dV, dt,
Rising edge/ Falling edge
Waveform
(sinx)/x
Feature of DSO probe
Position: X1
Position: X10
Input resistance 1MΩ : input capacitance
compensation ratio: 1:1
46pF
DC~10MHz
probe
input voltage: 30Vp-p
Input resistance 10MΩ : input capacitance 15pF
compensation ratio: 10: 1
bandwidth
bandwidth DC~50MHz
input voltage: 300Vp-p
63
probe
Feature of DMM
Accuracy is indicated as
:± (a% reading+ digit). It has One-year calibration. It is referred to the following environmental
conditions: temperature: 23°C±5°C, <75%RH.
Function
DC voltage
AC voltage
DC current
AC Current
Range
Resolution
Accuracy
600.0mV
0.1mV
6.000V
1mV
60.00V
10mV
600.0V
100mV
2000V
1V
± (2.5%rdg + 10dgt)
600.0mV
0.1mV
50Hz~200Hz
6.000V
1mV
±(1.0%rdg + 5dgt)
60.00V
10mV
400Hz~20kHz
600.0V
100mV
1000V
1V
± (2.5%rdg + 10dgt)
60.00/600.0mA
10/100µA
±(1.0%rdg + 5dgt)
10.00A
10mA
Adaptor ±(2.5%rdg + 5dgt)
60.00/600.0mA
10/100µA
±(1.5%rdg + 5dgt)
±(0.8%rdg + 5dgt)
64
±(3.0%rdg + 10dgt)
(50Hz~400Hz)
50Hz~5kHz
(not for over 20kHz)
Resistance
10.00A
10mA
600.0Ω
0.1 Ω
6.000kΩ
1Ω
60.00kΩ
10 Ω
600.0kΩ
100 Ω
6.000MΩ
1kΩ
60.00MΩ
10kΩ
6 600nF
1pF
66.00 nF
10pF
660.0nF
100pF
6.600µF
1nF
66.00µF
10nF
660.0µF
100nF
6.600MF
1µF
66.00MF
10µF
10.00µH
0.01µH
0.1Ω*
0.1µH
± (5%rdg + 15dgt) please choose the proper measuring
100.0µH
1µH
range, other wise, the measuring reading will be affected.
0.2Ω
10µH
*: indicate inner resistance
1mH
100µH
.
Capacitance
Inductance
Adaptor
±(2.5%rdg + 5dgt)
±(1.0%rdg + 5dgt)
± (3.0%rdg + 5dgt)
± (3%rdg + 10dgt)
± (5%rdg + 10dgt)
Only for reference
65
1Ω
1mH
10mH
10mH
20Ω
100mH
50Ω
1H
1kΩ
2H
1.5kΩ
10.0Hz ~
Frequency
50.0MHz
0.1Hz ~ 10kHz
50MHz~60MHz
5dgt)
,
Duty cycle
10~94.9% (AC1Vp-p)
Diode test
Open circuit voltage: 3.2V Max test current: 1.5mA
Continuity test
if The resistance is <30Ω, the buzzer beeper
Auto ranging
Applied in every measuring range
Over range indicator
“O. L” (Over load)
Measuring rate
DMM A/D 2.5 S/s
,
waveform A/D 400kS/s
66
,
± (0.2%rdg + 5dgt) (no less than 500mV AC ) / ± (0.5%rdg +
,
Fuse feature
Φ5×20 0.5A/250V
,
adapter Φ5×20 10A/250V
Symbols and image icon
A /mA
Current unit
AC ~
Alternate current
AUTO
Auto ranging/auto sweeping/auto setting
ADP
hFE /crystal accessory
COM
Ground
Cap
Capacitance measuring range
DIS
Exchanging display/system setting
DC
Direct current
div
grip
hFE
Amplify of transistor
Hz
Frequency measuring range
HOLD
Data/Waveform hold
Jx
Crystal socket
V/ mV /
Voltage unit / ACV/DCV test Mode
f/T
Frequency/ Time
%
Duty cycle measuring range
Manu
Manual ranging selected
Max/ Min
Max value/ Min value
mF/ nF
Capacitance unit
ms/ ns/µ
µs
Time unit
P-D
REL
(DSO mode)
(32kHz~10MHz)
Peak value detection
REL/ manual ranging selection
67
dt
Time difference
SEL
Function exchanging
Adjustment button
Ω
Resistance unit
dV
Voltage difference
REL symbol
Trigger slop selection ( rising/falling
edge)
Diode
Buzzer opening/ closing
Capacity of the battery
Contact to the computer
Power/ backlight
Standard accessories:
•
Double plastic test leads
one pair
•
Oscilloscope probe
one pc
•
Signal output line
one pc
•
LC special testing line
one pair
•
10A current adapter
one pc
•
Power adapter
one pc
•
Crystal accessory
one set
68
•
Non-woven bag
one pc
•
User’s manual
one pc
•
USB interface
one pc
•
PC Software CD
one pc.
69
MAINTENANCE
•
Periodically wipe the case with a damp cloth and mild detergent. Do not use abrasives or solvents.
•
Dirt or moisture in the terminals can affect readings.
•
If no use for a long time, please pack the meter again and store it under the stored condition.
70
Nanjing Glarun Atten Technology Co. Ltd,
Building A8, Tanglang Industrial Zone, Xili,
Nanshan, Shenzhen, 518055, P. R. China
Tel:
Fax:
+86-755-6161 8252 / 6161 8291 / 2655 9660
+86-755-6161 8298
e-mail:
Web
[email protected]
:http://www.attenelectronics.com
71