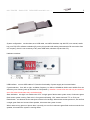
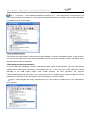
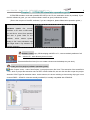
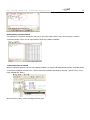
1
8051 TRACER
SIMULATOR
DEBUGGER www.8951.com -
1
Chapter One Introduction
Currently, the price of most professional 51 simulator in the market is more than 2000yuan (about US$300)
and beginners often can not afford it. Meanwhile, a large volume of simulator designed with SST single chip
solution is very slow and occupies much resources and it is not enough for real application. 51TRACER
simulator is a brand new professional simulator developed by Xuelin Electronics, Shenzhen who owns the full
intellectual property on it.
Top ten innovations:
1. It adopts the latest high-tech air-class magnesium alloy case, and imported flannel fabric bag.
2. A large number of devices using the latest technology and all SMT installed. Adopt imported tantalum
capacitor.
3. Comprehensive protection to avoid any possible mistakes. The power supply adopts fast-recovery
insurance, even if short-circuit, it could be effectively protected. All IO ports are designed with anti-shock
resistance and USB port is also designed with electrostatic prevention of the lightning strike.
4. Single USB interface, no extra power supply or serial port, real plug-in peripheral. Convenient for desktop
or laptop without RS232 interface. This product adopts 3 chip structure, that is simulation chip + monitor chip +
USB chip, which is a real individual simulator.
5. High speed of downloading at 115200bps, compared with the previous version, it is improved by more
than 10X.
6. Not occupy resources, no limit to simulate 32 I/O ports, serial port, T2 etc.
7. Compatible with keilC51 UV2 IDE, support single step, breakpoint, view/modify register, variable, IO and
memory data anytime. Support pause during full run, the system will stop at point to the next line to be executed.
Support simulation of all kinds of 51family chips, ATMEL, Winbond, INTEL, SST and ST. Support simulation of
ALE disable, PCA, double DPTR, and hardware SPI.
8. Multi-frequency crystal options: could select 4/11.0592/12/24 MHz as you wish. Solve the unstable issue
caused by long crystal cable.
9. Designed with system self-testing with speaker and LED indicator, convenient for debugging.
10. Designed with long pressing reset button to enter offline running mode, from PC perspective, the
simulator works like a real chip on the target board.
8051 TRACER
SIMULATOR
DEBUGGER www.8951.com -
2
System configuration:one simulator,once USB cable, one 40PIN simulator cap with DIP, one manual, textile
bag, one CD( KEIL software evaluation)(If you buy this product with testing instrumental of XLxxxx series from
our company, then it is not necessary to buy extra USB cable, simulator cap and the CD.)
Hardware overview:
USB interface:connect USB cable to PC,has the functionality of power supply and communication.
Crystal selection:from left to right, oscillation frequency is 4MHz,11.0592MHz,12MHz and 24MHz.One can
select any one of them( push up the switch to “ON”position ). Attention: it must have one and only one switch is
set to ON, else the simulator may work abnormally.
State indication:this light is a double-color LED. A single green flash means system reset; Continuous green
flash means system running. Red color is for system self-testing, “ON” means low level TTL on P1.0 port.
Reset button:two buttons are the same(one of them is for backup). When assert a short press on it, we can find
a single green flash and a sound from speaker, this means the system is reset.
When assert a long press on it(more than 3 second), we can find continuous green flash and two sounds from
speaker, this means the system is running offline.
8051 TRACER
SIMULATOR
DEBUGGER www.8951.com -
3
Chapter Two USB driver installation guide
51TRACER adopts USB communication, please follow below steps to install USB driver.
Step 1: Connect usb socket to usb interace on PC with a usb cable; It is shown founding new hardware
wizard; choose “from list or specified location (advanced)”option, and click “next”;
Step 2:choose“include this location for searching”, click “browsering”, switch to CD folder, like
“E:\drivers\XLISP driver\USBDRIVER2.0\”, click “next”;
Step 3: it is shown “hardware installation”dialog,if the system prompts “not pass windows icon
testing…”,just ignore it, and click “continue”, we can see the software installation is started. When it is shown
“complete new hardware wizard”dialog,click “complete”.
8051 TRACER
SIMULATOR
DEBUGGER www.8951.com -
4
Step 4: it is shown “new hardware installation is ready for use” at the right bottom. At this moment, you
can see the COM port information at: control panel\system\hardware\device manager, which means USB driver
is installed correctly in the system.
Tips for installation failure:
If the system exits abnormally or power down during installation, it causes a installation failure. At this moment,
you can see the USB device with yellow exclamation mark in the device manager window, just delete it and
reproduce above steps to reinstall it.
USB installation under special situation:
A normal USB driver installation scenario is like above steps. Under special situation, you may have already
installed other USB device, like printer, USB programmer, etc. In this case, the virtual COM port number
allocated to our USB maybe COM5, even COM6! However, the KEIL simulation only supports
COM1/COM2/COM3/COM4 four ports, how to solve this issue? A stupid solution maybe reinstall the OS and
install XLISP USB driver in the new system, there the COM port number is smaller.
Figure-1 when plugged with many USB devices on PC, the number is COM5 which is not supported by
KEIL software.
8051 TRACER SIMULATOR DEBUGGER www.8951.com Figure-2:move the mouse to the COM5 devices, right click and switch to “property” menu.
5
Figure-3: click “Port Setting”, then “advanced property”, in the COM option list, select an unused port,
like COM2.
Figure-4: system allocated COM3 to USB virtual serial port.
( Simulator connection graph: connect USB to PC, simulation cap to target development board, pay attention to
the frequency selection)
8051 TRACER
SIMULATOR
DEBUGGER www.8951.com -
Chapter 3
6
51TRACER simulator operation guide
51TRACER simulator works with powerful KEIL IDE( in the CD, the evaluation version is provided). If you
feel this software is good, you can contact software vendor to get a professional version.
( Due to the complex of the KEIL software, if you are a beginner, please follow below operation guide! )
Hardware
install:
first
connect
simulator to PC with a USB cable,
you will find a sound from speaker
and also a green flash on the
indicator,
which
means
system
testing is OK. Insert simulation cap
into target board. Pay attention to
insertion direction!
Software install: copy CD\developing tool\KEIL to C:\, remove readonly attribute of all
files.(must be C:\, other directory does not work)
Execute keil\uv2\uv2.exe.(You can create a shortcut at the desktop as your wish.)
create your first project (software operation guide):
1.click “Project” menu,select “New Project”, input project name, like "test". The extension of the saved file is
“.uv2”, which is project file extension name of KEIL uVision2.After this, we can click this file to open the project.
Attention: DON’T type file extension name. At this moment, it is shown a dialog to choose sing chip type. Let us
choose ATMEL---AT89C51. Note we actually use 89s52, it is totally compatible with AT890C52.
8051 TRACER
SIMULATOR
DEBUGGER www.8951.com -
7
2. create ASM source: click “FILE”->”NEW...” to open a text edit window. Input a program like “marqueen
lights”, then click “FILE”->”SAVE”, note the file extension name must be “.asm” such as “C:/prog/001.asm”
(Attention: no Chinese character for file name and not more than 8 ASCII chars, make sure the filename is like
[1-8 ASCII char].asm)
ATTENTION:
Please insert one line before main() function if C code:
char code dx516[3] _at_ 0x003b;
Please Skip interruption vector area until 0050H if ASM code, like:
org 0000H
ljmp main
org 0050H
main:....;
program starting point
If you do not follow above instruction, when loading program, the simulator will generate “dididi”alarm sound and
the simulation result maybe not correct.
As the development of the single chip machine technology, 00~40H is occupied by more and more new
registers, not the original 00~30H. If your program is still 30H, please adjust it to 40H or 50H, 80H. If you have
any question about it, please refer the program examples in the CD, they are all tested.
3. click “+”before “Target 1”, get to “Source Group 1”, right click it and select “Add files Group Source Group
1”, load one assemble source file into this project.
8051 TRACER
SIMULATOR
DEBUGGER www.8951.com -
8
4. Simulation part adopts MON51 protocol, please do setting as below before using it:
Click "Project", then click "options for target target 1", click output tab, check “Create HEX file”(generate hexfile)
option.
5. click "Debug" tab, select "KeilMonitor-51 Driver", check “load code into simulator”option, check “run to
main()” option, In option group“recover debug setting”, check “break point”,”browsing poing” and “memory
display”options.
8051 TRACER
SIMULATOR
DEBUGGER www.8951.com -
9
6. click "Settings" to select COM port.Make it consistent with the actual situation. Your PC may allocate
COM2 for your simulation. If you are not sure about it, you can check it at: control panel\hardware\PORT\COM
PORT. Meanwhile, please close other software may occupy the COM resources, like serial port debugging
software to avoid conflicts.( If you are using USB communication(not RS232), please choose the virtual COM
number that the system allocates.)
7. click icons that shown as below photo to compile the code,(or press down F7), after successful
compilation, you will see the result at the bottom window, like “…0 ( error ), 0 ( warning ) ”.
Beginner may often have error when writing program. Let us change the 3rd line from ORG 0080H to RRG
0080H, and do compilation and linking. Due to the syntax error, we can see “001.ASM(3):error A9:SYNTAX
ERROR” in the bottom window. Double click this message, locate to error line, after correction, recompile and
link until “…0(error),0(warning)”.
8051 TRACER SIMULATOR DEBUGGER www.8951.com 10
At this moment, we can see test.hex file is generated under the project directory. Once we have this hex file, we
can burn it into the CPU chip by ISP downloading.
Then we can do hardware simulation. Insert simulator cap into 40PIN socket on the target board, and begin
simulation.
8. Press down the 3rd icon
shortcut.
(debug) as shown in below photo to begin simulator or press Ctrl+F5
It is shown message like “Connected to monitor-51 v9.1”.
(if not, please check the setting carefully.)
(successful connection message for simulation)
8051 TRACER
SIMULATOR
DEBUGGER www.8951.com -
11
Chapter 4 51TRACER debugging tips
After enter debugging mode, we can see following debugging menu bar(most debugging menu items has
corresponding shortcut icon).
From left to right, they are reset、run、pause、step into(into function call)、step over(skip function call)、run until
current function exit、run to current line、next state、open trace、watch trace、disassemble window、watch
window、code scope analyze、1#serial window、memory window、performance analyzer、tool icon;
Press down the 2nd icon and connect related experiment resources. This example connect P1 port(JP44) to
8way indicators(JP32) with a 8pin line. Then, we can see the 8 lights turned on one by one.
⒈step into
click Debug->Step or the 4th icon or shortcut key F11 to trace program running process. Here, once press down
F11 key, the line is executed pointed by the arrow. At the same time, the arrow moves to next line. If function all
exists in the program, then simulation will get into that function and continue run as single step style.
⒉ step over
If the “Delay”program is wrong, it could be debugged by step into. However, if we already know the program is
correct, then it is not efficient to single step into it for each run. We can use F10 instead of F11 to avoid it,(menu
Step Over is also OK). When executed to “Delay” in main function, we can see the delay function is executed as
a single statement.
⒊ full run
Click this icon or F5 to staring full run. We can see LEDs turned on one by one on the target board.
⒋ pause
Click this icon or corresponding menu, we can see only one LED is on.
⒌ view/modify register value
Project window will show registers under debugging mode, which includes values of working registers R0~R7, A,
B and SP.
8051 TRACER SIMULATOR DEBUGGER www.8951.com Except for viewing the register value, user can also modify them.
12
For example, change the value of register “A” from 0x62 to 0x85.
Method 1:click register a with the mouse, and then click the value, when prompted with textbox, input 0x85;
Method 2:in the command window, input A=0x85,then press “enter” key to change register A value to 0x85.
6.view/modify memory value
Click menu “View-> Memory Windows”, we will see memory window. The Memory Window displays 4 different
storage areas. Click window number could switch among them.
In
Memory#1 tab, input “D:0e0h” and press “enter” key, we can see memory values are displayed from
address E0H. Note, E0H is the address of register A, so the value here is same as register value.
Click “Memory#2” tab, we can monitor another memory area.
反汇编窗口中的值相同。Memory#3 and Memory#4 is the same.
Modify data over Memory window
The data in Memory window is modifiable. For example, if we want to modify the value at address 0XE0: move
the mouse to the display position, right click the value and select “Modify Memory at D:0xE0”, input the data at
the dialog.
View data by command window
For example, if we want to view data space from address 0x01 to 0x03, we can input “D:0x01,03H” in the
command window. D means data space, 0x01 is staring address, 03H is ending address. The data value is
displayed in the output window。
8051 TRACER
SIMULATOR
DEBUGGER www.8951.com -
13
Modify data by command window
For example, if we want to change the value of p1 port from 0x02 to 0x05, only need to input p1=0x04 in
command window. Then, we can input d:00h to show if the data is modified.
7.view/modify value of variable
When the program pauses, we can view related variables. At monitor/call stack(watch) window, local tab shows
current local variables could be seen. “watch” tab shows variables specified by the user. ( press F2 key, let us
input variable like “delay”)
Move mouse to “delay” and a message indicator pops.
8051 TRACER
SIMULATOR
DEBUGGER www.8951.com -
14
Move mouse to one variable like “d1”, right click it then click (Add “d1” to Watch Windows…), click #1/#2,
the variable will occurs at the corresponding watch/call stack(watch) window.
Selected window shows the value of variable d1.
Modify variable method: left click the line of that variable, press F2, input data you want to set.
8.reset
If want to rerun the program, you can click the reset icon and reset the simulator. After resetting is done, the PC
counter is set to 0000H. Meanwhile, some internal registers are also reset, like set A to 00H, DPTR to 0000H,
SP to 07H, I/O port to 0ffH. At this moment, all the LEDs connected to P1 port on the target board.
9.set break point
Move the cursor to the source line, like “MOV P1,#0B6H”, click the break point icon, we can see a red mark on
the left of the line. ( click this mark will remove it.) We can set more breakpoints by this way.
8051 TRACER
SIMULATOR
DEBUGGER www.8951.com -
15
10.full run with breakpoints
Press F5 key to start full run, when the breakpoint is encountered, the program will pause at that line. At this
moment, you can see values of variables and ports. As below photo: the first breakpoint is after the line “mov
p1,#06dh”, input D:000h at the Memory#1 window, we can see the value is really “6D”!
The target board will display the state of current break point. Continue press F5, program pauses at the second
break point.
⒒clear all break points
If want to cancel all breakpoints, clear one by one is awesome, we only need to click this icon to clear all break
points in the program.
⒓run to cursor
Click reset button to restart the simulation. Click one line the we want to pause, then click this “run to cursor”
icon, we can see program pauses at this line.
13.exit simulation
First press down pause icon, then reset and
to exit simulation mode. At this time, we can modify the
program source, then we can do compilation and simulation.
ATTENTION!Because KEIL software keeps communication with simulator under simulation
mode, please better exit as above steps. DO NOT force to exit, else PC will down.
8051 TRACER
SIMULATOR
DEBUGGER www.8951.com -
16
Chapter 5: FAQ
Why the connection cannot be established under simulation mode?
1. USB driver may have not been setup successfully. Please check if it is OK at: control
panel\system\hardware\device manager. If you can see the COM port number information shown like below
photo. If not, please reinstall the USB driver or change to another PC and have a try: sometimes, if the USB port
number is changed, USB driver should also be reinstalled.
2 Simulation needs KEIL uv2 version 7.0 or higher version, ( Note some early version is not compatible), also
the software must be installed under C:\ root directory, can not be other directory! When creating new file, DO
NOT save it in other directory, also no Chinese character file name. Please strictly follow [1-8 ascii char].xxx
filename style.
3 Make sure the COM port selection is correct (If it is a new system that have not been installed other USB
device before, then the COM number should be COM3). Because simulation and programming both need COM
port, so when doing simulation, please close XLISP programming or other similar debugging software that may
occupy some COM port.
4. Make sure the simulator is reset well. Please press down the reset button. We can find a single green
flash and a sound from speaker and this means the system is reset. When assert a long press on the reset
button(more than 3 second), we can find continuous green flash and two sounds from speaker, this means the
system is running offline.
5. Check if the oscillation frequency is setup OK. One an only one frequency can be set.
6. Check if the simulator cap insertion direction is correct. Pay attention to make the first PIN of the cap(red)
align to first pin of the CPU. If the direction is invert, the system may become hot and light is dusky. Please
change the direction immediately.
7. Your target board may not works well, maybe no correct clock and reset on it. You can test it by burning a
program into the chip, if the burning is OK, it means the target board is correct.
8. Need extra power for target board?
8051 TRACER SIMULATOR DEBUGGER www.8951.com 17
Simulator cap could provide 5v/500ma power supply for the target board, in normal case, it is enough. If you fell
it is not enough, you can provide an extra 5V power by yourself. The system is designed for protecting it from
too high voltage power supply.
9. Why some port is not active?
Maybe the simulator cap connection is not tight. If possible, please unpack the simulator and have a measure
on it by a multimeter.
10.Is the clock and reset of the target board is still functional?
When using 51TRACER simulator, the clock and reset of the target board is taken over by the simulator.
11. Why the program is not stable?
Please insert one line before main() function if C code:
char code dx516[3] _at_ 0x003b;
Please Skip interruption vector area until 0050H if ASM code, like:
org 0000H
ljmp main
org 0050H
main:....;
program starting point
If you do not follow above instruction, when loading program, the simulator will generate “dididi”alarm sound and
the simulation result maybe not correct.
As the development of the single chip machine technology, 00~40H is occupied by more and more new
registers, not the original 00~30H. If your program is still 30H, please adjust it to 40H or 50H, 80H. If you have
any question about it, please refer the program examples in the CD, they are all tested.
12. If cannot make certain what is wrong with it, please long press down the reset button to offline running
mode. If the program still does not work well, please check your program.
13. If you want to simulate 2051, please refer to the pin definitions of 2051 and 51 and try to make an
interface adaptor. Usually, we suggest you just use the 51 simulation and avoid the resources that not exist in
2051.
Below is the photo of simulator-XL2000 connection
(connect USB to PC, simulator to target board, note the frequency)
51TRACER simulating XL2000 photo