1
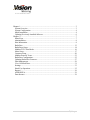
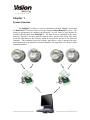
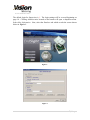
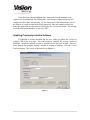
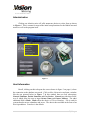
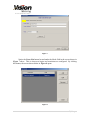
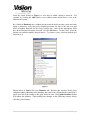
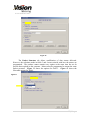
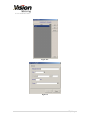
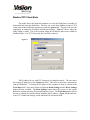
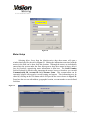
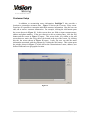
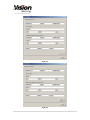
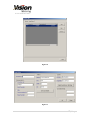
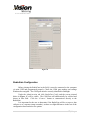
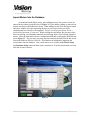
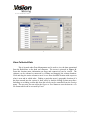
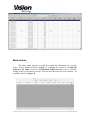
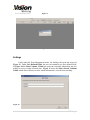
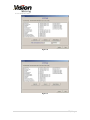
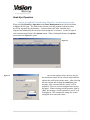
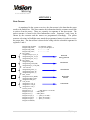
Vision Metering
EndSight™ User’s Manual
ES-090313-REV6
Chapter: 1 ............................................................................................................................ 3
System Overview ............................................................................................................ 3
System Configuration ..................................................................................................... 4
Initial Installation ............................................................................................................ 4
Updating Previously Installed Software ......................................................................... 6
Chapter: 2 ............................................................................................................................ 7
Home Page ...................................................................................................................... 7
Administration ................................................................................................................ 8
Host Information ............................................................................................................. 8
RadioGate ..................................................................................................................... 13
RadioGates Setup .......................................................................................................... 14
Modbus/TCP Client Mode ............................................................................................ 16
Meter Setup ................................................................................................................... 17
Customer Setup ............................................................................................................. 20
Modbus Protocol Tester ................................................................................................ 23
RadioGate Configuration .............................................................................................. 25
Updating RadioGate Firmware ..................................................................................... 27
Data Management ......................................................................................................... 29
View Collected Data ..................................................................................................... 31
Settings .......................................................................................................................... 33
Hawk Eye Operation ..................................................................................................... 35
Reports .......................................................................................................................... 36
APPENDIX A ............................................................................................................... 39
Data Streams ................................................................................................................. 39
2|Page
Chapter: 1
System Overview
The EndSight™ software is used in conjunction with both Vision™ meters and
the Radio Gate™ collectors which create the complete DataonDemand™ system. The
meters are programmed to customer specifications. Several forms of data streams are
available and selectable from EndSight™. The data stream is embedded in the meter
firmware. Therefore, the meter must be ordered with a specific data stream. The meter
sends this information to the collector which in turn delivers the data to the head end
computer. This computer houses the software that allows a user to interpret the data,
print reports and create a historical customer database. See Appendix A for details of data
stream information.
3|Page
System Configuration
It is suggested to use Windows 7 and have a minimum of 2GB of RAM installed.
This software is used in conjunction with Microsoft® SQL Server 2008 R2 Express with
tools. Two SQL Server installation files have been provided. Ensure installation of the
correct version depending on whether your system is 32bit or 64bit. For 32bit systems
use the SQLEXPRWT_x86_ENU.exe file. For 64bit systems use the SQLEXPRWT_x64_ENU.exe
file. Depending on the computer’s operating system it may be necessary to download
other service packs from the Microsoft website www.microsoft.com/download in order
for the server to be installed and run properly. Upon downloading the server follow all of
the instructions and prompts provided by the installation guide.
Initial Installation
Once the server is installed, the next step is to install EndSight. If this is the first
time EndSight is being installed, follow the next steps. If there was an older version
installed previously, follow the steps provided in the next section “Updating Previously
Installed Software”. To access the setup wizard, locate the provided “EndSight” folder.
Copy the both files and run “setup.exe” to the desktop. This folder and file are shown
below in Figure1.
Figure 1
Double click this file and the setup process will begin. Follow the prompts
during the process and when setup is complete click the finish button. Open the program
by clicking on the newly created shortcut icon located on the desktop. The main screen is
shown below in Figure 2. When the program opens, the user will be prompted to login.
4|Page
The default login for Supervisor is 1. The login settings will be covered beginning on
page 10. Clicking Administration located on the banner will open a dropdown menu.
Select Host Information. Next, select the Database tab which reveals the screen shown
below in Figure 3.
Figure 2
Figure 3
5|Page
From the screen shown in Figure 3 the connection from the database to the
software may be established. By clicking the Create Database button on the left, this
connection will be done automatically. Do not change any of the information in any of
the fields as it is used to make the needed connection. Once the connection has been
made, the connection may be tested by clicking the Test Connection button. The message
received at this point should be “Connection OK”.
Updating Previously Installed Software
If EndSight is already installed and the user wishes to update the version of
software, follow the next steps. First and foremost, uninstall the existing version of
EndSight. Install the updated version as described in the previous section. However,
when opening the program initially, instead of creating a database, click the Update
Database button. This screen is shown below in Figure 4.
Figure 4
6|Page
Chapter: 2
Home Page
Now that everything is installed and running properly, it is time to become
familiar with the EndSight software itself. Start by dissecting the home page. Shown
below is the main page where navigation through EndSight™ begins.
Figure 5
This is the home page shown in Figure 5. While in sub categories or different
pages, returning to the home page can be done with a left click on Home. On this page
the date and time are displayed in the lower left hand corner. In addition, notice the
communication status which can be either OFF-LINE or READ DATA. Just below the
communication status section are the Start and Stop buttons which begin or cease data
collection respectively. To begin collection of data left click the Start button and to stop
collection of data left click the Stop button.
Along with the Home button;
Administration, Data Management, Reports, Sentry 950, Logout and Exit are located
on the banner near the top of the page. Before continuing forward into each of these
segments, notice the Exit button. A left click on this tab will close this program.
7|Page
Administration
Clicking on Administration will offer numerous choices to select from as shown
in Figure 6. This is a menu for most of the initial setup functions for the RadioGates and
meters as well as the program itself.
Figure 6
Host Information
Recall, clicking on this tab opens the screen shown in figure 3 on page 6, where
the connection to the database was made. Click on Host Information and open a window
like the one pictured below in Figure 7. In this window there are four subsections;
General, Database, Packet Structure and Geo Service. General provides three fields,
two of which allow the user to input Owner Name and Owner Address. The other
additional field is Mode. Mode offers the choice of File or Database. File is used for
systems that do not use a database and server. The data is then available in the form of an
Excel spreadsheet. Database is the default.
8|Page
Figure 7
Notice the Users List button located under the Mode field in the screen shown in
Figure 7 above. This is where user logins and restrictions are configured. By clicking
this button, the screen shown below in Figure 8 opens.
Figure 8
9|Page
From the screen shown in Figure 9 a user may be added, edited or removed. For
example, by clicking the Add button, a new window opens which allows a user to be
added to the system.
By clicking on Database tab, a window that provides the ability to enter a new user name,
assign a password, verify the newly assigned password, the role of the new user and
select accessible functions for the newly created user. Once all the appropriate fields
have been filled and selections are made, click the OK button. To edit a user, select the
desired user and then modify the preferences. To remove a user, select the desired user
and remove it.
Figure 9
Shown below in Figure 10, is the Database tab. Because this step has already been
completed while connecting to the database and it has been verified that the connection is
good; leave all of the setting on this page alone for now. The Update Database button
will update the database. Upon making any changes to the following screens, always
click the Update button.
10 | P a g e
Figure 10
The Packet Structure tab allows modification of data stream delivered.
However, the selections made in fields 3 and 4 must coincide with how the meters are
programmed. The packets cannot contain every option at the same time but we do
provide these options to the customer. Meters must be programmed to stream the same
packet structure. Figure 11 shows the options for field 3. Figure 12 shows the
selectable options for field 4.
Figure 11
11 | P a g e
Figure 12
Figure 13 shows the Geo Service screen. Here the user may enter the local
address which simplifies the map search when locating a meter’s geographic location.
Enter the address and click the Get Coordinates button then click Update. The HTML
field is only used if the user chooses to use a server other than default.
Figure 13
12 | P a g e
RadioGate
Figure 14 is a picture of the RadioGate data collector with the cover removed.
In location 1 there are three LED’s. Green will be illuminated when power is supplied.
Red will pulse and is the “heartbeat” of the RadioGate. Yellow will be illuminated as
data is being received. Location 2 is the jumper J3 used when switching between
dynamic and static IP addresses. Location 3 is the connection for the internet cable. This
is only used on the primary RadioGates sending the data to the head end computer.
Location 4 is the power connection for 120/277. Location 5 is the mini USB connection
which is used to program the RadioGate with the computer.
Figure 14
1
2
3
4
5
13 | P a g e
RadioGates Setup
Clicking on this link opens the page shown below in Figure 15. Here is where
maintaining control of the RadioGates in the field is accomplished. This is used for the
RadioGates that have direct access to the internet. Other RadioGates in the field share
information, collect data, and retransmit data to the primary RadioGates with internet
connections which send the information to the head end computer. This window
provides access to add, remove or edit RadioGates. When adding a RadioGate to the
system click the Add button and a window that looks like the one in Figure 16 opens.
There are several fields to input. RadioGate Name can be any characters. Simply use
the IP address or the physical address. Type should typically remain Modbus master.
The IP and Port is the actual IP address of the RadioGate. Period is the time frame of
reporting data from the RadioGate to head end computer. The time is assigned in
seconds. For example, if the request was to have the data transmitted every five minutes
the entry in this field would be 300. The user may also edit an existing RadioGate by
clicking Edit. To remove a RadioGate from the system click on the chosen RadioGate
and simply click Remove.
Figure 15
By clicking the Groups button located on the right side of the screen shown
above in Figure 15, the user can create different RadioGate groups. This is useful for
separating multiple RadioGates according to location with respect to report generation.
After clicking the Groups button the screen below in Figure 15 A will open. Here the
user may add, edit or remove groups. Once a group is created, it becomes selectable
when adding a new RadioGate as shown in Figure 16.
14 | P a g e
Figure 15A
Figure 16
15 | P a g e
Modbus/TCP Client Mode
This mode allows the head end computer to access the RadioGate or standby for
transmitted data from the RadioGate. The user can switch from Modbus master to TCP
client mode in the RadioGates setup menu under the general tab. This gives the user the
opportunity to change the IP address information remotely. Figure 17 shows where the
mode change is made. This is the location where the IP address and Port are added for
Modbus Master. For TCP Client, only the Port field is entered.
Figure 17
The IP address for use with TCP client may be changed remotely. The user enters
the existing IP addresses in the Connect to fields. This must be entered to communicate
with the RadioGate. To change the IP address of the computer it must be entered in the
Write Data field. Once these fields are filled the Read Settings and the Write Settings
buttons become available. The Read Settings button allows the user to see the current
RadioGate settings remotely (Period and Repeater Level). The Write Data button allows
the user to change the current settings including the IP address. Figure 18 shown below
is the TCP Connection Settings screen and shows the discussed fields.
16 | P a g e
Figure 18
Meter Setup
Selecting Meter Setup from the Administration drop down menu will open a
window that looks like the one in Figure 19. Editing the information associated with the
meters in the field can be done from this location. Although the meters are individually
entered into the system under the Data Management drop down menu in Import Meters
Into the Database, customizing meter information is done here. The Serial Number
field will already be filled in after importing the meters, however from here you can add
Communication ID, Account ID and Customer Name. This customization can be
extremely helpful with regard to record keeping and reports. This information may be
edited by clicking on the Edit button which will provide the screen shown in Figure 20.
From here the user can edit address, geographic location, account number or user defined
field data.
Figure 19
17 | P a g e
Figure 20
While in the Edit Meter screen the user may enter the address for the meter
location. Once the fields are filled in, click on the Get Coordinates button. Now that the
latitude and longitude fields have populated, click the Select Location on the Map button.
From the screen in Figure 21 the user may mark the exact location of the desired meter.
The user may select Map or Satellite and mark the exact location before clicking the
save button.
18 | P a g e
Figure 21
Figure 22
After meter locations have been saved in this fashion. The user will have the
ability to find a meter location from the View Collected Data screen. Simply double click
on any given meter row and the location will appear in a new window. This is shown in
Figure 22.
19 | P a g e
Customer Setup
In addition to customizing meter information, EndSight™ also provides a
location to personalize customer data. Figure 23 shows the Customer Setup screen.
From here it is possible to customize individual customer information. Here the user can
add, edit or remove customer information. For example, clicking the Add button opens
the screen shown in Figure 24. In this screen, there are fields to input customer name,
address and phone number. If the user chooses to edit an existing entry, click the Edit
button and the screen in Figure 25 opens. This screen looks very similar to the add
screen however, notice the Assign Meter tab located at the top of the screen. By clicking
this tab, the screen shown in Figure 26 opens. Lastly, the user can edit the meter
information associated with the customer by clicking the edit button. This action opens
the window shown in Figure 27 which allows the customization of meter, address, user
defined fields and even geographic location.
Figure 23
20 | P a g e
Figure 24
Figure 25
21 | P a g e
Figure 26
Figure 27
22 | P a g e
Modbus Protocol Tester
The RadioGate is equipped with flash memory. This allows for access/display of
the most recently collected data. Under the Administration menu, choose Modbus
Protocol Tester and a screen will appear similar to Figure 28.
Type in the IP address and SCDA port of the RadioGate desired. It may be
necessary to manually input the flash beginning parameter, which should begin at 4000.
To insert this manually, check the Flash check-box and enter into the fields Sart=>4000
and Length=>80. Length indicates the number of records to retrieve. Typically, manual
entry for these fields may only be required when installing a new RadioGate collector.
Viewing individual records and saving is done in the same fashion as the previous section.
Click on Read Data and the fields will populate with meter information. From the
Serial Number drop-down box, a user can choose any meter ID the RadioGate has
collected (Figure 29). To view how many records the RadioGate has collected, simply
click on Total Records and a pop-up screen will display this information (Figure 30).
Figure 28
Modbus Protocol Tester is
used primarily for
diagnostic purposes and
accessing data in a manual
fashion.
EndSight Data collection
and reporting services are
discussed in later sections
of this manual.
23 | P a g e
Figure 29
24 | P a g e
Figure 30
RadioGate Configuration
Before placing the RadioGate in the field, it must be connected to the computer
via mini USB and programmed properly. Check the COM port number and settings
Windows has assigned. The COM port must be correctly identified in EndSight
Under the Administration tab click RadioGate Config and the screen pictured
below in Figure 31 will be visible. The COM Port will automatically be selected and
shown in that field. Click the “Connect” button to communicate directly to the
RadioGate.
It is important for the user to determine if the RadioGate will be set up as a data
collector or as a repeater (range extender), as there are slight differences in the rest of the
configuration between these two options.
25 | P a g e
Figure 31
The screen shown in RadioGate Config is broken down into the following fields:
MAC: Is the assigned number to the board and firmware in each RadioGate. This
cannot be changed.
J3: Is the status of the J3 jumper (page 14). This is used to change the IP address setting
from Static to Dynamic. When the jumper is in place the setting is Dynamic and when it
is not the setting is Static. If the RadioGate is connected to the computer when the
jumper is applied or removed press the enter key to refresh the setting. The Dynamic
setting allows the router to assign the IP address. When using the Static IP setting the IP
address must be entered manually.
To change the following fields enter the information below and press the enter key:
IP: Enter the IP address only if J3 is off (Static IP is in use) and click send.
MASK: Enter Mask address only if J3 is off (Static IP is in use) and click send.
GATE: Enter Gateway only if J3 is off (Static IP is in use) and click send.
HOST: This is the address of the head end computer. To change the address, enter the
IP address and click send.
26 | P a g e
PORT: This is part of the IP address and can be changed by entering the correct port and
clicking send.
TIME: This is the time frame of how often the RadioGate transmits the data to the head
end computer. The time can be changed by entering the desired time (in seconds) and
clicking send.
SCDA: When using Modbus master with Endsight the SCDA port must match. If it
needs to be changed enter the proper number and click send.
REPEATER: The RadioGate can be used to extend the range of the RF path between
meters and a RadioGate collector. To configure as a repeater, input 1-10, where 10 is the
strongest level of RF. To configure as a collector, input 0; the field will indicate Repeater
OFF. Vision recommends always setting repeaters with 10 for best function.
BootLoad: This is used to update the firmware of the radio gate. The RadioGate
firmware can be updated by clicking the Bootload button. This prepares the RadioGate
for programming which can be done with a flash programmer. This will be discussed
thoroughly on page 29.
The screen can be refreshed by clicking the refresh button. To exit the screen
pictured in RadioGate1 click the close button.
Updating RadioGate Firmware
In order to program the RadioGate with updated firmware, the use of the LM
flash programmer is required (provided). Conncet the RadioGate to the PC via the mini
USB cable. This cable provides power to the RadioGate so external power source is
necessary. Open the RadioGate configuration screen and connect to the RadioGate.
Click the Bootload button and the message “Bootload Command Was Sent” will be
displayed. Also, on the RadioGate configuration screen under the MAC address, “Ready
for Programming” is visible. This is shown below in Figure 32.
Close the RadioGate configuration screen and open the LM flash programmer.
The main screen is the one pictured below in Com/flash1. Under configuration, make
sure that the fields are filled out or selected as shown. Quickset is set to “manual”,
interface is set to “serial” with baud rate set to 115200 and transfer size is 60. The COM
port may be different as it is selected for you automatically unless it has been saved to
reuse. Select the program tab which opens the screen shown in Com/flash2. Ensure that
the reset MCU box is checked and the field for the program address offset is 1000. After
selecting the firmware file with the browse button, click the program tab in the lower left
corner and the process is started. The progress of programming is displayed by
percentage and when the programming is complete, it is stated at the very bottom left
hand corner of the window (Programming Complete).
27 | P a g e
Figure 32
Com/flash 1
28 | P a g e
Com/flash 2
Data Management
This is the second drop down menu on the home page. This menu provides access
to Import Meters into Database, View Collected Data, Meter Search, Settings and
Hawk Eye Operation as shown in Figure 33.
Figure 33
29 | P a g e
Import Meters Into the Database
As mentioned under Meter Setup, when adding meters to the system, meters are
entered in the window pictured below in Figure 34. Here adding, editing or removal can
be done similarly to the RadioGates Setup. When adding a meter click the Import button
and a new window will open requesting the user to select a previously saved file
containing the list of meters to be imported. This file can be acquired from Vision’s
production department, if requested. When clicking the Add button, the user may select
between entering a serial number manually and selecting from a list of already imported
meters. Enter the information for the communication ID and serial number fields like the
one in Figure 35. The user may also enter data for both user-defined fields in this screen.
Once both fields are filled in, click Ok. This finalizes the addition by importing the
recent entries into the database. Now, these meters are accessible under Meter Setup
and Customer Setup where the data can be customized. From this location the user may
also edit or remove meters.
Figure 34
30 | P a g e
Figure35
View Collected Data
This is located under Data Management and is used to view the data transmitted
from the RadioGates to the head end computer. The screen is pictured in Figure 36.
From this location meter information on usage and connectivity can be viewed. The
columns can be widened or narrowed by clicking and dragging the column boarders.
Click and drag the entire column to move it to a more desirable location with respect to
what is seen and in which order. Finding a particular meter’s geographic location (if it
has been entered into the system) is done easily by double clicking on that meter here.
Including or excluding certain data from this screen can be controlled from the Settings
menu. The user may also use utilize the Export to Excel button to save the data in a .csv
file format which can be accessed by Excel.
31 | P a g e
Figure 36
Meter Search
The meter search function is useful for locating the information on a specific
meter. In this window pictured in Figure 37, searching for a meter by Account ID,
Address, Last Name or the two User-Defined Fields (discussed next) is possible.
Simply choose your method of search, fill in the field and click the Search button. An
example is shown in Figure 38.
32 | P a g e
Figure 37
Figure 38
Settings
Lastly under the Data Management menu, the Settings tab opens the screen in
Figure 39. Under User Defined Fields, the user can customize two user defined fields.
In Figure 40 the Data Columns Visible tab opens the selectable information the user
wishes to see in viewing collected data. Figure 41 shows the Meter Search Columns
Visible which allows the user to select which information is viewed from searching.
Figure 39
33 | P a g e
Figure 40
Figure 41
34 | P a g e
Hawk Eye Operation
Only for use with the Vision Metering “Hawk Eye” elevated metering system.
When selecting Hawk Eye Operation in the Data Management menu, the screen below
in Figure 42 will open. The fields in this window will only populate with meters that
have been imported into the database. As shown below the meter listed has been
imported and additionally this meter has been assigned to a customer. On the far right of
each customer/meter listed is the options button. When clicking this button, the options
screen shown in Figure 43 opens.
Figure 42
Figure 43
Here in the options screen, the user may set
the maximum current for the selected meter and also
operate the cutoff switch in the meter. After selecting
the max current and clicking the send button, the
message “Max current allowed is saved” will be
displayed. The max current setting has been sent to
the meter. When selecting switch operation “On” or
“Off”, the message “Switch operation is saved” will
be displayed. The command to change the switch
setting has been sent to the meter.
35 | P a g e
Reports
By clicking the Reports link on the banner, the dropdown menu containing
Preferences and Create Report becomes visible. This is shown below in Figure 42. By
clicking Preferences, the screen shown in Figure 43 becomes visible. From here the user
may select which fields are to be present in the created report. After selecting the desired
criteria, click the Update button to save selections. By clicking on Create Report, a
window like the one shown in Figure 44 appears. If multiple RadioGates with IP address
are used then the user can select a specific group of RadioGate from which to create a
report. Otherwise, click the radial box for RadioGates and then check the RadioGate
followed by clicking the Report button. The user may also select the preferred sorting
criteria for the report. The report will then be generated and open in a new window
through explorer. It is automatically saved in the EndSight folder. Every time a report is
generated, the existing saved report will be replaced by the latest unless the user changes
the saved file name. The user can also right click on the report and choose to print. An
example report is provided in Figure 45.
Figure 44
36 | P a g e
Figure 45
Figure 46
37 | P a g e
Figure 47
38 | P a g e
APPENDIX A
Data Streams
As mentioned in the system overview, the data stream is the data that the meter
sends to the RadioGate. This data contains the information that the customer would like
to retrieve from the meter. There are currently six segments of the data stream. The
packet structure is found in the Host Information screen. Segments 3 and 4 may be
chosen by the customer and the meters are programmed accordingly. The packet
structure selections in EndSight must match the programmed meters in order to receive
the proper data. The data stream is shown below along with the selectable segments for
segments 3 and 4.
3
3
3
4
4
unsigned long SerNum; // 8 numerical symbols
unsigned long TotA;
// 4 bytes of Total phase A
unsigned long TotB;
// ...................... B
unsigned long TotC;
// ...................... C
Rec_stream
unsigned long Tot_rec_A;
unsigned long Tot_rec_B;
unsigned long Tot_rec_C;
kW_stream
unsigned long kW;
unsigned long CUM_kW;
unsigned long C_CUM_kW;
mVA stream
unsigned long mVA_A;
unsigned long mVA_B;
unsigned long mVA_C;
Date_stream
unsigned int Year_Month;
unsigned int Date_Hour;
unsigned int Min_Sec;
Volt_stream
unsigned int Volt_A;
unsigned int Volt_B;
unsigned int Volt_C;
Current_stream
unsigned int I_A;
// ABC phases ***Currents
unsigned int I_B;
// ABC phases
unsigned int I_C;
// ABC phases
unsigned int ph_A;
// ... phase_A in 10ths,...
unsigned int ph_B;
// ... phase_B in 10ths,...
unsigned int ph_C;
// ... phase_C in 10ths,...
unsigned int chksum;
Received
Energy Stream
kW Stream
mVA Stream
Date-Time
Stream
Volt Stream
39 | P a g e