1
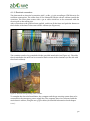
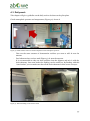
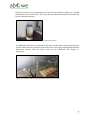
Report no: O4.2 O4.2 USER GUIDELINE FOR “PILOT B” OPERATION Version 2.0: Tim Freidank Vygintas Daukšys Thorsten Ahrens November 2013 Disclaimer This publication has been produced with the assistance of the European Union (in electronic version provide link to http://europa.eu). The content of this publication is the sole responsibility of authors and can in no way be taken to reflect the views of the European Union. Ostfalia University of Applied Sciences Index 1. GENERAL DESCRIPTION ............................................................................................ 6 1.1 INTRODUCTION ....................................................................................................................................... 6 2. EQUIPMENT DESCRIPTION .........................................................................................7 2.1 STAINLESS STEEL FERMENTER ................................................................................................................ 7 2.2 SCREW CONVEYOR ................................................................................................................................ 13 2.3 AGITATORS ........................................................................................................................................... 14 2.4 HEATING SYSTEM ................................................................................................................................. 14 2.5 INSULATION ......................................................................................................................................... 15 2.6 PILOT B PIPE PLAN ............................................................................................................................... 16 2.7 DRUM-TYPE GAS METER ....................................................................................................................... 17 2.8 GAS ANALYZER ..................................................................................................................................... 18 2.9 MEASUREMENT OF PH ......................................................................................................................... 18 2.10 TEMPERATURE MEASUREMENT........................................................................................................... 19 2.11 ELECTRIC CONTROL CABINET...............................................................................................................20 2.12 COMPUTER CONTROLS ........................................................................................................................ 21 3. PROGRAM DESCRIPTION (”BIOREAKTOR”) ........................................................... 22 3.1 INTRODUCTION ..................................................................................................................................... 22 3.2 FILES.................................................................................................................................................... 23 3.3 PROGRAM DESCRIPTION ....................................................................................................................... 24 3.4 PROGRAM ”GASUHR” (GAS COUNTER) .................................................................................................. 24 3.5 PROGRAM ”BIOREAKTOR”..................................................................................................................... 24 4. WORK INSTRUCTIONS FOR PILOT B ....................................................................... 29 4.1 PLANT INSTALLATION ON TESTING LOCATION ........................................................................................ 29 4.1.1 General issues ............................................................................................................................. 29 4.1.2 Electrical connection ..................................................................................................................30 4.2 START-UP ............................................................................................................................................. 31 4.2.1 Initial filling of the fermenter .................................................................................................... 31 4.2.2 Starting a new test ..................................................................................................................... 32 4.3 DAILY WORK......................................................................................................................................... 33 4.4 ON-SITE LABORATORY ANALYSIS........................................................................................................... 37 4.4.1 pH-Measurement ....................................................................................................................... 37 4.4.2 Estimation of buffer capacity (VOA/TAC) ...............................................................................38 4.4.3 Determination of Ammonia ...................................................................................................... 41 5. GENERAL TROUBLESHOOTING ............................................................................... 45 2 5.1 ELECTRICITY SUPPLY PROBLEMS ........................................................................................................... 45 5.2 LEAKAGES OF THE FERMENTER ............................................................................................................. 46 5.3 OTHER PROBLEMS ................................................................................................................................ 47 5.3.1 Common sense ............................................................................................................................ 47 5.3.2 Process optimization .................................................................................................................. 47 6. TROUBLESHOOTING LITHUANIA ............................................................................ 48 7. REFERENCES ............................................................................................................ 52 FIGURES Figure 1: Process flow diagram: plug flow fermenter (STRABAG, 2012, adapted) ................... 6 Figure 2: Interior of Pilot B Container.Left side: Laboratory, plant steering and measuring equipment. Right side: fermenter with technical equipment. ................................................... 6 Figure 3: Overflow box at the end of the fermenter. In the center the pipe bend DN 50 to adjust the overflow level............................................................................................................. 7 Figure 4: Main fermenter outlet DN 100. In the picture with a connected hose to drain the fermenter content....................................................................................................................... 8 Figure 5: View on the agitators. Four of them are arragened horizontally over the lenght of the fermenter.............................................................................................................................. 8 Figure 6: Pt100 temperature sensor (left) and mounting for the pH-sensor (right). In the center is the gas outlet to the gas measuring system. ................................................................ 9 Figure 7: Openings in the fermenter wall to observe the fermenter content. .......................... 10 Figure 8: DN 50 ball valve for sampling of the fermenter content. .......................................... 11 Figure 9: Supply hopper (top) and screw conveyor (bottom) ...................................................12 Figure 10: Geared motors for mixing of the fermenter content................................................12 Figure 11: Flexible coupling between motor and agitator shaft. ...............................................13 Figure 12: Motor of the screw conveyor. ...................................................................................13 Figure 13: PT 1000 temperature sensor (foreground) and insulated covers (background). Spare mounting for temperature-/ pH-sensor (right) and gas inlet from the gas measurement system (center). ......................................................................................................................... 15 Figure 14: Scheme of Pilot B pipe plan. ....................................................................................16 Figure 15: Drum type gas meter Ritter TG3-PP-PP. ................................................................. 17 Figure 16: Gas measurement system PRONOVA SSM 6000 for CH4, CO2, H2S and O2. ........ 18 Figure 17: Main electric cabinet inside of the container. It controls all of the fermenter functions. The fermenters main switch is attached to the front of the cabinet. The switch to choose between manual- and auto- mode can be found there as well (see chapter 3. ). ........ 20 Figure 18: Desktop computer for plant control. The two black boxes (right and center) provide emergency power supply for the computer and the gas measurement system in case of a blackout. .............................................................................................................................21 Figure 19: Sample of a .log-file. Showing users comments and system settings. .................... 22 Figure 20: Sample of a "Bio_xxxxxx.txt" file. Showing all recorded data from the fermenter. .................................................................................................................................................. 23 Figure 21: Program "Gasuhr" (gas counter) ............................................................................. 24 Figure 22: Program "Bioreaktor" – sheet ”Settings”. The picture shows translated user interface. Picture is adapted, original language is German. .................................................... 25 3 Figure 23: Switch on the main electric cabinet to choose between manual- and auto- mode. Below the plants main switch................................................................................................... 25 Figure 24: Program "Bioreaktor" - Sheet "Scheme". User interface is translated to English. Picture is adapted, original language is German. .................................................................... 27 Figure 25: Leveling of the container with wooden boards (left). The rubber matt provides a large supporting surface. Leveling with flagstones (right). ..................................................... 29 Figure 26: Main electrical connection in outer electric cabinet (left). Main fuse and electric meter (right). ............................................................................................................................ 30 Figure 27: Metal stick for grounding of the container. ............................................................ 30 Figure 28: Initial filling of the fermenter. Can be done manual (left) or with technical support (right) in this case a manure pump. ..........................................................................................31 Figure 29: Improvised U-tube manometer attached to the fermenters main valve ................ 32 Figure 30: Small weather station to check temperature and atmospheric pressure. .............. 33 Figure 31: Manual feeding via the receiver tank. ..................................................................... 33 Figure 32: Electric meter in the electric cabinet outside of the fermenter (left) and gas counter inside the container (right). ........................................................................................ 34 Figure 33: The fermenters level indication windows ............................................................... 34 Figure 34: The condensate bottle after the gas quality measurement ..................................... 35 Figure 35: Vessel for condensed water from the gas measurement system. ........................... 35 Figure 36: Example of data recording in the provided journal. .............................................. 36 Figure 37: Laboratory equipment for different analysis. (1) SCHOTT pH-meter, (2) titrator, (3) laboratory scale. .................................................................................................................. 37 Figure 38: Buffer solutions pH 4.01 and pH 7.00 for calibration of the pH-electrodes.......... 37 Figure 39: Samples taken from the fermenter. In the front a sieve to remove solid particles (left). Solid particles removed from the sample with the provided sieve (right). .................... 38 Figure 40: Sample preparation for VOA/TAC analysis. .......................................................... 39 Figure 41: VOA/TAC analysis with titrator. ............................................................................. 39 Figure 42: Dr. Lange LCK 302 cuvettes for ammonia analysis; cuvette with green liquid is already used, the one with the clear liquid is a new one. ..........................................................41 Figure 43: Step by step guide for the Dr. Lange LCK 302 ammonia cuvette test. ................... 42 Figure 44: Dr Lange LP2W spectral photometer for on-site NH4-N determination. .............. 42 Figure 45: Precise dosing pipette with mounted disposable tip. (1) two-step button; (2) tip removal button; (3) dosing adjustment regulator; (4) dosing indicator; (5) disposable tip. .. 43 Figure 46: Pipettes adjustment example, with adjustment regulator (black) and adjustment value screen. ............................................................................................................................. 43 Figure 47:Two step button using example. Pos. A shows first rest; pos. B shows second rest. .................................................................................................................................................. 44 Figure 48: Spilt fermenter content after a longer electrical shutdown of the fermenter. ....... 45 Figure 49: Improvised u-tube manometer connected to the main valve. Pressure balanced (left). Overpressure (right). ...................................................................................................... 46 Figure 50: H2S-sensor from the gas warning system. Sensor had a closed circuit, causing false alarms. ............................................................................................................................. 48 Figure 51: Rubber hose of the pump from the gas measurement system. Replaced due to wear marks/sounds........................................................................................................................... 49 4 Figure 52: Titrator with marked exchange unit. The upper part can accidently be moved which results in an error message. ........................................................................................... 49 Figure 53: Gas outlet for the gasmeasuring system. Due to clogged openings by condensate they have been exchanged to outlets with a bigger diameter as shown in the picture. ........... 50 Figure 54: Sealed leakage at the thermometer of the gas clock. Sealed with glue and sticky tape. ........................................................................................................................................... 51 Figure 55: Covered supply hopper to avoid emission of bad odors. ......................................... 51 TABLES Table 1: VOA/TAC value meaning ........................................................................................... 40 ABBREVIATIONS DN CaCO3 CH4 CO2 d g H2S H2SO4 Hz l LxWxH m m M M min N NH3 NH4-N NW O2 PMMA rpm TAC V VDE VOA vTI diameter nominal calcium carbonate methane carbon dioxide day gram hydrogen sulfide sulfuric acid hertz liter length x width x height meter prefix: milli ISO metric screw thread prefix: mega minute normal concentration ammonia ammonium nominal diameter oxygen Poly(methyl methacrylate) rounds per minute total anorganic carbon volts German electro technology association volatile organic acids von Thünen Institut 5 1. General description This chapter gives an overview over the main plant devices, their functionality and the plant control. 1.1 Introduction The pilot plant is designed for long term continuous operation to estimate the biogas potential of various substrates using the principle of plug-flow dry digestion (see Figure 1). Due to its size, real size material (as it would be used in full scale plants) can be used. This allows the process simulation of full-scale biogas plants. Figure 1: Process flow diagram: plug flow fermenter (STRABAG, 2012, adapted) The pilot plant is also equipped with all necessary lab material to estimated process relevant parameters (see Figure 2). With its possibilities it can be used as a training device for future plant operators, as a research facility for biogas issues as well as a demonstration object for interested people. Figure 2: Interior of Pilot B Container.Left side: Laboratory, plant steering and measuring equipment. Right side: fermenter with technical equipment. 6 2. Equipment description The following chapter will give an overview over the main components of the fermenter. All appendices mentioned in the following description will be part of the manual provided with the pilot plant but will not be part of this document! 2.1 Stainless steel fermenter The experimental reactor consists of a stainless steel fermenter with the following dimensions. Longitude: 2850 mm Width: 420 mm Height: 700 mm The complete fermenter is received by a frame, which is mounted on the ground. The front area of the fermenter has a bevel with an angle of 30 degrees, which is required by the inclined installation of the spiral conveyor. There is an overflow box at the back end with an adjustable pipe bend of the size DN 50 (see Figure 3). By changing the inclination of the pipe bend can be adjusted in the fermenter at a level of at least 450 mm and a maximum height of 600 mm. Figure 3: Overflow box at the end of the fermenter. In the center the pipe bend DN 50 to adjust the overflow level. 7 In the floor of the fermenter at the rear end is located an outlet DN 100, which is closed with a ball valve (Figure 4). Figure 4: Main fermenter outlet DN 100. In the picture with a connected hose to drain the fermenter content. The fermenter is equipped with 4 pieces of horizontally arranged agitators (see Figure 5). Figure 5: View on the agitators. Four of them are arragened horizontally over the lenght of the fermenter. 8 Between the agitators measuring points are located, permanently installed in the fermenter, for temperature and pH measurement. The sensors dive in open conduits below (Figure 6). Figure 6: Pt100 temperature sensor (left) and mounting for the pH-sensor (right). In the center is the gas outlet to the gas measuring system. The upper end of the fermenter is formed by 5 cover pieces, which are screwed together gas tightly with 14 M8 nuts each and the corresponding seals. A cover has the connection for the gas hose, which leads the biogas to the gas meter. A further cover has a pipe connection DN 50 with a closure through which is the possibility to get into the fermenter without opening the cover. The covers have the same size, so the position can be replaced. 9 When looking from the operator side, the fermenter has 9 sight glass openings (Figure 7). They are arranged perpendicular to each 3 pieces of the fermenter height. The windows are made of PMMA (Plexiglas) and are screwed with the fermenter via an O-Ring Seal. The PMMA is very sensitive to impact; therefore the sight glasses are to be treated with extreme caution. Figure 7: Openings in the fermenter wall to observe the fermenter content. Furthermore 6 ball type valves DN ½” with hose connectors and a ball valve DN50 are mounted on this side to take samples from the fermenter. The ball valves have a protection against accidental changing. This has to be pulled upwards to allow turning of the ball valve (Figure 8). 10 Figure 8: DN 50 ball valve for sampling of the fermenter content. The high quality steel fermenter has an electric heater, which is applied as a surface heating mat on the fermenter. The heating has 3 heating circuits which can be switched independently (see chapter 3.5 . for detailed information). Each of the heating circuits has a temperature sensor PT 100, which is used to control the heating. The heating circuit 1 is located on the left long side (stirrer implementing side) of the fermenter, the heating circuit 2 on the right long side (operator side) and the heating circuit 3 on the floor. The loading of the fermenter is realized via a supply hopper (Figure 9). The maximum capacity is approximately 35 liters. From this supply hopper the material gets into the screw conveyor. The screw conveyor then transports the material into the fermenter. 11 Figure 9: Supply hopper (top) and screw conveyor (bottom) On the right long side is a crossbeam attached to the frame, on which the motors are attached to the agitators (Figure 10). Figure 10: Geared motors for mixing of the fermenter content. 12 The agitators are mounted in bearings on the metal walls of the fermenter. The bearing shells are bolted and sealed with O-ring seal. On the closed side is set a Gliding-surface bearings. The continuous side is sealed with a double mechanical seal and supported with a ball bearing. The connection to the motor forms a flexible coupling (Figure 11). A detailed view of the agitator bearing is shown in the drawing 116-179,02,01:00 in Appendix 1. Figure 11: Flexible coupling between motor and agitator shaft. The complete plant is shown in the drawing 116-179,01,00:00 in Appendix 1. 2.2 Screw conveyor Figure 12: Motor of the screw conveyor. The screw conveyor (Figure 12) type U-120 x 1200 is used to transport the fermenting materials into the fermenter. The screw conveyor was coupled to a rotary valve (not installed). This means that the screw conveyor is always working, even if the rotary valve is on, regardless of the set operating and break times of the screw conveyor. It must be ensured that the screw conveyor runs until there is no more feeding material in the conveyor. The complete description of the screw conveyor can be found in the Appendix 8. 13 2.3 Agitators The arranged agitators within the fermenter are used for transporting and mixing the fermenting materials. They are powered by geared motors with a frequency converter type MOVIMOT R57F DT71D4/MM03/BW1. The motor has a transmission output speed of 1.5 – 7.5 rpm. This range can be changed by setting the speed of the frequency converter. For this the overhead locking screw (SW 8) in the connection box of the motor is opened. The subjacent controls can be adjusted in a range of 0 to 100 percent. This corresponds to 0 % of the revolution speed of 1.5 rpm and 100 % of the revolution speed of 7.5 rpm. The intervening area is divided linearly. Any changes of the revolution speed may not happen with the motor running. The complete description of the geared motor can be found in the Appendix 9. The agitators are designed as a transverse paddle and are operated individually. The controlling and timing of the agitators is carried out by the computer, at which different operating modes and operating times can be set for each agitator. Before beginning the operation of the agitators must make sure that no objects are in the paddle area. The agitators must not operate in normal operating mode with the cover open. If it´s necessary to operate with covers opened, it must be ensured, that there is no person in range of the agitators! 2.4 Heating system The heating consist of a heating mats set, which is mounted directly on the outer surface of the fermenter. It consists of 3 heating circuits that are mounted on the left and right sides and on the floor of the fermenter. The maximum power input of the heating circuits is shown below: Heating circuit 1 Heating circuit 2 Heating circuit 3 left side right side Floor 1000 Watt 1500 Watt 1200 Watt The nominal temperature of the heating system is 80 °C. The heating system is controlled from a computer, in which both the temperature in the fermenter and the heating temperature can be set as references values. The fermenter must not be heated in unfilled conditions and must always be filled to the minimum level (450 mm) in the normal operating mode. 14 The application and installation instructions for the heating mats are summarized in Appendix 2. 2.5 Insulation The fermenters heating system is insulated by a 60 mm glass wool matt with a cover made of aluminum sheet. The insulation is permanently installed and recessed at the viewing windows and the shaft bushings. The upper end forms cartridges (Figure 13) that are loosely placed on the cover. For this reason the passages for the pH values and temperature measurement remain free. Figure 13: PT 1000 temperature sensor (foreground) and insulated covers (background). Spare mounting for temperature-/ pH-sensor (right) and gas inlet from the gas measurement system (center). It is important to ensure that humidity does not penetrate the isolation. 15 2.6 Pilot B pipe plan The pilot plant has two main circuits of hoses. The first one is sucking the gas from the fermenter to the gas measuring system. After measuring the gas is pumped back into the fermenter. The second hose system connects the fermenter with the gas storage bags (1, 2 and 3) with a volume of 250 liters each. The gas is going over the gas clock to estimate the formed gas volume. From the bags the gas can be pumped into the atmosphere or to the supplied gas burner. Anyway the gas is going through an activated carbon filter for H2S-reduction. A detailed pipe plan is shown in Figure 14. Figure 14: Scheme of Pilot B pipe plan. 16 2.7 Drum-type gas meter Figure 15: Drum type gas meter Ritter TG3-PP-PP. For measuring the amount of gas produced during the fermentation a drum-type gas meter type TG3-PP-PP is used (Figure 15). The gas connection on the cover of the plant is made with a PVC-hose NW13 connected to the input of the gas meter. Previous to the gas meter is a T-piece on which a closing clutch is attached to the terminal of the analyzer. The same Tpiece is installed at the gas outlet of the gas meter. This offers the possibility of gas analysis before and after the gas meter. The gas meter must be filled with a sealing liquid (e. g. water) and placed exactly in horizontal position. The counter output is connected to the computer and there is stored in a data file. The complete description of the Drum-Type gas meter can be found in the Appendix 5. 17 2.8 Gas analyzer Figure 16: Gas measurement system PRONOVA SSM 6000 for CH4, CO2, H2S and O2. For the measurement of the gas composition a gas analyzer SSM 6000 is used (Figure 16). The gas analysis is performed for the gases methane, hydrogen sulfide, oxygen, and carbon dioxide. The determined values are also stored in a data file on the computer. The complete description of the Gas analyzer can be found in the Appendix 6. 2.9 Measurement of pH For the measurement of the pH values it is used an industry electrode EGA 153I/S in a special length of 650 mm. The signal is processed by the measuring amplifier and transmitted to the computer. For the temperature compensation a resistance thermometer Pt1000 is used. This will simultaneously measure the temperature inside the fermenter. The measured values are stored in a data file in the computer. The implementation of the pH measurement to the other measurement point should be changed with the temperature sensor in the sense of an exact temperature compensation. The measuring points that are not being used must be closed with a dummy. The pH electrode is made of glass and therefore very fragile. Must have extreme caution when handling. 18 The cable has a degree of protection IP65. No moisture or humidity must get into the connector. The complete description of the measuring electrode and the measuring amplifier can be found in the Appendix 4. 2.10 Temperature measurement The temperature in the system is measured at 6 different locations. The measuring points and the associated sensors are shown below: Temperature 1 in fermenter Temperature 2 in fermenter Temperature in the sealing liquid gas meter Temperature heating system 1 Temperature heating system 2 Temperature heating system 3 Pt 100 Pt 1000 (T-compensation for pH) Pt 100 Pt 100 Pt 100 Pt 100 The measured values are used to control the heating system and stored in a data file in the computer. The complete description of the temperature measuring amplifier can be found in the Appendix 3. 19 2.11 Electric control cabinet The control cabinet (Figure 17) operates the motors and the heaters, directly controlled by the computer. In addition, the panel processes the measurement signals from the sensors and outputs to the computer. For this purpose the cables have to be connected (analog and digital) on the computer and the control cabinet. The selector switch (manual / auto) is to be switched according to the required operating mode of the program. The manual operation is necessary to set up the test. The automatic mode turns on when the test should run independently. The circuit diagrams are shown in Appendix 1. Figure 17: Main electric cabinet inside of the container. It controls all of the fermenter functions. The fermenters main switch is attached to the front of the cabinet. The switch to choose between manual- and auto- mode can be found there as well (see chapter 3. ). 20 2.12 Computer controls As control computer a conventional desktop PC is used (Figure 18), which was equipped with an additional analog card for recording the measured values and with a digital card to issue the control signal. To compensate electrical misbalance in the grid, emergency power supply units have been installed. Figure 18: Desktop computer for plant control. The two black boxes (right and center) provide emergency power supply for the computer and the gas measurement system in case of a blackout. The two 37-pin cables from the cabinet are as follows on the PC to connect: Analog connector → upper 37-pin terminal strip on the back front of the PC Digital connector → lower 37-pin terminal strip on the back front of the PC (Umwelt- und Ingenieurtechnik GmbH Dresden, 2005) 21 3. Program description (”Bioreaktor”) This chapter introduces the program ”Bioreaktor” which is used to control the fermenter functions. 3.1 Introduction The program “Bioreaktor” and the associated measurement program for the gas meter “GU” are Windows programs, which were created using LabView 6i. The program can be found in the directory C:\Bioreaktor\data. The data files are interpreted as text files and can be opened and edited in MS-Excel, MSWord and MS-editor. For each data file exists a Log- file, which is provided with the same name but the extension .log. This file stores all set parameters and the current as header information is stored for this test. Figure 19 shows a sample of this .log-file. Figure 19: Sample of a .log-file. Showing users comments and system settings. A file that is still being processed can be opened but not edited. 22 3.2 Files With every measurement the following data is stored in columns in the file ”Bio_xxxxxx.txt”: TB1 (Fermenter temperature 1) in °C TB2 (Fermenter temperature 2) in °C TG1 (Gas temperature in the counter) in °C TH1 (Heater temperature left, as seen from screw conveyor) in °C TH2 (Heater temperature right, as seen from screw conveyor) in °C TH3 (Heater temperature bottom) in °C pH-value CH4 in Vol% H2S in ppm O2 in Vol% CO2 in Vol% Gas volume in Liters Date Time (See Figure 20 for a sample) Figure 20: Sample of a "Bio_xxxxxx.txt" file. Showing all recorded data from the fermenter. In the directory ”C:\Bioreaktor\daten” the file Gas_uhr.ini is located. This file contains the actual value from the gas-counter and the corresponding time. 23 3.3 Program description When starting a test with the bioreactor, the program GU should be started first. Afterwards the program “Bioreaktor” should be started. 3.4 Program ”Gasuhr” (gas counter) The program shows up as shown in Figure 21 Figure 21: Program "Gasuhr" (gas counter) With this program the gas counter can be displayed independently. The light above the button “Start” shows if the measurement is ready (green) or stopped (red). Stopping the measurement is done by clicking the button “Stop”. The actual counter since the last start will remain. When starting new, the gas-counter will be activated and the counter will start from 0. Every minute the counter will be saved to the file “Gas_uhr.ini”. With the button “ENDE” the program closes. 3.5 Program ”Bioreaktor” The steering program “Bioreaktor” starts like seen in Figure 22. In the sheet “Einstellungen” (setup) the parameters can be set. It´s divided into 3 blocks: - Agitator parameters - Feeding of the fermenter - Temperature control 24 Figure 22: Program "Bioreaktor" – sheet ”Settings”. The picture shows translated user interface. Picture is adapted, original language is German. In the picture you can also see the position of the switch (HAND/AUTO) from the electric cabinet and the current time (see Figure 23). Figure 23: Switch on the main electric cabinet to choose between manual- and auto- mode. Below the plants main switch. The parameters set by the user can always be changed, but will only be refreshed with test switched off and by clicking “Einstellungen übernehmen” (Apply settings). 25 Control elements in this figure: Stirrers Activate clicking the button below column heading ”Activate” (green active; red – inactive) Runtime activation time of the agitator in minutes when activated Rest time resting time of the agitator in minutes when activated Turning direction turning direction when agitator starts Alternating changing of the turning direction of the agitator when activated; agitator will start with chosen turning direction Runtime / directions when agitator and alternating is activated the agitator will turn in the chosen direction this runtime in minutes Pause while changing when agitator and alternating is activated the agitator will stop for this time during changing the turning direction Feeding Temperature control Setpoint vessel Tolerance Setpoint heater Times for rotary valve (not mounted) and screw conveyor have to be entered separately. The screw conveyor can operate alone but will also be activated when the rotary valve is operating. if the temperature in the vessel is deviated lower than the setpoint the heaters will be activated exceeding the setpoint + tolerance the heaters will be deactivated the activation and deactivation temperatures of the three activated heaters are only in the range setpoint ± 3 degrees This means that overheating of the single heating circuits and/or the fermenter walls will be avoided by the setpoint of the heaters. Even in case of the signal ”Vessel temperature too low” the heating circuit will remain deactivated until the heat transfer to the medium is finished. After applying the setting you can proceed to the sheet ”Schema” (scheme),see Figure 24. 26 Figure 24: Program "Bioreaktor" - Sheet "Scheme". User interface is translated to English. Picture is adapted, original language is German. The schematic display of the bioreactor shows all measured values and controlled elements. Inactive elements will be displayed ”red”, active elements will be displayed ”green”. Manual mode: This button cannot be used and lights up ”activ” when the switch on the control cabinet is turned to ”manual mode” (see Figure 23). This setting marks an active test that will not save any results and can be finished at any time. This test will be started by clicking the switch ”Versuch” in the top right corner which will also finish the test. This allows the operator to test these parameters and change them after a stop. Automatic mode: To start an automatic test the following steps need to be completed: 1. Hit ”apply settings” 2. Turn the switch on the control cabinet to ”AUTO” (see Figure 23) 3. Start the program ”Gasuhr” setting the counter to zero 4. Start the test by clicking the button ”Versuch” For entering text to the log-file a window pops up. The data you enter here is just for your information. Entering a value in the field below allows to change the interval in which the data will be saved. The range is between 0.1h (6 min) and 24h. When you hit enter, a new screen appears. 27 You can see the changes made in the window before. When you want to apply to these settings the red button has to be turned to green by clicking it, then hit ”OK”. This will start the test. While operating a test in automatic mode you can proceed to the sheet ”Graphik”. Up to 500 recorded values of the measured variables can be displayed here. With the button below the graphic you can choose from the different parameters. It may take up to 20 seconds for the new parameter to appear. To end a test go to the sheet ”Schema” and click on the button ”Versuch”. While the test will end in manual mode, a new screen will pop up in automatic mode asking you again if you want to stop the test. While performing a test, closing the program is not possible. (Umwelt- und Ingenieurtechnik GmbH Dresden, 2005) 28 4. Work instructions for Pilot B This chapter will explain the necessary steps to take the pilot plant into action. Furthermore it will deal with the daily routine works while operating the plant. 4.1 Plant installation on testing location The following chapter will give a short overview on issues regarding the plant installation on the testing site. 4.1.1 General issues The location for the plant should be levelled and able to take the load of the container, which is approximately 6 Mg. The free area for the container should be at least 8 m x 4 m (measures of the container are 6058 x 2438 x 2591 mm, LxWxH). Very important to keep in mind is, that the container will be delivered by truck and a crane is needed to unload and position it on site. Therefor enough space must be provided. It is possible to level the container by placing adequate spacers (e.g. wooden boards or flagstones) under its corners (see Figure 25 below). Figure 25: Leveling of the container with wooden boards (left). The rubber matt provides a large supporting surface. Leveling with flagstones (right). 29 4.1.2 Electrical connection The plant needs an electrical connection 380V, 50 Hz, 3/5 pin according to VDE Norm in fire resistant construction. The cables have to be connected with the electric cabinet outside the container. The Pilot plant comes with a 30 m cable which has to be connected with the electric grid on the testing site. After connection to the grid has been applied, switch on all the fuses and push the button on the left side of the fuses in the outer electric cabinet (see Figure 26). Figure 26: Main electrical connection in outer electric cabinet (left). Main fuse and electric meter (right). The container needs to be grounded with the provided metal stick (see Figure 27). The cable that is attached to the stick can be screwed to both corners of the container (on the side with the electric cabinet). Figure 27: Metal stick for grounding of the container. To complete the electrical installation, the computer and the gas warning system have to be connected to the emergency power supply kits. The computer has to be connected with the main electric cabinet, using the two 37-pin cables (for detailed information check chapter 2.12 ). 30 4.2 Start-up The fastest way to start a new fermentation process would be, to use material from a good working full scale plant. If such material is not available, cow manure suits best as inoculum. 4.2.1 Initial filling of the fermenter To start the process approximately 550 liters of material is needed. It may be filled in the fermenter by taking one of the top covers of the fermenter. Another possibility would be to use the screw conveyor used for feeding the fermenter (see Figure 28). Figure 28: Initial filling of the fermenter. Can be done manual (left) or with technical support (right) in this case a manure pump. Make sure to close the covers of the fermenter correctly. It may be helpful to use some grease (e.g. petroleum jelly) to get the fermenter gastight. 31 4.2.2 Starting a new test When the fermenter has been filled with new material, the system should then be heated up to the desired temperature. This may take some time, depending on different factors like outside temperature, desired fermenter temperature, stirred/unstirred system, and so on. To check if the fermenter is gas tight, attach an improvised pressure meter (U-tube manometer, see Figure 29) to the main gas valve, closing all other valves. While heating up the system, the pressure should rise. If this does not happen use the provided gas leakage detector to check for leakages. Figure 29: Improvised U-tube manometer attached to the fermenters main valve The stirrers should be working from the beginning of a new test, to allow the fermenter content to be heated evenly. The oxygen which is still inside the system will disappear during the start-up phase by biological conversion. Feeding can be started gently when the methane concentration is at a concentration of >50%. This may take about 7 days, depending on the inoculum. The daily produced gas amount should be >150 l/d. The feeding rate should be risen gently, always checking the fermenter condition via VOA/TAC measurements. If this ratio rises, the feeding amount should be lowered. 32 4.3 Daily work This chapter will give a guideline on the daily work to be done on the pilot plant. Check atmospheric pressure and temperature (Figure 30) note it Figure 30: Small weather station to check temperature and atmospheric pressure. - Take out the same amount of fermentation residues you want to add note the amount Feed substrate into receiver tank (Figure 31) note the amount. It is recommended to take out some residues from the digester and mix it with the fresh substrate. One extra bucket for flushing can be useful too. By flushing with this “extra bucket” you can make sure that all the fresh substrate left the screw conveyor. Figure 31: Manual feeding via the receiver tank. 33 - Log the meter reading of electric meter and gas meter (Figure 32) note it Figure 32: Electric meter in the electric cabinet outside of the fermenter (left) and gas counter inside the container (right). - Check the filling level of the fermenter (Figure 33), if necessary take out some substrate. If you did note the amount Figure 33: The fermenters level indication windows 34 - Check the vessel for the condensed water from the gas-analyzer (Figure 34). Weight the amount of water and note it. If you put the water back into the process you do not have to check the amount. Figure 34: The condensate bottle after the gas quality measurement An additional condenser is connected to the hose which leads to the gas measurement system. Check this one regularly. If the water level is too high, stop the pump from the measuring system, close the valves, take out the condenser and empty it ( Figure 35). Figure 35: Vessel for condensed water from the gas measurement system. 35 - Check the general condition of the plant (stirring devices, gas-analyzer and gas-meter working properly? Maybe a calibration is needed) Check the water level and the levelling of the gas clock once in a month. If necessary add some water (please check the gas clock manual for detailed instructions). Note all of your recorded data to the provided journal pages (see Figure 36). If you experience any difficulties, change parameters (steering, heating, feeding, etc.) or make some interesting experiences, please note them in the journal. Let future plant operators benefit from your experiences. Figure 36: Example of data recording in the provided journal. 36 4.4 On-site laboratory analysis This chapter will explain the on-site laboratory analysis. Figure 37: Laboratory equipment for different analysis. (1) SCHOTT pH-meter, (2) titrator, (3) laboratory scale. 4.4.1 pH-Measurement Measurement of the pH is performed by the system. You can check the pH-sensor of the fermenter by comparing it with pH measured with the “SCHOTT pH-Meter” (Figure 37, position 1) from the mini-lab. If you experience major differences, please calibrate the pHsensors with the provided buffer solutions. The detailed manual of the pH-meter is provided with the pilot plant. Figure 38: Buffer solutions pH 4.01 and pH 7.00 for calibration of the pH-electrodes. 37 4.4.2 Estimation of buffer capacity (VOA/TAC) The buffer capacity is determined by a titration test which was adapted by the Federal agricultural research center of Germany (former FAL now Johann Heinrich von Thünen Institute (vTI)).The quotient (abbreviated by VOA/TAC) of the acid concentration and buffer capacity of digestion residues will be defined. VOA stands for volatile organic acids with the unit mg/L acetic acid equivalent. TAC stands for total inorganic carbonate (basic buffer capacity) with the unit mg CaCO3/l. The VOA/TAC value is a long time guide value for the evaluation of fermentation processes. With this information it is possible to predict and avoid malfunctions or an overturning of the microbiology. (T. Ahrens, 2011) The determination can be done with the provided titrator Metrohm 665 Dosimat (Figure 37, position 2) For samples weight measurements the laboratory is provided with small scale (Figure 37, position 3). First of all a representative digestion sample has to be taken (Figure 39). It is recommended to use the DN 50 ball valve on the operator side of the fermenter (Figure 8). To guarantee a representative sample, the valve should be flushed first. Therefor fill half of a bucket with the fermentation residues and put it back into the system via the screw conveyor. Afterwards a sample can be taken. Figure 39: Samples taken from the fermenter. In the front a sieve to remove solid particles (left). Solid particles removed from the sample with the provided sieve (right). Solid particles are removed from the samples using the provided sieve (Figure 39). 38 From the sample 5 g are measured in a small beaker with the scale. Then distilled water is added to an overall mass of 20 g. (Figure 40). Figure 40: Sample preparation for VOA/TAC analysis. After adding a magnetic stirring core, the beaker is placed on the magnetic stirring device. The pH-sensor is then lower into the sample and the stirrer is started (Figure 41). Figure 41: VOA/TAC analysis with titrator. 39 Pushing the red button on the titrator remote control will add acid. The pH can be checked with the pH-meter. Titration with 0.1 N H2SO4 till pH 5 note value of used acid Refill the titrator. Titration with 0.1 N H2SO4 till pH 4.4 note value of used acid Calculation the VOA/TAC with an empiric Formula Calculation Formula (empiric) vTI guidelines: Amount of substrate: 5 g Amount of water: 15 g Acetic acid: 0.1N (=0.05mol/L) TAC= H2SO4- usage till pH 5 in mL x 250 VOA= (H2SO4-usage till pH 4.4 in mL x 1.66-0.15) x 500 Important: if another amount of substrate is used, the concentration of the acid has to be calculated new 𝑉𝑂𝐴 𝐕𝐎𝐀 (((amount H2SO4 from pH 5.0 till pH 4.4 in ml x 1.66) − 0.15)x500) = 𝑇𝐴𝐶 𝐓𝐀𝐂 (amount H2SO4 from pH X. X till pH 5.0 in ml x 250) The VOA/TAC-ratio from 0.3 to 0.4 is common, however every individual biogas plant has an own optimal value. This optimal value can only be determined through long term monitoring and continuous measuring, because the VOA/TAC value may vary depending of substrate composition. At renewable energy biogas plants for example, the VOA/TAC-value is pending between 0.4 and 0.6, and the plant is still running well. Only with trial and error of different possibilities the optimal plant performance can be determined. The starting VOA/TAC value can vary a lot, but it is important to mention that every increase of VOA/TAC-value causes a process inhibition. That means maximum biogas production without worrying a process crash. A process crash is very cost-intensive: a couple of weeks no gas production and a huge effort to regenerate the process or cleaning out the digester. The efficiency of a year can be risked with a process crash. Table 1 gives an overview on the meaning of VOA/TAC values. Table 1: VOA/TAC value meaning VOA/TAC-Value >0.6 0.5-0.6 0.4-0.5 0.3-0.4 0.2-0.3 <0.2 (T. Ahrens, 2011) background plant heavily overfed plant overfed plant heavily loaded plant well-utilized plant hungry plant very hungry procedure stop feeding reduce feeding increase measuring hold feeding increase feeding slowly increase feeding quick 40 4.4.3 Determination of Ammonia Nitrogen (N) is an important mineral for methane producing bacteria. Microorganisms degrade proteins from substrates over amino acids into ammonium (NH4-N). Amino acids form the nitrogen source for methane producing bacteria and all other biogas bacteria in biogas processes. But highly increasing ammonium concentrations (NH4-N) come across as inhibitors. If the pH-value rises over 8, the ammonium is converted to toxic ammonia (NH 3). Substrates like excrements of poultry contain a high amount of nitrogen and increase nitrogen concentrations in fermenters. Before feeding critical substrates, it is advisable to determine the nitrogen concentration. (T. Ahrens, 2011) To determine the ammonia concentration the same liquid phase is used as for VOA/TACanalyses (Figure 39). It is advisable to use the same, because a lot of time can be saved. The liquid phase is diluted for Dr. Lange cuvette tests, because the cuvette tests Dr. Lange LCK 302 only has a small measuring range (Figure 42). Figure 42: Dr. Lange LCK 302 cuvettes for ammonia analysis; cuvette with green liquid is already used, the one with the clear liquid is a new one. The used dilutions are generally 1:20 or 1:10, but the dilution degree depends on the amount of ammonia in the sample. If necessary the dilution degree has to be adapted. The diluted sample is treated with some special reagents and after a time of 15 minutes the amount of ammonium is measured with a Dr. Lange LP2W spectral photometer equipped with a 695 nm filter. 41 After the dilution the ammonia test should be done step by step like shown in Figure 43. Figure 43: Step by step guide for the Dr. Lange LCK 302 ammonia cuvette test. - STEP 1: take a new cuvette from the fridge, clean it with a tissue to make sure that it has no dirt or condensate on it and is fully transparent. Switch on the LP2W spectral photometer (see Figure 44), place the cleaned cuvette in the sample chamber and press the button “TEST”. Then push the button “NULL”. Figure 44: Dr Lange LP2W spectral photometer for on-site NH4-N determination. - Take the same cuvette and tear off the metal film like it shown in (Figure 43, Step 1) 42 - STEP 2: open the cuvette, then take the pipette and add disposable tip on it (Figure 45, positions 4 and 5). Figure 45: Precise dosing pipette with mounted disposable tip. (1) two-step button; (2) tip removal button; (3) dosing adjustment regulator; (4) dosing indicator; (5) disposable tip. Use the dosing regulator to adjust the necessary amount of liquid (Figure 46). Figure 46: Pipettes adjustment example, with adjustment regulator (black) and adjustment value screen. The pipette has a two step button, when taking a sample it should be pushed only half way (Figure 47, position A), to spill the sample from the pipette to the cuvette it should be pushed to position B (Figure 47) 43 Figure 47:Two step button using example. Pos. A shows first rest; pos. B shows second rest. - STEP 3: Fill 0,2 ml of dilluted sample in to the prepared cuvette. STEP 4: Close the cuvette with its cap – make sure that you close it with the reagent showing to the inside! STEP 5: Shake the cuvette until the reagent powder is be fully mixed with the liquid. STEP 6: Wait for 15 min. After 15 min place the cuvette in the LP2W spectral photometer sample chamber and press the button “ERGEBNISS”. Be sure that the cuvette is clean and fully transparent. Note the value which will be shown on display of the spectral photometer. 44 5. General troubleshooting This chapter will give some advice/hints on possible malfunctions that could occur during the operation of the pilot plant. For special problems with single components please check the according manual provided with the pilot plant. 5.1 Electricity supply problems For a stable operation of the digester it is necessary to have a constant electric supply. Therefore two emergency supply kits are installed in the pilot plant. An emergency generator would be an option too. There is no big problem if the electricity is shut down for a short period of time (1-2 hours).The emergency supply kits are able to compensate this period of time (depending on the charging level of the internal battery. This compensation just effects the main computer and the gas measurement system! Without electric supply there is no stirring and heating, which has a negative impact on fermentation process speed, and gas production. It may also cause the fermenter content to rise like a yeast dough. This can lead to an overflow of the fermenter content for example out of the overflow box at the end of the fermenter (see Figure 48). Unfortunately there is no possibility to stir the fermenter without electricity. Figure 48: Spilt fermenter content after a longer electrical shutdown of the fermenter. 45 Trouble shooting: If the electric supply breaks down, this is most likely because: 1) External causes – problems in electric network (shut down for maintenance works, natural phenomena like lightning strikes) 2) Internal causes - main fuse failure How to solve: - Check the electrical connection of the container, including all plugs in the supply line. - Check the containers main fuse in the outer electrical cabinet. 5.2 Leakages of the fermenter First of all make sure that the container is good ventilated! Take care of your own safety! Trouble shooting: Leakages can be detected on two ways: 1) Alarm activated by the gas warning system 2) Detection of oxygen in the produced gas How to solve: Leakages could appear due to not correctly closed fermenter covers. After starting a new test, make sure all covers are sealed by checking them with the provided leakage detector. For this the heating system should be working. Close all fermenter openings and valves. Disable the gas measurement system. Use the improvised u-tube manometer (see Figure 49, connected to the main valve) to make sure overpressure is building up in the fermenter. Figure 49: Improvised u-tube manometer connected to the main valve. Pressure balanced (left). Overpressure (right). If no overpressure is forming, use the leakage detector to find the leakage. 46 5.3 Other problems This chapter will give some general tips for plant operation. 5.3.1 Common sense The operator should use his/her common sense while doing the daily routine in the plant. During operation of the plant a blinkered attitude to one´s work could arise. Try to avoid this and stick to some basic rules. For example: - When entering the container smell for unusual odors. Maybe the gas warning system has a malfunction. If there is an unusual smell make sure the container is properly ventilated. Take care of your own safety! Check the gas concentrations on the gas measurement system while entering. Listen to uncommon sounds. - Keep the container clean. Check the floor for water. Maybe the gas clock has a leakage or the activated carbon filters need to have some condensate removed. - Check the sounds of the motors to detect possible malfunctions. - Check if the stirrers are working correctly. - Check the filling level of the fermenter. (E.g.: it could be good to lower the filling level if a top layer was formed. Lowering the level can make the stirrers destroy the top layer, making it easier for the gas to leave the system). - Touch the walls of the fermenter to check if the heaters are really working. - Check the valves you regularly use before you leave the container. Maybe you left them in a wrong position. - Check if the gas bag fill evenly. Maybe one has a leakage. - Empty the gas bags with the pump on a daily basis. You will make more experiences while operating the plant. Share your know-how and make some notes in the provided journal so future operators can benefit from your experiences! 5.3.2 Process optimization In the following some tips will be given for good fermentation results: - Reduction of H2S: Two reduce the amount of H2S in the biogas, it can be useful to pump a small amount of air into the system. This will lower the H2S concentration due to microbial conversion. For this, just open the valve leading to the gas measurement system for a short time (maybe 10 – 20 seconds) on a daily basis. Check how the H2S concentration develops. - Low gas production rate: Check the VOA/TAC ratio more often (see chapter 4.4.2 ). Maybe the plant is under-/over fed. If this is the case adapt the feeding amount. 47 6. Troubleshooting Lithuania This chapter will give an overview on problems that occurred during the Lithuanian operating period. The problem will shortly been described, including the symptoms and the way they have been solved afterwards. If you experience any problems while operating the plant, please make some notes in the provided journal in the same structure, so future operators can benefit from your experiences. - Problem: gas counter running counter clockwise, air suction into the fermenter o Symptoms: gas counter running counter clockwise, gas measurement device showing oxygen inside the fermenter, mould inside the fermenter (color of substrate is darker than usual, smell for mould) o Solution: checking for leakages (see chapter 5.2 ), check all moving parts on the gas clock, or in the gas line from fermenter to gas clock. To reduce mould it is recommended to rise stirrers working period and make them stir more often. This will mix the top layer with the rest of the material better. - Problem: high VOA/TAC values, low gas production rate o Solution: reduce feeding, run fermenter in batch mode o Reason: system overfed, high production rate of organic acids decreasing pH inhibition of methane producing bacteria - Problem: gas alarm o Reason: gas leakage o Solution: check for gas leakages and seal them up o Other reason: technical failure o Symptoms: alarm going of very often even if no gas could be measured with external device. We found out by chance that the alarm went off when slamming the door. o Solution: Possible failure caused by transport of the plant. Closed circuit somewhere in the H2S-sensor (see Figure 50). Figure 50: H2S-sensor from the gas warning system. Sensor had a closed circuit, causing false alarms. 48 - Problem: unusual sounds o Reason: Gears broken, gas measuring devices pump (rubber hose) worn (see Figure 51) o Solution: Operator should get a feeling for the plant Figure 51: Rubber hose of the pump from the gas measurement system. Replaced due to wear marks/sounds. - Problem: titrator giving error message (“no ex. unit”) o Reason: the exchange unit (on top of main unit, containing the bottle etc.) can be accidently moved when removing the pH-sensor. o Solution: push the exchange unit back in position (see Figure 52, red arrow). (also see the troubleshooting guide in the titrator manual) Figure 52: Titrator with marked exchange unit. The upper part can accidently be moved which results in an error message. 49 - Problem: suddenly very high production rate, a lot of oxygen in the system o Reason: accidently forgotten valve gas measuring device was pumping air inside the fermenter o Solution: double check all valves and devices when finishing work Problem: electrics shut off o Reason: misbalance in the grid, overvoltage due to lightning striking the wires, other electrical problems in the power supply o Solution: installation of two electric compensators to keep the computer and gas measuring system working for at least one hour Problem: valves clogging o Reason: condensate blocking the valves (see Figure 53) o Solution: change of the gas outlet from a small diameter to a bigger diameter. o Other reason: substrate or fermenter material could cause a blocking too. o Solution: Cleaning the gas outlet with a piece of wire. Figure 53: Gas outlet for the gasmeasuring system. Due to clogged openings by condensate they have been exchanged to outlets with a bigger diameter as shown in the picture. 50 Problem: Oxygen in the fermenter o Reason: leakage at the thermometer on the gas clock o Solution: sealed the leakage with glue and sticky tape (see Figure 54) Figure 54: Sealed leakage at the thermometer of the gas clock. Sealed with glue and sticky tape. Problem: bad smell inside of the container o Reason: emission from the supply hopper o Solution: covered the supply hopper opening with a sandbag (see Figure 55) Figure 55: Covered supply hopper to avoid emission of bad odors. 51 7. References T. Ahrens, A. B. (2011). Report on substrate pretreatment, qualify and biogas potential of different waste substrates and suitable substrate mixtures for each individual region. REMOWE output report O3.2.3.1. Umwelt- und Ingenieurtechnik GmbH Dresden. (23. November 2005). Versuchsreaktor zur Trockenvergärung - Gerätebeschreibung und Bedienhandbuch. Dresden, Deutschland. 52