1
Audiometer Calibration System
User Manual
Larson Davis
1681 West 820 North, Provo, UT 84601-1341
Phone: (801) 375-0177, FAX: (801) 375-0182
www.larsondavis.com
IAUDIT.01 Rev. C
AUDit & AUDIOMETER CALIBRATION USER MANUAL
Copyright
Copyright © 1999, Larson Davis Incorporated. This manual and the software described in it are copyrighted with all rights reserved. The software may be used on a single computer and may not be copied
in whole or in part for commercial or private use without prior written consent of the copyright owner.
Contact Larson Davis for information on licensing for multiple sites.
Some of the names of organizations, people, products and specifications mentioned in this manual as
program entries or examples are fictitious and are not meant to represent any real organizations, people, products or specifications.
Trademarks
PC is a trademark and IBM is a registered trademark of International Business Machines Corporation.
Intel is a registered trademark of Intel Corporation. Windows 95, Windows 98, and Windows NT are
registered trademarks of Microsoft Corporation.
Other product and company names may be mentioned in this manual which are trademarks of their
respective owners.
Disclaimer
Even though Larson Davis has tested the software and reviewed its documentation, Larson Davis
makes no warranty or representation, either expressed or implied, with respect to this software and
documentation, their quality, performance, merchantability, or fitness for a particular purpose. This
documentation is subject to change without notice, and should not be construed as a commitment or
representation by Larson Davis.
Support Policy
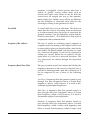
Larson Davis will provide periodic updates to the software, which may include bug fixes and enhancements for a period of two years from the purchase date.
Please retain the model number, serial number, and purchase date for each component of your audiometer calibration system. You may be asked to provide this information when contacting Larson Davis
for service or technical support.
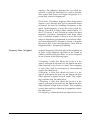
Acknowledgments
The three dimensional model of the human middle ear on the splash screen was created in the laboratory of R. Funnell (Department of Biomedical Engineering, McGill University), based on magnetic
resonance microscopy data obtained from M. M. and O.W. Henson (Department of Cell Biology and
Anatomy, University of North Carolina). MR microscopy was carried out at the Center for In Vivo
Microscopy (an NCRR National Resource; G.A. Johnson, Director) at Duke University Medical Center. Used by permission.
ii
AUDit & AUDIOMETER CALIBRATION USER MANUAL
Recycling
Larson Davis, Inc. is an environmentally friendly organization and encourages our customers to be
environmentally conscious. When this product reaches its end of life, please recycle the product
through a local recycling center or return the product to:
Larson Davis, Inc.
Attn: Recycling Coordinator
1681 West 820 North
Provo, Utah, USA 84601
where it will be accepted for disposal
iii
AUDit & AUDIOMETER CALIBRATION USER MANUAL
iv
AUDit & AUDIOMETER CALIBRATION USER MANUAL
Table of Contents
Chapter 1
Welcome to AUDit™ Audiometer Intelligent Testing
1-1
About This Manual .................................................................................................1-2
About This Chapter.................................................................................................1-3
Formatting Conventions .........................................................................................1-4
Unpacking and Inspection ......................................................................................1-4
Warranty Registration and Client Survey Cards................................................1-4
Getting Started with AUDit™ Software.................................................................1-7
Getting Help .......................................................................................................1-8
Installing the Software .......................................................................................1-8
Uninstalling the Software...................................................................................1-9
Starting the software ........................................................................................1-10
Software Overview ..........................................................................................1-11
Chapter 2
Initial Configuration
2-1
Creating or Selecting a Database ............................................................................2-1
Configuring the System Printer ..............................................................................2-3
Entering Instrumentation ........................................................................................2-4
Entering Sound Level Meter Information...............................................................2-5
Entering Calibrator Information .............................................................................2-7
Entering Microphone Information ..........................................................................2-8
Entering Artificial Mastoid Information...............................................................2-11
Response ..........................................................................................................2-12
Entering Preamplifier Information........................................................................2-14
Entering Preferences .............................................................................................2-15
Chapter 3
Audiometer Test Setup
3-1
Audiometer Test Screen..........................................................................................3-1
Test Location Screen ..............................................................................................3-3
Select Test Equipment Screen ................................................................................3-4
i
AUDit & AUDIOMETER CALIBRATION USER MANUAL
SLM Tab ............................................................................................................3-4
Calibrator Tab ....................................................................................................3-5
Mastoid Tab .......................................................................................................3-6
Preamp Tab ........................................................................................................3-8
Select Microphones Screen.....................................................................................3-9
IEC 318 Mic Tab..............................................................................................3-10
NBS 9A Mic Tab .............................................................................................3-10
IEC 711 Mic Tab..............................................................................................3-10
HA-1 Mic Tab ..................................................................................................3-10
HA-2 Mic Tab ..................................................................................................3-11
Open Air Mic Tab ............................................................................................3-11
Audiometer Description Screen............................................................................3-12
Audiometers Tab..............................................................................................3-12
Low Frequencies Tab.......................................................................................3-13
High Frequencies Tab ......................................................................................3-13
Select Earphones Screen ..................................................................................3-14
Bone Vibrator...................................................................................................3-17
Speakers ................................................................................................................3-18
Chapter 4
Booth Test or Ambient Noise Level Test
4-1
Assembling the system ...........................................................................................4-2
Equipment for Booth Test.......................................................................................4-2
Assembling the system ...........................................................................................4-3
Connecting to the SLM...........................................................................................4-4
System SPL Calibration..........................................................................................4-5
Performing the Booth Test......................................................................................4-7
Saving the Booth Test...........................................................................................4-11
Suspecting Instrument Noise? ..............................................................................4-12
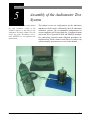
Chapter 5
Assembly of the Audiometer Test System
5-1
Audiometer Transducer Test Configurations .........................................................5-2
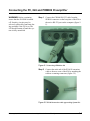
Connecting the PC, 824 and PRM902 Preamplifier ...............................................5-3
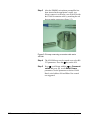
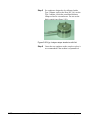
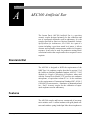
AEC100 NBS 9-A Coupler Initial Inspection and Assembly.................................5-5
AEC100 NBS 9-A Coupler SPL Calibration..........................................................5-8
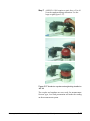
Testing Supra-Aural Earphones with the AEC100...............................................5-10
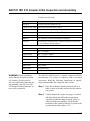
AEC101 IEC 318 Coupler Initial Inspection and Assembly ................................5-13
AEC101 IEC 318 Coupler SPL Calibration .........................................................5-16
Testing Supra-Aural Earphones with the AEC101...............................................5-18
Testing Circumaural Earphones with the AEC101...............................................5-20
ii
AUDit & AUDIOMETER CALIBRATION USER MANUAL
Environmental conditions ................................................................................5-20
Test Configurations..........................................................................................5-20
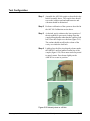
Testing Bone Vibrators with the AMC493 Artificial Mastoid .............................5-24
Environmental conditions ................................................................................5-24
Test Configuration ...........................................................................................5-25
Testing Bone Vibrators with the B&K 4930 or other Artificial Mastoid .............5-28
Environmental conditions ................................................................................5-29
Test Configuration ...........................................................................................5-29
Chapter 6
Hearing Level Test
6-1
Calibration Main Measurement Screen ..................................................................6-1
Hearing Level Test with Earphone Transducers.....................................................6-2
Hearing Level Test with Bone Vibrator .................................................................6-6
Hearing Level Test with Speakers ........................................................................6-10
Chapter 7
Frequency Test
7-1
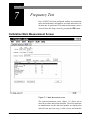
Calibration Main Measurement Screen ..................................................................7-1
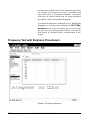
Frequency Test with Earphone Transducers...........................................................7-2
Chapter 8
Linearity Test
8-1
Linearity Measurement Screen ...............................................................................8-1
Chapter 9
Distortion Test
9-1
Harmonic Distortion Measurement Screen.............................................................9-2
Chapter 10
Pulse Test
10-1
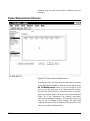
Pulse Measurement Screen ...................................................................................10-2
Chapter 11
Cross Talk Test
11-1
Crosstalk Measurement Screen.............................................................................11-2
Chapter 12
Frequency Modulation Test
12-1
Frequency Modulation Measurement Screen .......................................................12-1
Chapter 13
Narrow Band Level Test
13-1
Narrow Band Level Measurement Screen ............................................................13-1
Narrow Band Level Test with Earphone Transducers..........................................13-1
Narrow Band Level Test with Speakers ...............................................................13-5
Chapter 14
Broad Band Noise Masking Test
14-1
Broad Band Masking Measurement Screen..........................................................14-1
iii
AUDit & AUDIOMETER CALIBRATION USER MANUAL
Chapter 15
Speech Test
15-1
Speech Measurement Screen ................................................................................15-1
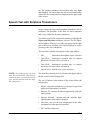
Speech Test with Earphone Transducers ..............................................................15-3
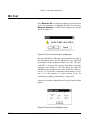
Mic Test ................................................................................................................15-4
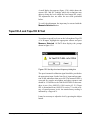
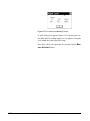
Tape/CD A and Tape/CD B Test ..........................................................................15-5
Speech Noise Test.................................................................................................15-7
Speech Test with Bone Vibrator ...........................................................................15-8
Speech Test with Speakers .................................................................................15-10
Chapter 16
Audiometer Test Notes
16-1
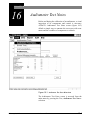
Audiometer Test Notes Screen .............................................................................16-2
Visual Check Tab.............................................................................................16-2
Comments Tab .................................................................................................16-3
Chapter 17
Reports and Data Base Functions
17-1
Printing a Report ...................................................................................................17-1
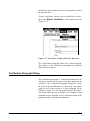
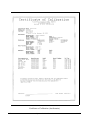
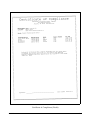
Printing a Certificate .............................................................................................17-6
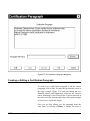
Certification Paragraph Dialog ........................................................................17-7
Creating or Editing a Certification Paragraph..................................................17-8
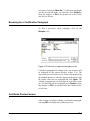
Browsing for a Certification Paragraph ...........................................................17-9
Certificate Preview Screen...............................................................................17-9
Exporting Data ....................................................................................................17-11
Stored Measurements Database Functions .........................................................17-13
Audiometer Measurements ............................................................................17-13
Booth Test Data .............................................................................................17-15
Chapter 18
824-AUD Firmware Overview
18-1
Selecting the 824-AUD Operation Mode .............................................................18-2
SLM+RTA Mode..................................................................................................18-3
SLM+RTA Live screen....................................................................................18-3
Any Level-a Screen..........................................................................................18-4
FFT Mode .............................................................................................................18-5
FFT Screen .......................................................................................................18-5
Pulse/FM Mode.....................................................................................................18-7
Pulse/FM-a Screen ...........................................................................................18-7
Pulse/FM-b Screen ...........................................................................................18-8
Appendix A AEC100 Artificial Ear .................................................................. A-1
Standards Met ........................................................................................................A-1
iv
AUDit & AUDIOMETER CALIBRATION USER MANUAL
Features ..................................................................................................................A-1
Components ...........................................................................................................A-2
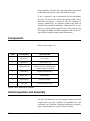
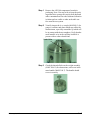
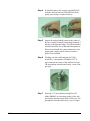
Initial Inspection and Assembly ............................................................................A-2
Calibration .............................................................................................................A-5
Measurements ........................................................................................................A-7
Audiometer Calibration.....................................................................................A-7
Earphone Frequency Response Production Testing........................................A-10
Specifications.......................................................................................................A-10
Appendix B 824 Technical Specifications .........................................................B-1
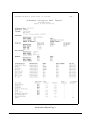
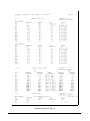
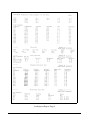
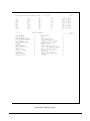
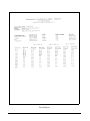
Appendix C Sample Reports ............................................................................. C-1
Examples of Reports from AUDit™ ..................................................................... C-1
Appendix D Glossary ......................................................................................... D-1
v
AUDit & AUDIOMETER CALIBRATION USER MANUAL
vi
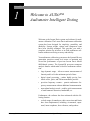
C H A PT E R
1
Welcome to AUDit™
Audiometer Intelligent Testing
Welcome to the Larson Davis system and software for audiometer calibration. The Larson Davis audiometer calibration
system has been designed for simplicity, portability, and
durability. System weight, volume and component count
have been carefully managed. This provides you with a
complete solution for in-house or in-field audiometer calibration without sacrificing accuracy and stability.
Your audiometer calibration system uses the System824 next
generation precision sound level meter to maintain and
exceed the performance of previous Larson Davis Model
800B-based systems. The System824 possesses numerous
analysis features which make it ideal for audiometer calibration:
•
large dynamic range - allows accurate measurement of
linearity and level in the minimum period of time
•
digital signal processing - makes highly precise fractional octave, pulse, and FM measurements possible
•
precision frequency counter - permits audiometer frequency measurement without additional instrumentation
•
narrowband analysis mode - enables quick measurement
of total harmonic distortion, bandwidth, etc.
Furthermore, the software has been enhanced with the following features:
•
February 7, 2000
a whole range of transducers, their corrections and limits
have been implemented, including: circumaural, supraaural, insert earphones, bone vibrators, and speakers.
Welcome to AUDit™ Audiometer Intelligent Testing
1-1
•
a measurement database search allows quick reference to
previously calibrated audiometers to speed up test configuration or compare the current test with historical data
•
extended frequencies can be tested using appropriate
couplers (such as the new Larson Davis AEC101 IEC
318 coupler and plates)
AUDit™ software is compatible with Windows™ 95 and
Windows™ 98 type operating systems running on PC compatible computers.
We invite you to read this brief manual to get the most out of
your audiometric calibration system. Additional information
on the System 824 precision sound level meter and other
system components may be found in their respective documentation.
About This Manual
This manual will cover the following topics:
• Chapter 1 - Introduction: system overview, components,
and software installation.
1-2
•
Chapter 2 - Initial System Configuration: entering test
instrumentation and other preferences.
•
Chapter 3 - Audiometer Test Setup: entering information
regarding audiometer and transducers to be tested.
•
Chapter 4 - Booth Test/Ambient Noise Level Test: audiometric booth verification.
•
Chapter 5 - Assembly of the audiometric calibration system.
•
Chapter 6 - Hearing Level Test: transducer output calibration in dBHL.
•
Chapter 7 - Frequency Test: output frequency calibration.
•
Chapter 8 - Linearity Test output attenuator linerarity
calibration.
•
Chapter 9 - Distortion Test: Total harmonic distortion
measurements.
AUDIOMETER CALIBRATION SYSTEM USER MANUAL
February 7, 2000
•
Chapter 10 - Pulse Tests: verification of pulsed tone
capability.
•
Chapter 11 - Cross Talk Test: measurement of leakage
between test and non test transducer.
•
Chapter 12 - Frequency Modulation Test: FM tone characteristics such as carrier frequency and modulation.
•
Chapter 13 - Narrow Band Level Test: narrow band
noise stimulus calibration.
•
Chapter 14 - Broad Band Noise Masking Test: level and
spectral flatness of broad band masking noise are verified.
•
Chapter 15 - Speech Test: calibration of speech presentation facilities.
•
Chapter 16 - Audiometer Test Notes: component and
accessory visual and functional inspection.
•
Chapter 17 - Reports and Data Base functions: hard copy
output and stored measurements.
•
Chapter 18 - 824-AUD Firmware Overview: manual
operation of audiometer calibration features of System
824.
•
Appendix A - Artificial Ear Technical Specifications
•
Appendix B - 824 Technical Specifications
•
Appendix C - Sample Reports
•
Appendix D - Glossary
About This Chapter
This introductory chapter covers the following topics:
February 7, 2000
•
Formatting Conventions: explanation of the fonts and
other formatting conventions used in this manual
•
Unpacking and Inspection: list of system components,
documentation, etc.
•
Getting Started with AUDit™ Software: installing the
AUDit™ software on your PC
Welcome to AUDit™ Audiometer Intelligent Testing
1-3
Formatting Conventions
This manual uses the following formatting conventions:
User Input: this bold sans-serif typeface indicates values or
selections entered in the software
Screen prompts: this bold italic typeface denotes menu
items, prompts, messages, and other textual information
reported by the software.
Unpacking and Inspection
If you have received this manual as part of a complete Larson Davis audiometer calibration system, this section will
acquaint you with its components. Your order has been
shipped in protective packaging. As most audiometer calibration hardware must be recertified on an annual basis,
please try to save these packing materials for future use.
Warranty Registration and Client Survey Cards
Customer satisfaction is extremely important to us all at Larson Davis. The quality of our products is backed by an
industry leading warranty and customer service capability.
Please assist us in providing you with the best service by
completing the warranty card sent with your shipment.
These may be returned to Larson Davis Customer Service,
1681 West 820 North, Provo, Utah USA 84601-1341.
Important: If your packaging was
damaged in transit, please contact
your shipping provider for instructions on filing a claim.
1-4
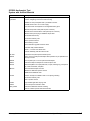
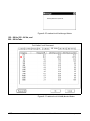
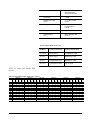
Please compare your system with the checklist below and
note any discrepancies before contacting your Larson Davis
representative:
AUDIOMETER CALIBRATION SYSTEM USER MANUAL
February 7, 2000
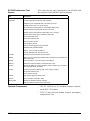
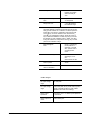
SYS009 Audiometric Test
System with Artificial Mastoid
Part
Description
2575
1 inch precision pressure response microphone, and case
System824
precision integrating sound level meter including
PRM902 1/2 inch preamplifier with 7 pin LEMO connector
PSA026 90-264 Volt to 12 V Power supply.
0277.0003 nickel metal hydride AA rechargeable battery pack
CBL002 serial printer cable (with 25 pin D connector)
CBL006 serial communications cable (with 9 pin D connector)
CBL042 stereo phone plug to dual BNC output cable
D2140.0006 client survey
D2140.0007 warranty card
I824.01 operator manual
I824.02 training manual
I824.03 firmware upgrade instruction sheet
SWW 824 utility software diskette
WS001 - 3 1/2 inch foam windscreen
firmware diskette(s) with 824 internal code
824-AUD
audiometric test (internal) 824 firmware option
ADP006
BNC to 1/2 inch preamp thread adaptor with equivalent 47 pF capacitance for
direct input to 824
ADP008
1/2 inch preamp to 1 inch microphone thread adaptor
ADP010
audiometer earphone adaptor for electrical input to 824
AEC100
artificial ear (NBS-9-A coupler) with base, coupler, retaining ring, microphone
cap, mass and handle, and pillow
AMC493
artificial mastoid coupler and case
IAMC493.01 AMC493 operator manual
MMAS493.03 additional mass
CAL250
precision microphone calibrator with 1 inch opening including
D2140.0007 warranty card
I250.1 operator manual
CCS007
large weather-tight hard carrying case
EXA010
10 foot microphone extension cable
SWW_AUDIT
audiometer calibration software including
IAUD.01 software operator manual and media
February 7, 2000
Welcome to AUDit™ Audiometer Intelligent Testing
1-5
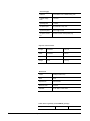
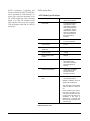
SYS008 Audiometric Test
System
This system has the same components as the SYS009 with
the exception of the AMC493 artificial mastoid.
Part
Description
2575
1 inch precision pressure response microphone, and case
System824
precision integrating sound level meter including
PRM902 1/2 inch preamplifier with 7 pin LEMO connector
PSA026 90-264 Volt to 12 V Power supply.
0277.0003 nickel metal hydride AA rechargeable battery pack
CBL002 serial printer cable (with 25 pin D connector)
CBL006 serial communications cable (with 9 pin D connector)
CBL042 stereo phone plug to dual BNC output cable
D2140.0006 client survey
D2140.0007 warranty card
I824.01 operator manual
I824.02 training manual
I824.03 firmware upgrade instruction sheet
SWW 824 utility software diskette
WS001 - 3 1/2 inch foam windscreen
firmware diskette(s) with 824 internal code
824-AUD
audiometric test (internal 824 firmware option)
ADP006
BNC to 1/2 inch preamp thread adaptor with equivalent 47 pF capacitance for
direct input to 824
ADP008
1/2 inch preamp to 1 inch microphone thread adaptor
ADP010
audiometer earphone adaptor for electrical input to 824
AEC100
artificial ear (NBS-9-A coupler) with base, coupler, retaining ring, microphone
cap, mass and handle, and pillow
CAL250
precision microphone calibrator with 1 inch opening including
D2140.0007 warranty card
I250.1 operator manual
CCS007
large weather-tight hard carrying case
EXA010
10 foot microphone extension cable
SWW_AUDIT
audiometer calibration software including
IAUD.01 software operator manual and media
Optional Components
1-6
•
AEC101 artificial ear for extended frequency measurements (IEC 318 coupler)
•
2559 1/2 inch precision random response microphone,
and protective case
AUDIOMETER CALIBRATION SYSTEM USER MANUAL
February 7, 2000
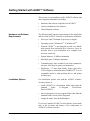
Getting Started with AUDit™ Software
This section covers installation of the AUDit™ software and
other important information including:
Hardware and Software
Requirements
Installation Options
•
Hardware and software required to run AUDit™
•
Custom installation of the software
•
Uninstalling the software
The following table lists the requirements for the installation
and use of the AUDit™ software for audiometer calibration.
•
Processor: Intel™ Pentium 90 processor or higher
•
Operating system: Windows95TM or Windows98TM
•
Network: AUDitTM is not designed to work on a distributed network from a network drive. However, it may be
operated from a local installation on a computer connected to a network.
•
System Memory: 16 MBytes minimum
•
Hard disk space: 5 MBytes minimum
•
Communications: One available 9-pin serial communication port, 9600 baud or greater recommended
•
Peripherals: 3.5 inch high density floppy disk drive,
VGA or higher resolution monitor, Windows™ 95 or 98
compatible mouse or other pointing device, and printer
for hard copy
Few installation options exist with the AUDit™ software.
You may choose to:
•
install AUDit™ in a destination folder other than the
standard
folder
(C:\Program
Files\LarsonDavis\AUDit™)
•
place its program icon in a program folder other than the
standard folder (Larson Davis Programs)
•
change the name of the default database
If you have installed AUDit™ in this fashion, please make
note of the locations and names of the components of
AUDit™ for future reference.
February 7, 2000
Welcome to AUDit™ Audiometer Intelligent Testing
1-7
Getting Help
Contact Larson Davis Technical Support at (801)375-0177 if
you encounter any problems with the installation or use of
the AUDit™ software.
Installing the Software
It is recommended that all Windows programs or tasks be
ended before installing the software. Verify that the hardware and software requirements listed above are met before
proceeding.
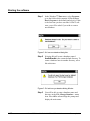
NOTE: If you have a previous ver-
Step 1
sion of AUDit™, it should be uninstalled before installing the current
software. Go to the Uninstalling the
Software section before proceeding.
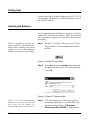
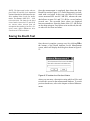
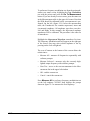
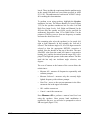
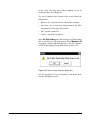
Put disk 1 of AUDit™ software in your 3.5 inch
floppy disk drive. Click on Start on the desktop
task bar.
Figure 1-1 Windows™ Start Button
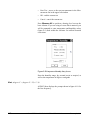
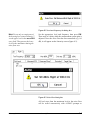
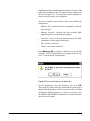
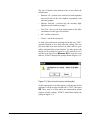
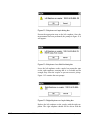
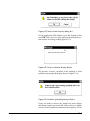
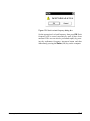
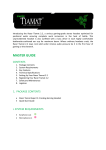
Step 2
Select Run, then enter a:setup, replacing a with
the appropriate drive letter, if necessary, and then
select OK.
Figure 1-2 Windows™ Run Dialog Box
NOTE: If an initial instrumentation
database file has been provided with
your system, copy the database file
(AUDinit.mdb) into the desired location.
1-8
Step 3
Follow the instructions of the setup program to
install the program files in a specific folder. The
default destination folder is C:\Program
Files\Larson-Davis\AUDit™. Program icons
AUDIOMETER CALIBRATION SYSTEM USER MANUAL
February 7, 2000
are added in the default program folder Larson
Davis Programs of the Programs item in the Start
menu.
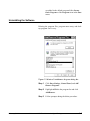
Uninstalling the Software
Deleting the program files, program menu entry, and desktop program icon is easy.
Figure 1-3 Windows™ Add/Remove Programs Dialog Box
February 7, 2000
Step 1
Click Start, Settings, Control Panel, and Add/
Remove Programs.
Step 2
Highlight AUDit in the program list and click
Add/Remove.
Step 3
Follow prompts during the delete procedure.
Welcome to AUDit™ Audiometer Intelligent Testing
1-9
Starting the software
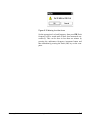
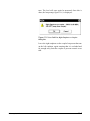
Step 1
In the Windows™ Start menu, select Programs,
go to the folder which contains AUDit (Larson
Davis Programs is the default) and select it. If this
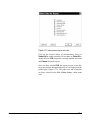
is the first time you have used the AUDit™ software, you will be asked if you wish to create a
new database.
Figure 1-4 Create new database Dialog Box
Step 2
Selecting Yes will create a database named
Auditdb.mdb in the current default directory. To
create a database later in another directory, select
No at this time.
Figure 1-5 Could not open database Dialog Window
Step 3
1-10
You will be able to enter a database name and
directory in the File, Change Database... menu
item. Press OK to acknowledge the prompt and
display the main menu.
AUDIOMETER CALIBRATION SYSTEM USER MANUAL
February 7, 2000
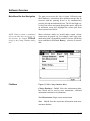
Software Overview
Main Menu Bar And Navigation
The main screen menu bar lists six items. Following standard WindowsTM convention, these pulldown menus may be
accessed with the pointing device or by simultaneously
pressing Alt and the underlined letter. The left and right cursor keys also allow navigation through the menus, while the
up and down cursor keys highlight the various pull down
menu options listed below.
NOTE: Wherever stated, a combination
of keys can allow direct access to a certain function, for example CTRL+O
brings up the Change Database dialog
box.
Menu selections which are invalid under certain circumstances may be grayed out. For example; until serial communication with a System824 sound level meter (SLM) has
been established, the Check Battery... selection is unavailable.
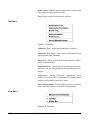
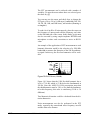
File Menu
Figure 1-6 File, Change Database Menu
Change Database... Ctrl+O: Select the measurement database which will be used to store instruments, calibrated
instruments and other test information
New Measurement: Begin a new measurement
Save Ctrl+S: Save the current test information in the measurement database
February 7, 2000
Welcome to AUDit™ Audiometer Intelligent Testing
1-11
Printer Setup: Setup the printer which will be used for hard
copy output of reports and certificates
Exit: End the current test and exit the software
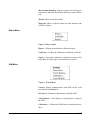
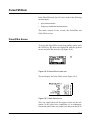
Test Menu
Figure 1-7 Test Menu
Audiometer Test...: Begin an audiometer test sequence
Audiometer Test Notes...: Enter notes on audiometer visual
inspection and other comments
Booth Test...: Begin a test of the audiometric booth or audiometric examination area
Instrumentation...: Enter model, serial and correction information for the test instrumentation used in audiometer calibration
Preferences...: Define calibration organization name,
address, etc. and set RS232 parameters for communication
with the test System824 sound level meter
Stored Measurements: Search database tests by technician
name, audiometer model, serial number, and test date
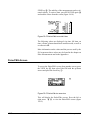
View Menu
Figure 1-8 View Menu
1-12
AUDIOMETER CALIBRATION SYSTEM USER MANUAL
February 7, 2000
Measurement Summary: Display a status screen listing performed tests and other information about the current calibration
Toolbar: Show or hide the toolbar
Status Bar: Show or hide the status bar at the bottom of the
AUDit™ window
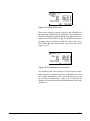
Report Menu
Figure 1-9 Report Menu
Report...: Display the audiometer calibration report
Certificate...: Display the audiometer calibration certificate
Export...: Export the audiometer or booth test report to a file
(depending on which type of measurement is current)
SLM Menu
Figure 1-10 SLM Menu
Connect: Initiate communication with SLM on the serial
port defined in Preferences
Disconnect: Terminate communication with the SLM
Check Battery...: Verify battery or external power voltage of
the SLM
Calibration...: Calibrate the SLM and its microphone transducer
February 7, 2000
Welcome to AUDit™ Audiometer Intelligent Testing
1-13
Turn Off SLM...: Power down the SLM
Help Menu
Figure 1-11 Help Menu
About AUDit™...: View revision, credits and other software
information
Icon Bar
Figure 1-12 Icon Bar
This quick reference tool bar allows direct navigation to a
set of most useful screens and functions of the AUDit™
software. Its icons are listed in the order which the functions
are normally used in an audiometer test or calibration. In
order, these icons are:
NOTE: The Icon bar may be moved to a
different part of the screen by clicking
and dragging on its border, moving it to
the desired location
1-14
•
New Measurement
•
Retrieve Test
•
Save Current Test
•
Instrumentation
•
Booth Test
•
Audiometer Test
•
Report
•
Certificate
•
About
AUDIOMETER CALIBRATION SYSTEM USER MANUAL
February 7, 2000
Status Bar
Figure 1-13 Status Bar
The status bar displays information on the current pointer
function, measurement status, and keyboard such as CAP
for capital (uppercase) letters or NUM for numeric keypad.
After this overview of the AUDit™ software, you are now
ready to configure the system before starting new measurements. The next chapter will describe how to setup the software with test database, printer, instrumentation information
and other user preferences.
February 7, 2000
Welcome to AUDit™ Audiometer Intelligent Testing
1-15
1-16
AUDIOMETER CALIBRATION SYSTEM USER MANUAL
February 7, 2000
C H A PT E R
2
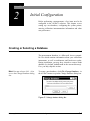
Initial Configuration
Before performing a measurement, a few items need to be
configured in the AUDit™ software. This chapter covers
setting up a test database, configuring the system printer,
entering calibration instrumentation information and other
user preferences.
Creating or Selecting a Database
The measurement database is a Microsoft Access compatible file which contains information about your calibration
instruments, as well as audiometer and booth test results.
During installation, you may have elected to create a blank
database (by default Auditdb.mdb in the current directory).
If so, you may skip this section.
Hint: You may also use Ctrl + O to
access the Change Database dialog
box
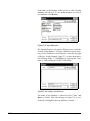
To create a new database, click File, Change Database... in
the AUDit™ menu to open the Change Database dialog box.
Figure 2-1 Change database Dialog Box
February 7, 2000
Initial Configuration
2-1
If the name of the database in the text box is valid, clicking
Connect will select it. To use another database or create a
new database, click Browse.
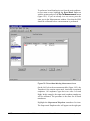
Figure 2-2 Open Dialog Box
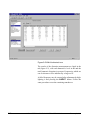
The Open dialog box will appear, allowing you to select the
location of the database. To create a database in a new directory, use the Windows Create Directory icon at the top right
of the box. In this example, figure 2-3, we have browsed to
the following folder: C:\AUDitData\ by selecting My Computer, C: and creating the AUDit™ Data folder.
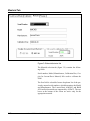
Figure 2-3 Creating a New Directory
The name of the database is entered as New_Clinic, and
Open is clicked. After the message in figure 2-4 is confirmed by clicking Yes, the new database is created.
2-2
AUDIOMETER CALIBRATION SYSTEM USER MANUAL
February 7, 2000
Figure 2-4 New Database Message
An existing database is selected in the same fashion. If your
system was supplied with a database for your calibration
equipment (initial.mdb on the last AUDit™ disk), copy this
database to the desired location, rename it, and select it. You
may skip the Entering Instrumentation section if you already
have an instrumentation database.
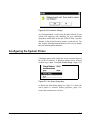
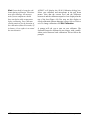
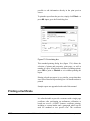
Configuring the System Printer
Calibration reports and certificates are an essential output of
the AUDit™ software. A Windows printer can be selected
for hard copy output. Click File, Printer Setup...(figure 2-5)
Figure 2-5 Test, Printer Setup Menu
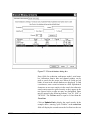
to display the Print Setup dialog box, figure 2-6, where the
active printer is selected. Printer properties, paper size,
source and orientation are set here.
February 7, 2000
Initial Configuration
2-3
Figure 2-6 Print Setup Dialog Box
Refer to your Windows or printer documentation for more
information on printer configuration.
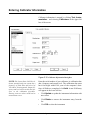
Entering Instrumentation
NOTE: When the desired instrumentation is selected for use with an audiometer measurement, a copy of the
instrumentation selected is made and
stored with the measurement. If changes
are made to a piece of instrumentation,
those changes will not be reflected in the
copy that is stored with the measurement.
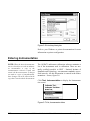
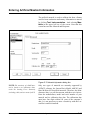
The AUDit™ audiometer calibration software maintains a
list of the instruments used in calibration. These are normally certified traceable to NIST - National Institute of
Standards and Technology - measurement standards at specified intervals. All this information is entered in the Instrumentation... Screen, figure 2-8.
Click Test, Instrumentation to display the Instrumentation screen.
Figure 2-7 File, Instrumentation Menu
2-4
AUDIOMETER CALIBRATION SYSTEM USER MANUAL
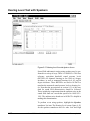
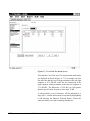
February 7, 2000
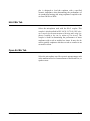
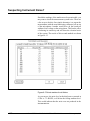
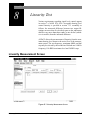
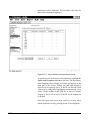
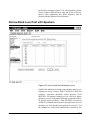
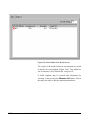
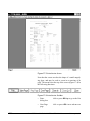
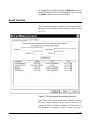
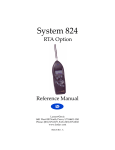
Figure 2-8 Instrumentation Screen
Note the types of instruments listed in the upper left rectangle: sound level meters, calibrators, microphones, mastoids
and preamplifiers. Currently available or defined instruments (in this case, sound level meters) are listed in the rectangle at the lower left. The large area at the right has fields
for model, serial number and other information for each type
of instrument. If your instrumentation has already been
defined for the current database, skip forward to the Setting
Preferences section.
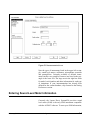
Entering Sound Level Meter Information
Currently, the Larson Davis System824 precision sound
level meter (SLM) is the only SLM instrument compatible
with the AUDit™ software. To enter your SLM information,
February 7, 2000
Initial Configuration
2-5
click Test, Instrumentation... and select Sound Level
Meters in the upper left box of the screen.
Hint: Advance from field to field
with the Tab key. Typing the first letter of a month will fill in the appropriate month abbreviation in the pull
down box.
2-6
Figure 2-9 SLM information dialog box
Enter the serial number of your 824 and its calibration due
date, both available on labels on the back of the instrument.
The calibration date must have four digits within 100 years
of the computer’s date. Once all fields are completed, click
Add. A new SLM entry will appear in the lower left box.
•
Click Update to update the instrument information with
new values
•
Click Delete to remove the instrument entry from the
list
•
Click OK to select the instrument
•
Click Cancel to terminate data entry without saving the
last changes
AUDIOMETER CALIBRATION SYSTEM USER MANUAL
February 7, 2000
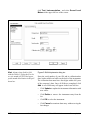
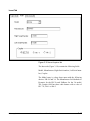
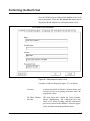
Entering Calibrator Information
Calibrator information is entered by clicking Test, Instrumentation... and selecting Calibrators in the upper left
box of the screen
Figure 2-10 .Calibrator Information Dialog Box
NOTE: The Larson Davis CAL250 calibrator provided with your system has a
frequency of 250.0 Hertz and a level of
114.0 dB re 20 micropascals. Output frequency and level will be used by the software in the calibration procedure.
Entering incorrect values could lead to
measurement errors.
February 7, 2000
Enter the serial number of your calibrator, its calibration due
date, frequency and output level. The calibration date must
have four digits within 100 years of the computer’s date.
Once all fields are completed, click Add. A new SLM entry
will appear in the lower left box.
•
Click Update to update the instrument information with
new values
•
Click Delete to remove the instrument entry from the
list
•
Click OK to select the instrument
Initial Configuration
2-7
•
Click Cancel to terminate data entry without saving the
last changes
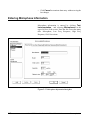
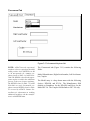
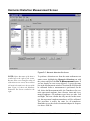
Entering Microphone Information
Microphone information is entered by clicking Test,
Instrumentation... and selecting Microphones in the
upper left box of the screen. Note that this screen has many
tabs: Microphone, Low Freq. Response, High Freq.
Response, Grid Corrections.
Figure 2-11 Microphone Information Dialog Box
2-8
AUDIOMETER CALIBRATION SYSTEM USER MANUAL
February 7, 2000
Hint: Microphone frequency
response information is available on
the calibration chart provided with
your microphone. Some audiometric
frequencies may not be listed
exactly: e.g. 200 Hz is listed as
199.53 Hz. If the frequency labeled
in the software is between two frequencies on the certificate, you may
wish to enter an interpolated value.
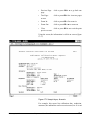
Enter the serial number of your microphone, its sensitivity
and calibration due date in the Microphone tab. The calibration date must have four digits within 100 years of the computer’s date. Do not click add until all tabs are completely
filled out. Click on the next three tabs to enter microphone
frequency response information, figure 2-12.
Figure 2-12 Microphone Frequency Response Information
Dialog Box
NOTE: Microphone
frequency
response information will be used by
AUDit™ to correct the sound level
retrieved from the SLM at each frequency
to obtain the actual sound level.
WARNING!
February 7, 2000
Using data provided by the manufacturer or calibration provider, enter the low, high frequency response and grid cap
corrections of your microphone.
Data must be entered with a leading zero (i.e. 0.02, not
.02) and all frequencies should be entered, do not leave
fields blank.
Initial Configuration
2-9
High frequency and grid cap corrections may not be necessary if you are not performing the calibration of extended
frequency audiometers.
2-10
•
Click Update to update the microphone information
with new values
•
Click Delete to remove the microphone entry from the
list
•
Click OK to select the microphone
•
Click Cancel to terminate data entry without saving
the last changes
AUDIOMETER CALIBRATION SYSTEM USER MANUAL
February 7, 2000
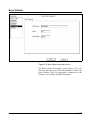
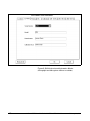
Entering Artificial Mastoid Information
The artificial mastoid is used to calibrate the bone vibrator
used for bone conduction audiometry. Information is entered
by clicking Test, Instrumentation... And selecting Mastoids in the upper left box of the screen. Note that this
screen has two tabs: Mastoid and Response.
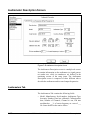
Figure 2-13 Mastoids Information Dialog Box
NOTE: The sensitivity of a B&K mastoid is found on its calibration chart,
under the heading Force Sensitivity
(including cable) and is in units of mV/N.
February 7, 2000
Only two types of mastoids are currently supported by
AUDit™ software: the Larson Davis Model AMC493 and
Bruel & Kjaer 4930 artificial mastoids. Therefore, the Manufacturer entry is a pull down menu with those two choices.
Enter the manufacturer, model and serial number of your
mastoid and its calibration due date. The calibration date
must have four digits within 100 years of the computer’s
date. It is not necessary to enter a sensitivity with the Larson-Davis artificial mastoid.
Initial Configuration
2-11
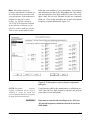
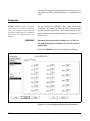
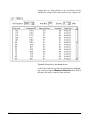
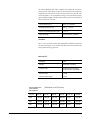
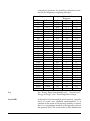
The artificial mastoid response must be entered, figure 2-14,
using data provided by the manufacturer or calibration provider.
Response
NOTE: Mastoid frequency response
information will be used by AUDit™ to
correct the voltage level retrieved from
the SLM at each frequency to obtain the
actual force level produced by the bone
vibrator.
WARNING!
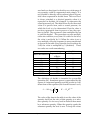
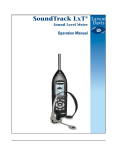
For the Larson-Davis AMC493, enter values listed on the
certification document. The Bruel & Kjaer calibration chart
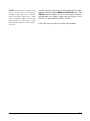
typically has three parts. Enter values read from Page 2: Frequency Response at constant dynamic force, using the 5.4 N
(black) curve.
Data must be entered with a leading zero (i.e. 0.02, not
.02) and all frequencies should be entered. Do not leave
blank fields.
Do not click Add until all tabs are completely filled out.
Figure 2-14 Artificial Mastoid Response Entry Dialog Box
2-12
AUDIOMETER CALIBRATION SYSTEM USER MANUAL
February 7, 2000
Hint: Advance from field to field
with the Tab key.
•
Click Update to update the mastoid information with
new values
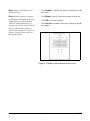
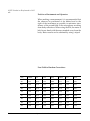
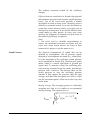
Hint: Mastoid frequency response
information is available on the calibration chart provided with your
AMC493. Some audiometric frequencies may not be listed. If the frequency labeled in the software is
between two frequencies on the certificate, you may wish to enter an
interpolated value.
•
Click Delete to remove the mastoid entry from the list
•
Click OK to select the mastoid
•
Click Cancel to terminate data entry without saving the
last changes
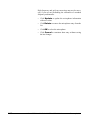
Figure 2-15 Sample Artificial Mastoid Response chart
February 7, 2000
Initial Configuration
2-13
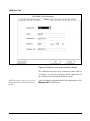
Entering Preamplifier Information
The Larson Davis System824 precision sound level meter
(SLM) is supplied with a Model PRM902 preamplifier. To
enter your preamplifier information, click Test, Instrumentation... And select Preamps in the upper left box of
the screen.
Figure 2-16 Preamplifier Information Dialog Box
Enter the serial number etched on the barrel of your preamplifier and its calibration due date, which is typically the
same as that of the 824. The calibration date must have four
digits within 100 years of the computer’s date. Once all
fields are completed, click Add. A new Preamp entry will
appear in the lower left box.
Step 1
2-14
Click Update to update the preamplifier information with new values
AUDIOMETER CALIBRATION SYSTEM USER MANUAL
February 7, 2000
Step 2
Click Delete to remove the preamplifier entry
from the list
Step 3
Click OK to select the preamplifier
Step 4
Click Cancel to terminate data entry without saving the last changes
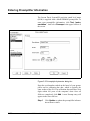
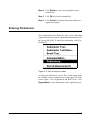
Entering Preferences
This configuration item allows the entry of the calibrating
organization and selection of communication parameters for
the System824 SLM. To enter this information, click Test,
Preferences...
Figure 2-17 Test, Set Preferences Menu
to display the Preferences screen. Two system setup items
are available in the rectangular area at the upper left of the
screen (figure 2-18): Organization and RS232 Port. Click
Organization to enter information on the organization per-
February 7, 2000
Initial Configuration
2-15
forming the audiometer calibration such as name, address
and telephone number.
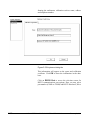
Figure 2-18 Preferences Dialog Box
This information will appear on the report and calibration
certificate. Click OK to enter the information in the database.
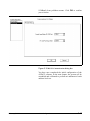
Click on RS232 Port to access the selection screen for
RS232 communications port options. Here you may select
port number (COM1 to COM8) and RS232 baud rate (300 to
2-16
AUDIOMETER CALIBRATION SYSTEM USER MANUAL
February 7, 2000
115kBaud) from pulldown menus. Click OK to confirm
your selection.
Figure 2-19 RS-232 Communications Dialog Box
You have now completed the initial configuration of the
AUDit™ software. In the next chapter, the system will be
assembled and calibrated to perform an audiometric booth
ambient level test.
February 7, 2000
Initial Configuration
2-17
2-18
AUDIOMETER CALIBRATION SYSTEM USER MANUAL
February 7, 2000
C H A PT E R
3
Audiometer Test Setup
For every audiometer test, the AUDit™ software allows you
to fully define the measurement setup as well as the components of the equipment under test. When a measurement is
printed or stored, all this information is recorded in your
database. Therefore, an audiometer system only needs to be
defined once, saving a lot of time in subsequent tests.
In this chapter, you will set up the audiometer test by performing this data entry. You will be able to refer to instruments which were entered previously in the Instrumentation
screen. Audiometers and their many sensor types will also
be entered.
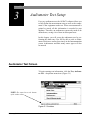
Audiometer Test Screen
To begin entering test information, click the Test, Audiometer Test... drop down menu item. (Figure 3-1)
NOTE: The status line at the bottom
of the window shows:
Figure 3-1 Test Menu
February 7, 2000
Audiometer Test Setup
3-1
This will display the Enter Test Location screen (figure 3-2).
It is the first of a series of entry screens listed in a column on
the left side of the screen. To advance to another screen, use
the pointing device to select it from the list:
•
Test Location
•
Equipment
•
Microphones
•
Audiometer
•
Earphones
•
Bone Vibrator
•
Speakers
Once data entry is completed, click OK to return to the main
AUDit™ screen. Press cancel to end data entry without
implementing changes.
3-2
AUDIOMETER CALIBRATION SYSTEM USER MANUAL
February 7, 2000
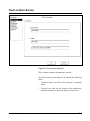
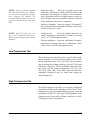
Test Location Screen
Figure 3-2 Test Location Dialog Box
This is where customer information is entered.
The Test Location screen (figure 3-2) contains the following
fields:
February 7, 2000
•
Customer Name: one line for the customer or company
name
•
Location: two lines for the location of the audiometer,
telephone number or other text data you wish to save.
Audiometer Test Setup
3-3
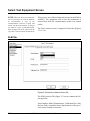
Select Test Equipment Screen
NOTE: When the desired instrumentation is selected for use with an audiometer measurement, a copy of the
instrumentation selected is made and
stored with the measurement. If changes
are made to a piece of instrumentation,
those changes will not be reflected in the
copy that is stored with the measurement.
This screen is one of the multiple tab screens you will find in
AUDit™. The equipment used to test the audiometer is
selected here from the instrumentation which was entered
earlier.
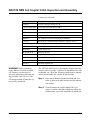
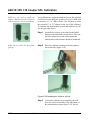
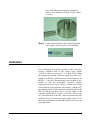
The Test Location screen is composed of four tabs (Figures
3-3 to 3-6).
SLM Tab
Figure 3-3 Sound Level Meter Selection Tab
The SLM selection Tab (figure 3-3) screen contains the following fields:
Serial number, Model, Manufacturer, Calibration Due. Only
the first field is selectable from a drop down list of the previously entered sound level meters.
3-4
AUDIOMETER CALIBRATION SYSTEM USER MANUAL
February 7, 2000
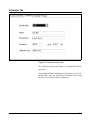
Calibrator Tab
Figure 3-4 Calibrator Selection Tab
The Calibrator selection tab (figure 3-4) contains the following fields:
Serial number, Model, Manufacturer, Frequency, Level, Calibration Due. Only the first field is selectable from a drop
down list of previously entered calibrators.
February 7, 2000
Audiometer Test Setup
3-5
Mastoid Tab
Figure 3-5 Mastoid Selection Tab
The Mastoid selection tab (figure 3-5) contains the following fields:
Serial number, Model, Manufacturer, Calibration Due, Coupler for Larson-Davis Mastoid, Mic used to calibrate the
SLM.
The first field is selectable from a drop down list of the previously entered serial numbers, which determines the Model
and Manufacturer. The Larson-Davis AMC493 and B&K
4930 artificial mastoids are supported by AUDit™. The two
boxes at the bottom of the screen are active only for the
appropriate mastoid.
3-6
AUDIOMETER CALIBRATION SYSTEM USER MANUAL
February 7, 2000
Coupler for Larson-Davis Mastoid
NOTE: Calibration data is currently
only available for the AEC100 coupler.
Since the Larson-Davis AMC493 artificial mastoid requires
corrections based on the coupler with which it is used this
radio button selects either the IEC 318 (Larson-Davis Model
AEC101) or the NBS 9A (Larson-Davis Model AEC100)
coupler.
Mic used to calibrate the SLM
This box is only enabled with the Bruel & Kjaer artificial
mastoid. It is used to specify which microphone will be used
to calibrate the SLM before using the mastoid. Mastoid and
microphone sensitivities are used to calculate the output
level of the bone vibrator.
February 7, 2000
Audiometer Test Setup
3-7
Preamp Tab
Figure 3-6 Preamplifier Selection Tab
The Preamp selection tab (figure 3-6) contains the following
fields:
Serial number, Model, Manufacturer, Calibration Due. Only
the first field is selectable from a drop down list of the previously entered preamplifiers.
3-8
AUDIOMETER CALIBRATION SYSTEM USER MANUAL
February 7, 2000
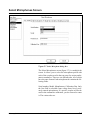
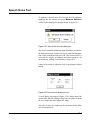
Select Microphones Screen
Figure 3-7 Select Microphone Dialog Box
The Select Microphones screen (figure 3-7) is a multiple tab
screen. It allows you to select the microphone paired with
each of the couplers used in the test setup for various audiometric transducers. There are six different tabs, all of which
have the same format. Each microphone tab contains the following fields:
Serial number, Model, Manufacturer, Calibration Due. Only
the first field is selectable from a drop down list of previously entered microphones. If a specific coupler will not be
used in the audiometer calibration, you do not need to enter
it. The various tabs are:
February 7, 2000
Audiometer Test Setup
3-9
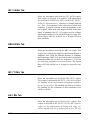
IEC 318 Mic Tab
Select the microphone used with the IEC 60318 coupler.
This coupler is designed in accordance with International
Electrotechnical Commission (IEC) standard IEC 60318-1
(1998-07): Electroacoustics - Simulators of human head and
ear - Part 1: Ear simulator for the calibration of supra-aural
earphones. It presents a known acoustical impedance to the
test earphone. When used with adapters defined in the same
family of standards, the IEC 318 coupler can also calibrate
supra-aural earphones in an extended frequency range. The
Larson Davis AEC101 artificial ear is designed to meet
these standards.
NBS 9A Mic Tab
Select the microphone used with the NBS 9A coupler. This
coupler was originally developed by the National Bureau of
Standards, now called the National Institute of Standards
and Technology (NIST). It is specified in American National
Standard Institute Specifications for Audiometers, S3.6-1996
for calibrating earphones used in audiometry. The Larson
Davis AEC100 artificial ear is designed to meet this standard.
IEC 711 Mic Tab
Select the microphone used with the IEC 60711 coupler.
This coupler is described in IEC 60711 (1981-01) Occludedear simulator for the measurement of earphones coupled to
the ear by ear inserts. The standard specifies an occludedear simulator for the calibration of insert earphones from
100 Hz to 10 kHz.
HA-1 Mic Tab
Select the microphone used with the HA-1 coupler. This
coupler is described in IEC 60126 (1973-01) IEC reference
coupler for the measurement of hearing aids using earphones coupled to the ear by means of ear inserts. The cou3-10
AUDIOMETER CALIBRATION SYSTEM USER MANUAL
February 7, 2000
pler is designed to load the earphone with a specified
acoustic impedance when determining the performance of
air-conduction hearing aids using earphones coupled to the
ear from 200 Hz to 5kHz.
HA-2 Mic Tab
Select the microphone used with the HA-2 coupler. This
coupler is also described in IEC 60126 (1973-01) IEC reference coupler for the measurement of hearing aids using earphones coupled to the ear by means of ear inserts. The
coupler is useful in determining the performance of insert
earphones with a nub or molded ear insert. It may also be
used to qualify earphones which use a tube to connect to an
ear mold or insert.
Open Air Mic Tab
Select the microphone used for open air measurements such
as the ambient noise level measurement of the Booth Test, or
speakers tests.
February 7, 2000
Audiometer Test Setup
3-11
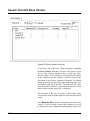
Audiometer Description Screen
Figure 3-8 Audiometer Description Screen
The Audiometer Description screen is a multiple tab screen.
It contains information on the audiometer (or signal generator) under test, while its transducers are defined in the
remaining screens of the setup items. The Audiometer
Description screen is composed of three different tabs to
describe the audiometer and its tested output frequencies.
Audiometers Tab
The Audiometers Tab contains the following fields:
•
3-12
Model, Manufacturer, Serial number, Audiometer Type,
Inventory Number, Date last calibrated, Calibration due
date, Number of Channels, Channel to test, FM tone
modulated at ___% of carrier frequency at a rate of ___
Hz. Some details on the entries follow.
AUDIOMETER CALIBRATION SYSTEM USER MANUAL
February 7, 2000
NOTE: American National Standard
•
Audiometer Type:
Enter this descriptive pure tone
audiometer type number, which should be stated in the
audiometer specifications or labeled on the instrument
itself. Additional suffixes for high frequency, speech or
free field equivalent are not available but may be entered
in the Audiometer Test Notes... comments.
•
Number of Channels: Enter the number of channels if
the tested audiometer has multiple channels. Drop down
menu selections are 1 and 2.
•
Channel to test:
Enter the channel which will be
tested. Depending on the number of channels, you may
select 1 or 2 in the drop down menu.
•
FM tone modulated...: Enter the audiometer's frequency
modulation percentage and rate of modulation. These
values will be verified in the appropriate test.
S3.6-1996 Specifications for Audiometers specifies the designation of audiometers satisfying the standard. The
minimum required facilities for each designation are listed in table 1 of the standard.
NOTE: ANSI S3.6-1996 pure tone
Type 1 and 2 audiometers must have a
facility for presenting a frequency modulated tone.
Low Frequencies Tab
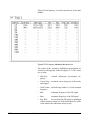
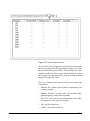
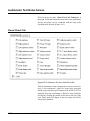
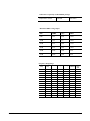
The Low Frequencies tab allows you to specify which audiometer frequencies will be tested. It contains a list of audiometer frequencies from 125 to 8000 Hz. Each frequency
may be selected by clicking on the box to its left. Click again
to deselect a frequency. The Set to Default Frequencies button selects only the common frequencies: 125, 250, 500,
750, 1000, 1500, 2000, 3000, 4000, 6000, and 8000 Hz.
Additional frequencies may be added after setting the
default frequencies.
High Frequencies Tab
The High Frequencies tab allows you to specify which high
frequencies available on the audiometer will be tested. These
frequencies are used by extended high frequency pure tone
audiometers (ANSI S3.6-1996 Type xHF designation). Each
frequency may be selected by clicking on the box to its left.
Click again to deselect a frequency.
February 7, 2000
Audiometer Test Setup
3-13
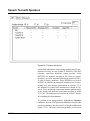
Select Earphones Screen
The Select Earphones screen (figure 3-9) is composed of
three different tabs, one each for supra-aural, insert, and circumaural earphones. Each tab lets you enter the audiometer
earphones and the respective artificial ear couplers used in
the test setup. If a certain type of earphone is not used, it
does not need to be defined.
Figure 3-9 Select Earphones screen, showing supra-aural tab.
Supra-aural Tab
The Supra-aural Tab contains the following fields:
Model, Manufacturer, Right Serial number, Left Serial number, Coupler.
The Model entry is a drop down menu with the following
choices: TDH 39, TDH 49 and TDH 50. The Manufacturer
field is set as Telephonics. The Coupler field has two radio
buttons with a value of IEC 318 or NBS 9A. NBS 9A is the
default setting.
3-14
AUDIOMETER CALIBRATION SYSTEM USER MANUAL
February 7, 2000
Insert Tab
Figure 3-10 Insert Earphone Tab
The Insert tab (Figure 3-10) contains the following fields:
Model, Manufacturer, Right Serial number, Left Serial number, Coupler.
The Model entry is a drop down menu with the following
choices: ER-3A and 3A. The Manufacturer field defaults to
Etymotic for the ER-3A and EARtone for the 3A model.
The Coupler field has three radio buttons with a value of
IEC 711, HA-1 or HA-2.
February 7, 2000
Audiometer Test Setup
3-15
Circumaural Tab
Figure 3-11 Circumaural Earphone Tab
NOTE: AUDit™ uses the supra-aural
earphone reference equivalent threshold
sound pressure levels (RETSPLs) in dB
re 20 micropascals for common earphones listed in Table 6 of ANSI S3.61996. The RESPLs referred to the appropriate coupler are used in the calibration
process. In the case of insert earphones,
The RETSPLs listed in Table 7 of ANSI
S3.6-1996 are used. Circumaural earphones interim RETSPLs listed in Table
C1 are used by AUDit™. Contact Larson-Davis for information on enabling
additional earphones with the manufacturer's valid RETSPL data.
3-16
The Circumaural tab (Figure 3-11) contains the following
fields:
Model, Manufacturer, Right Serial number, Left Serial number, Coupler.
The Model entry is a drop down menu with the following
choices: HDA200 and HV/1A. The Manufacturer field
defaults to Sennheiser for the HDA200 and Koss for the
Model HV/1A. The Coupler field defaults to IEC 318 only.
AUDIOMETER CALIBRATION SYSTEM USER MANUAL
February 7, 2000
Bone Vibrator
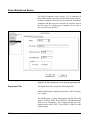
Figure 3-12 Bone Vibrator Description Screen
The Bone Vibrator Description screen (Figure 3-12) contains the following entry fields: Manufacturer, Model, and
Serial Number. Enter the appropriate information for the
vibrator in use with the calibrated audiometer.
February 7, 2000
Audiometer Test Setup
3-17
Speakers
Figure 3-13 Speaker Description Screen
The Speaker Description screen (Figure 3-12) contains two
tabs, Left and Right, each with the following entry fields:
Manufacturer, Model, and Serial Number. Enter the appropriate information for the speakers in use with the calibrated
audiometer.
3-18
AUDIOMETER CALIBRATION SYSTEM USER MANUAL
February 7, 2000
C H A PT E R
4
Booth Test or Ambient Noise
Level Test
You have now configured the AUDit™ software in preparation for your first test. In this chapter, the system will be calibrated to perform a measurement of ambient levels in the
audiometric test room. This is referred to as a booth test in
the AUDit™ software. In doing this test, we will also cover
connecting to the SLM and calibrating it.
If ambient noise levels in an audiometric test room are
excessively high, they can have a masking effect on the subject, effectively raising the measured hearing threshold. This
is most likely to occur if very low hearing threshold levels
are being measured.
NOTE: This and the other ANSI standards mentioned in this manual are
available from the Acoustical Society of
America, 120 Wall St., 32nd Floor, New
York, NY, 10005-3993, (212)248-0373.
AUDit™ allows simultaneous assessment of noise levels for
audiometric measurements with ears covered or not covered,
in the frequency ranges of 125, 250 and 500 Hz to 8000 Hz.
This test and its pass/fail limits are based on the recommendations of American National Standard on Maximum Permissible Ambient Noise Levels for Audiometric Test Rooms,
ANSI S3.1 - 1991 (ASA 99-1991).
In order to consider the worst case conditions for an audiometric test, the ambient noise test should be performed with
all possible noise sources present. If certain sources are
operating at certain times but not at others, it may be necessary to schedule the measurement accordingly.
February 11, 2000
Booth Test or Ambient Noise Level Test
4-1
Assembling the system
The Larson Davis System824 precision sound level meter
meets all the requirements of the aforementioned standard
for the measurement of ambient noise level in the audiometric test room. Its low self-noise and internal fractional octave
band measurement capability enable it to accurately measure
octave and third octave levels much below the minimum
required levels, when using a high sensitivity microphone
such as the Larson Davis model 2575 or 2570.
Equipment for Booth Test
The equipment listed below is suggested for ambient noise
testing with AUDit™.
NOTE: The microphone/preamp assembly may be suspended or supported with
a suitable microphone clamp. If the
dimensions or construction of the audiometric test room require a longer length
of cable or the use of patch panels, care
must be taken not to introduce ground
loops or other problems which can lead
to higher system self-noise levels.
4-2
•
PC with AUDit™
•
CBL006 serial cable
•
System824 precision sound level meter
•
EXC010 extension cable (optional)
•
PRM902 preamplifier
•
2575 microphone
•
ADP008 1/2 inch preamp to 1 inch microphone thread
adaptor
•
CAL250 precision Sound Pressure Level calibrator
AUDIOMETER CALIBRATION SYSTEM USER MANUAL
February 11, 2000
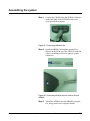
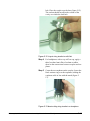
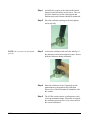
Assembling the system
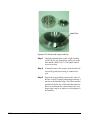
Step 1
Connect the CBL006 from the SERIAL connector
on the butt plate of the 824 SLM to the active
serial port on the computer
Figure 4-1 Connecting CBL006 to 824
Step 2
Install the PRM902 microphone preamplifier
directly on the SLM or use the EXC010 extension
cable by matching red dots on opposite gender
connectors
Figure 4-2 Connecting EXA010 extension cable to 824 and
PRM902
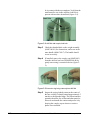
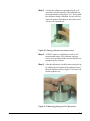
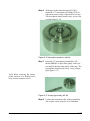
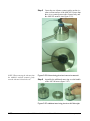
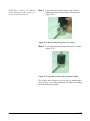
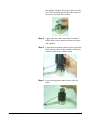
Step 3
February 11, 2000
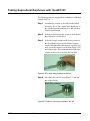
Thread the ADP008 onto the PRM902 preamplifier, being careful not to strip the threads
Booth Test or Ambient Noise Level Test
4-3
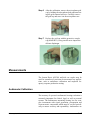
Step 4
Thread the 2575 or other microphone onto the
PRM902 preamplifier, being careful not to strip
the threads
Figure 4-3 Connecting PRM902, ADP008 and 2575
Microphone
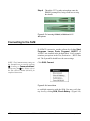
Connecting to the SLM
If AUDit™ is not active, run the software by clicking Start,
Programs, Larson Davis Programs, AUDit™ (if
AUDit™ was installed in the default folder). Verify communications port options in the Test, Preferences..., RS232 Port
tab. The System824 should have the same settings.
NOTE: The Communications settings on
the System824 are accessed by pressing
T, scrolling to Communications,
and pressing the c key. Please refer to
the 824 reference manual (I824.01) for
complete instructions.
Click SLM, Connect
Figure 4-4 Connect Menu
to establish connection with the SLM. You may verify battery level by clicking SLM, Check Battery... (Figure 4-4)
4-4
AUDIOMETER CALIBRATION SYSTEM USER MANUAL
February 11, 2000
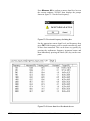
Figure 4-5 Battery Check Window
In this case the battery voltage is 12.1 Volts (figure 4-5),
with external power. Internal battery status is reported in
percent. Measurements should not be attempted with internal battery readings lower than 10%.
System SPL Calibration
NOTE: Calibrator and microphone must
be selectecd as shown in the next section
before calibration check or change
The reference level of the sound level meter is calibrated
with the use of the CAL250 or another precision calibrator.
This instrument generates a known sound pressure level
(SPL) relative to 20 micropascals. To calibrate, click SLM,
Calibration...
Figure 4-6 SLM Calibration Window
February 11, 2000
Booth Test or Ambient Noise Level Test
4-5
Hint: Do not hold or bump the calibrator during calibration. Vibrations
may affect readings. All measurement system components should
have reached a stable temperature
before calibrating. Your calibrator
should remain on for the duration of
the calibration (about 30 seconds). If
its battery is low, replace it to extend
the tone duration.
4-6
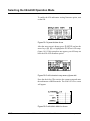
AUDit™ will display the SLM Calibration dialog box.
Select your calibrator and microphone in the pull down
menus. Note that the current level and the difference
between it and the calibrator output level are displayed at the
top of the box.(Figure 4-6) You may use this display to
check calibration without changing it, then click on Close to
exit. To change calibration click Set Calibration.
A prompt will ask you to turn on your calibrator. The
System824 must be calibrated in two ranges, with a stabilization period between both calibrations. Please follow the
prompts.
AUDIOMETER CALIBRATION SYSTEM USER MANUAL
February 11, 2000
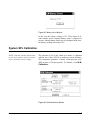
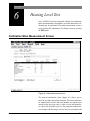
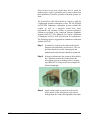
Performing the Booth Test
Once the SLM has been calibrated, the ambient noise levels
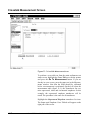
can be measured. Select the Test, Booth Test menu item to
display the Booth Ambient Levels Measurement screen.
Figure 4-7 Measurement Location screen
A number of tabs are displayed (figure 4-7), as follows:
February 11, 2000
Location
Contains text fields for Booth, Customer Name, and
Location of the room getting measured. Enter the
appropriate values.
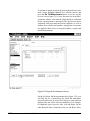
SL Meter, Preamp,
Mic tabs
The next three tabs contain the Serial Number,
Model, Manufacturer, and Calibration Due date
fields of SL Meter, Preamp, and Mic instruments
previously entered in the database. Select the appropriate instrument from the pulldown menu.
Booth Test or Ambient Noise Level Test
4-7
Figure 4-8 SLM selection and Information Window.
(Preamplifier and Microphone windows are similar.)
4-8
AUDIOMETER CALIBRATION SYSTEM USER MANUAL
February 11, 2000
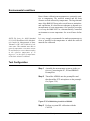
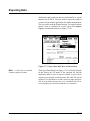
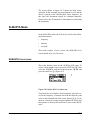
Calibrator Tab
Figure 4-9 Calibrator selection and Information Window
The Calibrator tab (figure 4-9) contains the same fields as
"SL Meter" as well as the frequency and the output SPL of
the calibrator selected from the pull down menu.
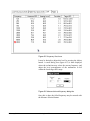
NOTE: A message (Figure 4-10) will be
displayed while the measurement is performed.
February 11, 2000
After selecting the equipment used for the ambient test, click
Measure All to begin the test.
Booth Test or Ambient Noise Level Test
4-9
Figure 4-10 Ambient Level Test Message Window
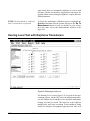
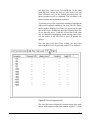
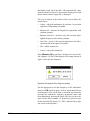
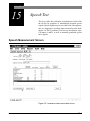
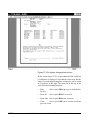
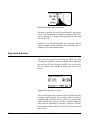
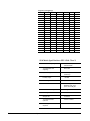
125 - 8K Hz, 250 - 8K Hz, and
500 - 8K Hz Tabs
Figure 4-11 Ambient Level 125-8kHz Results Window
4-10
AUDIOMETER CALIBRATION SYSTEM USER MANUAL
February 11, 2000
NOTE: The limits used in these tabs are
from Tables III and B2 of the American
National Standard on Maximum Permissible Ambient Noise Levels for Audiometric Test Rooms ANSI S3.1 - 1991
(ASA 99-1991). The limits for the third
octave bands centered at 31.5 and 63 Hz
are interim values derived from the
assumption that masking from lower frequency noise affects audiometric measurements at 125 Hz and above.
Once the measurement is completed, these three tabs show
Booth Test results.(Figure 4-11) Failed frequencies are indicated with a red mark. In this case, the failed 63 Hz third
octave measured SPL was 46.3 dB SPL, whereas the standard allows at most 43.0 and 37.0 dB for covered and not
covered ears. The exceeded limit values are displayed
between parentheses. Since the limits of the 125 - 8K Hz test
are the most stringent, if no failure exists on this tab, the others tabs will also show no failure.
Saving the Booth Test
Once the test is complete, you may save it by clicking OK at
the bottom of the Booth Ambient Levels Measurement
screen, which will display the dialog box shown in figure 412:
Figure 4-12 Ambient Level Test Save Window
where you can enter a descriptive string which will be used
to index this record in the measurement database. To search
previous booth tests, refer to the chapter on Stored Measurements.
February 11, 2000
Booth Test or Ambient Noise Level Test
4-11
Suspecting Instrument Noise?
Should the readings of the ambient test be questionable, you
may want to check the measurement system noise. There are
a few ways to do this. One simple alternative is to repeat the
measurement with the non-functioning calibrator left on top
of the microphone. Another would be to do the booth test
without a bias voltage on the microphone. This has the effect
of reducing its sensitivity and will show the electrical noise
of the system. The results of this second method are shown
in figure 4-13.
Figure 4-13 Booth Ambient Levels Window
As you can see, the noise level at the third octave centered at
63 Hz is -7.3 dB SPL, well below the failing ambient level.
This would indicate that the noise was not produced in the
instrumentation.
4-12
AUDIOMETER CALIBRATION SYSTEM USER MANUAL
February 11, 2000
Hint: To remove the bias voltage
from the microphone, stop the 824
and press S (Setup), r (Right
Arrow) to modify the Audtest.AUD
settings. Scroll to SLM, press r
(Right Arrow) and scroll down to
modify SLM parameter Transducer.
Press the c (Check key) and perform an Overall Reset to select
Elctrt. DO NOT FORGET TO
RESET THE TRANSDUCER TO
Condnsr BEFORE MAKING NEW
MEASUREMENTS.
February 11, 2000
This measurement has demonstrated the ease of use of the
Larson Davis audiometer calibration system. In the remainder of this manual, a full audiometer calibration will be performed.
Booth Test or Ambient Noise Level Test
4-13
4-14
AUDIOMETER CALIBRATION SYSTEM USER MANUAL
February 11, 2000
C H A PT E R
5
Assembly of the Audiometer Test
System
NOTE: You must use the setup defined
for each transducer earlier in the
AUDit™ software as described in the
Audiometer Test Setup chapter. This will
ensure the proper microphone corrections, RETSPL’s etc. are applied to the
measurement.
February 11, 2000
This chapter covers test configurations for the audiometer
transducers which can be calibrated by the LD audiometer
calibration systems. The recommended configurations for
various earphones will be described first. Common elements
such as the PC to System 824 SLM and PRM902 preamplifier connections, inspection and calibration procedures are
explained next. Please contact Larson Davis if you have any
system assembly questions not covered in this manual.
Assembly of the Audiometer Test System
5-1
Audiometer Transducer Test Configurations
The table below lists some typical audiometer transducers,
many of which are covered in specifications such as American National Standards Institute Specifications for Audiometers, S3.6-1996. When configuring the audiometer
transducer test, the AUDit™ software suggests or defaults to
appropriate setups. These test setups are covered in greater
detail in subsequent sections.
Transducer Type
Example
Suggested Setup
Comments
Supra-aural earphone
Telephonics TDH-39,
49, 50
AEC100 NBS 9-A coupler or AEC101 IEC 318
artificial ear
Use 4-5 N weight. Test
up to 8000 Hz.
Circumaural earphone
Sennheiser HDA200
AEC101 IEC 318 artificial ear with
MAEC101.06 Type 1
adaptor plate
Use 9-10N weight.
Extended frequency tests
up to 16000 Hz may be
performed.
Circumaural earphone
Koss HV/1A
AEC101 IEC 318 artificial ear with
MAEC101.07 Type 2
adaptor plate
Use 9-10N weight.
Extended frequency tests
up to 16000 Hz may be
performed.
Bone vibrator
Radiophone B-71
AEC100 NBS 9-A coupler and AMC493 artificial mastoid
Use 9-10N weight
Speakers
Speakers
Use ambient noise level
test setup from Chapter
4.
Insert earphone
Insert Earphone
2.0 cm3 or Type 2 coupler
5-2
AUDIOMETER CALIBRATION SYSTEM USER MANUAL
Refer to earphone and
coupler manufacturer
information.
February 11, 2000
Connecting the PC, 824 and PRM902 Preamplifier
WARNING! Before continuing,
ensure that the 824 SLM is turned
off. Sensitive circuitry may be
adversely affected by transients during assembly if the 824 is on. The
824 should remain off until the system is fully assembled.
Step 1
Connect the CBL006 RS-232 cable from the
SERIAL connector on the butt plate of the 824 to
the active RS-232 port on the computer (figure 51).
Figure 5-1 Connecting CBL006 to 824
Step 2
Connect the male end of the EXA010 extension
cable to the nose cone of the 824 by matching the
red dots on mating connectors (figure 5-2).
Figure 5-2 EXA010 extension cable approaching System 824.
February 11, 2000
Assembly of the Audiometer Test System
5-3
Step 3
After the PRM902 microphone preamplifier has
been inserted in the appropriate coupler, (see
below) connect it to the nose cone of the 824 with
the EXA010 extension cable by matching the red
dots on mating connectors (figure 5-3).
Figure 5-3 Preamp connecting to extension cable and to
AEC100.
5-4
Step 4
The 824 SLM may now be turned on to select RS232 parameters. Press the v key on the 824.
Step 5
Press T, scroll down with the d to Communication and press r to edit Serial Comm.
parameters. Set the parameters as desired. 9600
Baud, serial address 000 and Hdwr flow control
are suggested.
AUDIOMETER CALIBRATION SYSTEM USER MANUAL
February 11, 2000
AEC100 NBS 9-A Coupler Initial Inspection and Assembly
For this you will need:
Part Number
Description
AUDit™
AUDit™ software running on a PC
CBL006 serial cable
Serial cable 8 pin mini DIN to DB-9
824
System824 precision sound level meter (SLM)
EXA010
10 foot extension cable with 7 pin LEMO connectors
2575
1" precision air condenser microphone
PRM902
1/2" diameter low noise microphone preamplifier
CAL250
Precision SPL calibrator with 114 dB SPL output at 250 Hz
The following are AEC100 components:
MAE100.1
6 cc coupler
MAE100.3
1 inch coupler cap
SP-MAE100.40
Artificial ear base
MAE100.6
Earphone retainer ring
MAEC100.7
Mass handle
SAEC100.01
Weight assembly
ACC001
Vibration isolation pad
WARNING! Before continuing,
ensure that the 824 SLM is turned
off. Sensitive circuitry may be
adversely affected by transients during assembly if the 824 is on. The
824 should remain off until the system is fully assembled.
February 11, 2000
The AEC100 artificial ear is an elegant, compact precision
coupler built to provide a lifetime of dependable use with
reasonable care. Read the following instructions to unpack,
inspect and assemble the coupler for the first time.
Step 1
Place the cushioned vibration isolation pad on a
table or other such stable surface near the audiometer system.
Step 2
Visually inspect the coupler (MAE100.1) for
gouges, scratches and dents which may affect the
measurement, especially around the lip which will
Assembly of the Audiometer Test System
5-5
be in contact with the test earphone. Verify that the
small metallic wire in the capillary leak hole is
present with no other obstructions (figure 5-4).
Leak Hole
Figure 5-4 AEC100 with coupler, leak hole.
Step 3
Check the threaded hole on the weight assembly
(SAEC100.01) for obstructions, and screw in the
mass handle (MAEC100.7). The handle should
screw in securely.
Step 4
If installed, remove the coupler cap (MAE100.3)
from the artificial ear base (SP-MAE100.40) by
gently unscrewing it counterclockwise (figure 55).
Figure 5-5 Protective ring being removed from AEC100
Step 5
5-6
Inspect the spring-loaded contact at the center of
the base visually. It should extend approximately 5
mm above the threaded ridge. The teflon insulator
around it should be free of dust and other particles.
Please do not handle the contact and protect it by
keeping the coupler cap on whenever a microphone is not installed.
AUDIOMETER CALIBRATION SYSTEM USER MANUAL
February 11, 2000
Step 6
NOTE: When removing the preamplifier,
unscrew it by holding on its body, not the
connector sleeve.
Working over the cushioned pad (ACC001),
install the 1" microphone (LD Model 2575 or
equivalent) on the center of the artificial ear base.
The microphone should install easily: screw it finger tight (figure 5-6).
Figure 5-6 2575 Microphone and AEC100.
Step 7
Insert the 1/2" microphone preamplifier (LD
Model PRM902 or equivalent) gently in the side
port until its threads contact those of the base. The
preamplifier should install easily: screw it finger
tight (figure 5-7). Connect the instrument cable to
the preamplifier. The coupler is now ready for
level calibration.
Figure 5-7 Preamp connecting to AEC100 and Extension
Cable.
February 11, 2000
Assembly of the Audiometer Test System
5-7
AEC100 NBS 9-A Coupler SPL Calibration
Level calibration is performed with the Larson Davis Model
CAL250 precision calibrator. It offers a level of 114 dB with
an accuracy of +/-0.2 dB at 250Hz. To calibrate the measurement system and artificial ear, follow the procedure below.
Step 1
Assemble the coupler as described in the Initial
Inspection and Assembly section above. The coupler base should rest on the isolation pad and
ambient noise and vibration should be minimized.
Step 2
Place the calibrator opening on the microphone
and seat it fully (figure 5-8). Note: Do not remove
the microphone grid cap.
Figure 5-8 Cal 250 being lowered onto 2575 microphone.
5-8
AUDIOMETER CALIBRATION SYSTEM USER MANUAL
February 11, 2000
Step 3
Activate the calibrator as prompted by the software and verify the stability of the indication on
the measurement system (figure 5-9). Do not hold
the calibrator during calibration. Its tone will last
about one minute (depending on the battery) and
will turn off automatically.
Figure 5-9 Starting Calibration tone with on switch.
Step 4
AUDit™ requires a calibration in each of two
measurement ranges. The calibrator tone may
have to be reactivated for the second calibration as
prompted by the software.
Step 5
After the calibration, carefully remove the grid cap
by holding the microphone body and unscrewing
the grid counterclockwise (figure 5-10). Store it in
the microphone case.
Figure 5-10 Removing gridcap from 2575 Microphone.
February 11, 2000
Assembly of the Audiometer Test System
5-9
Step 6
Replace the grid cap with the protective coupler
cap (MAE100.3), being careful not to impact the
delicate diaphragm (figure 5-11).
Figure 5-11 Installing Protrective Ring on 2575 Microphone.
Testing Supra-Aural Earphones with the AEC100
The following steps are suggested for audiometer calibration
with the AEC100.
5-10
Step 1
Assemble the coupler as described in the Initial
Assembly above. The coupler base should rest on
the isolation pad and ambient noise and vibration
should be minimized.
Step 2
Perform a calibration of the system as described in
the Calibration section above and replace the
microphone grid cap with the protective coupler
cap (MAE100.3), being careful not to impact the
delicate diaphragm.
Step 3
As desired, apply sealant on the lower portion of
the microphone to prevent air leakage from the
coupler through paths other than the capillary leak
AUDIOMETER CALIBRATION SYSTEM USER MANUAL
February 11, 2000
hole. Place the coupler over the base (figure 5-12).
The sealant should not affect the volume of the
cavity or occlude the leak hole.
Figure 5-12 Coupler being installed on AEC100
Step 4
For headphones with a very stiff ear cap, apply a
thin (less than 1mm) film of sealant or rubber
sheet on the contact area between coupler and earphone.
Step 5
Center the test earphone on the coupler. Lower the
black retainer ring over the earphone, holding the
earphone cable in line with the notch (figure 513).
Figure 5-13 Retainer Ring being installed over headphone.
February 11, 2000
Assembly of the Audiometer Test System
5-11
Step 6
Lower the mass by its handle to the top of the earphone (figure 5-14).
Figure 5-14 Mass being installed on AEC100.
The coupler and earphone are now ready for measurement.
Set tone type, level and presentation and make the reading
on the measurement system.
5-12
AUDIOMETER CALIBRATION SYSTEM USER MANUAL
February 11, 2000
AEC101 IEC 318 Coupler Initial Inspection and Assembly
For this you will need:
Part Number
Description
AUDit™
AUDit™ software running on a PC
CBL006 serial cable
Serial cable 8 pin mini DIN to DB-9
824
System824 precision sound level meter (SLM)
EXA010
10 foot extension cable with 7 pin LEMO connectors
2559
1/2" precision air condenser random incidence microphone
PRM902
1/2" diameter low noise microphone preamplifier
CAL250
Precision SPL calibrator with 114 dB SPL output at 250 Hz with 1
to 1/2" calibrator opening adaptor
The following are AEC101 components:
Artificial ear base including base, contacts, insulator and pad
IEC 318 coupler
MAEC100.06
IEC 318 Type 1 adaptor
MAEC100.07
IEC 318 Type 2 adaptor
MAEC100.08
IEC 318 conical ring
MAE100.6
Earphone retainer ring
MAEC100.7
Mass handle
SAEC100.01
Weight assembly
ACC001
Vibration isolation pad
WARNING! Before continuing,
ensure that the 824 SLM is turned
off. Sensitive circuitry may be
adversely affected by transients during assembly if the 824 is on. The
824 should remain off until the system is fully assembled.
February 11, 2000
The AEC101 artificial ear is a versatile coupler and allows
measurement of a variety of earphones with its provided
accessories. Read the following instructions to unpack,
inspect and assemble the coupler for the first time.
Step 1
Place the cushioned vibration isolation pad on a
table or other such stable surface near the audiometer system.
Step 2
Visually inspect the coupler for gouges, scratches
and dents which may affect the measurement,
especially around the sharp lip which will be in
contact with the test earphone. Verify that the
small tube in the capillary leak hole is present with
no other obstructions (figure 5-15).
Assembly of the Audiometer Test System
5-13
Leak Hole
Figure 5-15 AEC101 with coupler, leak hole
5-14
Step 3
Check the threaded hole on the weight assembly
(SAEC100.01) for obstructions, and screw in the
mass handle (MAEC100.7). The handle should
screw in securely.
Step 4
If installed, remove the coupler from the artificial
ear base by gently unscrewing it counterclockwise.
Step 5
Inspect the spring-loaded contact at the center of
the base visually. It should extend approximately 5
mm above the threaded ridge. The teflon insulator
around it should be free of dust and other particles.
Please do not handle the contact and protect it by
keeping the coupler on whenever a microphone is
not installed.
AUDIOMETER CALIBRATION SYSTEM USER MANUAL
February 11, 2000
Step 6
Working over the cushioned pad (ACC001),
install the 1/2" microphone (LD Model 2559 or
equivalent) on the center of the artificial ear base.
The microphone should install easily: screw it finger tight (figure 5-16).
Figure 5-16 Microphone installed on AEC101
Step 7
NOTE: When removing the pream-
plifier, unscrew it by holding on its
body, not the connector sleeve
Insert the 1/2" microphone preamplifier (LD
Model PRM902 or equivalent) gently in the side
port until its threads contact those of the base. The
preamplifier should install easily: screw it finger
tight (figure 5-17).
.
Figure 5-17 Preamp approaching AEC101
Step 8
February 11, 2000
Connect the instrument cable to the preamplifier.
The coupler is now ready for level calibration.
Assembly of the Audiometer Test System
5-15
AEC101 IEC 318 Coupler SPL Calibration
NOTE: You will need to install the
adapter (ADP019) into the CAL250 in
order to calibrate 1/2 inch microphones.
ADP019
NOTE: Do not remove the microphone
grid cap.
Level calibration is performed with the Larson Davis Model
CAL250 precision calibrator. It offers a level of 114 dB with
an accuracy of +/-0.2 dB at 250Hz. You will have to insert
the provided 1" to 1/2" adaptor in the top of the calibrator.
To calibrate the measurement system and artificial ear, follow the procedure below.
Step 1
Assemble the coupler as described in the Initial
Inspection and Assembly section above. The coupler base should rest on the isolation pad and
ambient noise and vibration should be minimized.
Step 2
Place the calibrator opening on the microphone
and seat it fully (figure 5-18).
Figure 5-18 Installing the CAL250 on AEC101
Step 3
5-16
Activate the calibrator as prompted by the software and verify the stability of the indication on
the measurement system (figure 5-19). Do not
AUDIOMETER CALIBRATION SYSTEM USER MANUAL
February 11, 2000
hold the calibrator during calibration. Its tone will
last about one minute (depending on the battery)
and will turn off automatically.
Figure 5-19 CAL250 being activated on AEC101
Step 4
February 11, 2000
AUDit™ requires a calibration in each of two
measurement ranges. The calibrator tone may
have to be reactivated for the second calibration as
prompted by the software.
Assembly of the Audiometer Test System
5-17
Testing Supra-Aural Earphones with the AEC101
The following steps are suggested for audiometer calibration
with the AEC101.
Step 1
Assemble the coupler as described in the Initial
Assembly above. The coupler base should rest on
the isolation pad and ambient noise and vibration
should be minimized.
Step 2
Perform a calibration of the system as described in
the Calibration section above.
Step 3
As desired, apply sealant on the lower portion of
the microphone to prevent air leakage from the
coupler through paths other than the capillary leak
hole. Screw the coupler over the base (figure 5-20)
until finger tight. The sealant should not affect the
volume of the cavity or occlude the leak hole.
Figure 5-20 Coupler being installed on AEC101
Step 4
Place the black conical ring (figure 5-21) on the
top of the coupler.
Black Ring installed
Figure 5-21 Black Conical ring installed on AEC101
5-18
AUDIOMETER CALIBRATION SYSTEM USER MANUAL
February 11, 2000
Step 5
For headphones with a very stiff ear cap, apply a
thin (less than 1mm) film of sealant or rubber
sheet on the contact area between coupler and earphone.
Step 6
Center the test earphone on the coupler. Lower the
black retainer ring over the earphone, holding the
earphone cable in line with the notch (figure 522).
Figure 5-22 Retainer ring being installed on AEC101
Step 7
Lower the mass by its handle to the top of the earphone (figure 5-23).
Figure 5-23 Mass being lowered onto headphone.
The coupler and earphone are now ready for measurement.
Set tone type, level and presentation and make the reading
on the measurement system.
February 11, 2000
Assembly of the Audiometer Test System
5-19
Testing Circumaural Earphones with the AEC101
Circumaural earphones are available for audiometers using
extended high-frequencies, from 8000 to 16000 Hz. These
earphones typically rest against the head with little or no
contact with the pinna (external ear). Their speaker (or
driver) is coupled to the ear with a relatively large volume of
air under the ear cap.
Interim RETSPLs for two circumaural earphones are listed
in Annex C of ANSI S3.6-1996. These two types of cirumaural earphones are available in AUDit™: the Sennheiser
HDA200 and Koss HV/1A.
Environmental conditions
It is stated in various standards that the extended high-frequency calibration of circumaural earphones be performed
only when the following environmental conditions are met.
Condition
Range in ANSI S3.6-1996
(Annex C)
Range in IEC 318-1:1998
Clause 6 Calibration
Ambient Pressure
98 to 104 kPa
98.3 to 104.3 kPa
Temperature
18 to 26 degrees C
20 to 26 degrees C
Relative Humidity
30 to 80% RH
30 to 70% RH
Any condition not met
Calibration is not allowed
State actual values
Test Configurations
The following steps are suggested for circumaural earphone
audiometer calibration with the AEC101.
5-20
Step 1
Assemble the coupler as described in the Initial
Assembly above. The coupler base should rest on
the isolation pad and ambient noise and vibration
should be minimized.
Step 2
Perform a calibration of the system as described in
the Calibration section above.
AUDIOMETER CALIBRATION SYSTEM USER MANUAL
February 11, 2000
Step 3
As desired, apply sealant on the lower portion of
the microphone to prevent air leakage from the
coupler through paths other than the capillary leak
hole. Screw the coupler over the base (figure 524). The sealant should not affect the volume of
the cavity or occlude the leak hole.
Figure 5-24 Coupler being installed on AEC101
Step 4
For earphones designed to be calibrated with a
Type 1 adapter (such as the Sennheiser HDA200),
install the Type 1 adapter on the coupler, with the
cylindrical rim facing down. Place the black conical ring on the top of the coupler and plate, with its
flat base on the bottom (figure 5-25).
Figure 5-25 AEC101 with Type 1 Adapter installed.
February 11, 2000
Assembly of the Audiometer Test System
5-21
Step 5
For earphones designed to be calibrated with a
Type 2 adapter (such as the Koss HV/1A), use the
Type 2 adapter, which has crenellated distance
clamps around its circumference. Do not use the
black conical ring (figure 5-26).
Figure 5-26 Type 2 adapter adapter installed on AEC101.
Step 6
5-22
Center the test earphone on the coupler or place it
as recommended if the cushion is asymmetrical.
AUDIOMETER CALIBRATION SYSTEM USER MANUAL
February 11, 2000
Step 7
ANSI S3.6-1996 requires a static force of 9 to 10
N on the earphone during calibration. Use the
large weight (figure 5-27).
Figure 5-27 Sennheiser earphone and weight being installed on
AEC101
The coupler and earphone are now ready for measurement.
Set tone type, level and presentation and make the reading
on the measurement system.
February 11, 2000
Assembly of the Audiometer Test System
5-23
Testing Bone Vibrators with the AMC493 Artificial Mastoid
Bone vibrators are used to test sound conduction through the
head from a forehead or mastoid placement. Their use is
limited to a restricted frequency range. The LD AMC493
artificial mastoid uses an innovative design to allow bone
vibrator calibration with an NBS 9-A coupler. The AMC493
converts the force applied by the bone vibrator to an acoustic
signal which can then be measured acoustically by the calibration system. The following steps are suggested for bone
vibrator transducer calibration.
In addition to the components of the AEC100 listed above,
you will need the following equipment:
Part Number
Description
AMC493
Artificial mastoid
MMAS493.03
Additional ring mass
Environmental conditions
Bone vibrator calibration measurements are extremely sensitive to temperature. The artificial mastoid, and the bone
vibrator itself are affected by temperature. One important
advantage of the AMC493 is its very low thermal mass,
which allows it to stabilize to the temperature of the test area
very quickly, typically within a few tens of minutes. The
sensitivity level and mechanical impedance level table or
graph supplied for the AMC493 were measured at a standard
temperature.
NOTE: The basis for ANSI Standard
S3.13-1987 (Reaffirmed 1993) Mechanical Coupler for Measurement of Bone
Vibrators is IEC 60373:1990-01 of the
same name. This standard states that in
general, temperature corrections can not
be used directly to correct data not taken
at the reference temperature of 23
degrees C, as the effect of temperature
on the bone vibrator is unknown.
5-24
The temperature dependence of the mastoid is stated in its
manual. Although AUDit™ performs a temperature correction, it is very strongly recommended to make measurements as close as possible to the temperature at which the
AMC493 mastoid was calibrated.
AUDIOMETER CALIBRATION SYSTEM USER MANUAL
February 11, 2000
Test Configuration
Step 1
Assemble the AEC100 coupler as described in the
Initial Assembly above. The coupler base should
rest on the isolation pad and ambient noise and
vibration should be minimized.
Step 2
Perform a calibration of the system as described in
the AEC100 Calibration section above.
Step 3
As desired, apply sealant on the lower portion of
the microphone to prevent air leakage from the
coupler through paths other than the capillary leak
hole. Place the coupler over the base (figure 5-11).
The sealant should not affect the volume of the
cavity or occlude the leak hole.
Step 4
Lightly place the blue ring-shaped polymer under
the AMC493 artificial mastoid on the top of the
coupler (figure 5-28). There must not be any metal
to metal contact. Press down slightly on the
AMC493 to secure its position.
Figure 5-28 Mastoid placed on AEC100
February 11, 2000
Assembly of the Audiometer Test System
5-25
Step 5
NOTE: When removing the vibrator from
the AMC493 artificial mastoid, gently
twist the vibrator to break the seal.
Center the test vibrator contact surface on the circular resilient surface of the AMC493. Ensure that
there is no contact between the vibrator body and
the AMC493 metallic rim (figure 5-29).
Figure 5-29 Vibrator being placed and centered on mastoid.
Step 6
Assemble the additional mass ring over the handle
of the AEC100 mass (figure 5-30)
Figure 5-30 Additional mass being placed on AEC100 weight
5-26
AUDIOMETER CALIBRATION SYSTEM USER MANUAL
February 11, 2000
NOTE: When removing the AMC493
artificial mastoid from the coupler, gently twist it off to break the seal.
Step 7
Lower the black retainer ring over the vibrator,
holding the vibrator cable in line with the notch
(figure 5-31).
Figure 5-31 Retainer Ring being placed over vibrator.
Step 8
Lower the mass on top of the vibrator by its handle
(figure 5-32).
Figure 5-32 Artificial ear with vibrator and mass installed.
The coupler and vibrator are now ready for measurement.
Set tone type, level and presentation and make the reading
on the measurement system.
February 11, 2000
Assembly of the Audiometer Test System
5-27
Testing Bone Vibrators with the B&K 4930 or other Artificial
Mastoid
Unlike the LD AMC493, the Brüel & Kjær artificial mastoid
uses an accelerometer to measure the bone vibrator output.
The LD audiometer calibration system can interface with the
B&K mastoid by using the high input impedance PRM902
preamplifier and a suitable adapter.
If the cable from the B&K 4930 has a 10-32 microdot connector (small threaded coaxial connector), use the ADP007.
One the other hand, if your artificial mastoid has a BNC
coaxial connector, use the ADP006 provided with the LD
system (figure 5-33). You will also need:
Part Number
Description
AUDit™
AUDit™ software running on a PC
CBL006
Serial cable 8 pin mini DIN to DB-9
824
System824 precision sound level meter (SLM)
PRM902
1/2" diameter low noise microphone preamplifier
ADP008
1" microphone to 1/2" preamp adapter
2575
1" precision air condenser microphone
CAL250
Precision SPL calibrator with 114 dB SPL output at 250 Hz
B&K 4930
Artificial Mastoid and accessories
ADP007 or
ADP006
Microdot to 1/2" preamp adapter for charge-coupled accelerometer or BNC to 1/2" microphone thread adapter, 47 pF with shorting
cap
ADP007
ADP006
Figure 5-33 Adapters to connect to B & K mastoid.
5-28
AUDIOMETER CALIBRATION SYSTEM USER MANUAL
February 11, 2000
Environmental conditions
Bone vibrator calibration measurements are extremely sensitive to temperature. The artificial mastoid and the bone
vibrator are both affected by temperature. The large thermal
mass of the B&K 4930 may take several hours to attain thermal equilibrium. It is therefore not adequate to depend on a
measurement of room temperature. One possible procedure
is to keep the B&K 4930 in a thermostatically controlled
environment at room temperature for several hours before
use.
NOTE: The basis for ANSI Standard
S3.13-1987 (Reaffirmed 1993) Mechanical Coupler for Measurement of Bone
Vibrators is IEC 60373:1990-01 of the
same name. This standard states that in
general, temperature corrections can not
be used directly to correct data not taken
at the reference temperature of 23
degrees C, as the effect of temperature
on the bone vibrator is unknown.
It is very strongly recommended to make measurements as
close as possible to the temperature at which the artificial
mastoid was calibrated.
Test Configuration
Step 1
Assemble the measurement system as in the section on: Connecting the PC, 824 and PRM902
Preamplifier.
Step 2
Thread the ADP008 onto the preamplifier and
then thread the 2575 microphone on the preamplifier (figure 5-34).
Figure 5-34 ADP008 being installed on PRM902.
Step 3
February 11, 2000
Perform a system SPL calibration with the
CAL250.
Assembly of the Audiometer Test System
5-29
Step 4
Remove the ADP008 adaptor and 2575 microphone, and replace them with the appropriate
adaptor to connect to the artificial mastoid (figure
5-35).
ADP007
ADP006
Figure 5-35 Adapters to connect to B & K mastoid.
Step 5
Install the bone vibrator on the B&K 4930 as
described in the B & K user manual.
The coupler and vibrator are now ready for measurement.
Set tone type, level and presentation and make the reading
on the measurement system.
5-30
AUDIOMETER CALIBRATION SYSTEM USER MANUAL
February 11, 2000
C H A PT E R
6
Hearing Level Test
Once AUDit™ has been configured with the test instrumentation and audiometer information, an actual audiometer calibration may be performed. The main measurement screen is
accessed from the Audiometer Test Setup screen by pressing
the OK button.
Calibration Main Measurement Screen
Figure 6-1 Main Measurement Screen
The main measurement screen (figure 6-1) allows one to
enter the test date and technician name. The tested audiometer manufacturer, model and serial number are displayed as
entered in the previous setup. A table of tests and transducers shows the available tests for the particular audiometer.
For example, the Hearing Level test may be performed with
February 7, 2000
Hearing Level Test
6-1
supra-aural, insert or circumaural earphones, as well as with
the bone vibrator and speakers. Appropriate corrections are
applied within each test using microphone, coupler and standard adjustments.
NOTE: The SLM should be calibrated
before a measurement is performed.
To begin the audiometer calibration process, highlight the
Hearing Level test with the pointer and press the Go To
Measurement button. If you are already in a test screen,
press the same test in the Measurements window at the
upper left.
Hearing Level Test with Earphone Transducers
Figure 6-2 Hearing Level Screen
The Hearing Level screen (figure 6-2) is typical of the measurement screens. On the left, below the measurement table,
you will find the list of transducers for which the audiometer
hearing level may be tested. The large box at the right has
multiple tabs and varies according to the transducer being
tested. For example, all earphones types have four tabs: Low
6-2
AUDIOMETER CALIBRATION SYSTEM USER MANUAL
February 7, 2000
and High Freq. Input levels, Left and Right. On the other
hand, the bone vibrator has only two tabs: Input levels and
Bone Vibrator Levels. In this section, the supra-aural earphone transducers will be calibrated. The procedure is the
same for insert and circumaural earphones.
To perform a test of the supra-aural earphones, highlight the
Supra-aural Earphone transducer list item. The four Supraaural Earphone Hearing Level tabs will appear on the right
part of the screen. Default low and high frequency input levels are typically set to 70 dB HL on each tab. Each value
may be changed by highlighting it and entering a new value.
Use the pointer or the TAB key to move to another frequency.
Once the input levels have been verified, one may select
which earphone to test by pressing on the Left or Right tab.
Figure 6-3 Active Frequencies List
The list of the active frequencies selected earlier in the audiometer setup appears in the right window (figure 6-3). Note
February 7, 2000
Hearing Level Test
6-3
the headers at the top of the table. The measured SPL value
from the sound level meter is converted to hearing level, and
the deviation from the target SPL is displayed.
The row of buttons at the bottom of the screen allows the
technician to:
•
Adjust - adjust the audiometer in real-time if a precision
output level adjustment is available
•
Measure All - measure all frequencies sequentially with
software prompts
•
Measure Selected - measure only the currently highlighted frequency with software prompts
•
Next Test - move to the next measurement in the Measurements list in the upper left window
•
OK - end the current test
•
Cancel - cancel the current test
Press Measure All to perform a hearing level test on the
left earphone. AUDit™ then displays the prompt shown in
figure 6-4 for the first frequency:
Figure 6-4 Prompt for First Frequency Setting
Set the appropriate level and frequency on the audiometer
then press OK. Each frequency will be tested until all have
been measured. This can be done in less than one minute by
pressing the audiometer frequency increment button and
then immediately pressing the Enter (OK) key on the computer. In the above example, all frequencies passed except
for the last 8000 Hz (figure 6-5). This is indicated by a large
red X next to the frequency.
6-4
AUDIOMETER CALIBRATION SYSTEM USER MANUAL
February 7, 2000
Figure 6-5 Frequency Test Screen
It may be desired to adjust this level by pressing the Adjust
button. A small dialog box (figure 6-6) is then displayed
where the technician may select the current frequency and
adjust the level potentiometer of the audiometer to fall
within the listed target SPL range.
Figure 6-6 Measure Selected Frequency Dialog Box
Once this is done, the failed frequency may be retested with
the Measure Selected button.
February 7, 2000
Hearing Level Test
6-5
Hearing Level Test with Bone Vibrator
Figure 6-7 Hearing Level Test with Bone Vibrator Screen
To perform a test of the bone vibrator transducer, highlight
the Bone Vibrator transducer list item. The Hearing Level
screen (figure 6-7) for the bone vibrator transducer has two
tabs: Input Levels and Bone Vibrator Levels. In the first tab,
the test bone vibrator levels can be specified or set to default
values. Use the pointer or TAB key to move from one frequency to another. The Bone Vibrator Levels tab displays
calibration results.
6-6
AUDIOMETER CALIBRATION SYSTEM USER MANUAL
February 7, 2000
Figure 6-8 Bone Vibrator Levels Tab
The list of the active frequencies selected earlier in the audiometer setup appears in the right window (figure 6-8).
Placement of the bone vibrator affects output. Select the
proper option: Mastoid or Forehead. Note the headers at the
top of the table. The measured SPL value from the sound
level meter is converted to hearing level, and the deviation
from the target SPL is displayed.
The row of buttons at the bottom of the screen allows the
technician to:
February 7, 2000
•
Adjust - adjust the audiometer in real-time if a precision
output level adjustment is available
•
Measure All - measure all frequencies sequentially with
software prompts
•
Measure Selected - measure only the currently highlighted frequency with software prompts
Hearing Level Test
6-7
•
Next Test - move to the next measurement in the Measurements list in the upper left window
•
OK - end the current test
•
Cancel - cancel the current test
Press Measure All to perform a hearing level test on the
bone vibrator. If you are using a Larson Davis mastoid, you
will be prompted to enter temperature and humidity values
(figure 6-9) used within the software for artificial mastoid
corrections.
Figure 6-9 Temperature/Humidity Entry Screen
Enter the humidity range, dry, normal, moist or tropical, as
well as the temperature in degrees centigrade
Hint: (degrees C = (degrees F - 32) x 5 / 9).
AUDit™ then displays the prompt shown in figure 6-10 for
the first frequency:
6-8
AUDIOMETER CALIBRATION SYSTEM USER MANUAL
February 7, 2000
Figure 6-10 Hearing Level Set Screen
Set the appropriate level and frequency then press OK. Each
frequency will be tested until all have been measured consecutively. This can be done in less than one minute by
pressing the audiometer frequency increment button and
then immediately pressing the Enter (OK) key on the computer.
February 7, 2000
Hearing Level Test
6-9
Hearing Level Test with Speakers
Figure 6-11 Hearing Level Test with Speakers Screen
Sound field audiometric testing using speakers may be performed in a variety of ways. Table 9 of ANSI S3.6-1996 lists
reference equivalent threshold sound pressure levels
(RETSPL) for binaural listening in free field at 0 degree
incidence, as well as monaural listening for 0, 45 and 90
degree incidence. These RETSPLs are used in AUDit™ to
translate the measured sound pressure levels to hearing levels. Note that the prescriptions in section 9.5.1 of the standard for sound field characteristics should be followed.
These include the requirement that the ambient noise in the
sound field shall not exceed that specified in ANSI S3.11991. The ambient noise booth test in AUDit™ is helpful in
making this determination.
To perform a test using speakers, highlight the Speakers
transducer list item. The Hearing Level screen (figure 6-11)
for the speakers transducers has five tabs: Low and High
6-10
AUDIOMETER CALIBRATION SYSTEM USER MANUAL
February 7, 2000
Freq. Input Levels, Left, Right and Binaural. In the first two
tabs, the speaker test levels can be specified for audiometric
frequencies from 125 to 20000 Hertz. Use the pointer or
TAB key to move from one frequency to another and enter
the desired test level.
The remaining tabs select the speaker(s) to be tested: left,
right or both (binaural). In this example, the Left tab is
selected. An incidence angle of 0, 45 or 90 degrees must be
chosen so that the appropriate RETSPL correction is
applied. Note the headers at the top of the table. Measured
SPL value from the sound level meter is converted to hearing level, and the deviation from the target SPL is displayed.
The Right tab operates in exactly the same manner. The Binaural tab has only one incidence angle selection, zero
degrees.
The row of buttons at the bottom of the screen allows the
technician to:
•
Adjust - adjust the audiometer in real-time if a precision
output level adjustment is available
•
Measure All - measure all frequencies sequentially with
software prompts
•
Measure Selected - measure only the currently highlighted frequency with software prompts
•
Next Test - move to the next measurement in the Measurements list in the upper left window
•
OK - end the current test
•
Cancel - cancel the current test
Press Measure All to perform a hearing level test using the
speakers. Since frequency modulation is required for this
test, you will also be prompted to select a FM test signal
(figure 6-12).
February 7, 2000
Hearing Level Test
6-11
Figure 6-12 Level and Frequency Set Dialog
Set the appropriate level and frequency then press OK. Each
frequency will be tested until all have been measured consecutively. This test can be performed in less than one
minute by pressing the audiometer frequency increment button and then immediately pressing the Enter key (OK) on the
computer.
6-12
AUDIOMETER CALIBRATION SYSTEM USER MANUAL
February 7, 2000
C H A PT E R
7
Frequency Test
Once AUDit™ has been configured with the test instrumentation and audiometer information, an actual audiometer calibration may be performed. The main measurement screen is
accessed from the Setup screen by pressing the OK button.
Calibration Main Measurement Screen
Figure 7-1 Main Measurement screen
The main measurement screen (figure 7-1) allows one to
enter the test date and technician name. The tested audiometer manufacturer, model and serial number are displayed as
entered in the previous setup. A table of tests and transducFebruary 7, 2000
Frequency Test
7-1
ers shows the available tests for the particular audiometer.
For example, the Frequency test may be performed with
supra-aural, insert or circumaural earphones. Appropriate
corrections are applied within each test using appropriate
microphone, coupler and standard adjustments.
To continue the audiometer calibration process, highlight the
Frequency test with the pointer and press the Go To Measurement button. If you are already in a test screen, press
the same test in the Measurements window. Note that the
SLM should be calibrated before a measurement is performed.
Frequency Test with Earphone Transducers
Figure 7-2 Frequency Test Screen
7-2
AUDIOMETER CALIBRATION SYSTEM USER MANUAL
February 7, 2000
The Frequency test screen (figure 7-2) is the same for all
earphone types. On the left, below the measurement table,
the transducers list contains supra-aural, insert and circumaural earphones. All earphones types have two tabs: Left
and Right. In this example, the supra-aural earphone transducers will be calibrated. The procedure is the same for
insert and circumaural earphones.
To perform a test of the supra-aural earphones, highlight the
Supra-aural Earphone transducer list item. The Supra-aural
Earphone Frequency Accuracy tabs will appear on the right
part of the screen. One may select the test earphone by
pressing on the Left or Right tab.
The list of the active frequencies selected earlier in the audiometer setup process appears in the right window. Note the
headers at the top of the table. The dial and measured frequency value from the sound level meter are displayed, and
the deviation from the target frequency is displayed for each
frequency.
The row of buttons at the bottom of the screen allows the
technician to:
•
Adjust - this is unavailable in this mode
•
Measure All - measure all frequencies sequentially with
software prompts
•
Measure Selected - measure only the currently highlighted frequency with software prompts
•
Next Test - move to the next measurement in the Measurements list in the upper left window
•
OK - end the current test
•
Cancel - cancel the current test
Press Measure All to perform a frequency test on the left
earphone. AUDit™ then displays the prompt shown in figure 7-3 for the first frequency:
February 7, 2000
Frequency Test
7-3
Figure 7-3 Set Level and Frequency Dialog Box
Set the appropriate level and frequency then press OK. Each
frequency will be tested until all have been measured consecutively. Frequency measurement is performed accurately
by a dedicated counter in the Model 824 sound level meter.
A number of counter values are compared to ensure an accurate reading. This process may take a few seconds. In this
example, all frequencies higher than 750 Hz are out of tolerance.(figure 7-4) This is indicated by a large red X next to
each frequency.
Figure 7-4 Frequency Test Results Box
7-4
AUDIOMETER CALIBRATION SYSTEM USER MANUAL
February 7, 2000
NOTE: If the frequency reading is not
stable, it could be due to noise that is
coupled into the artificial ear. Possible
sources are HVAC, abient noise, (room
noise) or vibration. Make sure to use the
pad and test on a solid surface. Verify
that the ambient noise levels are satisfactorily low.
February 7, 2000
A failed frequency may be retested after adjustment by highlighting it and pressing the Measure Selected button. The
Adjust button is inactive in this screen because frequency
measurements are slightly longer and the display is not
effective for adjustment in real time AUDit™.
Follow the same procedure to test the right earphone.
Frequency Test
7-5
7-6
AUDIOMETER CALIBRATION SYSTEM USER MANUAL
February 7, 2000
C H A PT E R
8
Linearity Test
Various requirements regarding signal level controls appear
in section 7 of ANSI S3.6-1996. Acceptable hearing level
control linearity is specified in section 7.3.3 essentially as
follows: the measured difference between two output HL
settings not more than five decibels apart on the audiometer
shall not vary more than three tenths or one decibel (whichever is smaller) from the indicated difference.
AUDit™ allows the measurement of linearity from the maximum hearing level down to the noise floor of the measurement system. The test frequency, maximum dBHL and dial
step may be selected by the technician. Defaults are 1000 Hz
frequency, 110 dBHL maximum level and 5 dBHL steps.
Linearity Measurement Screen
Figure 8-1 Linearity Measurement Screen
February 7, 2000
Linearity Test
8-1
To perform a linearity test from the main audiometer test status screen, highlight the Linearity test with the pointer and
press the Go To Measurement button. If you are already
in a test screen, press the same test in the Measurements
window. Note that the SLM should be calibrated before a
measurement is performed. On the left, below the measurement table, (figure 8-1) the Transducers list contains supraaural, insert and circumaural earphones. All earphone types
have two tabs: Left and Right. In this example, the supraaural earphone transducers will be calibrated. The procedure
is the same for insert and circumaural earphones.
NOTE: The headers at the top of the
table. Measured SPL from the sound
level meter will be displayed, and the
deviation from the target step calculated
for each level difference.
Highlight the Supra-aural Earphone transducer list item.
The Supra-aural Earphone Linearity tabs will appear on the
right part of the screen. One may select which earphone to
test by pressing on the Left or Right tab. Select the desired
frequency and dial step (10, 5 or 1 dB) from the drop down
lists and enter the appropriate maximum output level of the
audiometer.
The row of buttons at the bottom of the screen allows the
technician to:
•
Measure All - measure all levels sequentially with software prompts
•
Measure Selected - measure only the currently highlighted output level with software prompts
•
Next Test - move to the next measurement in the Measurements list in the upper left window
•
OK - end the current test
•
Cancel - cancel the current test
Press Measure All to perform a linearity test on the right
earphone. AUDit™ then displays the prompt shown in figure 8-2 to measure the lower end of the test range:
8-2
AUDIOMETER CALIBRATION SYSTEM USER MANUAL
February 7, 2000
Figure 8-2 Level and Frequency Set Dialog Box
Hint: To test only a certain part of
the hearing level control linearity; 1.
set the upper level in the max dBHL
entry field. Then present the lower
level on the audiometer during the
noise floor test.
Set the appropriate level and frequency then press OK.
There may be a delay while the measurement system gain is
adjusted. Once the noise floor has been measured (e.g. 0.6
dB), it will appear on the Linearity screen (figure 8-3).
Figure 8-3 Noise Floor Dialog Box
All level steps from the maximum level to the noise floor
will be tested consecutively with AUDit™ prompts to
February 7, 2000
Linearity Test
8-3
change the level. Steps which are out of tolerance will be
indicated by a large red X on the results screen. (Figure 8-4)
Figure 8-4 Noise Floor Test Results Screen
A failed level may be retested after adjustment by highlighting it and pressing the Measure Selected button. Follow
the same procedure to test the other earphone.
8-4
AUDIOMETER CALIBRATION SYSTEM USER MANUAL
February 7, 2000
C H A PT E R
9
Distortion Test
The Larson Davis audiometer calibration system performs
accurate distortion measurements of the pure tone signal
source by using narrow band fast fourier transform (FFT)
analysis. Distortion components can affect audiometric evaluations and may indicate hardware problems. The maximum
permissible levels in percent are listed in Table 4 of ANSI
S3.6-1996. In general, total harmonics should be less than
2.5% for air conduction and less than 5.5% for bone conduction.
Harmonic distortion is to be measured at the levels listed in
the table or the maximum hearing level of the audiometer,
whichever is lower. Limitations in the frequency response of
the measurement system dictate that distortion measurements above 5000 Hz should be made across the electrical
terminals of the transducer. The ADP010 Audiometer Earphone Testing Adaptor is ideal for this purpose. Insert it in
the connection to the transducer, and then connect its BNC
to the ADP006 BNC to 1/2" preamplifier adaptor on the
PRM902.
Total harmonic distortion is
defined as follows:
f3 2
f2 2
THD ( percent ) = 100 --- + --- …
f1
f1
where f1 is the fundamental frequency, f2 the second harmonic, etc. Levels must be expressed in linear units in this
formula.
February 7, 2000
Distortion Test
9-1
Harmonic Distortion Measurement Screen
Figure 9-1 Harmonic Distortion Test Screen
NOTE: Notice that some of the data is
scrolled off to the right of the screen.
Because there is not enough to show all
of the data on one screen, the scroll bar
will need to be used to see the rest of the
data. Figure 9-3 shows the Harmonic
Distortion Test Screen scrolled to the
right.
9-2
To perform a distortion test from the main audiometer test
status screen, highlight the Harmonic Distortion test with
the pointer and press the Go To Measurement button. If
you are already in a test screen (figure 9-1), press the same
test in the Measurements window. Note that the SLM should
be calibrated before a measurement is performed. On the
left, below the Measurement table, the Transducers list contains supra-aural earphone, bone vibrator, insert and circumaural earphones. All earphones types have two tabs: Left
and Right. The bone vibrator has only one tab. In this example, the supra-aural earphone transducers will be calibrated.
The procedure is nearly the same for all transducers.
Remember to use the electrical terminal adaptor for frequencies above 5000 Hz.
AUDIOMETER CALIBRATION SYSTEM USER MANUAL
February 7, 2000
Highlight the Supra-aural Earphone transducer list item. The
Supra-aural Earphone tabs will appear on the right part of
the screen (figure 9-1). You may select which earphone to
test by pressing on the Left or Right tab.
The row of buttons at the bottom of the screen allows the
technician to:
•
Measure All - measure all levels sequentially with software prompts
•
Measure Selected - measure only the currently highlighted output level with software prompts
•
Next Test - move to the next measurement in the Measurements list in the upper left window
•
OK - end the current test
•
Cancel - cancel the current test
Press Measure All to perform a distortion test on the left
earphone. AUDit™ then displays the prompt shown in figure 9-2 to measure the first frequency:
Figure 9-2 Level and Frequency Set Dialog Box
Set the appropriate level and frequency then press OK.
There may be a delay while the measurement system gain is
adjusted. Each frequency will be tested consecutively. When
reaching the higher frequencies, it will be necessary to use
the ADP010 and ADP006 combination to measure distortion
on the electrical signal.
February 7, 2000
Distortion Test
9-3
Figure 9-3 THD Test Results Screen
The results of the distortion measurement are listed in the
tab (figure 9-3), with each harmonic's level in dB and the
total harmonic distortion in percent. Frequencies which are
out of tolerance will be indicated by a large red X.
A failed frequency may be retested after adjustment by highlighting it and pressing the AUDit™ button. Follow the
same procedure to test the remaining transducers.
9-4
AUDIOMETER CALIBRATION SYSTEM USER MANUAL
February 7, 2000
C H A PT E R
10
Pulse Test
In some audiometry cases, the presentation of pulsed tones
is preferred. The Larson Davis audiometer calibration system performs accurate pulse measurements of the pure tone
signal source by using digital signal processing techniques.
Requirements for the envelope of pulsed pure tone signals
are listed in section 7.5.4 of ANSI S3.6-1996. The relevant
parameters for the automatically pulsed tones are defined
below:
•
Frequency: fundamental rate of change of the pure
tone signal in hertz
•
Rise Time: time in milliseconds between the -20 dB
point (referred to the maximum level) and -1 dB point on
the rising edge of the pulsed signal envelope, nominally
between 20 and 50 ms
•
Fall Time:
time in milliseconds between the -1 dB
point and -20 dB point on the falling edge of the pulsed
signal envelope, nominally between 20 and 50 ms
•
On Time:
time in milliseconds between successive 5 dB points of the envelope of the pulsed signal during
which the signal is present, nominally between 190 and
260 ms
•
Off Time:
time in milliseconds between successive 5 dB points of the envelope of the pulsed signal during
which the signal is absent, nominally between 190 and
260 ms
•
Width:
duration in milliseconds of the plateau
during which the signal is within -1 dB of its nominal
value
•
On/Off Ratio: ratio of the maximum level during the
"OFF" portion of the pulse between the -20 dB point of
the falling and rising edge of the envelope to the maximum level in the "ON" portion, nominally greater than
20 dB
Pulse signal envelope characteristics are measured at a nominal frequency of 1000 Hz in AUDit™. However, the mea-
February 7, 2000
Pulse Test
10-1
surement may be made with another available pure tone
frequency.
Pulse Measurement Screen
Figure 10-1 Pulse Test measurement Screen
To perform a pulse test from the main audiometer test status
screen, highlight the Pulse test with the pointer and press the
Go To Measurement button. If you are already in a test
screen, press the same test in the Measurements window.
Note that the SLM should be calibrated before a measurement is performed. On the left, below the measurement table
(figure 10-1), the Transducers list contains supra-aural,
insert and circumaural earphones. All earphones types have
only one tab: Left/Right. In this example, the supra-aural
earphone transducers will be calibrated. The procedure is the
same for all other listed transducers.
10-2
AUDIOMETER CALIBRATION SYSTEM USER MANUAL
February 7, 2000
Highlight the Supra-aural Earphone transducer list item.
The Supra-aural Earphone tab will appear on the right part
of the screen. The test is nominally performed on the left
earphone.
The row of buttons at the bottom of the screen allows the
technician to:
•
Measure All - measure the pulse characteristics with
software prompts
•
Measure Selected - measure only the currently highlighted test with software prompts
•
Next Test - move to the next measurement in the Measurements list in the upper left window
•
OK - end the current test
•
Cancel - cancel the current test
Press Measure All or highlight the first line and press Measure Selected to perform a pulse test on the left earphone.
AUDit™ then displays the prompt shown in figure 10-2:
NOTE: The On/Off Time limits in section 7.5.4 of ANSI S3.6-1996 are based
on a 2 kHz pulse rate. If the audiometer
being tested is using a different pulse
rate, then the pulse on/off time measurements will likely fail.If the on/off time is
the only part of the pulse test that fails, a
note can be added to the certification
paragraph stating that the audiometer is
in compliance, with the exception of the
on/off times. (See Ch 17 for instructions
on modifying the certification paragraph.)
February 7, 2000
Figure 10-2 Level and Frequency Set Dialog Box
Set the appropriate pulsed level and frequency then press
OK. You may observe an overload on the sound level meter,
in which case the level should be reduced until the overload
disappears.
The results of the pulse measurement are listed in the tab
(figure 10-1), in milliseconds. Values which are out of tolerance will be in parentheses, and the failed test is indicated by
a large red X. Follow the same procedure to test the remaining transducers.
Pulse Test
10-3
10-4
AUDIOMETER CALIBRATION SYSTEM USER MANUAL
February 7, 2000
C H A PT E R
11
Cross Talk Test
Cross talk measurements performed by the AUDit™ audiometer calibration system are implemented at a chosen frequency for both earphones. Crosstalk is defined as an
unwanted acoustic signal present on the channel which is not
active. AUDit™ evaluates the difference between the level
of the driven test earphone and the non-driven earphone (see
ANSI S3.6-1996 section 5.4.2.1 item (2)).
Another test performed simultaneously in this portion of the
software is the audiometer on/off ratio. This test verifies that
the output from the left earphone when the tone switch is in
the "OFF" position is no more than 10 dB above the reference equivalent threshold of the appropriate frequency in
this case where the hearing level control is set at 80 dBHL
(see ANSI S3.6-1996 section 7.5.2).
February 11, 2000
Cross Talk Test
11-1
Crosstalk Measurement Screen
Figure 11-1 Cross Talk Measurement Screen
To perform a cross talk test from the main audiometer test
status screen, highlight the Cross Talk test with the pointer
and press the Go To Measurement button. If you are
already in a test screen, press the same test in the Measurements window. Note that the SLM should be calibrated
before a measurement is performed. On the left, below the
measurement table (figure 11-1), the Transducers list contains supra-aural, insert and circumaural earphones. In this
example, the supra-aural earphone transducers will be
tested. The procedure is the same for all transducers.
Highlight the Supra-aural Earphone transducer list item.
The Supra-aural Earphone Cross Talk tab will appear on the
right part of the screen.
11-2
AUDIOMETER CALIBRATION SYSTEM USER MANUAL
February 11, 2000
The row of buttons at the bottom of the screen allows the
technician to:
•
Measure All - perform cross talk test on both earphones
and on/off ratio on the left earphone sequentially with
software prompts
•
Measure Selected - perform only the currently highlighted test with software prompts
•
Next Test - move to the next measurement in the Measurements list in the upper left window
•
OK - end the current test
•
Cancel - cancel the current test
As with all measurements performed with the tone "OFF",
external vibration or noise may affect the reading. The coupler and sound level meter must be on stable surfaces, preferably cushioned from room vibration. You may observe the
display on the sound level meter to verify that the level is
near the noise floor. Press Measure All to begin the cross
talk test. AUDit™ displays the prompt shown in figure 11-2:
Figure 11-2 Set Level and Frequency Set Dialog Box
Set the appropriate level and frequency, making sure the left
earphone is on the coupler and the tone is "OFF", then press
OK. There may be a delay while the measurement system
acquires a stable reading. AUDit™ should then display the
prompt in figure 11-3:
February 11, 2000
Cross Talk Test
11-3
Figure 11-3 Earphone on Coupler Dialog Box
Present the appropriate tone on the left earphone. Once the
measurement has been performed, the prompt in figure 11-4
will appear:
Figure 11-4 Earphones Cross Talk Test Dialog Box
Leave the left earphone on the coupler but present the tone
on the right earphone, ensuring that it is occluded and far
enough away from the coupler to prevent acoustic pickup.
Figure 11-5 contains the next prompt.
Figure 11-5 Right Earphone on Coupler Dialog Box
Replace the left earphone on the coupler with the right earphone. The right earphone should still be driven with the
11-4
AUDIOMETER CALIBRATION SYSTEM USER MANUAL
February 11, 2000
tone. The level will once again be measured. Once this is
done, the last prompt, figure 11-6, is displayed:
Figure 11-6 Cross Talk Test, Right Earphone on Coupler
Dialog Box
Leave the right earphone on the coupler but present the tone
on the left earphone, again ensuring that it is occluded and
far enough away from the coupler to prevent acoustic cross
talk.
February 11, 2000
Cross Talk Test
11-5
Figure 11-7 Cross Talk Test Results Screen
This ends the Cross Talk test. The measurements and results
are displayed in the tab (Figure 11-7). For example, the first
line indicates that the level with presentation in the test right
earphone is 87.2 dB SPL while the level measured at the
right earphone with presentation on the non-test earphone is
13.2 dB SPL. The difference of 74.0 dB is 4.0 dB greater
than the specification of equal or better than 70 dB.
A subtest which is out of tolerance will be indicated by a
large red X. A failed subtest may be repeated by highlighting
it and pressing the Measure Selected button. Follow the
same procedure to test any remaining transducers.
11-6
AUDIOMETER CALIBRATION SYSTEM USER MANUAL
February 11, 2000
C H A PT E R
12
Frequency Modulation Test
This chapter describes the Frequency Modulation Test
which verifies various parameters of the frequency modulated signals available on some audiometers. The Larson
Davis audiometer calibration system performs accurate FM
measurements of the pure tone signal source by using accurate period measurement techniques. The permissible values
for this test are listed in section 6.1.3 of ANSI S3.6-1996.
Frequency modulation parameters are measured for the
available audiometer frequencies.
Frequency Modulation Measurement Screen
Figure 12-1 Frequency Modulation Test Screen
February 11, 2000
Frequency Modulation Test
12-1
To perform a frequency modulation test from the main audiometer test status screen, highlight the Freq. Modulation
test with the pointer and press the Go To Measurement
button. If you are already in a test screen, press the same test
in the Measurements table in the upper left corner. Note that
the SLM should be calibrated before a measurement is performed. On the left, (figure 12-1) below the measurement
table, the Transducers list contains supra-aural, insert and
circumaural earphones. All earphones types have two tabs:
Left and Right. In this example, the supra-aural earphone
transducers will be calibrated. The procedure is the same for
all transducers.
Highlight the Supra-aural Earphone transducer list item.
The Frequency Modulation tabs will appear on the right part
of the screen. One may select which earphone to test by
pressing on the Left or Right tab.
The row of buttons at the bottom of the screen allows the
technician to:
•
Measure All - measure all frequencies sequentially with
software prompts
•
Measure Selected - measure only the currently highlighted output frequency with software prompts
•
Next Test - move to the next measurement in the Measurements list in the upper left window
•
OK - end the current test
•
Cancel - cancel the current test
Press Measure All to perform a frequency modulation test
on the left earphone. AUDit™ then displays the prompt
shown in figure 12-2 to measure the first frequency:
12-2
AUDIOMETER CALIBRATION SYSTEM USER MANUAL
February 11, 2000
Figure 12-2 Set Level and Frequency Dialog Box
Set the appropriate FM stimulus level and frequency then
press OK. There may be a delay while the measurement system acquires an average reading (figure 12-3).
Figure 12-3 Noise or Variation Message Window
The presence of noise, variations in the readings or other
problems may prompt the display shown in figure 12-4:
Figure 12-4 Unable to get Reading Message Window
It may be useful to observe the sound level meter display
and change output level as needed. If the software is unable
to retrieve an acceptable measurement, the frequency will be
February 11, 2000
Frequency Modulation Test
12-3
skipped. Each frequency is tested consecutively in the same
manner.
Figure 12-5 Frequency Modulation Results Screen
The results of the frequency modulation measurement are
listed for each frequency in the tab (figure 12-5). The values
are, in order:
12-4
•
Dial Freq.:
quency
selected audiometric presentation fre-
•
Carrier Freq.: measured carrier frequency of the modulated signal
•
ANSI Limits: allowed range within 3% of the nominal
frequency
•
Min:
minimum frequency of the FM signal
•
Max:
maximum frequency of the FM signal
•
Rep. Rate:
rate at which the FM signal is modulated
in hertz (must be within 4 to 20 Hz and within 10% of the
value stated in the audiometer setup screen)
AUDIOMETER CALIBRATION SYSTEM USER MANUAL
February 11, 2000
•
Deviation: the difference between minimum and maximum expressed in percent of the carrier frequency. It
must be within 5 to 25% and within 10% of the value
stated in the audiometer setup screen
Any value which is out of tolerance is displayed within
parentheses. Frequencies out of tolerance are indicated by a
large red X.
A failed frequency may be retested after adjustment by highlighting it and pressing the Measure Selected button. Follow
the same procedure to test the remaining transducers.
February 11, 2000
Frequency Modulation Test
12-5
12-6
AUDIOMETER CALIBRATION SYSTEM USER MANUAL
February 11, 2000
C H A PT E R
13
Narrow Band Level Test
The Narrow Band Level Test is very similar to the Hearing
Level test covered earlier. Narrow band noise is available in
certain audiometers for masking and stimulus purposes. The
Larson Davis audiometer calibration system performs the
narrow band level measurements using real-time third
octave filter analysis. Specifications regarding the masking
sound level controls are enumerated in section 7 of ANSI
S3.6-1996. Various requirements include the accuracy of the
masking sound level, which we test here. Maximum permissible deviation from the indicated value is 3 dB below to 5
dB above the indicated level (see section 7.4.2 of the standard).
Narrow Band Level Measurement Screen
To perform a narrow band level test from the main audiometer test status screen, highlight the Narrow Band Level test
with the pointer and press the Go To Measurement button. If you are already in a test screen, press the same test in
the Measurements table in the upper left corner. Note that
the SLM should be calibrated before a measurement is performed. On the left, below the measurement table, the Transducers list contains supra-aural, insert and circumaural
earphones as well as speakers.
Narrow Band Level Test with Earphone Transducers
All earphone transducer types have four tabs in the large test
window (figure 13-1) at the right: Low and High Freq. Input
Levels, Left and Right. On the other hand, the speakers
option has five tabs. In this section, the supra-aural earphone
February 11, 2000
Narrow Band Level Test
13-1
transducers will be calibrated. The procedure is the same for
insert and circumaural earphones.
Figure 13-1 Narrow Band Level measurement Screen
To perform a test of the supra-aural earphones, highlight the
Supra-aural Earphone transducer list item. The four Supraaural Earphone Narrow Band Level tabs will appear on the
right part of the screen. Default low and high frequency
input levels are typically set to 70 dB HL on each tab. Each
value may be changed by highlighting it and entering a new
value. Use the pointer or the TAB key to move to another
frequency. The levels are set to 70 dB HL for all frequencies
by default.
Once the input levels have been verified, you may select
which earphone to test by pressing on the Left or Right tab.
13-2
AUDIOMETER CALIBRATION SYSTEM USER MANUAL
February 11, 2000
Figure 13-2 Active Frequencies List
The list of the active frequencies selected earlier in the audiometer setup appears in the right window (figure 13-2). Note
the headers at the top of the table. The measured SPL value
from the sound level meter is converted to hearing level, and
the deviation from the target SPL is displayed along with the
permissible target SPL range.
The row of buttons at the bottom of the screen allows the
technician to:
February 11, 2000
•
Measure All - measure all frequencies sequentially with
software prompts
•
Measure Selected - measure only the currently highlighted frequency with software prompts
•
Next Test - move to the next measurement in the Measurements list in the upper left window.
•
OK - end the current test
•
Cancel - cancel the current test
Narrow Band Level Test
13-3
Press Measure All to perform a narrow band level test on
the current earphone. AUDit™ then displays the prompt
shown in figure 13-3 for the first frequency:
Figure 13-3 Level and Frequency Set Dialog Box
Set the appropriate narrow band level and frequency then
press OK. Each frequency will be tested consecutively until
all have been measured. This can be done very quickly by
pressing the audiometer frequency increment button and
then immediately pressing the Enter (OK) key on the computer.
Figure 13-4 Narrow Band Level Test Results Screen
13-4
AUDIOMETER CALIBRATION SYSTEM USER MANUAL
February 11, 2000
In the above example (figure 13-4), all frequencies passed.
Errors would be indicated by a large red X next to the frequency. After adjustment, any failed frequency may be
retested with the Measure Selected button.
Narrow Band Level Test with Speakers
Figure 13-5 Narrow Band Test With Speakers Screen
Sound field audiometric testing using speakers may be performed in a variety of ways. Table 9, ANSI S3.6-1996 lists
reference equivalent threshold sound pressure levels
(RETSPL) for binaural listening in free field at 0 degree
incidence, as well as monaural listening in sound field for 0,
45 and 90 degree incidence. These RETSPLs are used in
AUDit™ to translate the measured sound pressure levels to
hearing level. Note that the prescriptions in section 9.5.1 of
the standard for sound field characteristics should be folFebruary 11, 2000
Narrow Band Level Test
13-5
lowed. These include the requirement that the ambient noise
in the sound field shall not exceed that specified in ANSI
S3.1-1991. The ambient noise booth test in AUDit™ is helpful in making this determination.
To perform a test using speakers, highlight the Speakers
transducer list item. The Narrow Band Level screen (figure
13-5) for the speakers transducers has five tabs: Low and
High Freq. Input Levels, Left, Right and Binaural. In the
first two tabs, the speaker test levels can be specified for
audiometric frequencies from 125 to 20000 Hertz. Use the
pointer or TAB key to move from one frequency to another
and enter the desired test level.
The remaining tabs select the speaker(s) to be tested: left,
right or both (binaural). In this example, the Left tab is
selected. The incidence angle of 0, 45 or 90 degrees must be
selected so that the appropriate RETSPL correction is
applied. Note the headers at the top of the table. The measured SPL value from the sound level meter is converted to
hearing level, and the deviation from the target SPL is displayed. The Right tab operates in the same manner. The Binaural tab has only one incidence angle selection, zero
degrees.
The row of buttons at the bottom of the screen allows the
technician to:
•
Measure All - measure all frequencies sequentially with
software prompts
•
Measure Selected - measure only the currently highlighted frequency with software prompts
•
Next Test - move to the next measurement in the Measurements list in the upper left window
•
OK - end the current test
•
Cancel - cancel the current test
Press Measure All to perform a narrow band level test
using the speakers. Since narrow band modulation is
required for this test, you will also be prompted to select a
NB test signal (Figure 13-6).
13-6
AUDIOMETER CALIBRATION SYSTEM USER MANUAL
February 11, 2000
Figure 13-6 Set Level and Frequency Dialog Box
Set the appropriate level and frequency then press OK. Each
frequency will be tested consecutively until all have been
measured. This test can also be performed rapidly by pressing the audiometer frequency increment button and then
immediately pressing the Enter (OK) key on the computer.
February 11, 2000
Narrow Band Level Test
13-7
13-8
AUDIOMETER CALIBRATION SYSTEM USER MANUAL
February 11, 2000
C H A PT E R
14
Broad Band Noise Masking Test
The Larson Davis audiometer calibration system performs
accurate broad band ("white") noise masking measurements
using narrow band fast fourier transform (FFT) analysis. The
requirements of ANSI S3.6-1996 are listed in section 6.3.2.
A minimum sound pressure spectrum flatness of within 5 dB
of the level at 1000 Hz is required. The measurement is performed with an appropriate coupler.
Broad Band Masking Measurement Screen
Figure 14-1 Audiometer Measurement Status Screen
February 11, 2000
Broad Band Noise Masking Test
14-1
To perform a broad band noise test from the main audiometer test status screen, highlight the Broad Band Noise test
with the pointer and press the Go To Measurement button
(figure 14-1). If you are already in a test screen, press the
same test in the Measurements window. Note that the SLM
should be calibrated before a measurement is performed.
Figure 14-2 Broad Band Masking Measurement Screen
On the left, below the measurement table (figure 14-2), the
Transducers list contains supra-aural, insert and circumaural
earphones. All earphones types have two tabs: Left and
Right. In this example, the supra-aural earphone transducers
will be calibrated. The procedure is the same for all listed
transducers.
Highlight the Supra-aural Earphone transducer list item.
The Supra-aural Earphone tabs will appear on the right part
14-2
AUDIOMETER CALIBRATION SYSTEM USER MANUAL
February 11, 2000
of the screen. One may select which earphone to test by
pressing on the Left or Right tab.
The row of buttons at the bottom of the screen allows the
technician to:
•
Measure All - perform this test with software prompts
•
Next Test - move to the next measurement in the Measurements list in the upper left window
•
OK - end the current test
•
Cancel - cancel the current test
In the HL Dial Setting enter the Hearing Level Dial Setting
that you will use for the measurement. Press Measure All
to perform a broad band masking test on the left earphone.
AUDit™ then displays the prompt shown in figure 14-3:
Figure 14-3 Set Level and Frequency Dialog Box
Set the appropriate level and frequency with white noise
stimulus and then press OK.
February 11, 2000
Broad Band Noise Masking Test
14-3
Figure 14-4 Broad Band Noise Results Screen
The results of the broad band noise measurement are listed
in the tabs for each earphone (Figure 14-4). Tests which are
out of tolerance will be indicated by a large red X.
A failed earphone may be retested after adjustment by
selecting it and pressing the Measure All button. Follow
the same procedure to test the remaining transducers.
14-4
AUDIOMETER CALIBRATION SYSTEM USER MANUAL
February 11, 2000
C H A PT E R
15
Speech Test
This test verifies the calibration of audiometers which offer
the facility for playback of standardized prepared speech
signals. Speech signals may be provided from a microphone,
tape or compact disc recording input electrically to the audiometer. AUDit™ performs level tests on microphone, tape/
CD inputs A and B, as well as internally generated speech
noise signals.
Speech Measurement Screen
Figure 15-1 Audiometer Measurement Status Screen
February 11, 2000
Speech Test
15-1
To perform a speech test from the main audiometer test summary screen, highlight Speech Test with the pointer and
press the Go To Measurement button. If you are already
in a test screen (figure 15-1), press the same test in the Measurements window. Note that the SLM should be calibrated
before a measurement is performed. The Speech test can be
performed with supra-aural and insert earphones, as well as
with the bone vibrator and speakers. Appropriate corrections
are applied within each test using microphone, coupler and
standard adjustments.
Figure 15-2 Speech Test Transducers Screen
On the left below the Measurements table (figure 15-2) you
will find the list of transducers for which the audiometer
speech facilities may be tested. The large box at the right has
multiple tabs and varies with each transducer. For example,
all earphones types have two tabs: Left and Right. On the
other hand, the bone vibrator has only one tab: Bone Vibra15-2
AUDIOMETER CALIBRATION SYSTEM USER MANUAL
February 11, 2000
tor. The speakers transducer test has three tabs: Left, Right
and Binaural. All tests within one tab are performed with a
certain HL dial setting which is displayed at the upper right
of the screen.
Speech Test with Earphone Transducers
In this section, the supra-aural earphone transducers will be
calibrated. The procedure is the same for insert earphones
and is very similar for the other transducers.
To perform a test of the supra-aural earphones, highlight the
Supra-aural Earphone transducer list item. The two Supraaural Earphone Hearing Level tabs will appear on the right
part of the screen. One may select which earphone to test by
pressing on the Left or Right tab.
The list of the available tests appears in the right window:
NOTE: The headers at the top of the
table. The measured SPL value from the
sound level meter is converted to hearing
level, and the deviation from the target
SPL is displayed.
February 11, 2000
•
Mic:
Audiometer microphone source selection
•
Tape/CD A: Audiometer recorded tape or compact
disc direct electrical source selection A
•
Tape/CD B: Audiometer recorded tape or compact
disc direct electrical source selection B
•
Speech Noise: Speech noise source selection
The desired test hearing level is selected at the upper right of
the tab, in the HL Dial Setting field.
The row of buttons at the bottom of the screen allows the
technician to:
•
Adjust - adjust the audiometer in real-time if a precision
output level adjustment is available
•
Measure All - measure all subtests sequentially with software prompts
•
Measure Selected - measure only the currently highlighted subtest with software prompts
•
Next Test - move to the next measurement in the Measurements list in the upper left window
•
OK - end the current test
Speech Test
15-3
•
Cancel - cancel the current test
Mic Test
Press Measure All to perform a complete speech level test
on the left earphone, or highlight the Mic line and press
Measure Selected. AUDit™ then displays the prompt
shown in figure 15-3:
Figure 15-3 Set Level and Frequency Dialog Box
The speech material calibration signal should be provided at
the microphone input. Set the appropriate level, input and
presentation on the audiometer then press OK. The measured SPL is corrected for coupler, microphone and other
responses and should be 12.5 dB above the 1000 Hz
RETSPL for the transducer in use (See ANSI S3.6-1996 section 6.2.12.). Target SPL is determined from ANSI S3.6 section 7.2 on the accuracy of sound pressure levels. An
unsatisfactory reading is indicated by a large red X.
It may be necessary to adjust the level by pressing the Adjust
button.
Figure 15-4 Current Level Readings Screen
15-4
AUDIOMETER CALIBRATION SYSTEM USER MANUAL
February 11, 2000
A small dialog box appears (figure 15-4) which shows the
current SPL and HL readings which the technician may
adjust to bring the level within the listed target SPL range.
The adjustment does not affect the test result performed
before.
To verify the adjustment, the input may be retested with the
Measure Selected button.
Tape/CD A and Tape/CD B Test
To perform a speech level test on the left earphone Tape/CD
A or B inputs, highlight the appropriate subtest and press
Measure Selected. AUDit™ then displays the prompt
shown in figure 15-5:
Figure 15-5 Set Tape Level and Frequency Dialog Box
The speech material calibration signal should be provided to
the appropriate input. Set the listed level, input and presentation on the audiometer then press OK. The measured SPL is
corrected for coupler, microphone and other responses and
should be 12.5 dB above the 1000 Hz RETSPL for the transducer in use. (See ANSI S3.6-1996 section 6.2.12.) Target
SPL is determined from ANSI S3.6 section 7.2 on the accuracy of sound pressure levels. An unsatisfactory reading is
indicated by a large red X.
It may be necessary to adjust the level by pressing the Adjust
button.
February 11, 2000
Speech Test
15-5
Figure 15-6 Current Level Readings Screen
A small dialog box appears (figure 15-6) showing the current SPL and HL readings which one can adjust to bring the
level within the listed target SPL range.
Once this is done, the input may be retested with the Measure Selected button.
15-6
AUDIOMETER CALIBRATION SYSTEM USER MANUAL
February 11, 2000
Speech Noise Test
To perform a speech noise level test on the left earphone,
highlight the last subtest and press Measure Selected.
AUDit™ then displays the prompt shown in figure 15-7:
Figure 15-7 Speech Noise Level Set Dialog Box
The speech material calibration signal should be provided to
the appropriate input. Set the listed level, input and presentation on the audiometer and press OK. The measured SPL is
corrected for coupler, microphone and other responses. An
unsatisfactory reading is indicated by a large red X.
It may be necessary to adjust the level by pressing the Adjust
button.
Figure 15-8 Current Level Readings Screen
A small dialog box appears (figure 15-8) which shows the
current SPL and HL readings which one can adjust to bring
the level within the listed target SPL range.
Once this is done, the input may be retested with the Measure Selected button.
February 11, 2000
Speech Test
15-7
Speech Test with Bone Vibrator
Figure 15-9 Bone Vibrator Test Screen
To perform a test of the bone vibrator transducer, highlight
the Bone Vibrator transducer list item. The Speech screen
for the bone vibrator transducer has a single tab: Bone
Vibrator (figure 15-9). It displays calibration results similar
to the earphones tab, but contains a selection item for the
placement of the vibrator: mastoid or forehead. The default
output level is also present at the upper right hand side. Note
the headers at the top of the table. The measured SPL value
from the sound level meter is converted to hearing level, and
the deviation from the target SPL is displayed.
The functions of the row of buttons at the bottom of the
screen are the same as in the earphones speech test described
earlier.
Press Measure All to perform all speech tests on the bone
vibrator. If you are using a Larson Davis Mastoid, you will
be prompted to enter temperature and humidity values used
15-8
AUDIOMETER CALIBRATION SYSTEM USER MANUAL
February 11, 2000
within the software for artificial mastoid corrections (figure
15-10).
Figure 15-10 Temperature and Humidity Entry Box
Enter the humidity range, dry, normal, moist or tropical, as
well as the temperature in degrees centigrade
Hint: (degrees C = (degrees F - 32) x 5 / 9).
Otherwise, the bone vibrator tests are similar to the earphone
speech tests. An unsatisfactory reading is indicated by a
large red X, with values within parentheses.
February 11, 2000
Speech Test
15-9
Speech Test with Speakers
Figure 15-11 Speaker Test Screen
Sound field audiometric testing using speakers may be performed in a variety of ways. In table 9, ANSI S3.6-1996 lists
reference equivalent threshold sound pressure levels
(RETSPL) for binaural listening in free field at 0 degree
incidence, as well as monaural listening in sound field for 0,
45 and 90 degree incidence. These RETSPLs are used in
AUDit™ to translate the measured sound pressure levels to
hearing level. Note that the prescriptions in section 9.5.1 of
the standard for sound field characteristics should be followed. These include the requirement that the ambient noise
in the sound field shall not exceed that specified in ANSI
S3.1-1991. The ambient noise booth test in AUDit™ is helpful in making this determination.
To perform a test using speakers, highlight the Speakers
transducer list item. The Speech measurement screen for the
speakers transducers has three tabs: Left, Right and Binaural
(figure 15-11). These tabs select the speaker(s) to be tested:
15-10
AUDIOMETER CALIBRATION SYSTEM USER MANUAL
February 11, 2000
left, right or both (binaural). In this example, the Left tab is
selected. An incidence angle of 0, 45 or 90 degrees must be
chosen so that the appropriate RETSPL correction is
applied. Note the headers at the top of the table. The measured SPL value from the sound level meter is converted to
hearing level, and the deviation from the target SPL is displayed. The Right tab operates in exactly the same manner.
The Binaural tab has only one incidence angle selection,
zero degrees.
The functions of the row of buttons at the bottom of the
screen are the same as in the earphones speech test described
above.
Press Measure All to perform all speech tests on the
selected speaker(s). They are similar to the earphone speech
tests. An unsatisfactory reading is indicated by a large red X,
with values within parentheses.
February 11, 2000
Speech Test
15-11
15-12
AUDIOMETER CALIBRATION SYSTEM USER MANUAL
February 11, 2000
C H A PT E R
16
Audiometer Test Notes
Before and during the calibration of an audiometer, a visual
inspection of its components and control is necessary.
AUDit™'s Audiometer Test Notes screen (figure 16-1)
affords a simple way to annotate the test report with comments and the condition of components or controls.
Figure 16-1 Audiometer Test Notes Menu item
The Audiometer Test Notes screen is accessed from the
main menu by pressing the Test, Audiometer Test Notes...
selection.
February 11, 2000
Audiometer Test Notes
16-1
Audiometer Test Notes Screen
This screen has two tabs, Visual Check and Comments. A
thorough visual and functional inspection of the audiometer
and its accessories can be conducted with the help of the
checklist in the first tab (Figure 16-2).
Visual Check Tab
Figure 16-2 Audiometer Test Notes Visual Check Tab
This tab enumerates many components, accessories and controls of the audiometer. Some list items have properties
which are governed by specifications in the ANSI S3.6-1996
standard. Any non-conforming or defective item should be
checked by clicking the pointer on the box to the left of the
item. These items will appear in the test report and will be
stored in the database.
16-2
AUDIOMETER CALIBRATION SYSTEM USER MANUAL
February 11, 2000
Comments Tab
The second tab allows the calibration technician to note any
particularities of the tested system. Click in the rectangular
entry field and enter your comments. Use the arrows or
pointer to scroll within the entry field. Standard Windows™
edit commands are available. These comments also will
appear in the test report and will be stored in the database.
February 11, 2000
Audiometer Test Notes
16-3
16-4
AUDIOMETER CALIBRATION SYSTEM USER MANUAL
February 11, 2000
C H A PT E R
17
Reports and Data Base
Functions
AUDit™ incorporates a number of features which help
maintain a record of audiometer calibrations. Tests performed can be printed immediately or stored for future hard
copy. Results may be kept in an indexed database with comprehensive search capabilities, or exported to your external
application in formatted output. This chapter will further
describe these functions of the AUDit™ software.
Printing a Report
A printed report of a specific test may be output to a printer
for archival or customer use. Both audiometer calibrations
and booth measurements can be printed. An audiometer test
can be printed in its entirety or only a subset of the measurements can be output.
To begin printing, a recent or recalled test must be active on
the AUDit™ main screen. To recall a previous test, follow
the procedures outlined later in this chapter. Once an
AUDit™ test is active, click on Report, Report... on the
main menu (figure 17-1).
February 11, 2000
Reports and Data Base Functions
17-1
Figure 17-1 Main Menu Report Pull Down Menu
If the active measurement is an audiometer measurement,
the dialog box shown in figure 17-2 will appear:
17-2
AUDIOMETER CALIBRATION SYSTEM USER MANUAL
February 11, 2000
Figure 17-2 Measurement Report Select Box
Click on the desired subset of measurements. Press on
Select All to enable printout of all test data, or Clear All to
disable all tests. OK accepts the currently enabled selections
and Cancel aborts the report.
Once you have selected OK, the report preview screen displays the selected data approximately as it will appear on the
printed page (Figure 17-3). The paper size and orientation
are those selected in the File, Printer Setup... main menu
item.
February 11, 2000
Reports and Data Base Functions
17-3
Figure 17-3 Print Preview Screen
Note that the cursor now has the shape of a small magnifying glass, and may be used to zoom in on portions of the
page. The menu bar at the top of the screen (figure 17-4) has
the following functions:
Figure 17-4 Print Preview Tool Bar
17-4
•
Print:
dialog box
click or press Alt + p to go to the Print
•
Next Page:
page
click or press Alt + n to advance one
AUDIOMETER CALIBRATION SYSTEM USER MANUAL
February 11, 2000
•
Previous Page:
page
click or press Alt + v to go back one
•
Two Page:
at once
click or press Alt + t to view two pages
•
Zoom In:
click or press Alt + i to zoom in
•
Zoom Out:
click or press Alt + o to zoom out
•
Close
preview screen
click or press Alt + c to exit the print
Using the zoom, the information is visible on screen (figure
17-5).
Figure 17-5 Sample Report, Zoomed in
For example, this report lists calibration date, technician,
customer, the audiometer and accessories tested, etc. It is not
February 11, 2000
Reports and Data Base Functions
17-5
possible to edit information directly in the print preview
screen.
To print the report from the preview, simply click Print... or
press Alt + p to go to the Print dialog box.
Figure 17-6 Print Dialog Box
This standard printing dialog box (figure 17-6) allows the
selection of printer and properties, print range, as well as
number of copies. After proper selection of printing options,
press OK to print or Cancel to exit without printing the
report.
Printing a booth test report is very similar, except that there
is no Select Data for Report dialog box. All booth test data is
printed.
Sample reports are appended at the end of this manual.
Printing a Certificate
It is often desirable to provide a customer with a single page
certificate after performing an audiometer calibration or
booth test service. AUDit™ features certificate printing,
including a custom header and a paragraph which can be
used for standard or test specific text. The certificate
17-6
AUDIOMETER CALIBRATION SYSTEM USER MANUAL
February 11, 2000
includes the date on which the test was performed as well as
the print-out date.
To print a certificate, ensure a new or recalled test is active,
then select Report, Certificate... on the main menu bar
(Figure 17-7).
Figure 17-7 Main Menu, Certificate Pull Down Menu item
The Certification Paragraph dialog box is then displayed.
The features of the certification paragraph are explained
fully in the next section.
Certification Paragraph Dialog
The certification paragraph is a small unformatted text file
which may contain any text you wish to have appear on the
certificate. The Certification Paragraph dialog box allows
the retrieval and modification of a previously saved paragraph as well as the creation of a new paragraph. In the
example in figure 17-8, the paragraph includes the calibration entity name and text referring to the standard. Other
comments may be included, such as calibration status of the
equipment used to calibrate the audiometer.
February 11, 2000
Reports and Data Base Functions
17-7
Figure 17-8 Certification Paragraph Dialog Box
Creating or Editing a Certification Paragraph
To create a new certification paragraph or edit the current
paragraph, click on Edit. You may then position the cursor in
the large rectangle (figure 17-8) and start editing the text.
Standard numeric and alphabetical characters are allowed,
but no formatting is saved. Press Enter to insert a line feed at
the end of each line near the right edge of the input rectangle
to limit lines to a printable length.
Once you are done editing, save the paragraph under the
same name by clicking on Save, or change file name or
17-8
AUDIOMETER CALIBRATION SYSTEM USER MANUAL
February 11, 2000
location by clicking on Save As.... Certification paragraphs
can only be stored with the .acp extension. Press Cancel to
abort any changes, or OK to accept and exit to the Certificate Preview Screen.
Browsing for a Certification Paragraph
To find a previously saved paragraph, click on the
Browse... key.
Figure 17-9 Search for Certification Dialog Browse Box
Calibration paragraph files ending in the .acp extension will
be displayed for the current directory (figure 17-9). The
Open dialog box will allow you to locate a paragraph using
the standard interface. Locate the appropriate directory using
the pointer, then select a paragraph and click Open. The
selected paragraph will now be displayed in the Edit rectangle. You may then edit the paragraph, press Cancel to abort
any changes, or OK to accept and exit to the Certificate Preview Screen.
Certificate Preview Screen
After creating, recalling or editing a certification paragraph,
selecting OK will display the certificate preview.
February 11, 2000
Reports and Data Base Functions
17-9
Figure 17-10 Certificate Paragraph Print Preview
In this screen (figure 17-9), a representation of the certificate
of calibration is displayed. Note that the cursor now has the
shape of a small magnifying glass, and may be used to zoom
in on portions of the page. The menu bar at the top of the
screen has the following functions:
17-10
•
Print:
log box
click or press Alt + p to go to the Print dia-
•
Zoom In:
click or press Alt + i to zoom in
•
Zoom Out: click or press Alt + o to zoom out
•
Close:
click or press Alt + c to exit the certificate
preview screen
AUDIOMETER CALIBRATION SYSTEM USER MANUAL
February 11, 2000
Exporting Data
Audiometer and booth test data are maintained in a special
database by AUDit™. You may wish to export the results of
a certain test to another application for further manipulation.
This is possible with the Export function. To export test data,
ensure a new or recalled test is active, then select Report,
Export... on the main menu bar (Figure 17-10).
Figure 17-11 Export Data Main Menu Pull Down Menu
Hint: .csv files have a standard
comma separated format.
February 11, 2000
The Export Data dialog box (figure 17-12) will be displayed.
In this dialog, the file name of the exported file and the
application used to open it may be selected. If you wish to
export to a previously stored file name, the older file will be
replaced. Use the Browse to find a previous name and location. It is possible to browse for .csv, .txt and all files. However, files may only be stored with the .csv extension.
Reports and Data Base Functions
17-11
Figure 17-12 Export Data Dialog Box
As an example, an audiometer test file may be exported to
.csv format and then formatted with Microsoft Excel™ to
add graphs and tables for greater impact.
Figure 17-13 Data File Exported into Microsoft Excel™
17-12
AUDIOMETER CALIBRATION SYSTEM USER MANUAL
February 11, 2000
Stored Measurements Database Functions
The Larson Davis audiometer calibration system software
maintains all tests, audiometer and booth, in a database
which is compatible with state of the art database software.
This section will illustrate the use of the database to retrieve
booth and audiometer measurements.
To recall a stored measurement, click on the Test, Stored
Measurements item on the main menu bar (figure 17-14).
Figure 17-14 Test Pull Down Menu, Stored Measurements
items
The Stored Measurements dialog box will appear. This box
allows the search and display of tests which fulfill the search
requirements.
Audiometer Measurements
The audiometer measurements available in the current
AUDit™ database can be searched with the dialog box
shown in figure 17-15.
February 11, 2000
Reports and Data Base Functions
17-13
Figure 17-15 Search Database Dialog Box
Entry fields for technician, audiometer model, serial number, calibration from/to date and channel number can be
used to search for the proper test. When all fields are left
blank, all tests in the current database are displayed. To find
a certain test, enter a search criterion in a field. Alphabetical
characters are not case sensitive in the search, but otherwise
search entries must be spelled exactly as they appear in the
test. Spaces before or after an entry are disregarded. Dates
may be entered in the following formats: "Apr. 20, 1999" or
"04/20/99". The To Date must be equal to or later than the
From Date.
Click on Update List to display the search results. In the
example above, entering "spiro COchler" in the technician
field will display the second test on the list. Retrieve the test
17-14
AUDIOMETER CALIBRATION SYSTEM USER MANUAL
February 11, 2000
by highlighting it and then clicking on Retrieve at the bottom of the dialog box. Delete the highlighted test by clicking
on Delete. Deleted tests can not be recalled.
Booth Test Data
The booth measurements available in the current AUDit™
database can be searched with the dialog box shown in figure 17-16.
Figure 17-16 Search Booth Measurements Dialog Box
Entry fields for customer, booth name, calibration from/to
date and channel number can be used to search for the
proper test. When all fields are left blank, all tests in the current database are displayed. To find a certain test, enter a
February 11, 2000
Reports and Data Base Functions
17-15
search criterion in a field. Alphabetical characters are not
case sensitive in the search, but otherwise search entries
must be spelled exactly as they appear in the test. Spaces
before or after an entry are disregarded. Dates may be
entered in the following formats: "Apr. 20, 1999" or "04/20/
99". The To Date must be equal to or later than the From
Date.
Click on Update List to display the search results. Retrieve
the test by highlighting it and then clicking on Retrieve at
the bottom of the dialog box. Delete the highlighted test by
clicking on Delete. Deleted tests can not be recalled.
17-16
AUDIOMETER CALIBRATION SYSTEM USER MANUAL
February 11, 2000
C H A PT E R
18
824-AUD Firmware Overview
The System824 precision sound level meter with the 824AUD firmware option is the heart of the Larson-Davis audiometer calibration system. This instrument and its firmware
maintain and exceed the performance of previous Model
800B-based systems when used with the AUDit™ software.
However, the System824 with 824-AUD firmware alone
still possesses numerous analysis features useful for audiometer testing tasks such as:
•
level
•
frequency
•
linearity
•
total harmonic distortion
•
pulse measurements
•
crosstalk
•
frequency modulation
•
narrow band, broad band and speech noise
Some of these tests are slightly more tedious when performed manually. The following overview of the 824-AUD
should be augmented by reading the user manual provided
with your Model 824.
February 11, 2000
824-AUD Firmware Overview
18-1
Selecting the 824-AUD Operation Mode
To enable the 824 audiometer testing firmware option, turn
on the 824.
Figure 18-1 System 824 Start Screen
After the start screen is drawn, press S SETUP and use the
arrow keys (rl) to highlight the AUDTest.AUD setup.
(figure 18-1) If this setup does not appear, your 824 may not
have the 824-AUD firmware option.
Figure 18-2 AUD selection in setup menu of System 824
Press the check key c to retrieve the current setup and enter
the audiometer calibration mode. The SLM+RTA Live screen
will appear.
Figure 18-3 AUD SLM + RTA Live Screen
18-2
AUDIOMETER CALIBRATION SYSTEM USER MANUAL
February 11, 2000
The screen shown in figure 18-2 shows the third octave
spectrum. In this example, the measurement is reset and the
cursor is placed on the 1000Hz third octave frequency. At
this time, the instrument should be calibrated manually.
Please refer to the 824 manual for information on calibrating
the instrument.
SLM+RTA Mode
In the SLM+RTA mode, the 824 can be used for the following measurements:
•
frequency
•
linearity
•
crosstalk
This mode consists of two screens: the SLM+RTA Live
screen and the Any Level-a screen.
SLM+RTA Live screen
This is the default screen for the AUDTest.AUD setup. To
access it from another screen, press the VIEW key V , then
select the SLM/RTA with the up/down arrows ud and
press the check key c (figure 18-3).
Figure 18-4 SLM + RTA View Menu item
To measure the level in dB re 20 micropascals, place the cursor on the frequency of interest and read the frequency and
value on the left hand side of the screen (figure 18-4). Levels
must be corrected by using coupler/earphone RETSPLs and
microphone or other such corrections to arrive at the dB HL
value.
February 11, 2000
824-AUD Firmware Overview
18-3
Figure 18-5 SLM + RTA Live Screen
Linearity evaluation can easily be performed by placing the
cursor on the audiometric presentation frequency, then varying the hearing level output and monitoring the measured
level on the 824.
Similarly, cross talk measurements are performed with the
non-test earphone being measured, then comparing the test
earphone level to that measurement.
Any Level-a Screen
This screen is accessed by pressing the VIEW key, then
selecting the SLM/RTA with the up/down arrows and press
the check key c. Once in the SLM+RTA Live screen, press
the up or down arrow ud to display the Any Level-a
screen.
Figure 18-6 Any Level - a Screen
This screen displays the current overall Fast and Slow time
averaged sound pressure level reading without frequency
weighting (dB F for flat). This level will vary with the audiometer output, but also may vary due to signal components
other than the audiometric frequency. Therefore, linearity
measurements made with these levels will not be accurate at
lower levels.
18-4
AUDIOMETER CALIBRATION SYSTEM USER MANUAL
February 11, 2000
The frequency and period of the signal measured by the
sound level meter are also displayed at the bottom of the
screen. It may be necessary to increase the audiometer HL
output level for a more stable measurement.
FFT Mode
In the FFT mode, the 824 can be used for the following measurements:
•
harmonic distortion
•
narrow and broad band noise
This mode consists of a single screen: the FFT screen.
FFT Screen
To access the FFT screen from another screen, press the
VIEW key V, then select FFT with the up/down arrows
ud and press the check key c (figure 18-5).
Figure 18-7 FFT View Menu Item
This will display the FFT screen (figure 18-6).
Figure 18-8 FFT Screen
February 11, 2000
824-AUD Firmware Overview
18-5
The FFT measurement can be tailored with a number of
variables. To enter the menu where these are selected, press
the check key c.
You can now use the arrow and check keys to change the
FFT gain (-20 to +50 in 10 dB steps), bandwidth (200, 500,
1K, 2K, 5K, 10K, and 20K hertz), and window (Hanning or
rectangular).
To read a level in dB re 20 micropascals, place the cursor on
the frequency of interest and read the frequency and value
on the left hand side of the screen. In this mode, levels must
also be corrected by using coupler/earphone RETSPLs and
microphone or other such corrections to arrive at dB HL
value.
An example of the application of FFT measurement to total
harmonic distortion would be the selection of a 5000 kHz
bandwidth to measure the distortion of the 500 Hz audiometer signal. In this way, the first four harmonics will be available.
Figure 18-9 FFT Screen, 1500 Hz.
Figure 18-5 shows that the 1500 Hz third harmonic has a
level of 71.0 dB, which is 52 db below the fundamental at
500 Hz. Since the ANSI S3.6-1996 prescription states that
the third harmonic must be 2.0% or less than the fundamental at this frequency, this value is satisfactory (2/100 is -34
dB down).
Total harmonic distortion could be calculated from the distortion harmonics.
Noise measurements can also be performed in the FFT
mode, especially the narrowband noise frequency cut-offs
and the white noise flatness.
18-6
AUDIOMETER CALIBRATION SYSTEM USER MANUAL
February 11, 2000
Pulse/FM Mode
In the Pulse/FM mode, the 824 can be used for the following
measurements:
•
pulse measurements
•
frequency modulation measurements
This mode consists of two screens: the Pulse/FM-a and
Pulse/FM-b screens.
Pulse/FM-a Screen
To access the Pulse/FM-a screen from another screen, press
the VIEW key V, then select Pulse/FM with the up/down
arrows and press the check key c (figure 18-8).
Figure 18-10 Pulse/FM view menu item
This will display the Pulse/FM-a screen (Figure 18-9).
Figure 18-11 Pulse/FM-a Screen
This very simple shows all the required values for the calibration of the pulsed tone capabilities of an audiometer.
Present the pulsed tone at a proper level and press the RUN/
February 11, 2000
824-AUD Firmware Overview
18-7
STOP key s. The stability of the measurement can be evaluated visually. To retrieve data, press RUN/STOP again s
and read the values from the screen (figure 18-10).
Figure 18-12 Pulse/FM Screen with Values
The following values are displayed: rise time, fall time, on
time, off time, plateau duration all in milliseconds, as well as
overshoot in dB.
More information on the values and the process used by the
824 to measure these values may be found in the chapter on
Pulse Measurements and in the appendices.
Pulse/FM-b Screen
To access the Pulse/FM-b screen from another screen, press
the VIEW key V, then select Pulse/FM with the up/down
arrows and press the check key c.
Figure 18-13 Pulse/FM view menu item
This will display the Pulse/FM-a screen. Press the left or
right arrow lr to view the Pulse/FM-b screen (figure
18-12).
18-8
AUDIOMETER CALIBRATION SYSTEM USER MANUAL
February 11, 2000
Figure 18-14 Pulse/FM-b screen
This screen displays required values for the calibration of
the frequency modulated tone capabilities of an audiometer.
Present the frequency modulated tone at an appropriate level
and press the RUN/STOP key s. The stability of the measurement can be evaluated visually. To retrieve data, press
RUN/STOP s again and read the values from the screen
(figure 18-13).
Figure 18-15 Pulse/FM-b screen with values
The following values are displayed: carrier frequency, maximum frequency, minimum frequency, modulation rate, all in
hertz. More information on the values and the process used
by the 824 to measure these values may be found in the
chapter on Frequency Modulation Measurements and in the
appendices.
February 11, 2000
824-AUD Firmware Overview
18-9
18-10
AUDIOMETER CALIBRATION SYSTEM USER MANUAL
February 11, 2000
APPENDIX
A
AEC100 Artificial Ear
The Larson Davis AEC100 Artificial Ear is a precision
acoustic coupler designed primarily for the calibration and
test of supra-aural earphones used in audiometry. It is the
coupler specified in American National Standards Institute
Specifications for Audiometers, S3.6-1996. As a part of a
system including a precision sound level meter, it allows
accurate and repeatable measurements within its frequency
response. It may also be used for production testing where
correlation between the coupler and real ear response is not a
requisite.
Standards Met
The AEC100 is designed to fulfill the requirements of the
NBS Type 9-A earphone coupler described in section 5.2 of
the American National Standards Institute ANSI S3.7-1995
Methods for Coupler Calibration of Earphones when used
with the Larson Davis Model 2575 precision air condenser
microphone, of equivalent volume 0.2 cc. It also conforms
to the requirements of International Standard IEC 60318-3
(1998-08), Electroacoustics - Simulators of human head and
ear - Part 3 Acoustic coupler for the calibration of supraaural earphones used in audiometry.
Features
The AEC100 coupler and base are constructed of non-magnetic stainless steel. A teflon insulator with gold plated contacts and stainless spring-loaded pin links the microphone to
February 11, 2000
A-1
the preamplifier. The base has a non-skid rubber bottom and
a vibration isolation pad is provided with the system.
In use, a protective cap is substituted for the microphone
grid cap. It is also used to protect the spring loaded contact
when the microphone is removed. The test earphone is
securely contained by an earphone retainer ring made of
durable black anodized aluminum. Clamping force is supplied by a nickel plated weight lowered in the retainer ring.
This approach adapts to different earphones and avoids having to adjust complex spring loaded mechanisms.
Components
Please refer to figure A-1.
Index
Part Number
DESCRIPTION
1
MAE100.1
6 cc Coupler
2
MAE100.3
1 inch Coupler Cap
3
SP-MAE100.40
Artificial Ear Base Including Base,
Contacts, Insulator And Pad
4
MAE100.6
Earphone Retainer Ring
5
MAEC100.7
Mass Handle
6
SAEC100.01
Weight Assembly
7
ACC001
Vibration Isolation Pad
Figure 18-16 Parts List for AEC100
Initial Inspection and Assembly
The AEC100 artificial ear is an elegant, compact precision
coupler built to provide a lifetime of dependable use with
reasonable care. Read the following instructions to unpack,
inspect and assemble the coupler for the first time.
A-2
AUDIOMETER CALIBRATION SYSTEM USER MANUAL
February 11, 2000
Step 1
Remove the AEC100 components from their
packaging. Note: You may wish to keep the packing materials to protect the coupler from dust and
other contamination. Place the cushioned vibration
isolation pad on a table or other such stable surface near the test system.
Step 2
Visually inspect the 6 cc coupler (MAE100.1) for
gouges, scratches and dents which may affect the
measurement, especially around the lip which will
be in contact with the test earphone. Verify that the
small metallic wire in the capillary leak hole is
present with no other obstructions.
Leak Hole
Step 3
February 11, 2000
Check the threaded hole on the weight assembly
(SAEC100.01) for obstructions, and screw in the
mass handle (MAEC100.7). The handle should
screw in securely.
A -3
A-4
Step 4
If installed, remove the coupler cap (MAE100.3)
from the artificial ear base (SP-MAE100.40) by
gently unscrewing it counterclockwise.
Step 5
Inspect the spring-loaded contact at the center of
the base visually. It should extend approximately 5
mm above the threaded ridge. The teflon insulator
around it should be free of dust and other particles.
Please do not handle the contact and protect it by
keeping the coupler cap on whenever a microphone is not installed.
Step 6
Working over the cushioned pad (ACC001),
install the 1" microphone (LD Model 2575 or
equivalent) on the center of the artificial ear base.
The microphone should install easily: screw it finger tight.
Step 7
Insert the 1/2" microphone preamplifier (LD
Model PRM902 or equivalent) gently in the side
port until its threads contact those of the base. The
preamplifier should install easily: screw it finger
AUDIOMETER CALIBRATION SYSTEM USER MANUAL
February 11, 2000
tight. Note: When removing the preamplifier,
unscrew it by holding on its body, not the connector sleeve.
Step 8
Connect the instrument cable to the preamplifier.
The coupler is now ready for level calibration.
Calibration
Level calibration is normally performed with a precision
acoustic calibrator such as the Larson Davis Model
CAL250. It offers an accuracy of +/-0.2 dB at 250Hz. When
the measurement system contains a sound level meter, calibration is in dB SPL (with reference to 20 micropascals, 94
dB SPL = 1 pascal). If the measuring system requires a calibration in volts, the microphone sensitivity (usually
expressed in mV/Pa) may be used to compute the voltage
level produced by the calibrator. For example, a Model 2575
microphone with 47 mV/Pa sensitivity used with the 114 dB
SPL (20 dB greater than 1 Pa or 10 Pa) signal of the
CAL250 would result in a 10 Pa * 47 mV/Pa = 470 mV signal. These and most of the SPL values expressed in the 824
sound level meter are root mean square (rms) values. To calibrate the measurement system and artificial ear, follow the
procedure below.
February 11, 2000
A -5
NOTE: Do not remove the microphone
Step 1
Assemble the coupler as described in the Initial
Inspection and Assembly section above. The coupler base should rest on the isolation pad and
ambient noise and vibration should be minimized.
Step 2
Place the calibrator opening on the microphone
and seat it fully.
Step 3
Activate the calibrator and verify the stability of
the indication on the measurement system. Do not
hold the calibrator during calibration.
Step 4
Enter the calibration level (if required) on the
measurement system and set the calibration.
Please refer to the 824 manual if unfamiliar with
this routine.
Step 5
The AUDit system requires a calibration in each
of two measurement ranges. When this is required,
the calibrator tone may have to be reactivated for
the second calibration.
grid cap.
A-6
AUDIOMETER CALIBRATION SYSTEM USER MANUAL
February 11, 2000
Step 6
After the calibration, remove the microphone grid
cap by holding the microphone body and unscrewing the grid counterclockwise. Carefully remove
the grid cap and store it in the microphone case.
Step 7
Replace the grid cap with the protective coupler
cap (MAE100.3), being careful not to impact the
delicate diaphragm.
Measurements
The Larson Davis AEC100 artificial ear coupler may be
used for a number of precision electroacoustic test applications, such as audiometer calibration and earphone frequency response production testing.
Audiometer Calibration
The accuracy of a person's audiometric hearing evaluation is
extremely important for clinical, legal, as well as personal
reasons. The audiometers measuring hearing loss are complex instruments with signal generation, presentation and
electroacoustic components which must be verified periodically to ensure accuracy and repeatability. Audiometers are
February 11, 2000
A -7
often located in test areas which must also be tested for
ambient noise, and it is preferable not to remove them from
their installation. Therefore, portable calibration systems are
ideal.
The Larson Davis AEC100 artificial ear coupler is ideal for
a lightweight portable calibration system. The LD SYS008
and SYS009 audiometer calibration systems include the
coupler, as well as a precision sound level meter
(System824) and software (AUDit) to perform exhaustive
calibration according to the American National Standards
Institute ANSI S3.7-1995 Methods for Coupler Calibration
of Earphones and S3.6-1996 Specification for Audiometers.
The following steps are suggested for audiometer calibration
with the AEC100.
A-8
Step 1
Assemble the coupler as described in the Initial
Inspection and Assembly section above. The coupler base should rest on the isolation pad and
ambient noise and vibration should be minimized.
Step 2
Perform a calibration of the system as described in
the Calibration section above and replace the
microphone grid cap with the protective coupler
cap (MAE100.3), being careful not to impact the
delicate diaphragm.
Step 3
Apply sealant (such as petroleum jelly) on the
lower portion of the microphone to prevent air
leakage from the coupler through paths other than
AUDIOMETER CALIBRATION SYSTEM USER MANUAL
February 11, 2000
the capillary leak hole. Place the coupler over the
base. The sealant should not affect the volume of
the cavity or occlude the leak hole.
February 11, 2000
Step 4
Apply a thin (less than 1mm) film of sealant or
rubber sheet on the contact area between coupler
and earphone.
Step 5
Center the test earphone on the coupler. Lower the
black retainer ring over the earphone, holding the
earphone cable in line with the notch.
Step 6
Lower the appropriate mass on top of the earphone.
A -9
Step 7
The coupler and earphone are now ready for measurement. Set tone type, level and presentation and
make the reading on the measurement system.
Earphone Frequency Response Production Testing
As is the case with other artificial ear couplers, the AEC100
approximates the average human ear only for a limited frequency range and with certain earphones. The responses
may be significantly different from one earphone type to
another. However, an exact correlation is not always
required for production testing. It is possible to use the
AEC100 as part of an accurate system for production testing
of earphones or other electroacoustic transducers. Such a
system may consist of the following components:
•
Test earphone and adaptor to AEC100
•
Larson Davis Model AEC100 coupler
•
Larson Davis Model 2575 1" microphone
•
Cable from earphone connector to BNC
•
Larson Davis Model SRC20 synthesized signal source
•
Precision amplifier (if required)
•
Precision sound level meter such as Larson Davis Model
824-Lite or 824 with frequency analysis
Frequency response, level linearity and harmonic distortion
can be measured using the signal generation capability of the
SRC20, the coupler and precision sound level meter.
Specifications
Standards
Fulfills the requirements of:
•
A-10
NBS Type 9-A earphone coupler described in section 5.2
of the American National Standards Institute ANSI S3.71995 Methods for Coupler Calibration of Earphones
AUDIOMETER CALIBRATION SYSTEM USER MANUAL
February 11, 2000
•
International Standard IEC 60318-3 (1998-08), Electroacoustics - Simulators of human head and ear - Part 3
Acoustic coupler for the calibration of supra-aural earphones used in audiometry
when used with the Larson Davis Model 2575 precision air
condenser microphone.
Physical
Nominal effective acoustic volume: 5800 mm3
Microphone type: conforming to ANSI S1.12-1967 (R1997) Type L1SP (1" nominal diameter) or IEC 61094-4
(1995-11) type WS1P without grid cap
Microphone mounting thread: 0.9098-60 UNS-2A
Preamplifier mounting thread: 0.4606-60 UNS-2B
Maximum diameter: 82 mm (3.2")
Height: 64 mm (2.5") without weight and earphone retainer
ring, 110 mm (4.4") with earphone retainer ring
Weight: 2.5 kg (5.5 lb)
Calibration Environmental
Conditions
Reference ambient pressure: 101.3 kPa
Reference temperature:23º C
Reference relative humidity:50%
IEC 318-3 Calibration should be performed at the above
conditions within ±3,0 kPa, ±3,0 ºC, and ±20% R.H. or else
actual values should be stated.
Environmental
Operating temperature: 5 to +40º C
Operating relative humidity: 0 to 90%
Storage temperature: -25 to +70º C
Storage relative humidity: 0 to 90%
Compatibility
Microphone: Larson Davis Model 2575/Bruel & Kjaer Type
4144 1 inch condenser microphone or equivalent
February 11, 2000
A -11
Preamplifier: Larson Davis Model PRM902, 904, 900,
826B, Bruel & Kjaer microphone preamplifier Type 2669 or
equivalent
Please contact Larson Davis for compatibility with other
microphones or preamplifiers.
A-12
AUDIOMETER CALIBRATION SYSTEM USER MANUAL
February 11, 2000
APPENDIX
B
824 Technical Specifications
The specifications contained in this chapter are subject
to change without notice. Please refer to calibration
and test results for data on a specific unit.
These specifications are valid for all System 824’s using
the following options:
• PRM902 preamp
• 2541 (or 2560) free-field or random high sensitivity
microphones
• 2540 (or 2559) free-field or random normal sensitivity microphones
NOTE: Where possible, tests were performed electrically using an AD005
microphone adapter (18 pF).
Standards Met:
• ANSI S1.4 - 1985 Type 1
• IEC 60651 - 1979 Type 1
• IEC 60804 - 1985 Type 1
• IEC 60651 - 1993 Type 1
• IEC 60804 - 1993 Type 1
• IEC 61260 - 1994 Class 1
2/11/00
B-1
NOTE: The 824 does not meet IEC
60604 or ANSI S1.4 specifications when
used with a high sensitivity microphone
(2541 or 2560) and a 20 volt bias. The
bias is changed to 20 volts for high range
measurements in the ISM and LOG
modes, and -10dB or -20dB gain in all
other modes.
System 824 Main Characteristics:
• Type 1 Precision Integrating Sound Level Meter with realtime 1/3 Octave Filters
• 2 MB standard memory
• Large backlit graphic display (64 X 128 pixels)
• Icon-driven graphic user interface
• Soft rubber backlit keys
• Large dynamic range
• RMS Detectors: Slow, Fast, Impulse
• Triple Peak Detectors: A, C, FLat
• Interval History (statistical)
• Time History
• Ln statistics (L0.01 through L99.9 available)
• Histogram tables
• Direct report printouts to laser printer
• WindowsTM-based software for setup, control, and high
speed data download and reporting
• Advanced WindowsTM-based software packages (optional)
provides data archiving/search capabilities, post-measurement analysis features, and advanced sorting and graphics/
report generation tools.
• Multi-tasking processor allows measuring while viewing data,
transferring data, or printing
• Programmable Run/Stop timer for automatic measurements
• AC/DC outputs to recorder
• Field-upgradable firmware: keeps instrument current with the
latest features via ROM disk upgrades
• Two-year limited warranty
General Specifications
B-2
Reference level:
114.0 dB SPL
Reference frequency:
1000 Hz
Reference direction:
0° for a free field
microphone and 80°
for a random incidence
microphone
Temperature:
≤ ± 0.5 dB error
between
-10° C and 50°C
Storage temperature:
-10°C to 60°C
System 824 User Manual
2/11/00
Humidty:
≤ ± 0.5 dB error
between 30 and 90%
relative humidity at
40°C
Equivalent mic impedance:
18 pF for Larson•Davis
½” microphone
Range level error:
< ±0.1 dB relative to
the reference range
Calibration procedure: Using a Larson-Davis CAL200 or
equivalent calibrator, insert the microphone fully into the calibrator. Set the calibrator to 114 dB SPL. On the 824 press the
toolsTkey, arrow down to “Calibration” and press the right
arrow rkey. From the calibration menu use the down
arrowd key and highlight “Change”. Press the check c
key to initiate the calibration. The 824 will prompt you to turn
the calibrator on with “Calibrator Active?”. Select “Yes” after
turning the calibrator on and press the check c key. The 824
performs the calibration change.
Effect of Magnetic
Field:
80 A/m ( 1 Gauss) @
60 Hz produces a
change of < 16.5 dB
SPL - passes Class 1
according to IEC
61672
Vibration Sensitivity:
73.7 dB with linearweighting at 1.0 m/
sec2
referenced to 58.1 dB
Warm-up Time:
45 sec
Effect of an extension
cable on calibration:
none
AC/DC Output
2/11/00
AC output voltage
range:
±3 Volts peak
DC output voltage
range:
0 to 3 Volts peak, 28 mV per dB, with a dynamic
range of 120 dB, resolution 0.1 dB. (0 dB is
defined as the “Start Level Setting”)
AC/DC output
impedance:
~600 Ohms, error: <0.1 dB for input impedances
> 52 K Ohms
AC/DC output connector:
3.5mm stereo jack
B -3
Power Supply
Batteries:
3 AA alkaline cells or NiMH battery pack
Internal charge
time:
< 6 hours
Operating time
~4 hours
AC power input
6-15 Volts at 1 amp, max.
Typical AC power
150 mA @ 12 Volts
AC power connector
5.5mm x 2.5mm coaxial power plug
Physical Characteristics
Length:
9.9 inches
25.1 cm
Width:
3.4 inches
8.6 cm
Depth:
1.6 inches
4.0 cm
Weight:
18 oz
0.51 kg
Resolution
Levels:
0.1dB (0.01 dB via I/O)
Dose:
0.01%
Elapsed time:
0.005 seconds
Real time clock
1 second
Calendar:
01 Jan 1996 - 31 Dec 2095
Cable Drive Capability (with PRM902 preamp)
Frequencies to 20 kHz:
B-4
System 824 User Manual
700 feet
213 meters
2/11/00
Cable Drive Capability (with PRM902 preamp)
Frequencies to 10 kHz:
1000 feet
305 meters
Maximum RMS Voltage Input
Gain
VRMS
Vp-p
dBuV
0 dB
4.24
6.00
135.6
10 dB
1.34
1.9
125.6
20 dB
0.42
0.60
115.6
30 dB
0.13
0.19
105.6
40 dB
0.042
0.06
95.6
50 dB
0.013
0.02
85.6
Frequency Weightings
2/11/00
Nominal
Freq.
Exact
Freq.
Flat
A Weight
C Weight
Electrical
Tolerance
Mic.
Tolerance
10
10.00
-6.0
-70.4
-14.3
±1.8
±2.2
12.5
12.59
-4.2
-63.4
-11.2
±1.5
±2.0
16
15.85
-2.9
-56.7
-8.5
±1.2
±1.8
20
19.95
-1.9
-50.5
-6.2
±1.0
±1.5
25
25.12
-1.3
-44.7
-4.4
±0.9
±1.1
31.5
31.62
-0.8
-39.4
-3.0
±0.7
±0.8
40
39.81
-0.5
-34.6
-2.0
±0.7
±0.8
50
50.12
-0.3
-30.2
-1.3
±0.5
±0.5
63
63.10
-0.2
-26.2
-0.8
±0.5
±0.5
80
79.43
-0.1
-22.5
-0.5
±0.5
±0.5
100
100.00
-0.1
-19.1
-0.3
±0.5
±0.5
125
125.00
0.0
-16.1
-0.2
±0.5
±0.5
160
158.50
0.0
-13.4
-0.1
±0.5
±0.5
200
199.50
0.0
-10.9
0.0
±0.5
±0.5
B -5
Frequency Weightings
250
251.20
0.0
-8.6
0.0
±0.5
±0.5
315
316.20
0.0
-6.6
0.0
±0.4
±0.6
400
398.10
0.0
-4.8
0.0
±0.4
±0.6
500
501.20
0.0
-3.2
0.0
±0.4
±0.6
630
631.00
0.0
-1.9
0.0
±0.4
±0.6
800
794.30
0.0
-0.8
0.0
±0.4
±0.6
1000
1000.00
0.0
0.0
0.0
±0.4
±0.6
1250
1259.00
0.0
0.6
0.0
±0.4
±0.6
1600
1585.00
0.0
1.0
-0.1
±0.4
±0.6
2000
1995.00
0.0
1.2
-0.2
±0.4
±0.6
2500
2512.00
0.0
1.3
-0.3
±0.4
±0.6
3150
3162.00
0.0
1.2
-0.5
±0.4
±0.6
4000
3981.00
0.0
1.0
-0.8
±0.4
±0.6
5000
5012.00
0.0
0.5
-1.3
±0.5
±-1.0
6300
6310.00
0.0
-0.1
-2.0
0.5, -0.7
1.0, -1.4
8000
7943.00
0.0
-1.1
-3.0
0.5, -1.0
1.0, -2.0
10000
10000.00
0.0
-2.5
-4.4
0.7, -1.3
1.3, -2.7
12500
12590.00
0.0
-4.3
-6.2
1.0, -2.0
2.0, -4.0
16000
15850.00
0.0
-6.6
-8.5
1.0, -3.0
2.0,
20000
19950.00
0.0
-9.3
-11.2
1.0, -4.0
2.0,
∞
∞
SSA Mode Specifications (IEC 61260 Class 1)
B-6
Overall time weighting:
Slow, Fast, Impulse,
TWA and Peak
1/3 octave filter time
weighting:
Slow, Fast
Dynamic range:
> 93 dBA (overload to
noise floor)
Linearity range:
> 80 dBA
Pulse range:
> 83 dBA
RMS noise floor:
< 33 dBA typical with
PRM902, 2541 microphone, and 0 dB gain
Reference level range:
0 dB gain
Exchange rates:
3, 4, 5, or 6 dB
Sample rate:
51,200 Hz
1/3 octave band frequencies:
12.5 Hz - 20 kHz
Filter integrated
response:
≤ ±0.15dB for all filters.
System 824 User Manual
2/11/00
Real-time operation:
≤ ±0.3 dB error for all
filters tested with a
swept sinusoidal input.
Anti-aliasing:
≥ 75 dB
Summation of output
signals:
≤ ± 1.0 dB (±0.4 dB
typical)
Flat frequency range:
10 Hz - 20 kHz, relative attenuation < ±
0.15 dB
Filter type:
Digital
Octave frequency
ratio:
Base 2 (See IEC 1260
Annex A)
AC/DC Output (SSA mode only)
824 Menu
3.5mm Connector Tip
3.5 mm Connector Ring
AC-1 AC-2
Flat AC output
C-weighted AC output
AC-1 DC
Flat AC output
Weighted DC output
AC-2 DC
C-weighted AC output
Weighted DC output
AC-2 AC-1
C-weighted AC output
Flat AC output
NOTE: AC output gain matches RMS
detector.
Measurement Range (SSA mode only) Typical
0dB Gain
A
C
FLA
16.0
31.5
63.0
125
250
500
1000
2000
4000
8000
NF
Start
End
33
32
32
2
3
4
2
3
12
10
15
14
14
48
48
48
45
43
40
40
37
33
32
32
32
32
128
128
128
128
128
128
128
128
128
128
128
128
128
2/11/00
10dB Gain
Rang
e
80
80
80
83
85
88
88
91
95
96
96
96
96
NF
Start
End
24
23
25
2
1
0
-2
-3
4
2
6
7
7
38
38
38
35
35
33
27
25
25
20
20
20
20
118
118
118
118
118
118
118
118
118
118
118
118
118
20db Gain
Rang
e
80
80
80
83
83
85
91
93
93
98
98
98
98
NF
Start
End
15
16
21
1
1
1
-3
-3
-3
-4
-2
0
1
28
28
33
25
23
23
28
15
15
15
15
15
15
108
108
108
108
108
108
108
108
108
108
108
108
108
30dB Gain
Rang
e
80
80
75
83
85
85
80
93
93
93
93
93
93
NF
Start
End
8
9
21
2
2
0
-2
-4
-4
-5
-5
-2
-1
23
23
33
25
25
22
18
15
13
13
13
13
13
98
98
98
98
98
98
98
98
98
98
98
98
98
40dB Gain
Rang
e
75
75
65
73
73
76
80
83
85
85
85
85
85
NF
Start
End
7
8
26
-1
-4
-7
-9
-10
-10
-10
-8
-6
-2
20
20
33
28
22
15
11
8
6
6
8
8
12
88
88
88
88
88
88
88
88
88
88
88
88
88
50dB Gain
Rang
e
68
68
50
60
66
73
77
80
82
82
80
78
76
NF
Start
End
6
8
23
1
-4
-7
-8
-9
-10
-10
-8
-6
-3
20
20
40
23
23
18
8
8
8
8
8
8
13
78
78
78
78
78
78
78
78
78
78
78
78
78
Rang
e
58
58
38
55
55
60
70
70
70
70
70
70
65
B -7
NOTE: A-weighting, C-weighting, and
Flat are measured to ANSI S1.4 and IEC
60651 standards for SLM linearity. 1/3
octave filters listed are measured to the
IEC 61260 standard for Class 0 linearity
which is ±0.3 dB. The numbers in the
table represent SPL levels with a typical
2541 microphone which has 44.1 mV/Pa
sensitivity.
*NF is noise floor.
AUD Mode Specifications
AC/DC output:
For AUD, AC and DC
outputs are undefined.
Pulse mode:
The pulse test output is
computed from a Discrete Hilbert Transform
which is sampled every
½ millisecond. The Discrete Hilbert Transform
produces a mathematically correct sample of
the input waveform
envelope.
Time resolution:
0.5 ms to 1.0 seconds
in 0.5 ms increments
Time accuracy:
±1.0 ms
Hilbert transform magnitude error:
< 0.1 dB
Dynamic range:
> 80 dB
Hilbert transform Sample rate:
2000 Hz
On level computation:
After the “ON” state has
been detected, the
“ON” level is computed
as the average of 32
samples.
Overshoot computation:
Overshoot is calculated
as the maximum sample level minus the
averaged “ON” level
Measurement conditions:
Conditions that must be
met to produce output:
•
ON/OFF modulation must be
greater than 20 dB (90%).
•
The “ON” state must be stable
within ±0.5dB for at least 20
ms.
•
Pulse transition from high to
low must occur within 2 seconds of the transition from low
to high for the fall time to be
calculated. If this time is
greater than 2 seconds, the
824 will revert to looking for the
pulse rise time.
FM Modulation Tests
B-8
System 824 User Manual
2/11/00
The FM modulation test code computes the minumum and maximum periods of the input waveform. The minimum and maximum
frequencies are the inverse of the average of the last 8 periods. The
carrier frequency is an exponential average of all waveform periods.
Signal will be flagged as stable if the carrier period varies less than 8
microseconds for 1 second.
Carrier frequency (Fc):
20 Hz ≤ fc ≤ 16000 Hz
Modulating frequency (fm):
3 Hz ≤ fm ≤ 100 Hz
Carrier to modulating frequency ratio:
fc > fm * 5
Signal amplitude:
Overload -35dB το Overload
SLM/RTA
The 1/3 octave filters used in the audiometric calibration firmware
are the same filters as are used in the SSA firmware and meet the
same specifications, (page D-8).
400 Line FFT
2/11/00
Averaging:
Count
Window:
Rectangular or Hanning
Linearity range:
>85 dB with Hanning window,
20 kHz bandwith, and PRM902
Dynamic range:
>100 dB
Flat SPL linearity range:
>75 dB
Pressure Response
of Free-Field
Microphones
(Variation over Pressure)
Pressure
650 mB
750 mB
850 mB
925 mB
1013 mB
1100 mB
2520
.3831 dB
.2049 dB
.1371 dB
.0688 dB
0.000
-.0462 dB
2540
.3396 dB
.2391 dB
.1488 dB
.0804 dB
0.000
-.0753 dB
2541
.4272 dB
.3062 dB
.1891 dB
.0989 dB
0.000
-.1019 dB
B -9
NOTE: Results in dB referenced to 1013
mB
Position of Instrument and Operator:
When making a measurement, it is recommended that
the observer be positioned as far behind and to the
right of the instrument as possible to minimize interference of the sound field at the microphone resulting
from body reflections. When using the 824, the meter is
held in one hand with the arm extended away from the
body. Better results can be obtained by using a tripod.
Free-Field to Random Corrections
B-10
Freq
Diffuse
F.F.
Corr.
Freq
Diffuse
F.F.
Corr.
251
0.14
0.15
0.01
2326
-0.11
0.50
0.61
271
0.06
0.16
0.10
2512
-0.05
0.52
0.57
293
0.10
0.16
0.06
2712
-0.16
0.45
0.61
316
0.09
0.12
0.03
2929
-0.28
0.44
0.72
341
0.05
0.12
0.07
3162
-0.34
0.24
0.58
369
0.05
0.17
0.12
3415
-0.37
0.15
0.52
398
0.07
0.15
0.08
3687
-0.42
0.32
0.74
430
0.06
0.11
0.05
3981
-0.51
0.47
0.98
System 824 User Manual
2/11/00
2/11/00
464
0.06
0.06
0.00
4299
-0.63
0.32
0.95
501
0.07
0.05
-0.02
4642
-0.95
0.11
1.06
541
0.09
0.04
-0.05
5012
-0.99
0.49
1.48
584
0.09
0.06
-0.03
5412
-1.15
0.28
1.43
631
0.06
0.06
0.00
5843
-1.21
0.48
1.69
681
0.14
0.11
-0.03
6310
-1.57
0.44
2.01
736
0.01
-0.03
-0.04
6813
-1.77
0.21
1.98
794
0.02
-0.05
-0.07
7356
-1.98
0.42
2.40
858
0.07
0.02
-0.05
7943
-2.29
0.70
2.99
926
-0.01
-0.06
-0.05
8577
-2.40
0.48
2.88
1000
0.03
0.00
-0.03
9261
-2.76
0.61
3.37
1080
0.03
0.13
0.10
10000
-2.76
0.32
3.08
1166
-0.02
0.24
0.26
10798
-3.05
0.44
3.49
1259
-0.05
0.24
0.29
11659
-3.56
0.62
4.18
1359
-0.04
0.28
0.32
12589
-3.91
0.36
4.27
1468
0.03
0.36
0.33
13594
-4.53
0.02
4.55
1585
0.00
0.44
0.44
14678
-4.94
0.27
5.21
1711
0.02
0.09
0.07
15849
-5.27
0.55
5.82
1848
-0.03
0.00
0.03
17113
-5.73
0.46
6.19
1995
-0.07
-0.21
-0.14
18479
-5.99
0.68
6.67
2154
-0.13
0.18
0.31
19953
-6.31
0.57
6.88
B -11
APPENDIX
C
Sample Reports
Examples of Reports from AUDit™
This appendix contains examples of the reports that can be created using the AUDit™ software.
2/11/00
C-1
Audiometer Report Page 1
2/11/00
C -2
Audiometer Report Page 2
C-3
System 824 User Manual
2/11/00
Audiometer Report Page 3
2/11/00
C -4
Audiometer Report Page 4
C-5
System 824 User Manual
2/11/00
Audiometer Report Page 5
2/11/00
C -6
Certificate of Calibration (Audiometer)
C-7
System 824 User Manual
2/11/00
Certificate of Compliance (Booth)
2/11/00
C -8
Booth Report
C-9
System 824 User Manual
2/11/00
APPENDIX
D
Glossary
This appendix contains technical definitions of key
acoustical and vibration terms commonly used with
Larson•Davis instruments. The reader is referred to
American National Standards Institute document S1.11994 for additional definitions. Specific use of the
terms defined are in the main body of the text.
Average Sound Level (Lavg)
It is the logarithmic average of the sound during a
Measurement Duration (specific time period), using
the chosen Exchange Rate Factor. Exposure to this
sound level over the period would result in the same
noise dose and the actual (unsteady) sound levels. If
the Measurement Duration is the same as the Criterion
Duration, then Lavg=LTWA(LC)
T
L avg
2
( Lp ( t ) ) ⁄ q
1
dt
= qLog 10 --- 10
T
T
∫
1
where the Measurement Duration (specified time
period) is T=T2-T1 and q is the Exchange Rate Factor.
Only sound levels above the Threshold Level are
included in the integral. Standard: ANSI S12.19
Calibration
Adjustment of a sound or vibration measurement system so that it agrees with a reference sound or vibration source. It should be done before each set of
measurements.
Decibel (dB)
A logarithmic form of any measured physical quantity,
typically used in sound and vibration measurements.
Whenever the word level is used it implies this logarithmic form. The relationship is relatively simple, but
the mathematics can become complex. It is widely
2/11/00
D-1
used and was developed so that the very wide range of
any quantity could be represented more simply. It is
not possible to directly add or subtract physical quantities when expressed in decibel form. The word level
is always attached to a physical quantity when it is
expressed in decibels; for example Lp represents the
sound pressure level. The table below shows the actual
value of a specific item, such as sound pressure, for
which the level is to be determined. First the value is
put into exponential form in powers of ten; the exponent is the Bel. The exponent is then multiplied by ten
to yield the decibel. This procedure converts multiplication into addition; every time 10 is added to the level,
the value is multiplied by 10. When the value is not a
even multiple of ten the exponent is more complicated
as shown in the table. Every time the level increases by
3 dB, the value is multiplied by 2 (doubled). These
two rules are worth remembering.
Linear form
Ration of Value to Reference
1
10
100
200
1000
10000
100000
1000000
Exponential Form
of Ratio
100
101
102
102.3
103
104
105
106
Level form
10•Exponent
0
10
20
23
30
40
50
60
The definition of decibel is intended for power-like
quantities (W). Sometimes power is represented by the
square of a measured quantity and this results in a different form of the equation (See Sound Pressure Level).
W
L = 10Log 10 ------W0
W = W 0 10
L ⁄ 10
The value of the item in the table is not the value of the
quantity itself but the ratio of that quantity to a reference quantity. So for every level in decibels there must
be a reference quantity. When the quantity equals the
reference quantity the level is zero. To keep the values
D-2
System 814 User Manual
2/11/00
above zero, the reference is generally set to be the lowest value of the quantity.
Detector
The part of a sound level meter that converts the actual
fluctuating sound or vibration signal from the microphone to one that indicates its amplitude. It first
squares the signal, then averages it in accordance with
the time-weighting characteristic, and then takes the
square root. This results in an amplitude described as
rms (root-mean-square).
Energy Equivalent Sound Level
(Leq)
The level of a constant sound over a specific time
period that has the same sound energy as the actual
(unsteady) sound over the same period.
T2 2
p ( t ) dt
T1
L eq = 10Log 10 -------------------------2
po T
∫
where p is the sound pressure and the Measurement
Duration (specific time period) T=T2-T1. See Sound
Exposure Level.
Far Field
There are two types of far fields: the acoustic far field
and the geometric far field.
Acoustic Far Field: The distance from a source of sound
is greater than an acoustic wavelength. In the far field,
the effect of the type of sound source is negligible.
Since the wavelength varies with frequency (See the
definition of Wavelength), the distance will vary with
frequency. To be in the far field for all frequencies
measured, the lowest frequency should be chosen for
determining the distance. For example, if the lowest
frequency is 20 Hz, the wavelength at normal temperatures is near 56 ft. (17 m); at 1000 Hz, the wavelength is
near 1.1 ft. (1/3 m). See the definition of Acoustic Near
Field for the advantages of in the acoustic far field.
Geometric Far Field: The distance from a source of
sound is greater than the largest dimension of the
sound source. In the far field, the effect of source
2/11/00
D -3
geometry is negligible. Sound sources often have a
variety of specific sources within them, such as
exhaust and intake noise. When in the far field, the
sources have all merged into one, so that measurements made even further away will be no different.
See the definition of Geometric Near Field for the
advantages of being in the geometric far field.
Free Field
A sound field that is free of reflections. This does not
mean that the sound is all coming from one direction
as is often assumed, since the source of sound may be
spatially extensive. See the definitions of near and far
fields for more detail. This definition is often used in
conjunction with reverberant field.
Frequency (Hz, rad/sec)
The rate at which an oscillating signal completes a
complete cycle by returning to the original value. It can
be expressed in cycles per second and the value has the
unit symbol Hz (Hertz) added and the letter f is used
for a universal descriptor. It can also be expressed in
radians per second, which has no symbol, and the
greek letter ω is used for a universal descriptor. The
two expressions are related through the expression
ω=2¼f.
Frequency Band Pass Filter
The part of certain sound level meters that divides the
frequency spectrum on the sound or vibration into a
part that is unchanged and a part that is filtered out. It
can be composed of one or more of the following
types:
Low Pass: A frequency filter that permits signals to pass
through that have frequencies below a certain fixed
frequency, called a cutoff frequency. It is used to discriminate against higher frequencies.
High Pass: A frequency filter that permits signals to
pass through that have frequencies above a certain
fixed frequency, called a cutoff frequency. It is used to
discriminate against lower frequencies.
Bandpass: A frequency filter that permits signals to
pass through that have frequencies above a certain
fixed frequency, called a lower cutoff frequency, and
below a certain fixed frequency, called an upper cutoff
D-4
System 814 User Manual
2/11/00
frequency. The difference between the two cutoff frequencies is called the bandwidth. It is used to discriminate against both lower and higher frequencies so it
passes only a band of frequencies.
Octave band: A bandpass frequency filter that permits
signals to pass through that have a bandwidth based
on octaves. An octave is a doubling of frequency so the
upper cutoff frequency is twice the lower cutoff frequency. This filter is often further subdivided in 1/3
and 1/12 octaves (3 and 12 bands per octave) for finer
frequency resolution. Instruments with these filters
have a sufficient number of them to cover the usual
range of frequencies encountered in sound and vibration measurements.The frequency chosen to describe
the band is that of the center frequency. Note table in
Frequency Filter - Frequency Weighting.
Frequency Filter - Weighted
A special frequency filter that adjusts the amplitude of
all parts of the frequency spectrum of the sound or
vibration unlike band pass filters. It can be composed
of one or more of the following types:
A-Weighting: A filter that adjusts the levels of a frequency spectrum in the same way the human ear does
when exposed to low levels of sound. This weighting
is most often used for evaluation of environmental
sounds. See table below.
B-Weighting: A filter that adjusts the levels of a frequency spectrum in the same way the human ear does
when exposed to higher levels of sound. This weighting is seldom used. See table below.
C-Weighting: A filter that adjusts the levels of a frequency spectrum in the same way the human ear does
when exposed to high levels of sound. This weighting
is most often used for evaluation of equipment sounds.
See table below.
Flat-Weighting: A filter that does not adjust the levels of
2/11/00
D -5
a frequency spectrum. It is usually an alternative selection for the frequency-weighting selection.
Center Frequencies, Hz
1/3 Octave 1 Octave
20
25
31.5
31.5
40
50
63
63
80
100
125
125
160
200
250
250
315
400
500
500
630
800
1000
1000
1250
1600
2000
2000
2500
3150
4000
4000
5000
6300
8000
8000
10000
12500
16000
16000
20000
Weighting Network Frequency
Response
A
B
C
-50.4
-24.2
-6.2
-44.7
-20.4
-4.4
-39.4
-17.1
-3.0
-34.6
-14.2
-2.0
-30.2
-11.6
-1.3
-26.2
-9.3
-0.8
-22.5
-7.4
-0.5
-19.1
-5.6
-0.3
-16.1
-4.2
-0.2
-13.4
-3.0
-0.1
-10.9
-2.0
0
-8.6
-1.3
0
-6.6
-0.8
0
-4.8
-0.5
0
-3.2
-0.3
0
-1.9
-0.1
0
-0.8
0
0
0
0
0
0.6
0
0
1.0
0
-0.1
1.2
-0.1
-0.2
1.3
-0.2
-0.3
1.2
-0.4
-0.5
1.0
-0.7
-0.8
0.5
-1.2
-1.3
-0.1
-1.9
-2.0
-1.1
-2.9
-3.0
-2.5
-4.3
-4.4
-4.3
-6.1
-6.2
-6.6
-8.4
-8.5
-9.3
-11.1
-11.2
Leq
See “Energy Equivalent Sound Level”, “Sound Level”,
Energy Average”, and “Time Weighted Average”
Level (dB)
A descriptor of a measured physical quantity, typically
used in sound and vibration measurements. It is
attached to the name of the physical quantity to denote
that it is a logarithmic measure of the quantity and not
the quantity itself. The word decibel is often added after
D-6
System 814 User Manual
2/11/00
the number to express the same thing. When frequency
weighting is used the annotation is often expressed as
dB(A) or dB(B).
Measurement Duration (T)
The time period of measurement. It applies to hearing
damage risk and is generally expressed in hours.
Standard: ANSI S12.19
Microphone Guidelines
Microphone - Types: A device for detecting the presence of sound. Most often it converts the changing
pressure associated with sound into an electrical voltage that duplicates the changes. It can be composed of
one of the following types:
Capacitor (Condenser): A microphone that uses the
motion of a thin diaphragm caused by the sound to
change the capacitance of an electrical circuit and
thereby to create a signal. For high sensitivity, this
device has a voltage applied across the diaphragm
from an internal source.
Electret: A microphone that uses the motion of a thin
diaphragm caused by the sound to change the capacitance of an electrical circuit and thereby to create a signal. The voltage across the diaphragm is caused by the
charge embedded in the electret material so no internal
source is needed.
Microphone - Uses: The frequency response of microphones can be adjusted to be used in specific applications. Among those used are:
Frontal incidence (Free Field): The microphone has been
adjusted to have an essentially flat frequency response
when in a space relatively free of reflections and when
pointed at the source of the sound.
Random incidence: The microphone has been adjusted
to have an essentially flat frequency response for
sound waves impinging on the microphone from all
directions.
Pressure: The microphone has not been adjusted to
have an essentially flat frequency response for sound
waves impinging on the microphone from all directions.
2/11/00
D -7
What a microphone measures: A microphone detects
more than just sound. The motion of a microphone diaphragm is in response to a force acting on it. The force
can be caused by a number of sources only one of
which are we interested: sound. Non-sound forces are:
(1) direct physical contact such as that with a finger or
a raindrop; (2) those caused by the movement of air
over the diaphragm such as environmental wind or
blowing; (3) those caused by vibration of the microphone housing; and (4) those caused by strong electrostatic fields.
Rules:
1. Do not permit any solid or liquid to touch the microphone diaphragm. Keep a protective grid over the diaphragm.
2. Do not blow on a microphone and use a wind screen
over the microphone to reduce the effect of wind noise.
3. Mount microphones so their body is not subject to
vibration, particularly in direction at right angles to the
plane of the diaphragm.
4. Keep microphones away from strong electrical
fields.
A microphone measures forces not pressures. We would
like the microphone to measure sound pressure (force
per unit area) instead of sound force. If the pressure is
applied uniformly over the microphone diaphragm a
simple constant (the diaphragm area) relates the two,
but if the pressure varies across the diaphragm the
relationship is more complex. For example, if a negative pressure is applied on one-half the diaphragm and
an equal positive pressure is applied to the other half,
the net force is zero and essentially no motion of the
diaphragm occurs. This occurs at high frequencies and
for specific orientations of the microphone.
Rules:
1. Do not use a microphone at frequencies higher than
specified by the manufacturer; to increase the frequency response choose smaller microphones.
2. Choose a microphone for free field or random incidence
to minimize the influence of orientation.
A microphone influences the sound being measured. The
microphone measures very small forces, low level
sound can run about one-billionth of a PSI! Every measurement instrument changes the thing being measured, and for very small forces that effect can be
D-8
System 814 User Manual
2/11/00
significant. When sound impinges directly on a microphone the incident wave must be reflected since it cannot pass through the microphone. This results in the
extra force required to reflect the sound and a microphone output that is higher than would exist if the
microphone were not there. This is more important at
high frequencies and when the microphone is facing
the sound source.
Rules:
1. Do not use a microphone at frequencies higher than
specified by the manufacturer; to increase the frequency response choose smaller microphones.
2. Choose a microphone for free field or random incidence
to minimize the influence of orientation.
A microphone measures what is there from any direction:
Most measurements are intended to measure the
sound level of a specific source, but most microphones
are not directional so they measure whatever is there,
regardless of source.
Rules:
1. When making hand-held measurements, keep your
body at right angles to the direction of the sound you
are interested in and hold the meter as far from your
body as possible. Use a tripod whenever possible.
2. Measure the influence of other sources by measuring
the background sound level without the source of
interest. You may have to correct for the background.
Near Field
There are two types of near fields: the acoustic near field
and the geometric near field.
Acoustic Near Field: The distance from a source of
sound is less than an acoustic wavelength. In the near
field, the effect of the type of sound source is significant. Since the wavelength varies with frequency (See
the definition of Wavelength), the distance will vary
with frequency. The most common example of a near
field is driving an automobile with an open window.
As you move your ear to the plane of the window, the
sound pressure level builds up rapidly (wind noise)
since most of the pressure changes are to move the air
and very little of it compresses the air to create sound.
Persons not far way, can hardly hear what you hear.
The acoustic near field is characterized by pressures
that do not create sound that can be measured in the
2/11/00
D -9
far field. Therefore measurements made here are not
useful in predicting the sound levels far way or the
sound power of the source.
Geometric Near Field: The distance from a source of
sound is less than the largest dimension of the sound
source. In the near field, effect of source geometry is
significant. Sound sources often have a variety of specific sources within them, such as exhaust and intake
noise. When in the near field, the sound of a weaker,
but close, source can be louder than that of a more distant, but stronger, source. Therefore measurements
made here can be used to separate the various sources
of sound, but are not useful in predicting the sound
levels and sound spectrum far from the source.
Noise
Typically it is unwanted sound. This word adds the
response of humans to the physical phenomenon of
sound. The descriptor should be used only when negative effects on people are known to occur. Unfortunately, this word is used also to describe sounds with
no tonal content (random):
Ambient: The all encompassing sound at a given location caused by all sources of sound. It is generally random, but need not be.
Background: The all encompassing sound at a given
location caused by all sources of sound, but excluding
the source to be measured. It is essentially the sound
that interferes with a measurement.
Pink: It is a random sound that maintains constant
energy per octave. Pink light is similar to pink noise in
that it has a higher level at the lower frequencies (red
end of the spectrum).
White: It is a random sound that contains equal energy
at each frequency. In this respect, it is similar to white
light.
Sound
D-10
The rapid oscillatory compressional changes in a
medium (solid, liquid or gas) that propagate to distant
points. It is characterized by changes in density, pressure, motion, and temperature as well as other physical quantities. Not all rapid changes in the medium are
sound (wind noise) since they do not propagate.
System 814 User Manual
2/11/00
The auditory sensation evoked by the oscillatory
changes.
Difference between sound and noise: Sound is the physical
phenomenon associated with acoustic (small) pressure
waves. Use of the word sound provides a neutral
description of some acoustic event. Generally, noise is
defined as unwanted sound. It can also be defined as
sound that causes adverse effects on people such as
hearing loss or annoyance. It can also be defined as the
sound made by other people. In every case, noise
involves the judgment of someone and puts noise in
the realm of psychology not physics.
Rules:
1. Use word sound to describe measurements to
remove the emotional overtones associated with the
word noise. Some sound metrics use noise in their
name and it is proper to use the name as it is.
Sound Pressure
The physical characteristic of sound that can be
detected by microphones. Not all pressure signals
detected by a microphone are sound (e.g., wind noise).
It is the amplitude of the oscillating sound pressure
and is measured in Pascals (Pa), Newtons per square
meter, which is a metric equivalent of pounds per
square inch. To measure sound, the oscillating pressure must be separated from the steady (barometric)
pressure with a detector. The detector takes out the
steady pressure so only the oscillating pressure
remains. It then squares the pressure, takes the time
average, and then takes the square root (this is called
rms for root-mean square). There are several ways this
can be done.
Moving Average: The averaging process is continually
accepting new data so it is similar to an exponential
moving average. The equation for it is
t
p rms =
–( t – ξ ) ⁄ T
1 2
--- p ( ξ )e
dξ
T
∫
ts
2/11/00
D -11
The sound pressure is squared and multiplied by a
exponential decay factor so that when the time of integration is near the current time (t) it is essentially undiminished. For times older (less) than the current time,
the value is diminished and so becomes less important.
The rate at which older data are made less influential is
expressed by the constant T. The larger is it the slower
the decay factor reduces and the slower the response
of the system to rapid changes. These are standardized
into three values called Time Weighting. See the values
below.
Fixed Average: The averaging process is over a fixed
time period. The equation for it is
T2
p rms =
2
1
----------------------- p ( t ) dt
( T2 – T1 )
∫
T1
The sound pressure is squared and averaged over a
fixed time period. Unlike the moving average, the
sound pressures in all time intervals are equally
weighted.
Sound Pressure Level (SPL, Lp)
The logarithmic form of sound pressure. It is also
expressed by attachment of the word decibel to the
number. The logarithm is taken of the ratio of the
actual sound pressure to a reference sound pressure
which is 20 MicroPascals (µ Pa). There are various
descriptors attached to this level depending on how
the actual sound pressure is processed in the meter:
Instantaneous: The time varying reading on a meter
face on in a meter output due to changes in the sound
pressure. The reading will depend on the time-weighting applied.
The fundamental relationship between the two is logarithmic
p rms
L p = 20log 10 --------p0
D-12
System 814 User Manual
p rms = p 0 10
L p ⁄ 20
2/11/00
where p0 is the reference sound pressure of 20 µPa.
The square of the sound pressure is a power-like quantity that can be expressed in the original form of the
level definition
2
p rms
L p = 10log 10 --------2
p0
2
2
p rms = p 0 10
L p ⁄ 10
Sound Pressure Level can be converted to sound pressure as follows. If the sound pressure is 1 Pascal, then
the sound pressure level is
1
- = 20log 10 [ 50000 ] = 20 [ 4.699 ] = 94.0dB
g 10 --------------------–6
20 • 10
Calibrators often use a level of 94 dB so they generate a
sound pressure of 1 Pascal.
If the sound pressure level = 76.3 dB, then the sound
pressure is
76.3 ⁄ 20
= 20 • 10
3.815 – 6
= 20 • 10
– 2.185
= 20 [ 0.0065 ] = 0.13
Energy Average (Leq): The value of a steady sound measured over a fixed time period that has the same sound
energy as the actual time varying sound over the same
period. This descriptor is widely used. It is a fixed
average (See Sound Pressure).
Impulse: The value of an impulsive sound. The reading
will depend on the time-weighting applied.
Unweighted Peak: The peak value of a sound with a
meter that has flat frequency weighting and a peak
detector.
Weighted Peak: The peak value of a sound with a meter
that has a frequency weighting other than flat and a
peak detector.
Sound Speed, (c,)
2/11/00
The speed at which sound waves propagate. It is measured in meters per second. It should not be confused
with sound or particle velocity which relates to the
D -13
physical motion of the medium itself.
c = 20.05 degC + 273
c = 49.03 degF + 460
m⁄s
ft ⁄ sec
Spectrum (Frequency Spectrum)
The amplitude of sound or vibration at various frequencies. It is given by a set of numbers that describe
the amplitude at each frequency or band of frequencies. It is often prefixed with a descriptor that identifies
it such as sound pressure spectrum. It is generally
expressed as a spectrum level.
Time Weighting
The response speed of the detector in a sound level
meter. There are several speeds used.
Slow: The time constant is 1 second (1000 ms). This is
the slowest and is commonly used in environmental
noise measurements.
Fast: The time constant is 1/8 second (125 ms). This is a
less commonly used weighting but will detect changes
in sound level more rapidly.
Impulse: The time constant is 35ms for the rise and 1.5
seconds (1500 ms) for the decay. The reason for the
double constant is to allow the very short signal to be
captured and displayed.
Vibration
The oscillatory movement of a mechanical system
(generally taken to be solid). It is used as a broad
descriptor of oscillations.
Wavelength (l)
The distance between peaks of a propagating wave
with a well defined frequency. It is related to the frequency through the following equation
λ = c-f
where c is the sound speed and f is the frequency in
Hz. It has the dimensions of length.
D-14
System 814 User Manual
2/11/00
Wavenumber (k)
A number that is related to the wavelength of sound
and is used to compare the size of objects relative to
the wavelength or the time delay in sound propagation. It is related to wavelength through the following
equation
k = 2π
------ = 2πf
-------- = ω
---λ
c
c
where λ is the wavelength, c is the sound speed, f is the
frequency in Hz, and ω is the radian frequency. It has
the dimensions of inverse length.
2/11/00
D -15
D-16
System 814 User Manual
2/11/00
APPENDIX
E
Warranty/Customer Satisfaction
A. Total Customer Satisfaction. Larson Davis, Inc. (“LD”) guarantees Total Customer Satisfaction.
If, at any time you are not completely satisfied with any LD product, LD will repair, replace or
exchange it at no charge, except as otherwise provided in this Limited Warranty. The employees of
LD strive to provide superior, unmatched customer service. Should you find yourself dissatisfied with
any LD product for any reason, consult a LD Application engineer or local representative/ distributor
to discuss your situation.
B. Purchase Price Refund/Limited Warranty. LD warrants to the original purchaser (the "Buyer")
that, unless otherwise expressly specified in writing by a LD officer, all LD products shall be free of
defects in material and workmanship for a period of two (2) years from date of original purchase. In
furtherance of LD's commitment to Total Customer Satisfaction, LD will, for a period of one (1) year
from date of original purchase, refund 100% of the customer's purchase price for any LD product with
which the buyer is not completely satisfied, subject to the exceptions contained in Paragraph J of this
Limited Warranty. The option of a refund may be selected during this one (1) year period in lieu of
repair, replacement or exchange of the product.
Extended Labor Warranty. In furtherance of LD's commitment to Total Customer Satisfaction,
LD offers an extended labor warranty of one (1) year on all products calibrated or certified by a
factory technician at any time or from time-to-time during the first seven years of the product life
from date of manufacture. The customer's sole remedy pursuant to this extended warranty is to
receive free labor for any repairs required during the period in which the extended warranty is
effective. This extended labor warranty is subject to the limitations as outlined in Paragraph J.
Service & Repair Limited Warranty. In addition to the limited warranties set forth above, LD
offers a 90-day parts and labor limited warranty for all repair work performed at the factory. This
warranty is limited to parts repaired or replaced at the factory by LD. This warranty is also subject
to the limitations as outlined in Paragraph J.
C. Shipping Charges. The buyer will return the product freight prepaid by the Buyer to an
authorized service center. The product will be returned to the buyer freight prepaid by LD.
D. Products Manufactured by Others. This Limited Warranty does not cover any products
manufactured by others. Such products are subject to the warranty, if any, of their respective
manufacturers, and to be repaired only by a respective authorized service person for such products.
LD shall have no obligation to undertake repairs of products manufactured by others.
Warranty/Customer Satisfaction
E-17
E. NO SPECIAL, INCIDENTAL OR CONSEQUENTIAL DAMAGES. LD'S SOLE
OBLIGATIONS UNDER THIS LIMITED WARRANTY ARE SET FORTH ABOVE IN
PARAGRAPHS A, B, C AND D. IN NO EVENT SHALL LD (ITS CONTRACTORS OR
SUPPLIERS) BE LIABLE TO THE BUYER FOR ANY LOST PROFITS, DIRECT,
INDIRECT, SPECIAL, INCIDENTAL OR CONSEQUENTIAL DAMAGES, WHETHER
BASED ON CONTRACT, IN TORT OR ANY OTHER LEGAL THEORY. SUCH DAMAGES
FOR WHICH LD SHALL NOT BE RESPONSIBLE INCLUDE, BUT ARE NOT LIMITED
TO, LOST TIME AND CONVENIENCE, LOSS OF USE OF THE PRODUCT, THE COST OF
A PRODUCT RENTAL, COSTS OF GASOLINE, TELEPHONE, TRAVEL OR LODGING,
THE LOSS OF PERSONAL OR COMMERCIAL PROPERTY, AND THE LOSS OF
REVENUE.
Some states do not permit the limitation or disclaimer of incidental or consequential damages.
Therefore, the above disclaimer of incidental or consequential damages may not apply to certain
purchasers.
F. NO LIABILITY IN EXCESS OF PURCHASE PRICE. IN NO EVENT SHALL LD'S
OBLIGATIONS UNDER THIS LIMITED WARRANTY EXCEED THE PURCHASE PRICE
OF THE PRODUCT PLUS ANY SHIPPING CHARGES THAT LD MAY BE OBLIGATED
TO PAY PURSUANT TO PARAGRAPH C ABOVE.
G. NO EXTENSION OF STATUTE OF LIMITATIONS. ANY REPAIRS PERFORMED
UNDER THIS LIMITED WARRANTY SHALL NOT IN ANY WAY EXTEND THE
STATUTES OF LIMITATIONS FOR CLAIMS UNDER THIS LIMITED WARRANTY.
H. WAIVER OF OTHER WARRANTIES. THE EXPRESS WARRANTIES SET FORTH IN
THIS LIMITED WARRANTY ARE IN LIEU OF AND EXCLUDE ANY AND ALL OTHER
WARRANTIES, EXPRESSED OR IMPLIED, INCLUDING BUT NOT LIMITED TO, THE
IMPLIED WARRANTIES OF MERCHANTABILITY AND FITNESS FOR A PARTICULAR
PURPOSE.
Some states do not permit the disclaimer of implied warranties. Therefore, the above disclaimer of
implied warranties may not apply to certain purchasers.
I. Procedure for Warranty Performance. If the product fails to perform to LD's specifications, the
Buyer must provide LD with the applicable model and serial numbers, the date of purchase, and the
nature of the problem.
J. ADDITIONAL
EXCLUSIONS
FROM
THIS
LIMITED
WARRANTY.
NOTWITHSTANDING ANYTHING TO THE CONTRARY CONTAINED IN THIS
LIMITED WARRANTY, THIS LIMITED WARRANTY DOES NOT COVER ANY OF THE
FOLLOWING:
1.EQUIPMENT THAT HAS BEEN ABUSED, DAMAGED, USED BEYOND RATED
CAPACITY, OR REPAIRED BY PERSONS OTHER THAN AUTHORIZED SERVICE
PERSONNEL.
E-18
Warranty/Customer Satisfaction
AUDit Reference Manual
2.DAMAGE CAUSED BY ACTS OF GOD THAT INCLUDE, BUT ARE NOT LIMITED
TO, HAILSTORMS, WINDSTORMS, HURRICANES, TORNADOES, SANDSTORMS,
LIGHTNING, FLOODS AND EARTHQUAKES.
3.DAMAGE UNDER CONDITIONS CAUSED BY FIRE OR ACCIDENT, BY ABUSE OR
BY NEGLIGENCE OF THE USER OR ANY OTHER PERSON OTHER THAN LD, BY
IMPROPER INSTALLATION, BY MISUSE, BY INCORRECT OPERATION, BY
“NORMAL WEAR AND TEAR”, BY IMPROPER ADJUSTMENT OR ALTERATION, BY
ALTERATIONS NOT COMPLETED BY AUTHORIZED SERVICE PERSONNEL, OR BY
FAILURE OF PRODUCTS PARTS FROM SUCH ALTERATIONS.
4.COSTS OF REPAIRING DAMAGE CAUSED
MAINTENANCE OR UNAUTHORIZED REPAIR.
BY
POOR
OR
IMPROPER
5.COSTS OF MODIFYING THE PRODUCT IN ANY WAY ONCE DELIVERED TO THE
BUYER, EVEN IF SUCH MODIFICATIONS WERE ADDED AS A PRODUCTION
CHANGE ON OTHER PRODUCTS MADE AFTER THE BUYER'S PRODUCT WAS
BUILT.
Authority to Alter This Limited Warranty. No agent, representative, distributor, or authorized
dealer of LD has any authority to alter the terms of this Limited Warranty in any way. This Limited
Warranty may be altered only in a writing signed by an authorized officer of LD.
AUDit Reference Manual
Warranty/Customer Satisfaction
E-19
E-20
Warranty/Customer Satisfaction
AUDit Reference Manual
AUDIOMETER CALIBRATION SYSTEM USER MANUAL
Connecting the PC .................................. 5-3
Connecting to the 824 ............................ 5-3
Connecting to the SLM .......................... 4-4
Coupler for Larson-Davis Mastoid ........ 3-7
Coupler Initial Inspection ....................... 5-5
Coupler SPL Calibration ........................ 5-8
Creating a Database ................................ 2-1
Creating or Editing a Certification
Paragraph ................................................ 17-8
Cross Talk Test ....................................... 11-1
Crosstalk Measurement Screen .............. 11-2
Customer Service ................................... 1-4
Numerics
824-AUD Firmware ................................ 18-1
A
AEC101 IEC 318 Coupler ...................... 5-13
Ambient Noise Level Test ...................... 4-1
American National Standard .................. 4-1
Any Level-a Screen ................................ 18-4
Artifical Mastoid Response .................... 2-12
Assembling the system ........................... 4-2
ambient noise level measurement ... 4-3
Audiometer Description Screen ............. 3-12
Audiometer Measurements ..................... 17-13
Audiometer Test Notes ........................... 16-2
Comments Tab ................................ 16-3
Visual Check Tab ............................ 16-2
Audiometer Test Screen ......................... 3-1
Audiometer Test Setup ........................... 3-1
Audiometers Tab .................................... 3-12
D
Database Functions ................................ 17-13
Decibel ................................................... D-1
Department of Defense
level ................................................. D-3
Detector .................................................. D-3
Distortion Test ........................................ 9-1
Duration
measurement ................................... D-7
B
B&K 4930 .............................................. 5-28
Bone Vibrator ......................................... 3-17
Booth Test .............................................. 4-1
Booth Test Data ...................................... 17-15
Broad Band Masking .............................. 14-1
Broad Band Masking Measurement
Screen ..................................................... 14-1
Broad Band Noise Masking Test ............ 14-1
Browsing for a Certification Paragraph .. 17-9
E
Earphone Transducers ............................ 6-2,
7-2
Earphones ............................................... 3-14
Entering Artificial Mastoid
Information ............................................. 2-11
Entering Calibrator Information ............. 2-7
Entering Instrumentation ........................ 2-4
Entering Microphone Information ......... 2-8
Entering Preamplifier Information ......... 2-14
Entering Preferences .............................. 2-15
Entering SLM Information ..................... 2-5
Equipment for Booth Test ...................... 4-2
esting Supra-Aural Earphones ................ 5-10
Exporting Data ....................................... 17-11
C
Calibration .............................................. 4-5,
6-1, 7-1
glossary ............................................ D-1
Calibrator ................................................ 4-9
Calibrator Information ............................ 2-7
Certificate Preview Screen ..................... 17-9
Certification Paragraph Dialog ............... 17-7
Change Database .................................... 2-1
Client Survey Cards ................................ 1-4
Communications ..................................... 2-17
Connect Menu ........................................ 4-4
F
Far Field ................................................. D-3
acoustic ............................................ D-3
geometric ......................................... D-4
i
AUDIOMETER CALIBRATION SYSTEM USER MANUAL
FFT Mode ............................................... 18-5
FFT Screen ............................................. 18-5
File Menu ................................................ 1-11
Formatting Conventions ......................... 1-4
Free field ................................................. D-4
Frequency
band pass filter ................................ D-4
glossary ............................................ D-4
Hz, rad/sec ....................................... D-4
Frequency Modulation Measurement
Screen ..................................................... 12-1
Frequency Modulation Test .................... 12-1
Frequency Test ....................................... 7-1
Frequency Test with Earphone Transducers 7-2
G
Getting Started ........................................ 1-7
H
HA-1 Mic Tab ........................................ 3-10
HA-2 Mic Tab ........................................ 3-11
Hardware Requirements ......................... 1-7
Harmonic Distortion Measurement
Screen ..................................................... 9-2
Hearing Level Test ................................. 6-1,
6-2
Hearing Level Test with
Bone Vibrator ......................................... 6-6
Hearing Level Test with Speakers .......... 6-10
Help ........................................................ 1-8
Help Menu .............................................. 1-14
High Frequencies Tab ............................. 3-13
I
Icon Bar .................................................. 1-14
IEC 318 Mic Tab .................................... 3-10
IEC 711 Mic Tab .................................... 3-10
Initial Configuration ............................... 2-1
Installation Options ................................ 1-7
Instrument Noise .................................... 4-12
Instrumentation Menu ............................ 2-4
ii
L
Leq
glossary ........................................... D-3
Level ....................................................... D-6
Dept of Defense .............................. D-3
Linearity Measurement Screen ............... 8-1
Linearity Test ......................................... 8-1
Low Frequencies Tab ............................. 3-13
M
Main Measurement Screen ..................... 6-1,
7-1
Main Menu Bar ...................................... 1-11
Mastoids Information ............................. 2-11
Measurement Location ........................... 4-7
Measurement Report .............................. 17-3
Mic Test .................................................. 15-4
Mic used to calibrate the SLM ............... 3-7
Microphone
guidelines ........................................ D-7
what it measures .............................. D-8
Microphone Frequency Resoponse ........ 2-9
Microphone Information ........................ 2-8
Microphones ........................................... 3-9
capacitor .......................................... D-7
electrit .............................................. D-7
uses .................................................. D-7
Model 820
Glossary, App C .............................. D-1
N
Narrow Band Level Measurement
Screen ..................................................... 13-1
Narrow Band Level Test ........................ 13-1
Narrow Band Level Test with
Earphone Transducers ............................ 13-1
Narrow Band Level Test with
Speakers ................................................. 13-5
NBS 9A Mic Tab .................................... 3-10
Near Field
acoustic ............................................ D-9
geometric ......................................... D-10
glossary ........................................... D-9
AUDIOMETER CALIBRATION SYSTEM USER MANUAL
Noise ....................................................... 4-12
ambient ............................................ D-10
Background ..................................... D-10
dose(D) ............................................ D-10
glossary ............................................ D-10
pink .................................................. D-10
white ................................................ D-10
Select Microphones Screen .................... 3-9
Select Test Equipment
Calibrator Tab ................................. 3-5
Mastoid Tab .................................... 3-6
Preamp Tab ..................................... 3-8
SLM Tab ......................................... 3-4
Select Test Equipment Screen ................ 3-4
Selecting a Database ............................... 2-1
Selecting the 824-AUD Operation
Mode ....................................................... 18-2
SLM Calibration ..................................... 4-5
SLM information .................................... 2-6
SLM Menu ............................................. 1-13
SLM+RTA Live screen .......................... 18-3
SLM+RTA Mode ................................... 18-3
Software Installation .............................. 1-7
Software Requirements .......................... 1-7
Sound
average level (lavg) ......................... D-1
energy average(Leq) ....................... D-13
fixed average ................................... D-12
glossary ........................................... D-11
impulse ............................................ D-13
instantaneous ................................... D-12
intensity(l) ....................................... D-14
moving average ............................... D-11
pressure ........................................... D-11
sound pressure level(SPL,Lp) ......... D-12
unweighted peak ............................. D-13
weighted peak ................................. D-14
Sound Pressure Level (see Sound) ......... D-12
Sound Speed ........................................... D-14
Spectrum
frequency ......................................... D-14
Speech Measurement Screen .................. 15-1
Speech Noise Test .................................. 15-7
Speech Test ............................................ 15-1
Speech Test with Bone Vibrator ............ 15-8
Speech Test with Earphone
Transducers ............................................ 15-3
Speech Test with Speakers ..................... 15-10
Starting the software ............................... 1-10
Status Bar ............................................... 1-15
Stored Measurements Database
Functions ................................................ 17-13
O
Open Air Mic Tab .................................. 3-11
P
Performing the Booth Test ..................... 4-7
Preamplifier Information ........................ 2-14
Preferences Menu ................................... 2-15
Print Dialog Box ..................................... 17-6
Printer ..................................................... 2-3
Printer Setup Menu ................................. 2-3
Printing a Certificate ............................... 17-6
Printing a Report ..................................... 17-1
Pulse Measurement ................................. 10-2
Pulse signal envelope ............................. 10-1
Pulse Tests .............................................. 10-1
Pulse Tone Definitions
Fall Time ......................................... 10-1
Frequency ........................................ 10-1
Off Time .......................................... 10-1
On Time ........................................... 10-1
On/Off Ratio .................................... 10-1
Rise Time ........................................ 10-1
Width ............................................... 10-1
Pulse/FM Mode ...................................... 18-7
Pulse/FM-a Screen .................................. 18-7
Pulse/FM-b Screen ................................. 18-8
R
Report Menu ........................................... 1-13
Reports and Data Base Functions ........... 17-1
Responses ............................................... 2-12
RS232 Port .............................................. 2-16
S
Saving the Booth Test ............................ 4-11
iii
AUDIOMETER CALIBRATION SYSTEM USER MANUAL
Suspecting Instrument Noise .................. 4-12
SYS008 ................................................... 1-6
SYS009 ................................................... 1-5
System Printer ........................................ 2-3
System SPL Calibration ......................... 4-5
T
Tape/CD A and Tape/CD B Test ............ 15-5
Test Configurations ................................ 5-2
Test Equipment ....................................... 3-4
Test Equipment Screen ........................... 3-4
Test Location .......................................... 3-2
Test Location Screen .............................. 3-3
Test Menu ............................................... 1-12,
3-1
Testing Bone Vibrators ........................... 5-24
Testing Circumaural Earphones ............. 5-20
Testing Supra-Aural Earphones ............. 5-18
THD Definition ...................................... 9-1
Time
weighting ......................................... D-14
transducers .............................................. 5-2
U
Uninstalling ............................................ 1-9
Unpacking and Inspection ...................... 1-4
V
Vibration ................................................. D-14
View Menu ............................................. 1-12
W
Warranty Registration ............................ 1-4
Wavelength(l)
glossary ............................................ D-14
Wavenumber
glossary ............................................ D-15
Weighting
frequency ......................................... D-5
time .................................................. D-14
Window’s compatability ........................ 1-2
iv