1
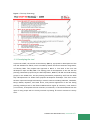
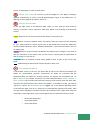
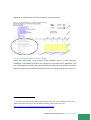
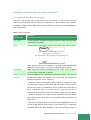
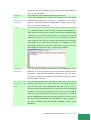
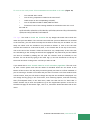
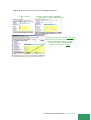
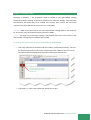
Part I
PLANNING AND BUDGETING TOOL, USER MANUAL
1
List of abbreviations
ACSM advocacy, communication and social mobilization
ARI annual risk of infection
ART antiretroviral therapy
CTBC community (involvement in) tuberculosis care (and prevention)
CPT co-trimoxazole preventive therapy
COPD chronic obstructive pulmonary disease
DOTS the basic package that underpins the Stop TB Strategy
DST drug susceptibility testing
DTP diphtheria, pertussis (whooping cough) and tetanus vaccination
GNI gross national Income
GF Global Fund
GCC Generic Cost Category
GLC Green Light Committee
HIV human immune deficiency virus
HIV/AIDS human immune deficiency virus/acquired immune deficiency syndrome
IC infection control
IPT&E monitoring and evaluation
KAP knowledge, attitude & practice -surveysMDG Millennium Development Goal
MDR multidrug-resistant (TB)
MOH Ministry of Health
NSA national strategy application (to the Global Fund)
NGO non-governmental organization
NTP national TB programme
OR operational research
PAL practical approach to lung health
P&B TB planning and budgeting tool
PDR People’s Democratic Republic
PLWHA or PLWA people living with HIV AIDS
PPM public-private public-public mix
PMTCT prevention of mother-to-child transmission
R&R recording and reporting
STB Stop TB
TB tuberculosis
TBCAP Tuberculosis Coalition for Technical Assistance
TRP technical review panel
UN United Nations
PLANNING AND BUDGETING TOOL, USER MANUAL
2
UNAIDS The United Nations Joint Programme on HIV/AIDS
UNDP United Nations Development Programme
UNFPA United Nations Population Fund
UNPD United Nations Population Division
US$ United States Dollar
UVGI ultraviolet germicidal irradiation
UV ultraviolet
VCT voluntary counseling and HIV testing
WHO World Health Organization
WHO/EIP World Health Organization/Evidence and Information for Policy
XDR extensively drug-resistant (TB)
PLANNING AND BUDGETING TOOL, USER MANUAL
3
Table of contents
Acknowledgements……………………………………………………………………………………………..………………p.5
Contacts for user support……………………………………………………………………………………………………p.5
1 Introduction………………………………………………………………………………………………………………………p.6
2 Background and Objectives…………………………………………………………………………………………….p.7
2.1 Developing the tool………………………………………………………………………………………………………..p.8
2.2 Countries using the tool………………………………………………………………………………………………….p.9
3 Description of the tool…………………………………………………………………………………………………..p.11
3.1 Main advantages…………………………………………………………………….………………………………………p.11
3.2 Methods………………………………………………………………………………………………………………………….p.11
3.3 Assumptions……………………………………………………………………………………………………………………p.13
3.4 Default values……………………………………………………………………………………………………………...p.13
3.5 Key features……………………………………………………………………………………………………………….…p.16
4 Requirements for use…………………………………………………………………………………………………….p.21
4.1 Prerequisites…………………………………………………………………………………………………………………p.21
4.2 Data requirements…………………………………………………………………………………………………………p.22
4.3 Who should fill in the tool…………………………………………………………………………………………….p.22
5 Hands on the tool…………………………………………..................................................p.23
5.1 Open the tool…………………………………………………………………………………………………………………p.23
5.2 Enable macros and choose the correct security setting………………………………………………p.24
5.3 Start navigating: Welcome page and beyond……………………………………………………………….p.25
5.4 Need to customize the intervention worksheet?.............................................p.35
Annex…………………………………………………………………………………………………………………………………p.45
PLANNING AND BUDGETING TOOL, USER MANUAL
4
Acknowledgements
This manual was produced by Inés García Baena. Overall coordination was provided by
Katherine Floyd. The manual was produced under the overall guidance of Marcos Espinal,
Executive Secretary of The Stop TB Partnership.
The manual was peer-reviewed, tested or edited by Pamela Baillie, Victoria Birungi,
Christopher Fitzpatrick, Katherine Floyd, Andrea Pantoja and Suzanne Scheele. The cover
was designed by Tom Hiatt (Original pictures: WHO/TDR/Crump).
Contacts for user support
Christopher Fitzpatrick, [email protected]
Katherine Floyd, [email protected]
Inés García Baena, garcí[email protected]
Andrea Pantoja, [email protected]
World Health Organization
WHO/TB/TME
20, Avenue Appia
CH-1211 Geneva 27
Switzerland
PLANNING AND BUDGETING TOOL, USER MANUAL
5
1 Introduction
Welcome to the TB Planning and Budgeting Tool (P&B). This tool has been designed to
provide a single forum to help countries develop comprehensive plans and budgets for TB
control within the framework provided by WHO's Stop TB Strategy and the Stop TB
Partnership's Global Plan to Stop TB, 2006-2015.
This tool should be used by TB programme planners at the country level, who can apply the
tool at either the national or sub-national level. The tool includes epidemiological,
demographic and financial historical data relevant to TB as well as projections of these up
to 2015. These are set as default values and can be changed by countries if necessary.
Targets for the coming years are set-out as a starting point and are linked with the relevant
interventions. Each worksheet represents one intervention of the Stop TB Strategy and
within each worksheet there is a ready-made list of likely inputs and activities to consider
for planning and budgeting. Countries should appropriate the use of the tool and adapt the
activities to cost within each intervention. However, should the country want to make use
of default data within the tool, please use the annually updated version available in the
Stop TB web site. The uploaded version will contain the latest epidemiological and financial
data available to WHO.
These are the key tasks you will be able to accomplish with ease when using the tool:
•
You have a solid National Strategic TB Plan, in line with WHO Stop TB Strategy, and
you would like to budget for each objective for one or several years
•
You are updating/revising your National Strategic TB Plan
•
You would like to use the outcome for:
Distributed
o
Your National Strategic TB plan and budget
o
WHO annual TB data collection
o
Donor application such as Global Fund grant submissions or NSA
through
the
web
site
of
the
Stop
TB
Department
http://www.who.int/tb/dots/planning_budgeting_tool/en/index.html,
the
at
WHO,
spreadsheet-
based tool, estimates costs of TB control from the provider perspective and collects sources
of funding for all interventions in line with the Stop TB strategy.
It is set-up to cover the period 2006 onwards. Users can decide which time frame they need
and want to budget for.
PLANNING AND BUDGETING TOOL, USER MANUAL
6
2 Background and Objectives
The tool was developed by the WHO Stop TB department with USAID funding. It is aimed at
addressing MDG 6 and the targets endorsed by the Stop TB Partnership (Box 1)
BOX 1: Health in the Millenium Development Goals 6
Goal 6
Combat HIV/AIDS, Malaria and Other diseases
Target 6c
Halt and begin to reverse the incidence of malaria and other major diseases
Indicator 6.9
Incidence, prevalence and death rates associated with TB
Indicator 6.10 Proportion of tuberculosis cases detected and cured under DOTS
Stop TB Partnership Targets
By 2005
At least 70% of people with sputum smear-positive TB will be diagnosed (i.e. under
the DOTS strategy), and at least 85% successfully treated. These targets were first set
by the World Health Assembly of WHO in 1991.
By 2015
Reduce prevalence of and death due to TB by 50% relative to 1990
By 2050
The global incidence of active TB will be less than 1 case per million population per
year
Budgets and plans resulting from the tool's use, can be used as the basis for resource
mobilization from national governments and donor agencies. The tool will save you time
and improve the quality of planning and budgeting, after a short period of learning about
the tool.
The tool is structured around the Stop TB Strategy and sets out the scale at which
interventions should be implemented in each year 2006–2015 to achieve 2015 MDG and Stop
TB Partnership targets, globally and for 7 regions.
The tool covers all interventions recommended in the WHO Stop TB Strategy (Figure 1),
that is interventions to detect and eradicate smear-positive, smear-negative, MDR and
HIV-TB patients in the world.
PLANNING AND BUDGETING TOOL, USER MANUAL
7
Figure 1. The Stop TB strategy
Source: Stop TB Department, WHO
.2.1 Developing the tool
In place since 2007, the tool has its own history! (Box 2). A proposal for development of the
tool was submitted to TBCAP, which is funded by USAID's TB Control Assistance Programme,
in February 2006. This proposal was approved in March. A first draft of the tool was
developed in April and May 2006. The starting point for development of the tool was the
planning frameworks prepared by the DOTS Expansion, MDR-TB, TB/HIV and ACSM working
groups for the Global Plan, and the planning frameworks prepared by staff from the WHO
Stop TB Department for Global Fund proposal development workshops. This final version
has been improved through field-testing in several countries including Indonesia, Cambodia,
Kenya, Malawi, Myanmar, and South Africa, and practical application of the tool during
planning workshops held in the Eastern Mediterranean region (9 countries), Latin America
(14 countries), Francophone African countries (16 countries). It has also benefited from the
input of many people who are closely involved in planning TB control activities at country
level.
PLANNING AND BUDGETING TOOL, USER MANUAL
8
Box 2. Development Process of the P&B
Date
Work done
April–May 2006
Draft version of tool developed:
Building on planning frameworks developed for Global Plan and STB workshops for
Global Fund proposal development
June–Dec 2006
Field-testing + practical application:
Malawi, Indonesia, Kenya, Somalia, South Africa, and regional planning workshop for
10 countries in Latin America
June–Dec 2006
Revisions and finalization based on field-testing
Oct–Dec 2006
Accompanying documentation and shared-point site prepared
Jan-07
Translation into French, Spanish, Russian
2007 and early 2008 Two sets of major updates/revisions, most recent to facilitate Rd 8 Global Fund
applications
2009
Regional planning workshops in Senegal (16 countries), Switzerland (training of
trainers), Uzbekistan (13 countries) and Cambodia
2.2 Countries using the tool
The Planning and Budgeting Tool can be used by 211 countries in the world.
To date, 27 countries are known to have used the tool to budget their national strategic
plans for TB control (Box 3). Cambodia, the Democratic Republic of the Congo, Ethiopia,
Kenya, Mozambique, Myanmar, Thailand and Zambia are examples of countries that have
developed particularly comprehensive and detailed plans and budgets using the tool. Most
of the countries that have attended the workshops have used the tool to budget at least
some of the components of the Stop TB Strategy. Others have used it to develop the budget
component of a Global Fund proposal. A recent example is Indonesia, whose proposal was
rated Category 1 (recommended for funding with no or minor clarifications).
In future, the tool could provide the basis for National Strategy Applications (NSAs) to the
Global Fund.
PLANNING AND BUDGETING TOOL, USER MANUAL
9
Box 3: User's previous experience of using the P&B Tool
AFRICA
Three planning and budgeting workshops of two to five days each with follow-up.
These have covered 39 of 46 African countries including all 9 "high-burden" countries
and 2 of the other very "high-incidence" countries (Malawi, Zambia). (March 2007,
September 2007, June 2009)
EUR
Training workshop for WHO staff in Country and Regional offices (early 2007).
Training workshop for Asian/Caucasus countries (September 2009)
LAC
- Planning and budgeting workshop with a very early version of the tool for 11
countries in May 2006.
- Training workshop for NTP managers and staff, regional consultants and WHO staff
in regional office; in total 7 countries participated. (April 2008)
SEAR
Planning and budgeting workshop of five days for NTP managers and staff of 10
countries, including 4 "high-burden" countries (April 2008)
WPR
Training workshop for NTP managers and staff as well as WHO regional and country
staff; 3 countries participated, including 2 "high-burden" countries. (August 2007).
Training workshop for Cambodia's NTP national and regional TB Programme staff
(September 2009)
In all regions, almost all countries that have been trained have used at least some parts of
the tool to prepare donor applications.
Other examples of how the tool has been
disseminated include presentations of
workshops for the development of Global
Fund proposals, presentations at
international meetings and regional NTP
manager meetings; training workshops for
technical partners and staff from WHO
regional and country offices; inclusion of
the tool at the international course on
management and budgeting organized
annually by the International Union
Against Tuberculosis and Lung Disease,
and dissemination of a fact sheet.
PLANNING AND BUDGETING TOOL, USER MANUAL
10
3 Description of the tool
3.1 Main advantages
The tool is called "planning and budgeting" to highlight that plans should include a budget
but sometimes don't. Budgets should be based on and in line with plan goals, objectives
and planned activities.
The main advantages of using the tool are:
(i) if you have a clear plan for your national TB strategy, the tool will help you implement
it by presenting your financial requirements
(ii) it allows plans and budgets to be set out comprehensively in one place in a standardized
format
(iii) it offers a ready-made list of inputs and activities to consider when planning and
budgeting for each component of the Stop TB Strategy
(iv) it includes epidemiological and demographic projections as well as information about
the targets set out in the Global Plan
(v) it provides a solid foundation for resource mobilization from national and local
governments as well as donors such as the Global Fund
(vi) it is easy to revise or update plans and budgets because it is set out in Excel
(vii) it automatically produces summary analyses in the form of figures and tables
Overall these benefits should help you improve the quality of planning and budgeting
3.2 Methods
Costing Methods
Costs are calculated following an ingredients approach (Figure 2), where quantities (Q)
are multiplied by the unit prices (Cu). Default data, underlying assumptions and formulas
used within the tool, are explained herein.
Figure 2: Budgeting method
Ingredients approach
Quantity required
x
Cost per patient
Intervention Cost
Funding Gap
Available funding
PLANNING AND BUDGETING TOOL, USER MANUAL
11
Quick versus Detailed method. The tool offers two methods to plan and budget for a given
intervention: the detailed and the quick method (Figure 3). Before you start planning and
budgeting for activities within an intervention, you will be asked to choose a method
within each intervention worksheet.
Figure 3: Choice of methods within the tool
Choose a method
•
The quick method does not calculate the intervention cost of individual activities but
rather calculates the total cost of that intervention. It is a top-down approach using
default budget or cost values that are country specific and that you will be providing.
Where there are default values, these come from data reported by countries to
WHO/STB annually and from the Global Plan to Stop TB, 2006-2015. The user will also
need to enter the estimated number of patients. The total cost of that intervention is
automatically calculated. It is a broad estimate of the intervention's cost.
•
The detailed method, which is the method we recommend, calculates the cost of
individual subcomponents of the main intervention. It is a bottom-up approach. If users
choose the detailed method, they need to input quantities and prices for each activity.
PLANNING AND BUDGETING TOOL, USER MANUAL
12
In some cases, within the detailed method there are default values for prices or
quantities which users can choose to use as input variables.
Within a given worksheet, it is only possible to use one of these two alternative
methods, although across the tool as a whole it is possible to use a mixture of the two
approaches (e.g. quick method to cost first-line drugs, detailed method to cost
treatment for MDR-TB).
3.3 Assumptions
Behind calculations for the quick or detailed method, there are often in-built assumptions,
flagged by a pop-up or explanation box as you position yourself on the cell containing them
(Figure 4).
If you disagree with the in-built assumption, please amend the formula within the cell or
cells related to that assumption. Box 4 shows an example of an in-built assumption to
estimate the number of smears for the quick method to cost intervention 1.2, improving
diagnosis.
Figure 4. Example of a built-in assumption for improving diagnosis (Objective 1.2)
Built-in
assumption
PLANNING AND BUDGETING TOOL, USER MANUAL
13
3.4 Default values
Default values can be found in each intervention worksheet, identified in color code "blue".
There are three types of default data in the tool: epidemiology, cost values and laboratory
packs that include quantities and prices of laboratory components.
Can you change default data? If so where?
To modify any of the default data that appears in blue within the intervention worksheet,
you will change the data on the corresponding cell within that intervention. Since you need
to modify a cell's content, you will need to unprotect the worksheet first (section 5.3 and
Figure 17). Please note that all default data is updated 1 by WHO during the first quarter of
every year. The newest versions of the tool are made available through the web site of the
Stop TB Department at WHO.
Below is an explanation of the three types of default data.
A. Epidemiology data
a. population projections
b. estimated TB incidence
c. country notifications up to year n-2
d. Regional projections of trends in TB incidence from 2006 to 2015 for the
region of which the country is a part (Global Plan Estimates)
e. TB/HIV data, such as "Estimated number of TB patients to be tested and
counselled for HIV (Global Plan Estimates)"
Figure 5. Epidemiology: estimating the number of patients to be treated (example:
DR Congo)
Default data
Notifications
up to year n-2
And Projections
Year n onwards
Population
(UNP division)
Calculations
(in purple)
Not to be
changed
WHO annually updates default data in worksheets such as "_epibyregion" that feed into the
intervention worksheets. While users can modify default data within intervention worksheets, the
original epidemiology or financial data, usually hidden, should not be modified by the users.
1
PLANNING AND BUDGETING TOOL, USER MANUAL
14
B. Cost values for some interventions estimated by the Global Plan or by other sources, for
example cost of GDF drugs (Figure 6), cost of office equipment, cost of some PPM and PAL
inputs, cost of a laboratory package.
Figure 6. First-line drugs for category I and III patients, cost of GDF drugs.
Default data
Cost of GDF
drugs
C. Number of items and their cost for budgeting in detail Laboratories (Figure 7).
This default data was estimated by the WHO laboratory sub-group of the DOTS expansion
working group. To comply with WHO recommendations of laboratory content, in the
detailed method, you have the option of clicking into the "List of items". Here appears a
list of equipment, chemicals and consumables for different types of laboratories
(microscopy, molecular, DST etc). Quantities and unit costs are often provided except for
consumables and the user may decide to amend the quantities to better reflect the
composition of her laboratory. Unit costs are also reference prices so the user will most
probably want to include local prices. For further details, please see figure 7 below and
read about "Improving diagnosis" in Part 2.
PLANNING AND BUDGETING TOOL, USER MANUAL
15
Figure 7. Using the "list of items" to budget for your laboratories
3.5 Key Features
The tool is structured according to the major components and subcomponents of the Stop
TB Strategy (Figure 1) and includes default values that are consistent with the targets set
in the Global Plan. It is also consistent with the Global Fund's definition of the 17 Service
Delivery Areas. It produces a standard set of summary tables and figures, including
summary tables by Generic Cost Categories, that are needed for Global Fund grant
proposals.
The content of the tool is indexed in the Welcome Page, it includes:
•
Menu system to choose your country
•
Menu system to choose which component of TB control to plan and budget for
•
Status bar
•
User guide that includes a colour code scheme
•
Application options feature for un-protecting or protecting sheets, displaying row
and column headers, displaying worksheet headers, and showing or hiding
background data (mentioned above)
•
Summary tables and figures
PLANNING AND BUDGETING TOOL, USER MANUAL
16
The following is an explanation of each of the above items.
3.5.1 Menu system to choose your country
In the Welcome Page you will find, a scroll down button that allows you to choose your
country (Figure 8).
Figure 8. Menu system to choose your country in the Welcome Page
The Welcome page is this page:
Scroll down and
Choose your country
This tool allows users to choose their country from the list of 212 built into the tool. These
default data for your country will automatically show throughout the tool. This action will
prompt:
i.
Epidemiological data
ii.
Demographic data
iii.
Historical financial data
iv.
Projections and default values.
3.5.2 Menu system to choose which component of TB control to plan and budget for.
When you open the Planning and Budgeting tool, by default you will first see the Welcome
Page which lists the main components of the tool (interventions, status bar, User guide,
Menu to choose the country, Application Options). In the Welcome Page, you have a list of
interventions and a list of reports and outcomes.
PLANNING AND BUDGETING TOOL, USER MANUAL
17
Figure 9. Menu system to choose a component to plan and budget and list of outcome
reports
nt
i
of
t
s
Li
ns
o
i
nt
e
v
er
me
o
tc
u
fo
o
t
s
Lis ort
p
re
Within the section "Interventions", you will find a budget statement showing NTP budgets
reported to WHO through the annual data collection form, followed by an epidemiology
section, and by the interventions or Service Delivery Areas (Global Fund).
3.5.3 The Status bar, appearing in a column in the Welcome Page (Figure 10) shows the
status of work done within the tool. By default it is red and incomplete! As you make
progress through your budget and mark your work status, eventually a green completed
status bar will appear!
Status
Figure 10. The status bar
Partially completed
Please select an intervention
Current situation: budget reported 2006
Epidemiology: TB patients to be treated
1.1 Political commitment (links to ACSM)
1.2 Improving diagnosis
STATUS
P
Completed
Not Started
C
N
3.5.4 Outcome/Report tables and graphs
Once your work status shows that your interventions have been budgeted for the year or
years ahead, you will be able to use the Outcome/Report tables and graphs (Figure 9).
There are summary tables and graphs, costs by line item and funding source that appear for
PLANNING AND BUDGETING TOOL, USER MANUAL
18
each year for which the user has entered data (from one year up to 10 years). You may
access these tables by merely clicking on the title of the table on the bottom left corner of
the Welcome Page. Figure 11 provides a brief explanation of the tables and figures
automatically produced.
Figure 11. Reports/Outcome: brief description of tables and figures
A summary table showing the funding available and the
funding gap (or a subset of these years depending on the
years for which data have been entered), with sources of
funding broken down into the 6 major categories used
within the tool; A summary table of the budget for each
year 2008-2015 with inflation, as well as the table
showing funding sources with inflation;
A series of summary tables showing the budget for each
year 2008–2015 for the intervention and the budget for
the activities within the intervention;
A summary bar graph of the total costs of TB control,
broken down into 12 major components (some of the
subcomponents in the tool are combined for the
purposes of the figure);
A summary bar graph of the total costs of TB control,
broken down according to four major sources of funding
(the three levels of government funding are combined in
one category for presentational purposes) and remaining
funding gaps;
8 summary tables, one for each year 2008–2015, showing
the budget according to major line items in each year
and the sources of funding and funding gap for each line
item and overall. Line items correspond to the 6 major
components and related 18 subcomponents of the Stop
TB Strategy, which also correspond to the Service
Delivery Areas (SDAs) used by the Global Fund from
Round 7 onwards;
8 summary tables, one for each year 2008–2015, showing
the budget according to major line items in each year
and the sources of funding and funding gap for each line
item and overall. Line items correspond to those in the
annual WHO TB data collection form. With each table, a
summary (or reminder!) of the number of patients to be
treated in that year is also shown;
A summary table of the budget for each year 2008–2015
(or a subset of these years depending on the years for
which data have been entered), broken down according
to the 13 generic cost categories used by the Global
Fund from Round 7 onwards. The total costs of each
intervention by source of funding and their link to GCC,
are fed into the this table;
PLANNING AND BUDGETING TOOL, USER MANUAL
19
The total costs for TB control are the same regardless of the reporting table (Figure 12),
i.e. "Total costs for TB control" in summary table of costs by generic cost categories equals
"Total Budget" in NTP Budgets and sources of funding by line item according to the WHO
annual data collection.
Figure 12. Reports/Outcome: different tables and figures but same results
Summary table of costs by generic costs categori
US Dollars
Mozambique
AFRhigh
2006
Summary of total costs by Global Fund generic co
US Dollars
Human resources
Technical and management assistance
Training
Health products and health equipment
Medicines and pharmaceutical products
Procurement and supply management cost
Infrastructure and other equipment
Communication materials
Monitoring and evaluation
Living support to clients
Planning and administration
Overheads
Other
$
$
$
$
$
$
$
$
$
$
$
$
$
1,826,490
125,000
3,706,390
487,549
-
$
6,145,429
NTP Budgets and sources of funding by line item according to the WHO annual data colle
Mozambique
AFRhigh
2006
2007
2008
2009
2010
2011
2012
2013
2014
2015
Fiscal Year
Expected number of ss+ patients to be treated
Expected number of ss-/EP patients to be treated
2006
16,742
18,897
Budget Required
Total costs for TB control
Identical!
Pursue high quality DOTS expansion and enhancement
1.1 Political commitment
1.2 Quality assured bacteriology - laboratory supplies and equipment
1.3 Patients' support
1.4 Drug supply and management system - First-line drugs and drug management
1.5.1 M&E, including impact assessment
1.5.2 Programme management and supervision activities
1.5.3 Human Resources - Staff working on TB control and training
Address TB/HIV, MDR and other challenges
2.1 Collaborative TB/HIV activities
2.2.1 Second-line drugs
2.2.2 Management of MDR-TB (excluding second-line drugs)
Contribute to health system strengthening
3.2 PAL
Engage all care providers
4.1 PPM
Empower people with TB and communities
5.1 ACSM (except advocay)
5.2 Community involvement in TB control
Enable and promote research
6.1 Enable and promote research - OR
OTHER
TA and Other
Total Budget
$
$
$
$
$
$
$
125,000
1,923,444
1,826,490
$
$
$
2,270,495
-
$
-
$
-
$
$
-
$
-
$
$
6,145,429
PLANNING AND BUDGETING TOOL, USER MANUAL
20
4 Requirements for use
4.1 Prerequisites
This tool does not substitute for the strategic planning process. It does, however, help with
resource planning and with revising the strategic plan, if necessary, in light of resource
constraints (Figure 13). Strategic planning is the process of defining your national TB
strategy, or objectives - bringing the Global Plan down to the country level. In this sense,
the strategic plan should guide the resource plan.
However, strategic planning is also about making decisions on allocating resources,
including finances and workforce, between the objectives. For this reason, the strategic
plan and resource plan are often arrived at through an iterative process -- whereby once
the resource requirements are estimated for each objective, these may need to be revised
in light of resource constraints.
Therefore, before proceeding with this tool, in a first-pass strategic planning process, you
should have already:
1. Aligned your goals and objectives with the Stop TB Strategy and Global Plan
2. Prepared your road map with:
A. Progress realized
B. Targets for 20XX (year of planning)
C1. Main challenges
C2. Main strategic approaches
3. Set mid-term targets to be achieved within five years or less; and
4. Developed a logical framework of strategies and activities to be undertaken to
achieve the mid-term targets.
In the presence of a strategic plan, a resource plan has many benefits. It can confirm
whether or not the identified targets are achievable, and if they are not, the plan can
provide the evidence for further debate. A plan can be used to express a clear and
commonly understood approach of the TB strategy.
Do not worry if you do not yet have detailed lists of inputs required to undertake the main
activities. The tool will help you to make a comprehensive inventory of these! Once you
have a clear strategy, it will be much easier to come up with the list of activities required
to pursue your objectives. All objectives and activities will be linked to your strategy and
the priority areas you have identified prior to starting planning and budgeting. Indeed, only
PLANNING AND BUDGETING TOOL, USER MANUAL
21
once the objectives, strategies and activities are comprehensively and coherently defined
will you be fully prepared to plan and budget with this tool.
Figure 13. Budgeting in the management cycle
Management cycle
Assessment
Review, evaluation
Supervision
Monitoring
Planning
Appraisal, budgeting
$
Implementation
In sum, the user should set a plan and actions to achieve the Stop TB Strategy, prior to
using the Planning and Budgeting Tool.
In the remaining sections we will explain the requirements for use, followed by some
instructions on getting your hands on the tool and finally an explanation of the basic
structure of the tool and of each intervention's worksheet.
4.2 Data requirements
You will be providing data for case detection rate, unit costs, input quantities and
intervention costs. Data requirements include:
•
Data for case detection rate, unit costs, input quantities and intervention costs
•
Basic computer skills and familiarity with Excel if possible
•
Windows and Excel installed in your PC
•
A readiness to invest some time in the use of tool
4.3 Who should fill in the tool?
•
Someone with an excellent understanding of the TB control situation and the
interventions needed to achieve goals, objectives and related targets
•
Programme managers and planners for TB control at National and subnational
levels.
PLANNING AND BUDGETING TOOL, USER MANUAL
22
5 Hands on the tool
5.1 Open the tool
Planning and Budgeting for TB control is a single Excel file. Please click on the following
link http://www.who.int/tb/dots/planning_budgeting_tool/en/index.html (Figure 14).
The Excel file you have found in the link tb_budgeting_template.xls is designed to be much
like a “master” blank form used to reproduce copies for data entry. It is best to create
copies of the Planning and Budgeting for TB control before using it (either by creating
copies on your computer desktop, or by opening the Excel file and saving it under a new
name before you start using it). This way, you may enter different sets of data, save and
name your template files individually, while keeping the original tool as a master file,
intact for future use.
Figure 14. Opening the P&B posted on the web
PLANNING AND BUDGETING TOOL, USER MANUAL
23
5.2 Enable macros and choose the correct security setting
When you first open the tool, a Security Warning might appear, and you will be asked to
enable or to disable macros. In order to operate the tool correctly, you must click on the
box “Enable Macros” (Figure 15b). If a warning message appears with “Macros are
disabled”. Close the planning and budgeting tool.
Figure 15a. As you open the tool, this warning message might pop up
Open a new book. Then, in Excel, go to the Tools menu and choose Macro, and then under
Macros choose Security (Tools-Macro-Security). Then select "medium" for your security level
(if set to High or Very high, the tool will not work). When you reopen the tool, you will be
asked if you want to enable or disable the macros. Always choose to "Enable macros".
Figure 15b. How to enable macros to use the Planning and Budgeting Tool
PLANNING AND BUDGETING TOOL, USER MANUAL
24
5.3 Start navigating: Welcome page and beyond
BOX 4. Using the Planning and Budgeting Tool: summary of basic steps
Introduction
Review relevant strategy(ies) and objective(s) from the Stop TB Strategy
Plan for inputs/resources for inputs/resources
Step 1 Choose your country as a country to plan and budget
Step 2 Go to the in-built User Guide
Step 3 Go to Application Options and click
Step 4 Complete the intervention worksheets
4a
Choose an intervention
4b
Plan
4c
Choose a method to budget for this intervention (quick or detailed)
4d
Choose an activity to cost
4e
Choose a budgeting period and start budgeting (Quantities, Unit Costs)
4f
Complete the sources of funding
4g
Check the link with GCC (Global Fund)
4h
Mark your work status
Step 5 Go to Reports and Outcomes: interpret results and revise your budgets if
need be! Back to menu
Use this button to go back to the main menu of the tool (The Welcome Page)
PLANNING AND BUDGETING TOOL, USER MANUAL
25
Figure 16: Main steps to use the Planning and Budgeting tool
4b
4a
4h
4c
PLANNING AND BUDGETING TOOL, USER MANUAL
26
4d
4e
4f
4g
5
The tool opens into a front page called the Welcome Page, which provides links to all the
worksheets in the tool. Figure 6 shows the Welcome Page and indicates with numbers 1 to
5, the steps to follow to use the tool.
PLANNING AND BUDGETING TOOL, USER MANUAL
27
Here is an explanation on each of these steps.
1
Choose your country as a country to plan and budget for. The "Region" heading is
updated automatically. It refers to the TB epidemiological region of the Global Plan, i.e.
AFR High is Africa high HIV prevalence and so on.
2
Go to the in-built Guide
On the top right corner of the Welcome page, there is a user guide you may access by
clicking. It includes a colour scheme for data entry. Below is the meaning of the different
colours.
Yellow: Read the cell on the left and write the answer in the yellow cell.
Blue: Numbers in blue are default values. This means, these are values we have estimated
for your country based on various sources such as the Global Plan to Stop TB, 2006-2015,
the annual WHO TB control report, UNAIDS and WHO/EIP. If you have better data, feel free
to change them.
Purple: Numbers in purple indicate calculations and should not be changed. If you want to
edit the information of non-yellow cells, you will receive a warning and an explanation on
how to change it if you wish so.
Turquoise: Boxes in turquoise include useful guidance notes as part of the In-built user
guide.
Black: Epidemiological and financial results will show in black font
3
Go to Application Options
In the default version of the tool, the sheet tabs as well as the column/row headers are
hidden for presentational purposes. Furthermore all sheets are protected and the
background data are hidden for security purposes. To improve user-friendliness and be
able to add rows for example so that you can insert duplicate tables, modify contents or
enter formulae that includes links with other sheets you will need to show the sheet tabs,
unprotect the sheets and show the column/row headers. To be able to do this, you need to
"unprotect" a sheet. The Application options (Figure 17), at the bottom right hand corner
of the Welcome Page (click on it), allows you to simultaneously unprotect all sheets, show
row and column headings in all sheets and show all worksheet titles, rather than doing this
repeatedly in each page/sheet. Four buttons appear and you should press three of them:
o
"Show/Hide sheets tabs"
o
"Show/Hide header
o
"Show/Hide sheets"
PLANNING AND BUDGETING TOOL, USER MANUAL
28
Please note that there is a fourth button Show/Hide data option is set to "Hide". The data
that are hidden and protected are data for default values (ref. Default values). You should
not need to work on these sheets, and it is advisable not to "Show" the data or to modify
the data. If you want to change some of the values for your country, please change them in
the intervention worksheet where they appear.
Figure 17: Application Options
1°: Please select your
country
Planning & Budgeting for TB Control
Mozambique
AFRhigh
2°: USER GUIDE - CLICK HERE!
Please select an intervention
STATUS
Current situation: budget reported 2006
Epidemiology: TB patients to be treated
1.1 Political commitment (links to ACSM)
1.2 Improving diagnosis
1.3 Patient support
1.4 First-line drugs procurement and management
1.5.1 M&E
1.5.2 Programme management and supervision
1.5.3.1 HRD: Staff
1.5.3.2 HRD: International technical assistance
1.5.3.3 HRD: Training
2.1 Collaborative TB/HIV activities
2.2 MDR-TB
2.3.1 High risk groups
2.3.2 Infection control
2.3.3 Childhood TB
3.2 PAL
4.1/4.2 Involving all care providers: PPM/ISTC
5.1 ACSM
5.2 Community involvement
6.1 Operational research
Other
Use of general health services
N
C
N
N
P
N
N
N
N
N
N
N
N
N
N
N
N
C
N
N
N
N
For your information, this workbook allows
countries to plan and budget for TB control
in line with the Global Plan to Stop TB
2006-2015 and the Stop TB Strategy. It is
a flexible tool that you can adapt to your
own circumstances if needed.
To Navigate, open the sheet you want to
see and come back to the main menu by
pressing the "BACK" button on the top
right hand side of the sheet. Please take a
look at the "USER GUIDE" to familiarize
yourself with the colour code scheme and
the use of default values.
Click!
Reports / Outcome
Summary table of costs and funding sources
Summary table of costs by intervention and activity
Total costs - Figure
Sources of funding - Figure
Total NTP budget and sources of funding by interventio
Total costs by generic cost category of the Global Fund
Version 3
>> Application Options <<
"Application Options"
Alternatively, you can unprotect sheets by going to the Tools menu, choosing Protection,
and then selecting "Unprotect sheet" (Tools-Protection-Unprotect Sheet). When you have
finished entering data, you can choose to protect the sheet (Tools-Protection-Protect
Sheet).
Closing/Opening the P&B Tool?
Please note that every time you open the tool you might need to go to Applications Options
because worksheet tags, headers and columns are automatically hidden, every time you
close the P&B tool.
4
Select an intervention. Plan and Budget.
Here is where you actually plan and budget for each intervention. Each intervention is
aimed at achieving the Stop TB Strategy and Global Plan Targets.
Accessing a worksheet is done through the menu system. On the Welcome page click on an
"intervention" button on the Welcome Page, and you will be directed to the desired
worksheet. You may choose one of the 21 interventions to cost (Figure 9). The tool allows
you to fill in the interventions in any order you may want using a menu system for
navigating through each worksheet, provided you complete the "epidemiology: TB patients
to be treated" in the first place because you will need to know the number of expected
patients to treat to start budgeting for every intervention. The order of the interventions
list follows the Stop TB Strategy. Please note that there is an alternative way to access a
PLANNING AND BUDGETING TOOL, USER MANUAL
29
worksheet and it is to simply unhide worksheet tags (in Applications Options) and then click
on the tab corresponding to the selected intervention.
Worksheet structure. As explained in the in-built guide, there is a common structure to
every intervention worksheet. (Figure 18)
Figure 18. Worksheet structure
Title of the intevention
Back to menu
Country Name
Region Name
List of activities within interventions
Use this button to return to
the Menu screen.
Click on the cell to go directly to the desired activity.
You can use this short menu to navigate within each
worksheet.
Years to plan for.
2006
2007
2008
2009
2010
2011
2012
2013
2014
2015
By default you will be presented with title of the intervention, sub-title of the
intervention and list of activities within interventions. You may edit any of these labels.
The titles refer to the objectives that you are about to cost.
As Figure 18 shows, each intervention worksheet is structured as follows:
1. STB Objective
On the top left corner of every worksheet you will find the STB Objective this intervention
is responding to and there will be an index of all the activities we suggest you cost for this
intervention.
2. Title of the intervention (within STB Objective)
The title of the intervention follows the wording of WHO's Stop TB strategy. This is what
you are budgeting for in this worksheet!
3. Method to budget- Choose a method to budget for this intervention.
You will have to choose from two mutually exclusive methods, the so-called "quick" or
"detailed" method (see section 3.2). The detailed method should ideally reflect the
specificity of your country's programme so feel free to re-label the items within each
activity so that they are tailored to your needs to achieve the objective.
4. List of activities within each intervention or Submenu
Choose an activity to cost and click on its title within the list (Figure 19). You will be
directed to the table corresponding to this activity. Alternatively you may scroll down and
go with your cursor to the selected table.
PLANNING AND BUDGETING TOOL, USER MANUAL
30
Figure 19. Navigating within an intervention worksheet
Click on the activity
Within each activity you will:
Choose a budgeting period
Choose an activity to cost and enter quantities and unit costs
5. Sources of funding
How will you fund the planned activities? Each intervention worksheet includes one table of
sources of funding, that you are requested to complete. There are four categories 2 :
Government, Loans, Global Fund and Other Grants (such as PEPFAR, USAID, DFID, CIDA etc).
Government is broken down by central, intermediate and local. Within each intervention,
you should fill in a table like the one shown on Figure 20 for each year you are budgeting
for.
The information collected will automatically feed into the Outcome Reports.
Please note that in the case of intervention 1.5 Monitoring and Evaluation there are two
tables to track the sources of funding due to the disparity in costs between Routine
Surveillance and Periodic Surveys and distinct sources of funding for each.
2
The user will not add nor label differently the categories of sources of funding
PLANNING AND BUDGETING TOOL, USER MANUAL
31
Figure 20. To complete the sources of funding for each intervention
6. Link with Global Fund Generic Cost Category
Within each intervention, at the bottom of the worksheet, there is a table showing a
breakdown of the budget by Generic Cost Categories of the Global Fund 3 (Figure 21). The
link is automatically set within this sheet provided sub-totals and totals within each activity
should be revised when formulas are inserted (for tips on revising formulas see section 5.4)
3
If you wish to visualize the link between the Stop TB Strategy, the 17 Service Delivery Areas of the
Global Fund and the List of Interventions within the Budget and Planning tool, read
http://www.who.int/tb/dots/planningframeworks/en/index.html.
PLANNING AND BUDGETING TOOL, USER MANUAL
32
Figure 21: Link of 13 GCC of Global Fund Proposal and the total cost of activities within
each intervention in the Planning and Budgeting Tool
7. Status of work done
Planning and budgeting takes time and you probably will need to revise your data before
work is complete. To monitor your progress, you may use the "status" button (Figure 22) to
evaluate the completion of planning and budgeting for each intervention.
Figure 22. The status button
This in turn will be reflected at the status bar in the Welcome Page (Figure 8)
8. Back to Menu. You might need to go back to the Welcome Page and to navigate to other
pages of the tool. Please use the "Menu" button.
PLANNING AND BUDGETING TOOL, USER MANUAL
33
Box 5. Using WHO TB P&B to apply for a Global Fund grant?
The WHO TB P&B is primarily designed to set out a comprehensive national plan and budget for TB
control, including identification of sources of funding and funding gaps. The tool has been used by
more than 50 countries, and WHO will continue to recommend that it is used to budget your national
strategic plan for TB control. The WHO P&B should be well-suited to the National Strategy
Applications (NSAs) 4 that the Global Fund will consider from 2009/2010 onwards, since NSAs will
involve submissions of national plans and associated budgets, with funding sought to close the funding
gap.
The WHO TB P&B is less well-suited to Global Fund proposals submitted up to and including Round 9.
These proposals typically include only parts of a national strategic plan (the unfunded components),
and to use the tool for such proposals either (i) those parts of the national plan that are already
funded must be removed, leaving only a description of the budget for the unfunded components or
(ii) the budget for the unfunded components of the plan must be entered in a new version of the tool.
The Global Fund budget template is an empty template designed to present a detailed budget for the
unfunded components of a national strategic plan to the Global Fund (i.e. it is expected that only the
inputs/activities and associated budget for which funding is sought from the Global Fund are
included). A major advantage of the template is that the TRP is familiar with it.
Our recommendation is that the Global Fund budget template is used to present budgets for R9
proposals. For those countries that have already used the WHO TB P&B, we suggest that you use this
as the basis for identifying the inputs/activities that still need to be funded, and then enter the
relevant budget data into the Global Fund template.
We would also like to take this opportunity to emphasize that both tools are best used after the
following have been conducted: a situational analysis to identify progress to date and remaining
major challenges/gaps in implementation; definition of targets to be achieved within five years; and
definition of the objectives and associated main activities that need to be to be implemented to
achieve the targets.
4
The national strategy application process is an initiative of the GF to enable countries to base their application
primarily on their National Strategic Plan. For countries whose strategy has been validated,
an applicant will only need to provide the Global Fund with the validated national strategy and some
minimal additional information (such as the existing financial contributions, to the strategy, the amount
sought from the Global Fund, and the results to which the funding sought is expected to contribute).
http://www.theglobalfund.org
PLANNING AND BUDGETING TOOL, USER MANUAL
34
5.4 Need to customize the intervention worksheet?
5.4.1 Refresh your Excel knowledge
Here are a few general tips to help you as you use the tool. In case you are not very
familiar with Excel, Box 6 shows some excel vocabulary (i.e. Menu, sheets, rows, columns,
worksheets, default values, applications options, status bar, formula etc) accompanied by a
brief explanation.
Box 6. Excel vocabulary
EXCEL
MEANING
VOCABULARY
User guide
In-built guideline accessible through the Welcome Page and the present
manual you are reading!
Menu
A Menu button allows to go navigate within pages and go back to menu
Within each worksheet you may use
this button to go back to
the switchboard and navigate through the tool
"Menu system" refers to the possibility to go back to the Welcome Page
and index of interventions, by merely pressing the "Menu" button.
Worksheets
Pages within the Planning and Budgeting Tool. There is one worksheet
for each major component of TB tool
Sheets, rows and
Excel spreadsheets are comprised of rows and columns. The rows are
columns
labeled with numbers—for example, row 4 or row 103. The columns are
labeled with letters—A, B,C, and so on.
• The place where a row intersects with a column is called a cell. Cells
are referred to by their column letter and row number. The first cell in
the top left corner of a worksheet is cell A1. If there are instructions to
go to a particular cell, for example cell C12, then this cell can be
found in the third column, twelve rows down from the top of the sheet.
• An Excel workbook can contain several worksheets. Each worksheet
has a name, which can be seen on the worksheet tab at the bottom of
your screen.
• The active worksheet is the one with its name highlighted in the row
of tabs at the bottom of the screen. If you need to go to a different
worksheet within the same workbook, then click with your mouse on
PLANNING AND BUDGETING TOOL, USER MANUAL
35
the name of the worksheet tab that you want, and Excel will move the
cursor to that worksheet.
Worksheets
One worksheet for each major component of TB control
Doing
Mostly, the symbols that you need to use in Excel are the same as the
calculations, use
mathematical symbols used in books or on calculators. One that is
of symbols
different is the symbol used for multiplication. In Excel, you use the *
sign (i.e. an asterisk) instead of x.
Formula
You can do calculations within Excel (you don't need to do a calculation
on a calculator and then enter the value in Excel). For budgeting, it is
likely that some calculations are going to be necessary. Instead of using
a calculator, you can enter the formula for the calculation that you
want to do in Excel. To do this, click on the cell where you want to
enter a formula. Then type the "equals" sign followed by your formula.
For example, if you know that the budget for a member of staff is
US$1000 per month while the tool is asking you to enter the cost of
that member of staff for one year, you can write =12*1000.
Automatic
If by any chance automatic calculations are not happening, do the
calculations
following: go to the Tools menu, then select Options, and then select
Calculation (Tools-Options-Calculation). Make sure that the option
"automatic" is selected, otherwise you may press the F9 key to refresh
the calculations manually
The
value
entered
valid
is
you
If this message appears when you enter a number into a cell, do the
not
following. The values that can be entered in some parts of the tool
have, in some cases, been deliberately restricted. This is to try to
prevent incorrect data being entered. If you are sure that the data that
you want to enter make sense/are correct, then you will need to
"undo" the restriction that has been imposed on these cells. You can do
this by highlighting the relevant cells using the mouse, then go to the
Data menu, choose Validation, and then make sure that "any value" is
the option selected under the heading "validation criteria" (DataValidation)
PLANNING AND BUDGETING TOOL, USER MANUAL
36
Dragging
values
When you want to enter the same value more than once, you don't
across a row and
need to keep typing in the same number (or formula). You can simply
down a column
use the mouse to drag the same value (or formula) across a row or
down a column. To do this, click at the bottom right hand corner of a
cell, and then drag the mouse across or down the screen. When
dragging formulae, cell references to a column heading will be changed
as you drag across a row (e.g. if the original formula was written as
=(b4+b2)/b3, when you drag that formula across a row the next entry
will be =(c4+c2)/c3, while references to rows will be changed when you
drag a formula down a column.
Press and
drag the
mouse!
=(B4+B2)/B3
The formula is
automatically
replicated
=(C4+C2)/C3
PLANNING AND BUDGETING TOOL, USER MANUAL
37
5.4.2 Inserting tables and lines
When it comes to costing an activity and budgeting for an intervention, you might not agree
with the labelling of activities or you might simply need to add items within activities or
customize the intervention worksheet. You will therefore need to insert lines, modify row
titles, insert tables and modify subtotals. So here are some examples to refresh your Excel
skills!
Example 1. Inserting lines, modifying row titles, modifying subtotals
1. Open your copy of the tool you have saved in your computer
2. Show tabs, show row/column headers and unprotect all sheets
3. Go to 1.5.3.3 HRD: Training and other aspects of human resource development
4. Imagine you have the following data as on figure 23, on "training for patient care and
programme management", i.e Cost of training in 2008, 2009 and 2012 is US$ 4850
Figure 23 Completing and inserting lines in "Training for patient care and programme
management"
5. In the second training please add a row for the cost of renting computers. The cost in
each training session will be US$ 600.
Question. What is the cost of this training course now?
Answer. Total cost is now $ 5450
PLANNING AND BUDGETING TOOL, USER MANUAL
38
PLANNING AND BUDGETING TOOL, USER MANUAL
39
To come to this result please follow instruction to insert lines in the table (Figure 24)
•
Line inserted after row 66.
•
Cost of hiring computers included in the new line 67.
•
Label written in the corresponding cell (B67).
•
Cost of US$ 600 included for 2008, 2009 and 2012.
•
Formulae of cost of the training modified to include this new row. It will
now read as:
=((C55*C54*C52)+(C56*C53)+(C57*C58*C52)+(C57*C59)+(C60*C61*C52)+(C53*C62*C52)
+(C52*(C63+C64))+(C65*C66)+C67+C68)*C51
The logic. You need to check the formulae for any budget sub-totals that include the
items that you have added. If the relevant rows/cells that you have added are not included
in the formulae, you will need to modify the formulae so that they are included. You can
easily see which cells are included in any formula as follows: a) click on the cell that
contains the formula for a sub-total b) then, in the formula bar at the top of the screen,
click at the end of the formula. Unless the formula is very complicated, all the cells that
are contributing to the existing formula will be highlighted. Any items that you have added
can then be included by adding the cell with the relevant total (or subtotal) to this
formula. You can do this by typing a new "add" sign (+) into the formula bar at the top of
the screen and then clicking on the cell that you want to add.
If you would like to enter formula linked to a cell in another page/sheet. The tool is set
up with a menu system such that the names of individual sheets are not shown at the
bottom of the screen in the way that you would typically see them in an Excel workbook. If
you are entering a formula in one sheet and you want to include a cell from another sheet
in that formula, then you will need to change the way that the workbook is displayed. You
can change this by going to the Tools menu, then selecting Options, and then selecting
View (Tools-Options-View). In the View menu, make sure that the box for "sheet tabs" is
ticked. Another way to solve this problem is go to the "Application Options" in the tool on
the Welcome page at the bottom right, click on it, and select show/hide sheet tabs on the
menu.
PLANNING AND BUDGETING TOOL, USER MANUAL
40
Figure 24. Instructions to insert a line, responding to Example 1.
1° Insert row 66
2°Label "cost of hiring computers"
3° Enter $600 in 2008, 2009 and 2012
4° Formula of Cost of training is incorrect! It is
leaving out Line 66. hence it needs amending!
Go to cell C69 and correct the formula
Copy the formula for D69 and G69
Now Cost of training is correct
PLANNING AND BUDGETING TOOL, USER MANUAL
41
Example 2. Inserting a table
Following on Example 1, the programme needs to include a new international training
called "International training of laboratory personnel for molecular biology". One staff from
the laboratory will attend this course in 2009, then in 2012, then in 2014. The cost of the
course will be US$ 3,000 and the cost of air fare is US$ 2000.
Question. What is the total cost for this new international training? What is the total cost
for all courses in the international training section in 2009?
Answer: The total cost of this new training is US$ 32,000. Total cost of all courses in the
international training section in 2009 is US$ 312,000.
To come to this result please follow the instructions to insert a table
•
Select any table that is included under the heading "international training". This can
be done by putting the mouse on the column where the number of the first row of
the table is shown and drag down the mouse selecting all desired rows.
Put your mouse here, click,
then drag down selecting all
desired rows
•
Copy them, i.e. select the button that allows you to copy
PLANNING AND BUDGETING TOOL, USER MANUAL
42
Still with the mouse held
over on the number of the
row, press the right button
of the mouse, and then
select copy
Move the mouse to the
number of the row where
the table is going to be
inserted, press the right
button of the mouse, and
then select "insert copied
cells". The table needs to
be inserted before the subtotal of this sub-activity
"International training"
•
Include the total of the new training table in the total cost of this activity, i.e. in
the total of international training.
PLANNING AND BUDGETING TOOL, USER MANUAL
43
Adjust the total of the
activity and drag the
formulae across the row
so that the same
formulae is used for all
other years
Drag the new formulae of the sub-total to all years.
To start planning and budgeting for each of the interventions, you may consult User
manual, PART II.
Geneva, December 2009
PLANNING AND BUDGETING TOOL, USER MANUAL
44
Annex: Glossary
Box 7. Definitions of terms used within the Planning and Budgeting Tool
Activities
In order to budget for an intervention, you will provide unit costs and quantities for a
number of activities
Ex. Activities for Patient Support are:
1.3.1 Situation analysis
1.3.2 Incentives
Available Funding
Financial resources available for an intervention (from central, provincial and local
government, as well as loans, The Global Fund to Fight AIDS, Tuberculosis and Malaria
and other grants)
Budget
The total sum of money needed to undertake an activity and intervention.
Financing
Financial resources available for relevant activities/interventions
Funding Gap
Calculated by subtracting total funding expected to be received from the total cost.
Input Price
Amount of money for which input is bought or sold
Input Quantity
Quantity required for the activity (detailed method) or quantity required for the
intervention (quick method)
Intervention
Refers to measures to implement the Stop TB strategy. The interventions appearing
in the welcome page are aimed at achieving the objectives of WHO STB Strategy.
There is one worksheet for each major component of TB control. They are linked to
Global Fund Service Delivery Areas.
Ex. Intervention 1.3 Patient Support
Intervention cost
Monetary value of intervention, here measured as
Unit Quantity X Unit Cost
Objective
Refers to the Stop TB Strategy objective in line with MDG. Each intervention is aimed
at achieving an objective and sub-objective. Ex. Objective 1.3 Patient Support
Planning
Act of formulating a TB program and activities to achieve an intervention's objective
Unit Cost
Cost per unit consumed in each activity
PLANNING AND BUDGETING TOOL, USER MANUAL
45