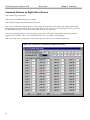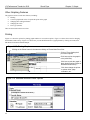
1
Shock Dyno
V1.1B for Windows
User’s Manual
Performance Trends, Inc.
Box 530164 Livonia, MI 48152
248-473-9230 Fax 248-442-7750
Website: www.performancetrends.com
Email: [email protected]
2
Performance Trends, Inc. PO Box 530164, Livonia, MI 48152
Tech Assistance for Registered Owners (248) 473-9230 Fax: 248-442-7750 Email: [email protected]
Website (tips, correspond with other users, download demos, update schedule, etc.) www.performancetrends.com
Copyright Notice
Copyright (C) 2015 PERFORMANCE TRENDS, INC.
All Rights Reserved
These software programs and user's manual are reserved by PERFORMANCE TRENDS, INC. and are intended for the use
of the original owner only. Copying or duplicating these products except for the personal use of the original owner is a
violation of U. S. Copyright Law and is hereby expressly forbidden.
Portions Copyright (C) Microsoft Corp. 1982-2012
All Rights Reserved
International Business Machines Corp. makes no warranties, either expressed or implied, regarding the enclosed computer
package, its merchantability or its fitness for any particular purpose.
IBM PC, XT, and AT are registered trademarks of International Business Machines Corp.
Windows is a registered trademark of Microsoft Corp.
Power Tech is a trademark of Power Technology.
Competition Cams is a trademark of Competition Cams Inc.
Crane is a trademark of Crane Cams Corporation.
DISCLAIMER Of WARRANTIES:
THE SOFTWARE PROVIDED HEREUNDER IS LICENSED "AS IS" WITHOUT ANY WARRANTIES, EXPRESS OR
IMPLIED, INCLUDING BUT NOT LIMITED TO, ANY WARRANTIES FOR MERCHANTABILITY OR FITNESS FOR
A PARTICULAR PURPOSE. NO ORAL OR WRITTEN STATEMENTS, REPRESENTATIONS OR OTHER
AFFIRMATION Of FACT, INCLUDING BUT NOT LIMITED TO STATEMENTS REGARDING CAPABILITY,
CAPACITY, SUITABILITY FOR USE OR PERFORMANCE Of SOFTWARE SHALL BE RELIED UPON BY USER OR
BE DEEMED TO BE A WARRANTY OR REPRESENTATION BY PERFORMANCE TRENDS, INC. FOR ANY
PURPOSE, OR GIVE RISE TO ANY LIABILITY Of OBLIGATION Of PERFORMANCE TRENDS, INC.
WHATSOEVER. USER ACCEPTS ALL RESPONSIBILITY FOR SELECTING THE SOFTWARE TO MEET USER
NEEDS OR SPECIFIC PURPOSES. PERFORMANCE TRENDS INC. IS UNDER NO OBLIGATION TO FURNISH
USER UPDATES OR ENHANCEMENTS EVEN IF FURNISHED TO OTHER USERS.
LIMITATION Of LIABILITY:
If at the time of delivery to the original User only there are any defects in the media on which the Software is provided,
User's sole and exclusive remedy shall be the replacement of any media returned to Performance Trends, Inc. within 90 days
of the receipt of the Software by User, or at Performance Trends Inc.'s sole option, a refund of the License fees paid to
Performance Trends, Inc. by User.
IN NO EVENT SHALL PERFORMANCE TRENDS, INC. OR THIRD PARTIES WHO HAVE RIGHTS IN THE
SOFTWARE BE LIABLE TO USER FOR LOSS Of PROFITS, INDIRECT, SPECIAL, INCIDENTAL OR
CONSEQUENTIAL DAMAGES EVEN IF PERFORMANCE TRENDS, INC. IS AWARE Of THE POSSIBILITY Of
SUCH DAMAGES.
Continued on next page.
3
IN THE EVENT ANY REMEDY HEREUNDER FAILS Of ITS ESSENTIAL PURPOSE, OR IN ANY OTHER EVENT,
PERFORMANCE TRENDS INC.'S LIABILITY HEREUNDER SHALL NOT EXCEED ANY AMOUNTS PAID BY
USER TO PERFORMANCE TRENDS, INC. UNDER THIS AGREEMENT.
Some states do not allow the limitation or exclusion of liability for incidental or consequential damages and some states do
not allow the exclusion of implied warranties, so the above limitations or exclusions may not apply to you.
No action, regardless of form, arising out of any claimed breach of this agreement or performance under this agreement may
be brought by either party more than one year after the affected party learns of the cause of action.
Refer to diskette envelope for full license agreement.
******************************************* W A R N I N G ******************************************
The Shock Dyno makes calculations based on equations and data found in various published and heretofore reliable
documents. The program is designed for use by skilled professionals experienced with engines and Tests. The following
processes are hazardous, particularly if done by an unskilled or inexperienced user:
-
Obtaining data to input to the program
Interpreting the program's results
Before making measurements of or modifications to any Test, engine or driving situation, DO NOT FAIL TO:
-
4
Regard the safety consequences
Consult with a skilled and cautious professional
Read the entire user's manual
Obey all federal, state & local laws
Respect the rights and safety of others
Table of Contents
Chapter 1 Introduction
1.1 Overview of Features
1.2 Before You Start
1.3 A Word of Caution
1.4 Getting Started (Installation)
1.5 Example to Get You Going
Chapter 2 Definitions
2.0 Basic Program Operation
2.1 Main Screen (test data input)
2.2 Preferences
2.3 Test Options (not yet available)
2.4 Shock Tester Calibration Specs
2.6 New Test Screen (starting a new complete test)
2.7 Recording Electronic Data from Shock
Tester (testing a Shock)
Chapter 3 Output
1
1
2
3
4
6
9
9
11
17
23
25
31
33
39
3.1 Reports
3.2 ASCII Data Files
3.4 Graphs
3.5 Printer Output
3.6 Data Libraries
3.7 Filter Test Files
3.8 History Log
41
43
45
55
57
61
63
Appendix 1:
Accuracy and Repeatability
65
Appendix 2:
Backing Up Data
67
Index
71
5
6
(C) Performance Trends Inc 2012
Shock Dyno
Chapter 1 Introduction
Chapter 1 Introduction
1.1 Overview of Features
The Shock Dyno v1.1 program by Performance Trends, Inc is hardware, electronics and software to test shock absorbers, either
on Performance Trends’ Shock Dyno or on a user’s existing shock dyno. The program offers options to record, calculate, save,
graph, organize, retrieve, report and analyze shock velocity and force test data. The Shock Dyno v1.1 is a unique program
which will save test time and improve the analysis of shock test data.
Features:
•
•
•
•
•
•
•
•
•
Capability to tailor the program to work with Performance Trends’ Shock Dyno or most any other shock dyno.
User friendly, Windows interface, compatible with Windows 98, Me, XP, 2000 and NT, Vista, Win 7.
Can print results using most any Windows compatible printer, many times in color.
Save nearly unlimited number of tests for recall, comparison and analysis in the future.
Allows several reporting and graphing options for analysis.
Customize printed reports and graphs. You can include comments for each Shock graphed.
Write ASCII files for importing data into other computer programs.
Filter (find) past tests based on certain criteria, like Force at Seated or Open Heights, certain Customer name, etc like a data
base program.
"History Log", keeps a running log of tests you have recently started new, run, graphed or reported.
Please read Sections 1.2 "Before You Start" and 1.3 "A Word of Caution" before you turn on the computer. Then install the
program following the guidelines in 1.4 "Getting Started" and try running it following section 1.5 "Example to Get You Going".
When you feel a little familiar with the program, take time to read this entire manual. It will show you all the things you can do
with this powerful tool.
1
(C) Performance Trends Inc 2012
Shock Dyno
Chapter 1 Introduction
1.2 Before You Start
What you will need:
•
•
•
•
Most any Windows computer
32 Meg of RAM.
Approximately 20 Megabyte of disk space. (More is required for storing large #s of tests.)
Windows 98, Me, XP, 2000 or NT, Vista, Win 7, Win 8.
Many terms used by the Shock Dyno and this user's manual are similar to terms used by other publications, i.e. Velocity, Force,
etc. However, these terms may have different definitions. Therefore, read Chapter 2 to see what these terms mean to the Shock
Dyno.
Occasionally it will be necessary to identify "typos" in the manual, known "bugs" and their "fixes", etc. which were not known
at the time of publication. These will be identified in a file called README.DOC in the Shock Dyno directory or “V-Shock”
folder. To read this file, click on Help at top of Main Screen and then click on Display Readme.doc file.
Unlocking Program:
The Shock Dyno has some minor copy protection. This ensures the legitimate users do not have to cover the costs for
unauthorized distribution of the program. See Section 1.4 on unlocking the program.
2
(C) Performance Trends Inc 2012
Shock Dyno
Chapter 1 Introduction
1.3 A Word of Caution
First, before switching from your current method of recording Shock Data (either hand recording or via some other type of
electronics) to the Performance Trends Shock Dyno, you should be very familiar with the Shock Dyno v1.1 program and your
computer in general. See the precautions in Section 2.0 and Example 4.1.
Testing shocks requires you to mechanically
compress and rebound a shock via a motor.
Depending on your situation, the motor may start
when you are not expecting it. Always keep hands
and fingers clear of the dyno unless the motor
power is OFF. Be sure to observe all safety
warnings and use proper safety equipment like
guards and safety goggles.
Please also read the Warranty and Warning at the beginning of this manual and on the diskette envelope.
3
(C) Performance Trends Inc 2012
Shock Dyno
Chapter 1 Introduction
1.4 Getting Started (Installation)
You must install the Shock Dyno from the distribution CD to a hard drive before it will run. To do this, simply install the CD in
your CDRom drive and the Performance Trends Installation Wizard should automatically start, allowing you to install the Shock
Dyno and demos of any of our other products.
If the CD does not auto-run, then click on Start, then Run, then Browse and find your CD drive. Then look for SETUP.EXE on
the CD and run it to run the Installation Wizard. If you want to bypass the Wizard, go into the Programs folder on the CD and
run the Shock Dyno v1.1 Installer.exe file.
Figure 1.1 Installation Wizard or Bypassing Installation Wizard
The Installation Wizard will
Auto-Start when you insert
the program CD. Here’s the
Valve Spring Tester button to
install this program. You can
also install any or all of the
other demo programs on the
CD. Click on the Brochure
button by a particular product
for a description with
illustrations (a brochure) of
that program to be displayed.
To bypass the Installation Wizard, click on Start,
then Run, then Browse from the Run screen
shown below to find the CDRom, then the
Programs folder on the CD, then the Shock Dyno
v1.1 Installer.exe file in the Programs folder.
4
(C) Performance Trends Inc 2012
Shock Dyno
Chapter 1 Introduction
Entering Registered Owner's Name:
The first time you run the Shock Dyno, you will be asked to enter your name as the Registered Owner. During this first session,
you can modify it until you are satisfied. Once you accept the name, the computer will generate a Registered Code # based on
the name. (If you purchased the program directly from Performance Trends, you probably were sent a suggested Reg Name as
described in the “Unlocking Program” section below.) To be eligible for Tech Help, you will need both your registered name
and code #. The name you enter should be very similar to the name under which you purchased the program.
Click on “Reg To:” at the top of the Main Screen to review your name and code #.
Unlocking Program:
The Shock Dyno has some minor copy protection. This ensures the legitimate users do not have to cover the costs for
unauthorized distribution of the program.
When you first receive the program, it is in demo mode. Most all features work in Demo mode except the ability to record
data via the electronics. This demo mode is useful as a Shock Dyno file “viewer”. Should your customers want to make reports
or graphs of results you have created, they can just obtain a demo copy (from CD or website) and use it to do their own analysis
of files you have created. They can do everything you can do except record new data.
If you purchased the program directly from Performance Trends, you probably were sent a suggested Reg Name and the
resulting Reg Code # you should get from that Reg Name. The Reg Name is case sensitive, which means it matters which letters
you capitalize. You would have also been sent the unlock code that will unlock the program for that name.
If you purchased from the internet, or are having problems unlocking your program, you can call Performance Trends you’re
your unlock code. Before you call Performance Trends, you should get your Registered Name and Registered Code number.
These are available by clicking on File in the upper left hand corner of the Main Screen, then clicking on Unlocking Program.
A screen will appear as shown in Figure 1.2.
Performance Trends will provide you an unlocking code number. Type in the unlocking code number and click on OK. If you
typed in the number correctly, you will be given a message that the program is permanently unlocked.
If you want to run the program on another
computer, you must use the same
Registered Name (it is case sensitive,
which means it matters which letters you
capitalize) and it will then generate the
same Registered Code. Then the same
Unlocking Code will unlock it.
Figure 1.2
1.1 Menu to Unlock Program Options
5
(C) Performance Trends Inc 2012
Shock Dyno
Chapter 1 Introduction
1.5 Example to Get You Going
To start the Shock Dyno, click on the Shock Dyno desktop icon. (An alternate method is to click on Start, then Programs, then
Performance Trends, and then Shock Dyno.) During startup of the program, you will be given some introductory tips.
One of these “Tips” will ask if the “last test you were running should be loaded”. If you have just received the program, this test
will be an example test which was loaded at the
Figure 1.3 Introductory Question
factory. If you have run the Shock Dyno before, this
will be the last test you were working with. If you
are just learning the program, it is recommended you
answer yes to this question so you have some
example data to work with to understand how the
program works.
After these brief introduction screens and questions,
you will be left at the Main Screen shown below:
Figure 1.4 Main Screen
Name of
current test
you are
working with
Menu
Commands
Click on File,
then choose
from different
Save or Open
options
Click on File,
then Unlock
Program to
allow the
program to
record data
from the spring
tester. See
Section 1.4.
6
(C) Performance Trends Inc 2012
Shock Dyno
From this Main Screen, you can:
•
•
•
•
•
•
•
•
Chapter 1 Introduction
Figure 1.5 Graph Options Menu
Choose to review your options by clicking on the menu items at the top
of the screen.
Open or save a file of test results and specs by clicking on File in the
upper left corner, and then the Open or Save commands.
Add, edit or review test comments for the file you are currently working
with.
Graph or report the test for the file you are currently working with.
Select if you want to analyze results at either various amounts of Shock
height, or Shock compression from Seated Height (more like the Shock
will be used in the engine).
Change the Preferences options to somewhat customize the program for
your needs.
Get HELP to explain these options by clicking on Help.
Quit the program by clicking on File, then Exit.
Select this Type by clicking here
All these options are explained in detail in Chapters 2 and 3.
In the Main Screen’s blue title bar you will notice the name of the current test is contained in square brackets [ ] (if you did load
in an old Shock Test at program startup or opened a file by clicking on File, then Open). The program has some examples of
tests saved in the Test Libraries’ Example folder right from the factory.
To get started, let's try a couple of
Menu commands. Click on the
Graph menu command to open up
the graph options menu shown in
Figure 1.5. That Graph Type
shown in Figure 1.5 is for Force vs
Velocity Smooth. If this is not the
graph type you see on your
computer screen, click on the
down arrow to select “Force vs
Velocity Smooth”.
Click on the Make Graph button to
produce the graph shown in Figure
1.6. At the graph screen you have
several other options available for
changing the graph. These options
are available by clicking on the
commands in the menu bar or on
the buttons at the top of the screen,
including the Help command. The
Help command at this screen (and
most screens) provides a good
background on what the various
options are. For now, just click on
Back at the upper left to return to
the Main Screen.
Figure 1.6 Graph from Options Selected in Figure 1.5
Click on
Help for an
overview of
your
options for
this
screen.
Click on
Back to
return to
the Main
Screen
7
(C) Performance Trends Inc 2012
Shock Dyno
Chapter 1 Introduction
A Test File is made up of the Shock Data (force recorded at various positions at particular times) and other data like
Temperature, Comments, time and date, etc. This is explained in Section 3.6 "Data Libraries".
Many of the input specifications you see in the various menus may not be familiar to you. For a brief definition of the inputs,
simply click on the specification name. The definition will appear in the Help frame with a page # in this manual for more info.
Once you feel comfortable changing specifications in the various menus and making various performance calculations, read
Section 3.6 of this manual called Data Libraries to learn how to save a set of data or component specifications or recall
information which has been previously saved. Then you will know all the basic commands to operate the program. For a more
in-depth knowledge of using these commands and an explanation of the results, read this entire manual.
8
(C) Performance Trends Inc 2012
Shock Dyno
Chapter 2 Definitions
Chapter 2 Definitions
2.0 Basic Program Operation:
Whenever you start the Shock Dyno, you are brought to a Main Screen which will look like either Figure 2.1 or 2.3. If you have
not yet selected a test to work with
and have not started a new test, the
Figure 2.1 Main Screen before Opening a Test File
Main Screen is mostly blank, like
Figure 2.1.
If you want to Open a previously
saved test, you can click on File in the
upper left corner, then click on Open
(from all saved tests). You will get a
screen as shown in Figure 2.2 where
you are presented with a list of saved
Click on File, then Open (from all saved tests) to open a
tests in the Test Library. Some tests
previously saved test file. You can also open an
are examples provided by
Example Test file provided with the program. You will
Performance Trends. As you run tests
obtain a screen as shown in Figure 2.2.
yourself and save the results, you will
add many more tests to the library.
These saved files are useful for making comparisons in the future, and can be used as test patterns (or templates) for new tests
(saving you considerable time by not having to type in specs which match a past test).
Figure 2.2 shows that the Test Library is
divided into sections (called Folders in
Figure 2.2) to help organize a large
number of tests. For example, all Shock
tests for the company ABC Engines
could be saved under a section name of
“ABC-Chassis”. This will save
considerable time and confusion when
trying to locate a particular test in the
future. To look in different sections,
click on the Folder name from the list
shown at the lower right of Figure 2.2.
The list of tests will then be updated for
that Folder. To pick a test, simply click
on it from the list of tests, then click on
the Open button. (For those familiar with
computers, Folders are the folders in the
ShockData folder. The Name “Folder”
can be changed to something else, like
“Customer” or “Shock Mfg”.)
Figure 2.2 Screen to Open Shock Test
Click here to pick a different category or group of tests
(Folder) from which to display a list of Test Files.
9
(C) Performance Trends Inc 2012
Shock Dyno
Figure 2.3 Main Screen After Opening a Test File
Chapter 2 Definitions
Name of Current Test File
Menu Commands of File, Graph, etc.
These give you all the options to operate
the program and change test data.
Enter most any
test comments
here to keep
notes about this
head or test.
Move the mouse
over an area on
the screen, and a
Help description
of that item is
given here.
This summary
graph shows
shock force vs
velocity. Plus
version allows
other options for
this graph.
Click on Slide Bars to display more Test Data, which
may not be able to fit on the screen.
A summary of critical test settings is given here. Click on a setting to change it, or to bring up the
menu where it can be changed.
If you are working with particular test, the data will be presented as shown in Figure 2.3. Notice in Figure 2.3 that a current test
name is listed at the top in square brackets [ ]. This is the file of Shock specs, Shock Data, etc which are currently saved in the
Shock Data Library, and are the data and specs you are currently working with. If you change the Shock Data or specs, make a
graph or report, it is for this test file.
10
(C) Performance Trends Inc 2012
Shock Dyno
Chapter 2 Definitions
2.1 Main Screen (Test Data)
The Main Screen is shown in Figure 2.6. The screen shows you a summary of the Shock force at various velocities, plus some
summary data. The Main Screen is made up of 5 basic sections as shown in Figure 2.6. These are discussed in the next 5
sections. The rest of this section gives an overview of how a Shock Test is organized.
Figure 2.6 Main Screen After Opening a Test File
5) Menu Commands of File, Graph, etc.
These give you all the options to operate the
program and change test data.
2) Conditions
summarizes
some critical
test results and
includes a
comments
section to keep
notes about this
test.
You can
include a
Company
Logo graphics
on printouts
and it also will
appear here
on main
screen. Plus
Version only.
3) This Summary
Graph shows
force vs velocity.
4) The Test Data shows shock force at vatious velocities.
11
(C) Performance Trends Inc 2012
Shock Dyno
Chapter 2 Definitions
2.1.2 Test Results
Stroke
This is the stroke determined from the test cycles, based on the highest and lowest average length measured by the length sensor.
RPM
This is determined by the number of strokes measured during the test time.
Test Cycles
This is determined by the number of strokes measured during the test time.
Time/Date
This is time and date of the test. This can be changed by clicking on the Time/Date box.
Temp
This is the average temperature (and range shown as +/-) of the temp sensor if any. Plus Version only.
Figure 2.7 Operator Name Menu
Compression
This is the force at the highest velocity in the Compression direction.
Rebound
This is the force at the highest velocity in the Rebound direction.
These calculated results are the same results that can be displayed in different
Graph or Report types. They are shown here on the main screen as a summary
of this Shock’s calculated results.
Test Operator
This is the name of the operator who ran the test. Click on this item for the menu of Figure 2.7 to be displayed, where you can
type in a new operator name, or choose from one you have previously entered. It is always recommended you first check the list
of existing operators, so you do not end up with several names for the same operator. For example, Bob, Bobby and Robert may
all be for the same guy. When you go to look for tests run by Bobby in the future, the search (Filter option) will not show up the
tests run by Bob or Robert.
To pick an existing operator name, pick No for Enter a New Operator, then pick from the Operator list. To enter an New
Operator name, pick Yes for Enter a New Operator, then type in a New Operator name, which will be added to the list of
operator names.
12
(C) Performance Trends Inc 2012
Shock Dyno
Chapter 2 Definitions
Test Comments
Test comments are for making most any notes about the test, unusual observations, customer requirements, etc. In the Plus
version, you can search the Comments for various words. For example, you could search for all the tests which had the word
“Bilstein” or “gas filled” in the Test Comments.
Help
The help frame will describe what ever portion of the screen the mouse has passed over or clicked on. For example, click on a
location in the Test Data grid, and a description of what data can be entered in that particular column is given.
2.1.3 Summary Graph
The summary graph shows Shock Force vs Velocity (Figure 2.6). This is an excellent way to show a “snap shot” of this
shock’s performance.
The Preference menu also lets you to select to either graph Graph as +/- Velocity = Yes or Graph as +/- Velocity = No. See
Figure 2.8. Compression is shown as a positive force and Rebound is shown as a negative force. Depending on your Preference
Figure 2.8 Comparing the Same Data with Different Preference Settings “Graph Raw Data”
Graph as +/- Velocity = Yes (rebound velocity negative)
Graph as +/- Velocity = No (rebound velocity positive)
setting here, Rebound can be shown as a negative velocity or a positive velocity.
If you click on the Summary Graph, the Graph Options menu pops up to provide many more graphing options for the more
detailed Graph screen.
2.1.4 Test Data Grid
These option buttons control a very important aspect as to how the program presents and analyzes data for calculated results,
graphs and reports.
Velocity
This is the Shock velocity as determined how the shock’s length is changing during the cycle. Typically,
compression velocity is positive and rebound velocity is negative.
13
(C) Performance Trends Inc 2012
Shock Dyno
Chapter 2 Definitions
Force
This is the force measured at the corresponding velocity. Typically, compression velocity
is positive and rebound velocity is negative.
Point
The point column simply numbers the rows of data
2.1.5 Main Screen Commands
The next section discusses some of the commands available at the top of the Main Screen. Most will not be discussed here in
detail, as they are discussed in other sections of this manual.
File (see Figure 2.12 for File Options)
New (start new test)
Click on File, then New to start a new test. This process will “walk you through” some critical steps to start with a blank Test
Data grid, or to keep certain data from the previous test. Keeping data can save you considerable time since you don’t have to
type in information which may be the same as the current test. The New Test command is discussed in full detail in Section 2.6.
Open (from all saved tests)
This option presents the Open Test File menu discussed in Section 3.6, Data Libraries. From there you have several options to
open a previously saved test file from any place in the Test Library, or from most any place on the computer, including the
floppy disk drive.
Open (from History Log)
This option presents the History Log, a chronological list of test files you have been working with as discussed in Section 3.8.
From there you can review a summary of the last 25 to 100 tests, and pick one to open. This method can make it easier to find a
file you have just worked with lately, say in the last couple of weeks.
Save
Select Save if you want to save the current test and any recent changes to the same name as you are currently working with.
This is the file name shown in square bracket [ ] at the top of the Main Screen.
Save As
Select Save As if you want to save the current test and any recent changes to a new name or new folder. You will be presented
with the menu discussed in Section 3.6 where you can change the test name, change the folder you are saving it to, or add a new
folder name.
14
(C) Performance Trends Inc 2012
Shock Dyno
Chapter 2 Definitions
Open from CD/Zip Drive
This command provides a simple 1 click command to open a standard Windows “File Open” menu displaying the contents of
the disk in an external drive (floppy, CD, zip drive, memory stick, etc.). This provides a convenient method for copying files
from one computer to another.
Save to CD/Zip Drive
This command provides a simple 1 click command to save the current test file to the disk in an external drive (floppy, CD, zip
drive, memory stick, etc.) to the same name as is currently being used. This provides a convenient method for copying files
from one computer to another.
Print Main Screen
Print Blank Worksheet
Windows Printer Setup
The Print Main Screen and Print Blank Worksheet commands simply give you instructions how to do each. These commands
were placed under File as many users will look under File to find these print options. The Windows Printer Setup lets you
change your Windows default printer, paper orientation, etc for printing reports or graphs in other areas of the program.
Unlocking Program:
The Shock Dyno has some minor copy protection. This ensures the legitimate users do not have to cover the costs for
unauthorized distribution of the program. See Section 1.4 for details.
Graph
The Graph command lets you graph several different types of data from the current test, either by itself or with data from other
tests for comparisons. The Graph options are discussed in detail is Section 3.4, page 55.
Report
The Report command lets you create reports of several different types of data from the current test, either by itself or with data
from other tests for comparisons. The Report options are discussed in detail is Section 3.1, page 49.
Test Options (not yet activated)
The Test Options command opens up the Test Options menu. There you tell the program critical Shock specs, like…. Test
Options are discussed in detail in Section 2.3, page 23.
15
(C) Performance Trends Inc 2012
Shock Dyno
Chapter 2 Definitions
Settings
The Settings menu opens up 2 critical Menu commands, Tester Calibration and Preferences. These are described in the
following paragraphs.
Tester Calibration
The Tester Calibration command opens up the Tester Calibration Specs menu, where you can describe the Shock tester you are
using.
The specs in the Tester Calibration menu are critical for accurate results. Be
sure to read and understand the Tester Calibration Specs as discussed in
detail in Section 2.4, page 41.
Preferences
Preferences let you customize the program for your needs and for your computer and printer. See Section 2.2, page 21.
Help
Click on Help for several options to help describe your options at the Main Screen, and for other information to help you
understand how this program works.
16
(C) Performance Trends Inc 2012
Shock Dyno
Chapter 2 Definitions
2.2 Preferences
Click on the Preferences item in the menu bar at the
top of the Main Screen to bring up the Preferences
menu shown in Figure 2.12. Here you can adjust
some program items to personalize the program for
your needs. Preferences may also save time by
eliminating steps you don't require.
Figure 2.12 Preferences Menu
General Operation Tab
Graph as +/- Velocity
Set this to Yes to show both + and – velocity on the
main screen (compression as + and rebound as -). Set
to No to see both the compression and rebound force
graphed vs just a positive velocity. This is more
typical of shock dyno graphs.
# Tests Kept in History Log
Pick the number of tests which you want the History
Log to hold, from 25 to 100.
Main Screen Graph Lines
This option lets you choose the line thickness of the summary graph of force vs Shock height for all the Shocks on the Main
Screen.
Remember Size of Tester Screen
Set this to Yes to allow you to enlarge the program's Electronics screen showing Tester Results when you test a Shock. Then
when you close and return to this screen, it should be at the same size you previouisly adjusted it to. If the Electronics
Recording screen becomes corrupted, you may need to set this to No to fix the problem.
Recording Time, sec
Set this to the approximate amount of time you want the shock dyno to run while recording data. The longer the time, typically
the more accurate the data. You can also press the F2 key during a test to cut it short of this time.
If you have a retro fit kit, this setting only has an effect if you also have the Plus version with a motor control relay
17
(C) Performance Trends Inc 2012
Shock Dyno
Chapter 2 Definitions
Operations, cont Tab
Slow Down Data Readings
On newer, very fast computers, you may have to slow down the data readings for proper operation. The program may also warn
you of this, to change this setting.
Warn About Slowing Down Readings
Sometimes your system may work fine with a faster Slow Down Data Readings setting than the program thinks is appropriate.
Set this preference to No to avoid a nagging message.
Units
Choose either English or Metric Units.
Shock Dyno Controls Motor
For the Performance Trends Shock Dyno, and for retrofit kits with the Plus version of the software and a motor control relay
option, set this to On/Off Only.
For retrofit kits without the Plus version of the software or
a motor control relay option, set this to No.
Shock Dyno Agreement Warning Limit
As the shock goes through it’s testing cycle, it is put
through the same velocity in both an accelerating mode and
decelerating mode. In a perfect world, the force recorded
would be the same. However, in the real world it is not.
See Figure 2.12A, showing the force going through the
entire cycle. (Note: Only the Plus version allows for this
graph.)
The arrows show a portion of the cycle where the
agreement is not as good as other parts. Having very large
disagreement can be an indication of a poor test or bad
data. If you want messages about these differences to be
told to you for each test, you will specify a low limit. If
you know from your experience that the differences are
normal, you may not want the “nagging” messages and you
may increase this limit setting.
18
Fig 2.12A Agreement Limit
(C) Performance Trends Inc 2012
Shock Dyno
Chapter 2 Definitions
Files Options Tab
Program Title Comments
Enter most any text here for the First and Second lines.
These 2 lines will appear at the top of printouts and printed
graphs. This is a good place for your business name or your
personal name. You can change these entries as often as you
wish.
Figure 2.13 Alternate Path in Windows
Explorer
Use Alternate Location for Files
Some users (typically those on a network) may need to store
their data files in a location other that in the Shock-V folder
(the folder containing the actual Shock Dyno program). For
example, you may want to put the files on the E drive so
other computers can access them. If so, choose Yes and then
the spec Path to Files will be enabled.
In most all situations (except for network
users) it is STRONGLY recommended you
keep this marked No.
It is also STRONGLY recommended that if
you do choose Yes, that you do NOT keep
changing this back and forth from No to Yes.
This will produce possible errors when
saving or opening files. This will be due
mostly to saving them in one location and
then looking for them in another location.
Create the new
folder for the
data files.
Then copy all
the folders
using Windows
copy
commands to
this new
location.
Path to Files
If you set the previously described Use Alternate Location for Files spec to Yes, this spec becomes enabled. Enter the full path
to the new location for the Shock Dyno data files. For example, if you want to store the files on the E drive, enter the path:
E:\Shock Data
Either before you make this change in the Preferences menu, or immediately after that change, you must copy all Shock Dyno
data folders (directories) and data files to the new location. These folders include:
Shock Test Library (the ShockData folder and all subfolders)
Test Options Library (Test Options folder)
Assuming you used the path E:\Shock Data, you must copy the ShockData and Test Options folders (and their contents, the data
files) to the Shock Data folder on the E drive. See Figure 2.13.
19
(C) Performance Trends Inc 2012
Shock Dyno
Chapter 2 Definitions
You must copy both folders listed above and their contents (files) to the new location to avoid errors.
It is also STRONGLY recommended that you do NOT keep changing the path. Once you set it, do NOT
change it. Constantly changing it will produce possible errors when saving or opening files. This will be due
mostly to saving them in one location and then looking for them in another location.
If this process seems complicated or you are not familiar with Windows copy commands or folders, DO NOT
use this option. Keep the spec Use Alternate Location for Data Files set to No.
Default External Disk Drive
Choose the letter of the floppy disk drive on your computer, usually A for a floppy disk, but a letter of D or higher for a CD
drive, memory stick, or zip drive. This is the disk drive which will be first opened when using the Save to CD/Zip Drive or
Open from CD/Zip Drive File commands at the Main Screen.
Test Folder Name in Program
The Shock Dyno Analyzer saves tests under different folders (directories) under the main folder ShockData. Some users may
prefer to have the 'Folder' be called 'EngFamily' or 'Customer', depending how they choose to organize their tests. Your entry
here of most any text is what the program will use to call the different folders where test files are stored.
Printing/Graphing Tab
Printer Fonts
Choose which basic type of font to use for printouts. You may not get your choice if your printer does not support that
particular font.
Printed Graph Width, % of Page
Due to the endless combinations of computers, Windows setups and printers, some printed graphs may not fill the page, some
may extend off the page. This option lets you expand (% greater than 100) or shrink (% less than 100) the printed graph to
better fit the page.
Graph Dot Matrix Printer Adjustment
Choose Yes if you are getting breaks in the border around printed graphs (usually happens with dot matrix printers).
Company Logo Graphics File for Printouts
Use Logo File
Choose Yes and you can browse your computer to pick a graphics file (.jpg file) to be included on your printouts. See Fig
2.13A.
20
(C) Performance Trends Inc 2012
Shock Dyno
Chapter 2 Definitions
Figure s.13A Printing Company Logo (graphics file) on Graphs and Reports (Plus Version
Only)
Set to Yes to include a graphics file
(like one of your company logo) on
printed graphs and reports.
Click on Browse button to find your
graphics file on this computer.
The path to the graphics file is
shown here.
Example of a Report Printout including a
graphics file, in this case Performance
Trends’ company logo.
21
(C) Performance Trends Inc 2012
Shock Dyno
Chapter 2 Definitions
Command Buttons on Right Side of Screen
Click on OK to keep your changes.
Click on Cancel to abandon (not keep) your changes.
Click on Help to bring up help describing these Preferences.
Click on Turn On Restart Showing Help Tips to start showing the pop up tips for critical parts of the program operation like
when the program was first installed. These Tips usually appear only once each time you run the program, unless you click on
the "Don't Show This Again" box in the lower left corner of the tip. See Figure 2.8a.
Click on Stop Showing Help Tips to stop showing the pop up tips for critical parts of the program operation like when the
program was first installed. This is not recommended unless you are very familiar with the program.
Click on Set Graph Colors to bring up the screen below, Figure 2.8b, where you can customize graph colors.
Figure 2.8b Screen for Customizing Graph Line Colors
22
(C) Performance Trends Inc 2012
Shock Dyno
Chapter 2 Definitions
2.3 Test Options (not available yet)
This menu contains several critical specs which determine:
1. How the Shock is analyzed (critical Shock heights, forces, etc.)
2. How many Shocks are to be measured and how they are numbered.
3. Any limits you want the program to check the Shocks for and "flag out". Results outside of these ranges are identified
with a "<" if the Shock is below the limit, or a ">" if the Shock is above the limit. These will appear in the reports or
on the main screen, which also highlights this result in Red.
4. General info like customer name and comments describing these test setup specs.
As you click on each input
spec or input name, a brief
description is given in the
"Help" box in the lower left
corner. These help
descriptions give very useful
information to understanding
how these inputs work.
Figure 2.14 Test Options
There are 2 basic ways to
enter or change specs in this
menu:
1. You can click on a
spec value and
change the current
setting or type in a
new one. If your
entry is outside the
typical range, a
message is given
showing the limits,
and the setting is
switched back to its
original value.
2. Some specs are
picked from a list
called a "Combo
Box". An example
would be "Intake Matches Exhaust", where there are 2 choices either Yes or No. Click on these specs or the "down
arrow button" to the right of the specs to be presented with the list, then click on your choice from the list. (Customer
name is somewhat different and is described in an upcoming screen.)
As critical specs are changed, the results of the test may need to be updated. For example, if you change 'Seated Height', the
Force at this height will change (and so too may Shock Rate and Linearity). This is designed to happen automatically when you
leave this screen. However, if you suspect that the results have not been updated, you can click on 'Refresh Shock Calculations'
at the top of this screen to force this to be done manually right now.
23
(C) Performance Trends Inc 2012
24
Shock Dyno
Chapter 2 Definitions
(C) Performance Trends Inc 2012
Shock Dyno
Chapter 2 Definitions
2.4 Shock Tester Calibration Specs
The Shock Tester Calibration Specs describe the tester you are using and calibration specs for converting electrical signals into
Shock force and height. These specs are critical for accurate data, therefore be sure these specs are correct for each test.
Master Tester Specs
A critical concept for Tester Calibration Specs is the idea of the Master Tester Calibration Specs. When you run a test, you are
using a particular tester, with certain Tester Calibration Specs. When you save the test, the program saves a copy of the Tester
Calibration Specs with the test. Let’s call this test “April 12” and assume it was run on April 12th.
Let’s say several months later that you
recalibrate your tester. Your current tester
specs do not match the specs for “April 12”. If
you open “April 12”, the program installs the
tester specs which you used on April 12th when
you ran the test.
Figure 2.16 Typical Note on Master Tester Specs
If you go into the Tester Calibration Specs
menu, you will likely get a message shown in
Figure 2.16, saying that the Tester Calibration
Specs for April 12 do not match your Master
Tester Calibration, the specs for your current tester. You may ask ”What are Master Tester Calibration Specs?”
The program keeps track of any changes to Tester Calibration Specs, asking you if these changes should only apply to the Tester
Calibration Specs for a particular test, or if these changes represent your actual tester right now, the Master Tester Calibration
specs. Whenever, you start a new test, either based on a previous test or starting completely blank, the Master Tester Calibration
Specs are used. Whenever you open an old test file, the tester calibration specs used for that particular test are used.
Since each complete test you run keeps a set of Tester Calibration Specs, you can easily see what calibration specs were being
used at most any time in the past. Simply open an older test, click on Settings, then Tester Calibration to view these specs. If
you want to return your tester’s calibration to these previous specs, simply click on File, than Save as Master Tester Calibration
specs. Now all new tests you run will use these calibration specs.
Changing calibration specs will not affect data which has already been recorded, just new data.
Sensor Specs
If you purchased a complete Shock Dyno system from Performance Trends, you probably got a
calibration sheet with it. Then you can type in these numbers on this screen for an accurate calibration.
Length Sensor Offset
This is the offset in the calibration curve for the Shock Length Sensor. In a calibration curve of 'Compression=A*Volts+B', the
Offset is the 'B'. Click on the 'Calibrate' button to calibrate sensor through the electronics. See Figure 2.17
25
(C) Performance Trends Inc 2012
Shock Dyno
Chapter 2 Definitions
Factor
The factor in the calibration curve for the Shock Length Sensor. In a calibration curve of 'Pres=A*Volts+B', the Factor is the
'A'. Click on the 'Calibrate' button to calibrate sensor through
the electronics. See Figure 2.17
Figure 2.17 Definition of Factor and Offset
Comment
Some comment to describe the calibration of the Shock Length
Sensor. Click on the 'Load Date' button to load the current Time
and Date as the comment.
Factor (A) =
Change in Length
Change in Volts
Length
Change in
Length
Force Sensor Offset
The offset in the calibration curve for the Force Sensor. In a
calibration curve of 'Pres=A*Volts+B', the Offset is the 'B'.
Click on the 'Calibrate' button to calibrate sensor through the
electronics. See Figure 2.17
Change in Volts
Offset (B)
Volts
Figure 2.21 Shock Tester Specs Menu (check “Quick Start” paperwork for more details)
Click on File, then:
• Save as My Tester Specs
• Open Master Tester Specs
• Recalculate (lets you recalculate the results if you have made some changes). Note: If you
update the calibration numbers, the results will NOT update to match these new numbers.
• Print or Windows Printer Setup to print this screen.
All complete shock dynos will use “Gen 3 Mini USB”.
Shock Dyno retrofit kits produced before 2015 would use
“Older Logger”.
26
(C) Performance Trends Inc 2012
Shock Dyno
Chapter 2 Definitions
Factor
The factor in the calibration curve for the Force Sensor. In a calibration curve of 'Pres=A*Volts+B', the Factor is the 'A'. Click
on the 'Calibrate' button to calibrate sensor through the electronics. See Figure 2.17
Comment
Some comment to describe the calibration of the Force Sensor. Click on the 'Load Date' button to load the current Time and
Date as the comment. p 161
Auxillary Sensor #1 Offset
This is the offset in the calibration curve for the Auxillary Sensor #1, typically a temperature sensor. In a calibration curve of
'Compression=A*Volts+B', the Offset is the 'B'. Click on the 'Calibrate' button to calibrate sensor through the electronics. See
Figure 2.17
Factor
The factor in the calibration curve for the Auxillary Sensor #1, typically a temperature sensor. In a calibration curve of
'Pres=A*Volts+B', the Factor is the 'A'. Click on the 'Calibrate'
button to calibrate sensor through the electronics. See Figure
Figure 2.17 Definition of Factor and Offset
2.17
Comment
Some comment to describe the calibration of the Auxillary
Sensor #1, typically a temperature sensor. Click on the 'Load
Date' button to load the current Time and Date as the comment.
Factor (A) =
Length
Change in
Length
Change in Volts
Other Specs
Com Port
Change in Length
Change in Volts
Offset (B)
Volts
Click on the down arrow button to select computer's COM
(serial) port # you are using to 'talk' to the electronics. It is recommended you select 'Let program find it'.
Electronics
Click on the down arrow button to select the type of electronics you are using to read the Shock Tester. For most all cases, you
will select Perf Trends’ Gen 2 USB Logger .
27
(C) Performance Trends Inc 2012
Shock Dyno
Chapter 2 Definitions
Calibrate Factor & Offset
Click on either of these 2 buttons to perform a calibration. A calibration is required when you first get the tester if it has not
been done at Performance Trends. You may also want to check the current calibration if you suspect a problem.
It is strongly recommended that you do NOT recalibrate often. This will often cause more problems than improve data
accuracy. If the force sensor does not read 0 (or very close to it) with no Shock on the tester, than use the “Re-Zero Force”
Figure 2.19 Calibration Procedure for Length Sensor (spring height sensor)
1) Click here to start calibration process.
2) Set some known position to the length sensor.
Then click on OK. You can call this 0 length.
3) After the program
reads the signal from
the tester, tell the
program the length
setting.
4) Move the length sensor a very precise known
amount from Step 2). This is critical, to exactly
know the amount of length difference from Step 2).
5) Enter this exact
change in length.
6) The calibration results are shown here
so you can compare them to the current
calibration numbers. Then you can
decide if you want to keep them or not.
28
(C) Performance Trends Inc 2012
Shock Dyno
Chapter 2 Definitions
option described previously in this section.
Figure 2.20 Force Calibration Procedure Using a Weight or Measured Force
1) Click here to calibrate the Force
sensor, typically a load cell.
Note: Click here to
calibrate using a
known force or weight.
Click on OK when you are
producing 0 force.
Produce a known force by hanging a
weight on the load cell. Click OK when
you are producing this force.
Enter the force you were producing.
29
(C) Performance Trends Inc 2012
Shock Dyno
Chapter 2 Definitions
Figure 2.21 Calibrating Force with a Known Weight
This is done much like calibrating the Height sensor. You will need to hang a known weight from the load cell
and arrange some method to avoid hitting the dyno itself. Shown here is a “C” arm. You can also do this by
moving the load cell off the shock dyno.
Safety Warning
Be sure dyno is securely
attached to bench top and
bench itself is heavy or secure
enough not to tip.
Arrange so you can
hang weight from load cell
Note: Be sure to include some
type of flex in link so you do
not put side load on load cell
Known Weight
(be sure to include
the weight of the
“C” arm also)
30
(C) Performance Trends Inc 2012
Shock Dyno
Chapter 2 Definitions
2.6 New Test Menu (starting a new
complete test)
The New Test command is
available by clicking on File at
the top, left of the Main Screen,
then selecting New Test. You
will then be presented with the
screen shown in Figure 2.26.
Getting a new test started right
is probably the most important
step in running a Shock test.
Figure 2.26 New Test Menu
3 Critical specs for the new test are listed here at the top.
Click here to start a New Test based on these settings.
When starting a New Test, it is
usually best to first Open a
previous test which is similar to
the New Test you will be
running (similar Shock specs,
similar numbering specs, similar
limit checks, etc.) This previous
test will then be the 'pattern' or
'template' for the New Test and
will save you from having to
type in many specs to describe
this New Test. This also
ensures consistency between
your tests and reduces the
possibility of errors.
A summary of the current settings is given here.
If the current test is not a good
'pattern' for this new test (or if
there currently is no test
Click on these buttons to see the current settings.
displayed), you can abort
starting this new test by clicking
Click here to Check or Uncheck these options. Checking means you
on 'Cancel (don't start new test)'
want to keep these specs for the new test. Once the new test is started
at the top of the New Test
you can then make modifications to these specs if you want.
screen. Then click on 'File' at
the top, left of the Main Screen
and select one of the 'Open'
options to open a past test to serve as a pattern.
If you must start with a blank test (which may be the case when you first get this program), or want to modify some specs from
the previous test, click on the 'See Specs' buttons for each category of specs. Click on Help at these menus for more info on how
to enter these specs.
When you close out these menus, you are brought back to the New Test screen. Be sure to check the check box at the left for all
specs you want to use for your new test. All Categories not checked will be blanked out. Blank specs may cause problems with
more detailed analysis, and won't allow you to keep track of important details about the head you are testing.
Most specs in these categories can be changed once the test has started with no problems. This includes specs which simply
describe the test and Shocks which do not affect height and force measurements, like Test Options, Test Comments, etc.
31
(C) Performance Trends Inc 2012
Shock Dyno
Chapter 2 Definitions
However, specs which DO affect height and force measurements like the Shock Tester Calibration specs, are critical to have
correct for even the first data point.
Three other critical specs are listed separately at the top:
1. File Name for New Test is the file name the program will create for saving the Shock Data for the new test you are starting.
The program fills in a default name of the current test name, but incrementing the last digit in the name by 1. You can
change this name to most anything you like. The program will warn you if the name entered is not valid and show you what
is wrong.
2. Operator for New Test is the name of the operator for this test. Click on Pick to pick an operator name already used or to
enter a new name. The program defaults to the operator of the current test.
3. Folder Name for New Test is the folder in the ShockData folder where the test will be saved. The program may not be
using the name 'folder' for this spec, but whatever word you have assigned in the Preferences menu at the Main Screen. The
folder name 'Examples' is reserved for Performance Trends example tests supplied with the program, and can NOT be used
for your tests.
When you are ready to start the new test, click on 'Start New Test' at the top of the screen. If some critical specs have not been
entered, the program will warn you and ask you for it at that time. The program will fill in the Test Time and Date based on the
computer's time and date. This can be changed later by clicking on the Test Time/Date at the Main Screen.
32
(C) Performance Trends Inc 2012
Shock Dyno
Chapter 2 Definitions
2.7 Recording Electronic Data from
Shock Tester (testing a Shock)
This screen shows you the current Shock Tester readings, and lets you automatically record these readings and load them in the
Test Data grid. Each time data is recorded, critical Shock Data like Compression Force, Rebound Force are recalculated and
displayed on the Main Screen (behind this screen).
Figure 2.27 Screen for Reading Electronics
Menu
commands and
options are
explained later
in this section.
Current
readings for the
length,
temperature
and force
sensor. Time
readings will
advance once
you start
recording a test.
The scaling of
these gauges
can be set in
Options.
Status of the current test mode for the
Recording screen.
The gauges show the Shock Length and Force readings. The scales for these gauges can be changed by clicking on 'Options',
and then 'Force Gauge Scale' or 'Maximum/Minimum Shock Heights'.
Shock Force should read very close to zero with no Shock in the tester. If this is not the case, you can 'Re-Zero' the force sensor
without doing a full calibration by clicking on Options, then Rezero Force.
You can resize this screen by placing the mouse pointer over an edge of this screen to get the 'double arrow' pointer, then
holding the mouse arrow down and dragging the edge to a new location. You can also reposition this screen by clicking (and
33
(C) Performance Trends Inc 2012
Shock Dyno
Chapter 2 Definitions
holding the mouse button down) on the title bar at the top of this screen (typically blue) and dragging this screen to a new
location, then releasing the mouse button. The new screen size and position are used each time this screen is re-opened.
Test Procedure
When you first enter the Recording screen, you are warned that the current tests data will be overwritten by any new data you
record. If you have not saved the data for the current test, you should save it choose No to return to the Main Screen and then
save this data.
When in the Recording screen, you can watch all the current readings to check that they are reading correctly.
Turn on the motor for the shock dyno to get readings as the shock is cycling.
If you have a Retrofit kit without a motor relay, you will start manually, with some switch on your motor.
If you have Performance Trend’s shock dyno, or you have a Retrofit kit with a motor relay, you will start the motor with the
computer command Shift-F7 (press and release the F7 key while holding down the Shift key). We purposely picked these 2
keys to ensure both of your hands are on the computer keyboard. That is to ensure your hands are away from the motor, dyno
and shock, to reduce risk of injury.
Once you do the Shift-F7 command, the confirmation message below appears to further confirm it is safe to start the motor.
Click Yes to start the motor.
Important: When working with the Shock Dyno, as with most any motorized
machinery, you must use proper safety precautions. This includes wearing safety
goggles, keeping gaurds in place, keeping hands and fingers out of moving parts,
and following all safety precautions and warning labels. Because the software may
control the starting of the motor, ALWAYS assume the motor could start
unexpectedly. Make sure the motor has no power when working on the shock
absorber and dyno.
34
(C) Performance Trends Inc 2012
Shock Dyno
Chapter 2 Definitions
Once the dyno starts cycling the shock, you can press the <F1> key to start the recording of data. In the Plus version, if you are
using a temperature sensor, you can select a particular temperature to start recording data. (This is discussed later in this
section.) If that is the case, the program will wait until the shock reaches that temperature before starting it’s recording cycle.
Once recording starts, you will see the timer start in the upper right corner. The testing cycle will stop when the timer reaches
the Cycle Time set in the Preferences screen. You can stop it earlier than that by pressing the <F2> key.
When the test cycle stops and recording stops, the motor will turn off if you have a motor control relay. The recording screen
will close and you will return to the Main Screen with the results.
As the recording screen shows, you can press the <F12> key to stop the motor at any time. NOTE: It is best to tap the <F12>
key several times, because the computer is VERY busy when data is being recorded. The program may not “see” the first press
of the <F12> key.
Menu Commands
Close
Click this option to close this menu and return to the Main Screen.
35
(C) Performance Trends Inc 2012
Shock Dyno
Chapter 2 Definitions
Record (F1)
Click this option or press the <F1> key to start recording data. Once you press this, compress the Shock and then release the
Shock. Recording will automatically stop when you return the Shock tester handle to approximately its starting location. If
recording does not automatically start, press <F2>. See Stop Recording below.
Stop Recording (F2)
Click this option or press the <F2> key to stop recording data. Normally, recording stops when you return the Shock tester to its
starting position. If this does not happen for some reason, use this option.
Options
Print
Click on this to print the current screen.
Print Setup
Click on this to bring up the Windows Printer Setup screen to choose various printer options.
Manually Save Screen Dimensions
If you adjust the size and location of this screen, and the program is not “remembering” the size and location, click on this
option to force the program to save these specs.
Readings for Debugging
Use this option only if directed to do so by a Performance Trends technician.
Re-Zero Force Readings
Electronics are prone to minor changes (or drift) over time or through temperature changes, etc. This is most obvious when you
have no Shock on the tester, but the updating force reading is not reading exactly 0.0. Rather than doing a complete calibration
of the system, you can simply re-zero the force reading by clicking on this option. The program will tell you to remove the
Shock and wait for the force sensor to stabilize. Then click a button and the program will reset the zero force reading.
Note: Because the force sensor is so sensitive, the updating display will never read a constant 0 when there is no Shock.
However, when force is correctly zeroed, you should see about the same amount of negative readings as positive readings.
36
(C) Performance Trends Inc 2012
Shock Dyno
Chapter 2 Definitions
Before re-zeroing, you should try to press lightly on the tester platform to see if there is any “stiction” causing hang up in the
testers force sensor. If pressing and releasing always brings up a completely different reading, there would be appear to be some
type of “hang-up” in the force sensor.
Eliminate Re-Zero Correction
Click on this option if you want to eliminate any Re-Zeroing effect on the Force sensor. The program will now convert voltage
from the electronics exactly as you originally calibrated it.
Display ...
These “Display” commands are of little value to the user. There are used primarily by Performance Trends technicians to
troubleshoot communications problems.
Force Gauge Scale
Click on this to select the range for the force gauge, from 0-300 up to 0-1800.
Maximum Shock Height
Click on this to enter the highest Shock height that will be displayed on the Height Bar Graph.
Minimum Shock Height
Click on this to enter the lowest Shock height that will be displayed on the Height Bar Graph.
Shock Dyno
Motor Control Options
Motor On Safe
Click on this to turn on the motor.
Motor Off <F12>
Click on this to turn off the motor, the same as pressing the <F12> key.
Start Recording Options
Start Recording Immediately
Click on this to set the mode where the recording starts immediately after pressing the <F1> key.
37
(C) Performance Trends Inc 2012
Shock Dyno
Chapter 2 Definitions
Start When up to Temperature
Click on this to set the mode where the recording starts only when the shock gets up to a predetermined temperature. Plus
version only.
Set Start Temperature
Click on this to set the temperature for starting recording. Plus version only.
Graphing
Show Graph
Click on this to turn on “real time” graphing, so you can see
immediately how this current test is comparing to the previous
test. This lets you spot problems before running the entire test.
Plus version only.
Hide Graph
Click on this to turn off the Graph. Plus version only.
Help
Brings up “on screen” help.
38
Real Time Graph (green dots show current
readings, black line graph is previous test)
(C) Performance Trends Inc 2012
Shock Dyno
Chapter 3 Output
Chapter 3 Output
The Shock Dyno provides several ways to view and output the test results for a complete test, including:
• Reports of tabular data displayed on the screen
• ASCII files for importing results to other software packages
• High resolution graphs
• Printer output of reports or graphs
• History Log (chronological list of test most currently worked with)
• Data Libraries for recording flow test data (or sets of Test Options) for later use.
All these topics will be covered in this chapter. Figure 3.1 shows how to reach all these various features.
Figure 3.1 Various Output Options from the Test Results Screen
Click on File to display several options to Save test files, Open test files which were previously
saved, display the History Log, or print information.
Click on Graph to display several Graph Options and produce a high resolution graph.
Click on Report to display several Report Options and produce a tabular report.
Once a report is displayed, it can be output as an ASCII file, or printed.
Open from History Log
Name of current Test File
displays a chronological
log of test files you have
recently worked with
(started new, opened,
made graphs or reports
of, etc.) Section 3.8.
Saving options to Save
a test file are discussed
in Section 3.6.
Opening options to
open a previously
saved test file are
discussed in Section
3.6.
Although Print options
are limited on the Main
Screen, most menus
have a Print button to
print that menu, or a
File command which
lists Print options
under it. See Section
3.5.
39
(C) Performance Trends Inc 2012
40
Shock Dyno
Chapter 3 Output
(C) Performance Trends Inc 2012
Shock Dyno
3.1 Reports
Chapter 3 Output
Figure 3.2 Report Options Menu
Click on the Report menu command at the Main Screen to be presented
with the Report Options Menu shown in Figure 3.2. The inputs in this
menu are described below.
Type
Several types of reports can be picked by clicking on the down arrow key
of this combo box. Reports can be for Intake and Exhaust Shocks, just
Intake Shocks, or just Exhaust Shocks. Report Types basically fall into 4
categories:
1.
2.
3.
4.
Std (standard) report, which includes the Data Types of: Shock
Rate, Open Force, Open Height, Seated Force, Seated Height,
Non Linear %, Bind Height, Clearance and Ht for Force for each Shock.
Time report, which includes the Data Types of: Shock Rate, Open Force, Seated Force, Bind Height, Clearance, Open
Vel, Close Vel, Cycle Time for each Shock.
Comparison Std (standard) Reports showing side by side comparisons of data included in a Std Report for 2 or more
tests. You can also choose Comparison Std + Difference which will include the difference between the 'Baseline' test
(the current test) and those you included in the comparison. You choose which tests to include in the comparison by
clicking on History Log at the top of the screen and putting a 'Yes in the 'Report?' column.
Force vs Height Details showing the Shock Force at various Shock heights for all Shocks side by side.
If you have selected that the intake and exhaust Shocks are to use the same specs in Test Options, then intake and exhaust
Shocks are listed together. Otherwise, the intake Shocks are listed first and the exhaust Shocks are listed second.
Definitions of Data Types:
Velocity is the shock velocity, typically in inches/second for English units..
Force is the force at each particular velocity .
41
(C) Performance Trends Inc 2012
Shock Dyno
Chapter 3 Output
Figure 3.5 Report showing 3 shocks and the amount of difference in force at the same
velocities. (Note that the program aligns the data to compare at equal velocities, even though
the shocks were not tested at the same velocities.)
Click on History Log to bring
up screen shown below.
Here you can select which
tests you want to include in
the “Comparison Reports”
by putting a “Yes” (clicking
on) the “Report” column.
Click on an existing “Yes” to
turn it off.
Tests marked “Yes” are included in
“Comparison Reports”.
42
(C) Performance Trends Inc 2012
Shock Dyno
Chapter 3 Output
3.2 ASCII Data Files
You may want to use the results from the Shock Tester in other
software packages. This could be for additional graph
capabilities, statistical analysis, data basing, etc. Once you have
created a report (as shown in Section 3.1), click on File to write
the results to an ASCII file with a name of your choosing. The
ASCII File command is possible any time a report is displayed
on the screen.
Figure 3.8 ASCII Files Options Menu
Click on File from Report
Screen for ASCII File menu
You can only save the results currently displayed on the Report
screen. If you want to write an ASCII file of a test file you have
previously run, you must open that test file first, then create a
report for that test file (unless you create a comparison report of
the current file with this previously run file).
ASCII File Options
Comma Separated
Select this option to insert commas between data points. Leave
this unchecked for data to be arranged in evenly spaced
columns.
Include Text
Select this option to strip out all titles and letters, leaving only numbers.
Convert to Columns
If you do not select this option, data will be written to the file much like it is displayed in the report on the screen. Select this
option to have the report turned on its side, that is, the rows will become columns and the columns will become rows.
Export to Microsoft Excel (tm)
Check this if you want the ASCII file you write to open more easily in Microsoft Excel. If you check this, the program will
check that you have checked Comma Separated, and have included a “.csv” extension to the end of the file name, which stands
for “comma separate variables”. Excel automatically recognizes this extension and opens the file more automatically.
You may also want to check Include Text. Though this is not required, it will make the data easier to understand in Excel.
File Name
Enter a file name for saving this ASCII file. Checks are made to ensure what you enter is a valid file name and that you are not
overwriting an existing file. The file is written to the Shock Dyno v1.1 folder (directory), the folder which contains the
Shock_Dyno.exe program file.
43
(C) Performance Trends Inc 2012
Shock Dyno
Chapter 3 Output
There are certain limitations for file names, including:
•
Names can only be 40 characters long.
•
Names can not contain certain characters, like question mark (?), slash (/), etc. The program will warn you if you use
an illegal character.
See Section 3.6 for more details on file names
Browse
Click on the Browse button to open a Windows screen to browse your computer to find an existing file. Then you can select to
delete it, rename it, choose it for the name of the new file you will save and then edit that name if you want.
Figure 3.8B Excel File for Comma Separated and Include Text
44
(C) Performance Trends Inc 2012
Shock Dyno
Chapter 3 Output
3.4 Graphs
Graphs are obtained by clicking on the Graph menu command at the top of the Main Screen or clicking on the Summary Graph
at the Main Screen. Figure 3.18 shows a typical graph and descriptions of some of the basic graph screen items.
Figure 3.9 Primary Graph Screen Items
Command buttons. Some commands can only be done through these buttons, some of these
buttons just provide a graphical button for performing action of some menu items.
Menu bar provides for several graph commands and options.
Graph Title, which can be changed by clicking on Format, then Edit Titles/Legend
Name of current Test File containing all spring data and specs
Graph Legend, which
describes the data
graphed. This includes
Name of the Test Results
file, Type of Data, which
data goes with which file,
if any multiplier is applied
to the data. You can
also click on Data Type
names and the
corresponding data line
will flash. This is useful
to find a particular line
when several are
graphed. The names in
the Legend can be
changed by clicking on
Format, then Edit
Titles/Legend.
Horizontal X axis. The scaling of this axis can be easily changed as
described in this section.
Grid lines. The style or elimination of grid lines can be changed by clicking on
Format, then Grid Style.
Data graph lines. The style and thickness of these lines can be changed by clicking on
Format, then Line Style. Bar Graphs also possible for certain graph types.
Vertical Y axis. The scaling of this axis can be easily changed as described in this section.
45
(C) Performance Trends Inc 2012
Shock Dyno
There are 3 basic types of graphs which can be made:
• Force vs Velocity
• Force vs Position (Plus version only)
• Data vs Time (Plus version only)
Chapter 3 Output
Figure 3.10 Graph Options Menu
You determine which type of data you graph by the Graph Type in the
Graph Options menu. See Figure 3.10.
Data Type
You can choose from the following Data Types to graph:
•
•
•
•
•
•
•
Force vs Velocity (standard graph for shock data)
Force vs Velocity +/- (another standard graph, but makes it
easier to spot data with graph cursor)
Force vs Velocity Loop +/- (Plus version only, and shows
hysteresis, an advanced term for detailed shock data)
Force vs Position (Plus version only, and is typically called a “football” or “potato” graph. This graph can also let
experienced shock tuners clearly spot problems.)
Velocity vs Time (Plus version only, typically used for troubleshooting sensors and data quality)
Force vs Time (Plus version only, typically used for troubleshooting sensors and data quality)
Position vs Time (Plus version only, typically used for troubleshooting sensors and data quality)
Figure 3.11 Comparison of 3 Categories of Data Type Graphs
Force vs Velocity
46
Force vs Position
Data vs Time
(C) Performance Trends Inc 2012
Shock Dyno
Chapter 3 Output
Graphs Comparing More Than 1 Test
There are 3 ways to pick which tests are graphed:
• Current test results. These are the test results of the test file which you are working with on the Main Screen.
• Tests marked in the History Log. These are the test results which you previously graphed, started new, opened, etc.
which you have marked “Yes” to graph in the History Log (see Section 3.8).
• Add Test lets you pick any test from the Test Library to add to the top of the History Log, and mark as a test you want
to graph. Since it is at the top of the History Log, it should definitely be included in the next graph.
You can compare data from up to 6 tests, as long as there is room for the Legends (labels) for each graph on the right side of the
graph. Usually this ends up being about 48 graph lines, which could be 6 tests with 4 graph lines (for example, Int only for 4
cylinders), or 3 tests with 8 graph lines (for example, Int & Exh for 4 cylinders), etc.
Figure 3.12 History Log (See Section 3.8 for more details.)
Click on the History Button or the History menu item to display the History Log.
Click on Single Test to graph only the Current Test.
Click on Add
Test to pick a
new test to add
the graph to
the History Log
from the entire
Test Library.
Choose a ‘Graph’
option from the
menu bar to
close the History
Log and graph
the tests
identified by the
menu option you
pick.
Click in this column
to show Yes or
remove Yes. Tests
marked Yes will be
graphed, if there is
room (typically not
more than 24 graph
lines total).
This column shows the
Standard name the program will
display in graph Legend for this
test. Click on the name to
change it. Alternate names are
possible by clicking on Format,
then Edit Titles.
Click and drag slide bar
to display entire History
Log. Some tests
marked Yes may be at
the bottom of the Log
and not be visible now.
47
(C) Performance Trends Inc 2012
Shock Dyno
Chapter 3 Output
Other Graphing Features
The graph screen has several other features, including:
• Printing
• Cursor to pinpoint the value of a particular point on the graph
• Changing titles and legend names
• Changing the scales
• Line Type (format)
These are discussed in this next section.
Printing
Figure 3.13 shows the options for printing graphs and how to access these options. Figure 3.14 shows the screen for changing
the Windows Printer Setup. Figure 3.15 shows how you can add information to a graph printout by clicking on Format, then
Edit Printed Comments and Data Output.
Figure 3.13 Printing Graphs
Clicking on the Printer button is the same as clicking on File and then Print Color.
Click on File to display the 3
print menu options
Click here to print the graph in
color (solid lines).
Click here to print the graph in
black & white (various styles of
dashed and solid lines).
Click here change the printer
or printer driver, page
orientation, etc.
Figure 3.14 Standard Windows Printer Options
48
(C) Performance Trends Inc 2012
Shock Dyno
Chapter 3 Output
Figure 3.15 Adding Information to a Graph Printout (Most of these options have no effect on the
graph on the screen, only the graph that is printed.)
Click on these #s to change which Data Set’s (test file’s) comments and title you are working with.
Click here to change the Test
Comments (comments which
appear on the Main Screen).
Changes to Data Set 1’s
comments (the current test) are
permanent. Changes to other
Data Set’s comments are
temporary.
This one comment is printed
directly under the graph.
The Titles to Use options give
you a way to reach the Menu in
Figure 3.26 to change the Titles
and Legends of the graph.
Check or uncheck these 3 options to determine what gets printed, and what options are enabled
and disabled on this screen.
Bottom
Section of
Printed
Graph
Graph
Comment
Test
Summary
Test
Comment
Data Table
49
(C) Performance Trends Inc 2012
Shock Dyno
Chapter 3 Output
Cursor
The cursor feature is very useful for determining or comparing the value of the graph lines at various places. See Figure 3.25
for explaining the use of the cursor.
Figure 3.16 Cursor Features and Commands
Cursor line, usually
pink or green,
depending on
background color.
Click here to turn cursor ON.
Click here to turn cursor OFF.
Click on these buttons to move the cursor left or right. Hold down the
<shift key> while clicking these buttons and the cursor moves faster.
You can enable the cursor by clicking on View, then Turn Cursor On.
The value of each
graph line at the
cursor is displayed
here, in this case
force in lbs.
The X value of the
cursor is shown
here, in this case
the Velocity is
1.50 inches/sec.
You can also enable the cursor by single clicking on a graph
line at a data point. This also provides a quick way to move
the cursor from 1 area of the graph to another. (Do not drag the
mouse while clicking or you will zoom in on that area.)
50
If you click on a graph line in
between data points, the
cursor will not appear. A
data point for this case is at
every grid line at .050”
steps.
(C) Performance Trends Inc 2012
Shock Dyno
Chapter 3 Output
Changing titles and legend names
Many times you may want to customize a graph by displaying and printing labels of your choice. Click on Format and then Edit
Titles/Legend to bring up the menu shown in Figure 3.17 which will allow you to do this.
Figure 3.17 Menu to Edit Title and Legend
This is the list of Standard names the program uses unless you click on the Use New
Titles button below. Select (click on) a Standard name you want to change. The
Standard Name appears in the edit box, along with the current New name if there is
one. Once you have selected a name from this list (that row will be highlighted) it
is easier to use the up and down arrow keys to select the next item to edit than
clicking the item with the mouse.
This is the list of New names the program will use if you click on
Use New Titles. If a title in the List of New Names is blank, the
program will use the Standard name.
Standard name from row selected.
New name for you to edit. Other options
include clicking on the Copy Std Name
to New or Blank Out New Name buttons.
Click here to close this menu and use
the New names you have entered.
Where New names have been left
blank, the Standard name will be used.
51
(C) Performance Trends Inc 2012
Shock Dyno
Chapter 3 Output
Changing the scales
Many times you may want to change the scale of the X or Y axis. This may be to show an area in more detail or to match the
scales of a previous graph. The Pro has several ways to change the scales as shown in Figures 3.18 and 3.19.
Figure 3.18 Changing Scales for the X or Y Axis
Clicking on these buttons shifts the
graph left, right, up or down. Hold down
the shift key while clicking on them and
the graph moves farther each step.
Clicking on these buttons zooms in or zooms
out on the graph, either vertically or horizontally Hold down the shift key while clicking on
them and the graph moves farther each step.
Click here to restore “autoscaling”. That is where the
computer picks the scale to
show all the graph in good
detail.
You can use the mouse to
outline an area to be zoomed
in on. Simply click on the
mouse key in the upper left
corner of the area, then hold
the key down and drag the
mouse to the lower right corner
of the desired area. A box will
be drawn as shown. When
you release the mouse key,
this area will fill the whole
graph. This feature is disabled
if the cursor is turned on. Also,
start the upper left corner well
away from a graph line or the
program may turn on the
cursor instead.
Figure 3.19 Menu to Specify Graph Axes Scales
This menu can be obtained 2 ways. You can click on View in the menu bar then Specify Scales
(axes), or click on the Set Scales button, the right most button on the graph screen.
Depending on the type of graph data you currently
working with, one of these 2 sections will be enabled.
You can Save these settings for easy
recall later, using the Open Saved
Settings, or Delete them from Saved
settings with Delete.
Click on OK to have the graph
redrawn to these new scale
The current scale limits are loaded
when this menu opens. Change any or
all these to most any value you want.
Click the Turn Autoscaling Off button
to turn Autoscaling Off to enable
changing specs in this menu.
52
(C) Performance Trends Inc 2012
Shock Dyno
Chapter 3 Output
Line Type (format)
For Shock Force vs Height, only Line Graphs are possible, but with different line thicknesses. For graphing results for
individual Shocks, line graphs are possible and 2D or 3D bar graphs. See Figure 3.20 below.
Figure 3.20 Alternate Line Types for Graphing Results for Individual Shocks
Click on
Format, then
Line Styles and
choose from
various line
thicknesses.
Thickest Lines
Thin Lines
53
(C) Performance Trends Inc 2012
54
Shock Dyno
Chapter 3 Output
(C) Performance Trends Inc 2012
Shock Dyno
Chapter 3 Output
3.5 Printer Output
The Shock Dyno can print the tabular test results of a report for a permanent hardcopy by clicking on Print in the menu bar or
the Printer icon. The menu of options shown in Figure 3.31 will appear. Check the options you want to use for the printout by
clicking on any or all of the Option boxes. All options and buttons are discussed in this section.
Figure 3.31 Printer Button and Print Menu Command Options - Report Screen
Click on Print or the Printer button
(shown hidden here) for the Printout
Options menu shown to the right.
This options lets you choose the
printer or printer driver being used by
Windows and also page orientation.
Check or uncheck these options, then click on this button to print the current
report with these options.
Test Results Report Options
Include Test Comments
Select this option if you want all the comments for the Test File printed with the results.
55
(C) Performance Trends Inc 2012
Shock Dyno
Chapter 3 Output
Request Report Comment
Select this option if you want to be asked for a comment for each particular report you send to the printer. These "report
comments" are useful to identify important points for future reference, like modifications, engine results, etc.
Larger Font (Print Size)
Check this option if your particular printer is printing the results with a small print font. This option will increase the font size
for some parts of some reports. Also see Preferences for Selecting Printer Fonts, page 26.
Other Print Options
Other menus have print menu commands or print buttons as shown in Figures 3.22 and 3.23.
Figure 3.23 Print Button
Many screens and
menus have a Print
button. Click on it to
print that particular
screen or menu.
56
(C) Performance Trends Inc 2012
Shock Dyno
Chapter 3 Output
3.6 Data Libraries
The Shock Dyno allows you to save a set of Shock Data and related specs (Test Options, etc) to the Test File Library under a
name of your choosing. You can then open these test files out of the Test File Library in the future for comparison or
modification. The Open window is below with explanations.
Figure 3.24 Test Library Options
Click on File, then Open (from all saved tests) to display Test Library shown here.
Click on File, then Save or Save As to save current test and specs to the Test Library.
Total # Tests in Library under this Folder
Name of chosen Test
(currently highlighted in
Test List)
Click and drag slide
bar to view all Tests
in list
Preview of Test
h
Single click on a Test
to choose it for
preview. Double click
to immediately open it.
Click here to
delete the
chosen Test.
Click here to bring up the Filter Options menu
where you can select to show only tests which
fit certain criteria. See Section 3.7.
Tests can be saved
under various
categories (folders) to
help you organize
large #s of tests.
Click on a different
name here and a
different list of Test
Files will be
displayed. The name
“Folder” can be
changed in the
Preferences menu to
most any word, like
“Customer” or
“Engine”.
Click here to bring up standard
Windows File Open screen, to let
you open a file in most any folder
(directory) and disk drive.
Click here to bring up “on screen” help.
Click here to close the Test Library with No changes (without opening a test)
Click here to open the chosen Test
57
(C) Performance Trends Inc 2012
Shock Dyno
Chapter 3 Output
Open a Test File
To open a test file saved in the Test Library, click on File at the upper left corner of the Main Screen, then on the Open (from all
saved tests). You also have an additional option of “Open (from History Log)” which will be discussed in Section 3.8.
You will obtain the window shown on the previous page. Single click on one of the tests in the list, or click and drag the slide
button on the right side of the list to display more tests. Once you single click on a test, it is now the Chosen Test File and a
preview of the test is given in the Preview section. If the file you chose was not a valid Shock Dyno file, the program will tell
you and you can not choose it.
Once a test has been chosen, you can delete it by clicking on the Delete button, or Open it by clicking on the Open button in this
window. You can also click on a different test to Preview it or close this window and return to the Main Screen without
choosing a new test file.
If you are sure of the test you want to open, you can simply double click on it from the Test List. This opens the test without a
preview and closes this menu.
Note: You can also save sets of Test Options to its own separate libraries. This is done very similarly as with the Test Files,
except you click on File, then Open from the Test Options menu. See Figure 3.25.
Save a Test File
Before you discuss saving a test file, it is important for you to understand how the program opens and uses test files. When you
open a test from the Test Library, you are only using a copy of the test. The original test file is kept in the library.
As you make changes to the test, they are only made to this copy. The original file is not changed. If you want to delete your
changes, you can simply open a fresh, unchanged copy of the original test file from the Library. If you want to keep your
changes, you must save them. This can be done by clicking on File, then Save. You are also asked if you want to save your
changes whenever you open a new test, and the program has detected you have made changes to the current file.
58
(C) Performance Trends Inc 2012
Shock Dyno
Chapter 3 Output
Figure 3.26 Saving Test File Options
Click on File then Save As to bring up this Save menu.
Click here to save specs to New Test name shown
New name to save test data to. Leave unchanged
and click OK to save to the current test name. (This
would be the same as clicking on File, then Save.)
Click on name in the box to change it, then click OK
to save it to the new name.
Name of current test file you are
working with.
Click on the down arrow button to pick a
different folder to save this test to. Note
that the top choice in this list is “Add
New Folder”. Pick this option and then
you can type in a new folder name,
This new folder name will be added to
the list so that you can save the test file
to that folder if you wish. The word
“folder” can be changed to most any
word in the Preferences menu, like
“Customer” or “Engine”.
Type in a New Folder Name here if you
select “Add New Folder” as the Folder
Name.
Click here to bring up standard
Windows File Save screen, to let you
save a file in most any folder (directory)
and disk drive, and to most any file
name. Note that files saved this way
are not found in the standard Test
Library and are not “searchable” using
the Filter options discussed in Section
3.7.
To save a Test File, you will be presented with the Save Window as shown above. The program suggests a new test name
which is the same as the current test name shown at the top of the Main Screen. If you want to save your changes to the same
name, simply click on OK. This will update the current test file with your latest changes.
If you want to save the current set of test specs with your changes to a new name (and leave the current test file in the Library
unchanged), then click on the suggested file name and modify it as you want. For example, in the window shown above, you
may want to add -2 to the current name “typical valve Shock” to create “typical valve Shock-2” to indicate this is the 2nd
revision of “typical valve Shock”. This is the safest way to make changes, because you can always return to an earlier version
and see what you had done.
Because the Suspension Analyzer is a 32 bit program (not compatible with the older Windows 3.1), it can use most any type of
file name. The names can be up to 50 characters long and can include spaces, and upper case and lower case letters. However,
there are certain limitations for file names, as they can not contain certain characters, like / \ : | > < * ? “ . The program
will warn you if you use an illegal character.
59
(C) Performance Trends Inc 2012
Shock Dyno
Chapter 3 Output
Test files are saved to folders (directories) you have created in the Shock Data folder (directory) in the Shock-V folder
(directory) under PERFTRNS.PTI folder (directory). You can copy Shock Dyno files from programs on other computers to this
folder (directory) and they will be found by the program. The Save to Floppy and Open From Floppy commands discussed on
page 18 are an alternate, perhaps easier way to copy files from one computer to another.
The method of saving Test Options files is exactly the same as complete Test Files, except that you access the Save menu by
clicking on File at the top of these individual menus, as shown in Figure 3.25. These files are saved to the Test Options folders
(subdirectories).
Advance Open or Save Screen
If you click on the Advanced button in
either the Open or Save As screen, you
will obtain the screen shown in Figure
3.27. From here you can access most and
file on the computer on most any disk
drive.
Figure 3.27 Advanced Open or Save Screen
Tips to Advanced
Users:
If you have a file from another computer,
from another disk (like a floppy) or
folder, you can simply copy it into any
folder in the Shock Data folder and it will
be found by the Shock Tester program.
This can be done with a program like Windows Explorer. You can also create new folders (directories) in the Shock Data folder
and these will also be used by the Shock Tester program.
60
(C) Performance Trends Inc 2012
Shock Dyno
Chapter 3 Output
3.7 Filter (find) Test Files
The Shock Dyno has a powerful way to search for tests in the Test Library called the Filter Option. Click on the Filter button in
the Open Test File menu (Figure 3.24, page 67) to be presented with the screen shown in Figure 3.28 below.
Figure 3.28 Filter Files Menu
Click on the down arrow button to pick the spec or comment to
check for a certain condition “Has this relationship”.
Click on the down arrow button to pick the condition to
look for. These change depending on the spec or
comment you have chosen.
Type in (or pick
from a list for
some specs)
the condition to
look for. The
program treats
UPPER and
lower case
letters the
same (bowtie =
BOWTIE =
BowTie).
Check here to
include a 2nd
condition. This
enables specs in
this section.
Click on this button to return to
the File Open menu which will
now show all test files.
Click here to produce a report of all files meeting the
Filter conditions IN ALL FOLDERS in the SpringData
folder (the entire Test Library). This way you can avoid
looking in each folder separately and can save time.
Click on this button to return to the File Open menu which will now only show files which fit
the Filter Conditions.
Select And and the Test Files displayed must fit both conditions specified. Select Or and the Test
Files displayed can fit either of the conditions specified.
The settings in this screen will display all test files with the word BowTie (or bowtie or
BOWTIE) somewhere in the test comments and with the word Johnson (or johnson or
JOHNSON) somewhere in the Customer description (a spec in the Test Options menu).
The Filter Feature is very useful for finding a specific test or to find all the tests which meet a certain set of conditions. For
example, say you want to find a test that Operator “Jack” ran for Customer “Smith” on “Big Block Chevy” Shocks. Or, say you
are having problems with a certain brand of valve Shocks, where the part # you record in the comments starts with "NAP". Or
perhaps you want to find all Small Block Chevy Shocks that measured over 400 lbs at Open Height on the exhaust. In all these
cases, the filtering specs would allow you to find the test files.
61
(C) Performance Trends Inc 2012
Shock Dyno
Chapter 3 Output
First you must select the condition you want to look for by clicking on the down arrow button on the 'This comment or spec'
box. Your choice of this spec will determine what the 'Has this relationship' options are, and what specs can be entered in the
'To what I enter here' spec.
You can select up to 3 conditions to look for. For the Operator “Jack”, Customer “Johnson”, “Big Block Chevy” example
above, you would need to search for 3 conditions. For the valve seal example, you could just search for 1 condition (look for
“NAP” in the test comments). You add conditions by checking the 'Include this condition also' box. This enables the other
specs for each condition.
If more than 1 condition is being used for the search, you must determine if you want the search to include tests which fit ANY
of the conditions (Or) or must match ALL conditions (And). For example, if you are looking for tests run by either Operator
Jack or Operator Joe, you would select “Or”. If you want Tests which measured more than 400 lbs at the Open Height on
Exhaust and were done since Jan 1999 (the tests must match both conditions), you would select “And”.
The 3 command buttons will do the following:
Show Files Only Fitting These Conditions will return you to the Open Test File screen. Only files fitting these
conditions will be displayed (which may be no files in some situations). You can click on various folders (or whatever name
you have given to folders in the Preferences menu at the Main Screen) to see if there are any matches in other folders.
Turn Off Filtering (show all files) will return you to the Open Test File screen and now all files will be displayed.
Print List of All Files Fitting These Conditions will search through the entire Test Library (all folders in the
ShockData folder) for files matching these conditions and display them in a new screen. From this screen, you can also print the
list. This is the quickest way to see which folders may contain test files matching your conditions.
Tip: When looking for a word, the program doesn’t care if it is in CAPITAL (upper case) or small (lower case)
letters. In Figure 3.37 above you are looking for the word BowTie in the test comments. The program will display
all files which have the word “BowTie” or the word “BOWTIE” or the word “bowtie” or the word “BowTIE”
anywhere in the comments. The program will not find files with the words “Bow Tie” (with a space between Bow
and Tie) . Therefore, it may be smarter to just look for the word “bow” to avoid this problem. Note, however, that
if you do this, the program will also find tests with the word “elbow” or “crossbow” , for example, in the test
comments.
62
(C) Performance Trends Inc 2012
Shock Dyno
Chapter 3 Output
3.8 History Log
Click on File, then Open form History Log at the Main Screen to obtain the History Log shown below in Figure 3.29. This
screen shows a summary of the results for the last 25-100 tests you have worked with (started new, opened, graphed, etc.) The
number of tests in the log (25-100) is selectable in the 'Preferences' menu at the Main Screen. When you work with a new test, it
is added to the top of the History Log, and (if the Log is full) the last run drops off the bottom of the list. In the Pro Version, the
History Log is an alternate way to open tests which have been saved to the Test Library. The advantage of the History Log is it
lists the tests you most recently worked with at the top.
Figure 3.29 History Log and Options
Click on File, then Open from History Log
Click on Test Title to Open that Test File.
Click in the Save
column to enter a
Yes or erase a
Yes. All tests
move to the
bottom of the
History Log and
eventually fall off
the list as you
work with new
tests. However,
Tests marked Yes
do not fall off the
list.
Click and move
slide bar down to
display all 25-100
tests in the
History Log.
Click and move
slide bar right to
display more
columns of test
results.
From this screen you can open a test file by clicking on the 'Test File and Path' column (first column on the left). If the test file
was saved to a standard folder (directory, or whatever you have chosen to call folders in the Preferences menu), the folder name
is given first, followed by the test file name.
If a test file has been Opened from or Saved to a non-standard folder (a folder not in the ShockData folder) using the 'Advanced'
function, the entire path is given. If the 'Path and File Name' won't fit, it is shortened and preceded by '...'.
You can choose to Save certain results you believe are special and you may want to recall or graph in the future by clicking on
the Save column to insert a Yes there. Tests marked Yes to Save eventually move to the bottom of the History Log, but are
never dropped off the list or erased until you again click on the Yes to make it blank.
63
(C) Performance Trends Inc 2012
Shock Dyno
Chapter 3 Output
Note that just the Test File Name stays in the History Log. Should you delete the file using the Open (from
all saved tests) command, the test file will be deleted. When you try to open it or graph if from the History
Log, you will get note saying the file can not be found.
You can print the History Log on a printer by clicking on the 'Print' menu command. Note that the History Log will be most
readable when the Page Orientation is in Landscape setting.
History Log at Graph Screen
At the Graph Screen, several options are available to graph selected tests from the History Log, and change the Graph Titles.
You can obtain the History Log by clicking on the menu command History Log at the top of the Graph Screen. The History Log
is how you graph different tests together for comparison. From this screen you can:
•
•
•
•
64
Choose to Graph certain Test Results by clicking on the Graph column to insert a Yes there. Tests marked Yes to
Graph will be graphed when you click on the 'Graph Tests Marked 'Yes' '. The first test (usually the current Flow Test
you are working with) is always graphed even with no Yes marked. The number of tests actually graphed is limited by
available space, usually a limit of about 48 graph lines total.
Graph only the current test results (the test file at the top of the Log) by clicking on 'Graph Current Test Only'.
Click on 'Graph Title' to change the Standard Title for this test. The program defaults to putting in the Head # unless it
is blank, when it then puts in the test file name. (You can also specify 'Alternate' titles and legend names by clicking on
'Format' at the top of the Graph Screen, then 'Edit Titles/Legends'.)
Choose to Save certain results you believe are special and you may want to recall or graph in the future. See the Save
explanation of the previous page
(C) Performance Trends Inc 2012
Shock Dyno
Chapter 3 Output
Appendix 1 Accuracy and Repeatability
Accuracy
The difference between repeatability and accuracy is a concept few people understand. Graphically, accuracy and repeatability
is shown in Figure A.1. Think of the Shock tester as an "archer" which is trying to hit the "bull’s eye" or the true Shock
measurements. Let's say the true Shock Force at 5”/sec was 245.5 lbs, but one shock dyno always comes up with values
between 230 to 231 lbs. This dyno is not very accurate, but is very repeatable (only a 1 lb spread in data). Another dyno comes
up with measurements which vary from 241 to 250 lbs, which average out to the true 245.5 lb. This tester with the 9 lb/inch
spread in data is not nearly as repeatable as the first, but is more accurate.
Ideally, you want both a repeatable and accurate Shock dyno, but this is not always possible. When are accurate measurements
and repeatable measurements most desirable?
• If you very accurately want to determine if a Shock is different than another Shock, or has changed from when it was first
installed in the engine, the repeatable dyno is the one to use.
• If you want Shock data
Figure A1
to prove to a chassis
tuner that these Shocks
Repeatable Measurements
Accurate Measurements
will work with their
produce the same readings, test
produce a reading which is close
suspension, for other
after test, but the reading may
to the true reading, which is a
people to compare their
not be the true CFM.
reading other accurate flow
Shocks with, you are
bench testers would get.
better off with the
accurate tester.
• If you must prove the
Shocks you are selling
are within your
customer’s specs, you
need the accurate dyno.
• If you want Shocks
specs to use in a
suspension simulation
computer program, you
are better off with the accurate dyno.
The accuracy of your dyno will depend on many things:
• How you calibrate it and how well it holds calibration. See Section 2.4. The length measurement calibration is fairly
easy to keep accurate as blocks of a specific height (thickness) are easy to obtain or make. The force measurement is
more difficult. It is best to hang a known weight as shown in Section 2.4, Figure 2.2.
• Mechanical “soundness”. This includes keeping clearances to a minimum, so the shock is not being jerked around.
You want smooth cycles with continuous up and down motion, no sticking, not “slop” in clearances, and no motor
speed control which can be cycling power to the motor.
Repeatability
Performance Trends has developed sophisticated math to analyze the raw data recorded from the Shock dyno to make it the most
repeatable software in this price range. This is done by averaging several cycles together. The more recording time you specify
in the Preferences section, the more repeatable the measurements. The statistical analysis of the Shock Dyno can take this data
and obtain true Shock rates which can repeat within 1 lb or better.
65
(C) Performance Trends Inc 2012
66
Shock Dyno
Chapter 3 Output
(C) Performance Trends Inc 2012
Shock Dyno
Chapter 3 Output
Appendix 2 Backing Up Data
Backing up data means to make more than one copy of the data which can be used or referred to at a later date. This may be
needed in the event one copy becomes lost or erased, or you need room in the Flow Test Library. Backing up data can take 2
basic forms:
Paper Reports
Copying files with Windows copy commands
Other than making Paper Reports, backing up data requires knowledge of Windows Explorer commands. Unless you are
experienced with Windows commands, have someone experienced with Windows assist you to prevent losing data.
Paper Reports:
If you already keep written copies of all Shock tests you perform, you already understand this form of backing up data. When
you finish a test, print out the various types of reports for this test. Simply store this paper report in a safe place.
Disadvantage of Paper Back Ups:
For example, say you have accidentally erased a Shock test file but have a paper report of that data. From these paper
reports, there is no way to do a comparison graph to other Shock test, or recalculate the Seated Force from a new Seated
Shock Height, etc. What you printed out is all these test results will ever be.
Copying data to disk with Windows commands:
Obviously copying the data to disks is the preferred method of backing up because you can do all sorts of analysis or
modifications from computer data that is just not possible from paper back ups. If you are not familiar with Windows
commands, have someone help you the first couple of times. However, this is the most reliable and most efficient way to back
up your data.
Note: Unless stated otherwise, all mouse clicks are with the normal, left button on the mouse.
To copy Entire ShockData Folder using Windows Explorer, which contains all folders and test files in the Test Library:
Click on Start, then Programs, then Windows Explorer (usually at the bottom of the list of programs). You will obtain the
Windows Explorer screen shown in Figure A5.
Locate the PERFTRNS.PTI folder (may not be printed in capital letters) on the left side of the Windows Explorer screen,
usually on the C drive. Click on the [+] sign to the left of it to display the contents of the PERFTRNS.PTI folder.
You should now see the Shock-V folder. Click on the [+] sign to the left of it to display the contents of the Shock-V folder.
You should now see the ShockData folder. Right click on the yellow ShockData folder icon to display the menu of
options. Click on the Copy command to copy this entire folder (all test files in the standard Test File Library).
67
(C) Performance Trends Inc 2012
Shock Dyno
Chapter 3 Output
Figure A5 Copying Files with Windows 95, 98 or NT Windows Explorer
Find the PFA30 folder under the PERFTRNS.PTI folder, usually on the C drive.
Click on the [ +] box to the left of a folder to show its contents (folders).
Click and drag
the slide bar
button to move
up and down
the list of
folders.
The contents
of the open
(clicked on)
folder on the
left is shown
here, including
both folders
and files.
Right click
(with the right
mouse button)
on the
PFADAT folder
(not seen here)
to open a
menu of
options.
Click on Copy
to copy the
entire contents
of the PFADAT
folder (the
entire test file
library). DO
NOT click on
Cut.
Drag slide
bar to the
top of the
list to find
your
Floppy disk
drive
(usually A)
68
Right click on
the Floppy
drive icon.
Then click on
Paste to paste
whatever you
copied (in this
example, the
entire PFADAT
folder) to the
disk in the
Floppy drive.
(C) Performance Trends Inc 2012
Shock Dyno
Chapter 3 Output
Now you must tell the computer where you want to copy the files to. Click and drag the slide bar for the left section of the
Windows Explorer screen to the top. (You can also click on the up or down arrow buttons on the slide bar.) Look for the
Floppy Drive icon, usually the “A” drive. Put a new, formatted disk in the floppy drive. Then right click on the Floppy
Drive icon, and select Paste from the list of options. You will see the floppy drive light come on as the entire ShockData
folder and all its contents are copied to the floppy disk. Label this disk with something like “ShockData folder, xx/xx/xx”
with a name and date.
Notes:
If you have so many tests in the Test Library, they may not all fit onto 1 floppy disk. Windows Explorer will tell you this and
ask you to insert another new, formatted disk. If this happens, be sure to label all disks with a name, date and sequential #s, and
keep the entire disk set together. A suggestion for novice computer users is to make each folder under ShockData a separate
floppy disk. This may require more floppy disks, but will make it easier to understand restoring just certain folders in the future.
You may just want to back up one particular folder in the test library (in the ShockData folder) or just 1 particular test. You
would do this the same as with copying the entire ShockData folder, just click on the [+] by the ShockData folder to display the
folders under ShockData. Then right click on the folder you want to Copy. To find individual test files, click on the yellow
folder icon containing the test file and the contents of the folder will be shown on the right side of the Windows Explorer screen.
Then right click on the test file name and select Copy.
You can also copy individual test files to the floppy drive inside the Shock Dyno Analyzer program. Open the file you want to
copy so it is the current test file. Then click on File at the top of the Main Screen, then select Copy to Floppy Disk.
More experienced computer users may want to use the “Backup” features built into Windows 95 and 98 (click on Start,
Programs, Accessories, System Tools, Backup). This compresses test files so it takes fewer floppy disks. However you need to
use the Backup program to restore test files, which can be more confusing to novice computer users.
Restoring Data
Be very careful when restoring data, as you may overwrite Test Files with old, erroneous
information. Read all the information below before restoring data. If you are not familiar with
Windows Explorer, have someone more experienced help you.
The ONLY reason to restore data is if you have lost test files. This could be because you
mistakenly erased it, you had a major computer failure, or you are moving the program to
another computer. Do NOT restore data unless you have one of these problems, as you could
possible create many more problems than you are trying to fix.
When restoring test files and folders, you pretty much reverse the procedure for backing up. First you put your backed up
floppy disk in the floppy drive. Then open Windows Explorer, find the Floppy drive icon and click on it to display its contents.
Right click on the folder you want to restore and select Copy.
Now find the ShockData folder under Shock-V under PERFTRNS.PTI, usually on the C: drive. Right click on the folder
1 level up from the folder you are restoring. For example, if you are restoring the test file folder CHEV which was in the
ShockData folder, you must click on the ShockData folder. If you are restoring the entire Test Library folder ShockData, you
must click on the Shock-V folder. If you are restoring the test file 194-150 which was in the CHEV folder under the ShockData
folder, you must click on the CHEV folder.
69
(C) Performance Trends Inc 2012
Shock Dyno
Chapter 3 Output
During the restoring (copying) process, Windows Explorer checks to see if it is overwriting an existing file (Figure A6). If it is,
it will ask you if the existing file or folder should be overwritten. Be very careful when overwriting files, as you may overwrite
a new test file with data from an old test file of the same name.
Before restoring test files, it is good practice to back up all test files first. Then if you make a
mistake, and overwrite test files you didn’t mean to, you have your backup copies to restore
the test files from.
Figure A6 Windows Explorer Warnings when Overwriting Test Files
Overwriting a Test File
Overwriting an Entire Folder (several files)
Be very careful selecting
this option, as several files
may be overwritten at once.
70
(C) Performance Trends Inc 2012
Shock Dyno
Chapter 3 Output
Index
back up, 67, 69, 70
calibrate, 25, 26, 27, 65
calibration, 25, 26, 27, 28, 33, 36, 65
CD, 4, 5, 15, 20
CD/Zip Drive, 15, 20
Color, 22
Com Port, 27
Comma Separated, 43, 44
Comment, 26, 27, 56
Company Logo, 20
copy, 2, 5, 15, 19, 20, 25, 58, 60, 67, 69
Current Test, 64
Cursor, 48, 50
customer, 13, 23, 65
Customer, 1, 9, 20, 23, 61, 62
Cycle Time, 35, 41
Cycle, test, 12, 35
Legend, 51
Length Sensor Offset, 25
Library, 9, 10, 14, 19, 47, 57, 58, 59, 61, 62, 63, 67, 69
Logo, Company, 20
Main Screen, 5, 2, 5, 6, 7, 9, 10, 11, 14, 15, 16, 17, 20, 31,
32, 33, 34, 35, 41, 45, 47, 58, 59, 62, 63, 69
Main Screen XE "Main Screen" Graph XE "Graph" Lines,
17
Master Tester Specs, 25
Maximum Shock Height, 37
Microsoft, 3, 43
Minimum Shock Height, 33, 37
Motor Control, 17, 18, 35, 37
Motor relay, 34
network, 19
New Test, 5, 14, 31, 32
Offset, 25, 26, 27, 28
date, 8, 12, 32, 67, 69
Debugging, 36
delete, 44, 58, 64
Disk, 20, 69
Electronics, 17, 27, 33, 36
errors, 19, 20, 31
Excel, Microsoft, 43, 44
F1, 35, 36, 37
F2, 17, 35, 36
Factor, 26, 27, 28
Filter, 5, 1, 12, 61
Filtering, 62
Floppy, 60, 69
Football Graph, 46
Force Gauge Scale, 33, 37
Force Sensor Offset, 26
Force vs Position, 46
Force vs Velocity Loop, 46
Format, 48, 51, 64
Graph, 7, 12, 13, 15, 17, 20, 22, 37, 45, 46, 49, 52, 64
Graph Title, 64
Graph Type, 7, 46
Grid, 13
Help, 2, 5, 7, 8, 13, 16, 22, 23, 31, 38
History Log, 5, 1, 14, 17, 39, 41, 47, 58, 63, 64
Hysteresis, 46
Include Text, 43, 44
Install, 15, 36, 48
legend, 48, 51, 64
Perf Trends’ Gen 2 USB Logger ., 27
Plus Version, 12, 13, 17, 18, 35, 38, 46
Preferences, 5, 7, 16, 17, 19, 22, 32, 35, 56, 62, 63, 65
Printer, 5, 15, 20, 36, 39, 48, 55, 56
record, 1, 5, 33, 34, 61
Recording Time, 17
Reg Code, 5
Reg Name, 5
registered, 3, 5
Remember Size of Tester Screen, 17
Report Type, 41
resize, 33
Retrofit kit, 34
Re-Zero, 28, 33, 36, 37
Safe, 37
Safety, 3, 30, 34
save, 1, 7, 8, 9, 14, 15, 17, 25, 31, 34, 36, 43, 44, 57, 58, 59
Scales, 52
Set Graph Colors, 22
Set Start Temperature, 38
Settings, 16, 25
Setup, 15, 36, 48
Shock Dyno, 1, 4, 1, 2, 3, 4, 5, 6, 9, 15, 17, 18, 19, 20, 25,
34, 37, 39, 43, 55, 57, 58, 60, 61, 65, 69
Shock Dyno Agreement Warning Limit, 18
Shock Dyno Controls Motor, 18
Slow Down Data Readings, 18
Start When up to Temperature, 38
Stop Showing Help XE "Help" Tips, 22
Temperature, 8, 12, 27, 35, 36, 38
Test Cycle, 12, 35
71
(C) Performance Trends Inc 2012
Test Data, 11, 13, 14, 33
Test Options, 5, 15, 19, 23, 31, 39, 41, 57, 58, 60
test time, 1, 12
Time/Date, 12, 32
Tips, 6, 22, 60, 62
Turn On Restart Showing Help XE "Help" Tips, 22
Type, 5, 41, 46, 48, 53
72
Shock Dyno
Chapter 3 Output
Use Alternate Location for Files, 19
Velocity, 2, 7, 13, 17, 41, 46
Warn About Slowing Down Readings, 18
Windows, 1, 3, 1, 2, 15, 19, 20, 36, 44, 48, 59, 60, 67, 68,
69, 70