1
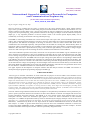
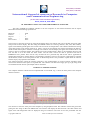
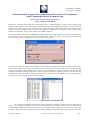
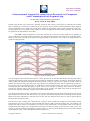
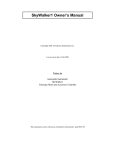
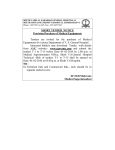
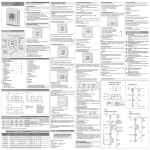
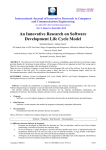
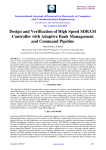
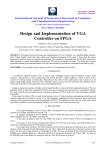
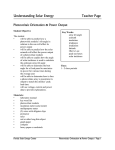
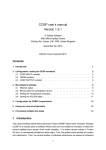
ISSN(Online): 2320-9801
ISSN (Print): 2320-9798
International Journal of Innovative Research in Computer
and Communication Engineering
(An ISO 3297: 2007 Certified Organization)
Vol. 3, Issue 6, June 2015
Development of Computer Interface and Data
Analysis Software for Multi-Wavelength
Radiometer
Sree Lakshmi Ashokkumar, Robert S, Dinakar Prasad Vajja, Pramod PP, AjeeshKumar PS
M Tech Student, Dept. of CSE ,Marian Engineering College , Kerala University , Trivandrum, Kerala, India
Asst. Professor, Dept. of CSE. , Marian Engineering College , Kerala University , Trivandrum, Kerala, India
Scientist/Engineer, Space Physics Laboratory, Vikram Sarabhai Space Centre, Trivandrum, Kerala, India
Scientist/Engineer, Space Physics Laboratory, Vikram Sarabhai Space Centre, Trivandrum, Kerala, India
Scientist/Engineer, Space Physics Laboratory, Vikram Sarabhai Space Centre, Trivandrum, Kerala, India
ABSTRACT: Sun-photometry at single or multi-wavelength has been a subject of interest in atmospheric science for
about two centuries. The sun photometer measures solar radiance and the measured radiance convey the effect of
absorption or scattering by the Earth's atmosphere. The Multi-Wavelength Radiometer (MWR) designed and developed
by Space Physics Laboratory (SPL) of Vikram Sarabhai Space Centre (VSSC) is based on the sun photometry and is
used for aerosol research. Aerosols are the suspended tiny particles in the atmosphere, which significantly affect the
solar radiation flux reaching the Earth surface by absorption as well as scattering. The MWR gives electrical output
signal Vλ, which is directly proportional to the solar flux, Fλ, where λ is the wavelength of the radiation. The MWR is a
stand-alone system for which software is required for transferring data to computer and for further analysis. This paper
presents the development of the computer interface and data analysis software for the MWR. The software is developed
in LabVIEW and has the functionality to acquire the data from MWR via RS232 port and screen the data. The
sophisticated scientific algorithms have been implemented in the software to calculate the Aerosol Optical Depth
(AOD) for different wavelengths, which is an important parameter required for the aerosol studies.
KEYWORDS: Multiwavelength Radiometer, sun photometry, aerosol optical depth, LabVIEW .
I. INTRODUCTION
Aerosols are tiny particles suspended in the atmosphere which may in solid form, liquid form, and may be a
mixture of both. Aerosols are produced as a result of volcanic eruption, forest fire, and many other natural and
anthropogenic mechanisms. Aerosol studies are very important as they have a great impact on atmosphere [1]. Multiwavelength Radiometer (MWR) works on the principle of sun photometry [2] and was developed for aerosol research.
As per Lambert-Bouguer-Beer law, the solar flux (Fλ) at the wavelength λ which reaches the surface of the
Earth, is related to the solar flux at the top of the atmosphere (F 0λ) through
Fλ = F0λ ( d0 / d)2 exp (-mƮ λ)
where, do and d are the mean and instantaneous Sun-Earth distances, Ʈλ the columnar total optical depth of the
atmosphere at wavelength λ, and m is the relative air mass, which accounts for the increased distance traveled by the
solar radiation incident away from zenith. The MWR is designed to give an electrical output signal V λ, which is directly
proportional to Fλ, so the above equation can be re-written as,
Vλ = V0λ ( d0 / d)2 exp (-mƮ λ)
The above expression can be written in logarithmic form as
Copyright to IJIRCCE
DOI: 10.15680/ijircce.2015.0306024
5125
ISSN(Online): 2320-9801
ISSN (Print): 2320-9798
International Journal of Innovative Research in Computer
and Communication Engineering
(An ISO 3297: 2007 Certified Organization)
Vol. 3, Issue 6, June 2015
log Vλ = log V0λ +2log ( d0 / d) - mƮ λ
Since F0λ and do are constants and d is nearly a constant for a day, above equation shows a linear relation between
logVλ and m, provided Ʈλ remains constant during the period of measurements. If continuous measurements of V λ are
made as a function of time during a day, a plot of logV λ against m will be a straight line. The slope of the straight line
will give the total optical depth Ʈλ. This procedure is known as the Langley technique. From the columnar total optical
depth (Ʈλ), a very important parameter in aerosol research which is the Aerosol Optical Depth (AOD), can be
calculated by accounting for molecular scattering and absorption [3].
The MWR is a sun tracking instrument and consists of three major units- Optics unit, Control and Data acquisition unit
(CDU), and Computer Interface Software. The optics unit uses optical filters for required wavelength selection from
solar spectrum. Ten different wavelengths in the range of 380 nm to 1025 nm will be selected and AOD will be
calculated for each wavelength separately. The optical filters are mounted on a rotating disc. Neutral density filters of
appropriate values of attenuation are also provided to avoid saturation of the photo detector. The band-selected solar
radiation is then focused to a photo-detector by using a lens, where the light intensity is converted to voltage. Stepper
motors are used in the optics unit for tracking the sun for continuous measurements of solar radiation.
The Control and Data acquisition Unit (CDU) controls the over all operation of the MWR. It gives command to optics
unit to track the sun continuously. It also gives command to rotate filter disc for proper wavelength selection. The CDU
receives analog voltage signal corresponds to band selected solar radiation from optics unit. The CDU performs analog
to digital voltage conversion. The MWR CDU will acquire voltage from photo detector corresponding to band selected
solar radiation. One scan corresponds to the acquisition of voltage from all ten different wavelength optical filters. The
default scanning interval is 2 minutes. The CDU makes a data string and sends through RS232 port of the instrument.
At the same time the voltage corresponding to each wavelength will be stored in an internal memory card with time and
date stamp. MWR uses GPS module for accurate time and date information. The CDU has a keypad and an LCD screen
for user interface. It has RS232 interface for communication with computer.
This paper explains the development of computer interface and data analysis software for MWR. The software is
developed using the graphical programming language LabVIEW [4].
II. RELATED WORKS
Various types of scientific instruments are used world-wide for purpose of aerosol studies. The instruments can be
broadly classified in to satellite based and ground based. The first satellite instrument which was capable of monitoring
aerosol optical depth from space was the Advanced Very High Resolution Radiometer (AVHRR) that retrieved optical
depth from measurements in the visible and near-infrared spectrum in late 1970s. AVHRR was a passive radiometer
that measured the intensity of sunlight as it reflected off aerosols, using the dark ocean as the background. Newer
radiometers such as the Multi-angle Imaging Spectroradiometer (MISR) and the Moderate Resolution Imaging
Spectroradiomer (MODIS) are capable of viewing aerosols at many more angles and wavelengths, providing more
accurate results. The Cloud Aerosol Lidar and Infrared Pathfinder Satellite Observer (CALIPSO) used a laser-based
technology that provided detailed vertical profiles of aerosol plumes and clouds.
The most well known ground based AOD retrieval techniques are sun photometry and LIDAR. The sun photometry is a
passive optical system that measures the extinction of direct beam radiation in distinct wavelengths and retrieves the
aerosol contribution from total extinction. The LIDAR is an active optical system which transmits light in to the
atmosphere and then collects the backscatter light signal to retrieve the aerosol attenuation in total columnar
atmosphere. The CIMEL sun-photometer used by NASA is calibrated by the Langley technique. MICROTOPS II Sun
photometer is a 5 channel hand-held sun photometer for measuring the instantaneous aerosol optical depth. The Sky
Radiometer, manufactured by Prede Co. Ltd, Japan utilizes the software SKYRAD.PACK for the PC interface and
data analysis. A number of ground based observatory-networks have been established worldwide to measure the
aerosol optical depth. AERONET of USA, CASRNET of China, ARFINET of INDIA are the few examples. All these
scientific instruments need computer interface softwares specifically designed for them.
Copyright to IJIRCCE
DOI: 10.15680/ijircce.2015.0306024
5126
ISSN(Online): 2320-9801
ISSN (Print): 2320-9798
International Journal of Innovative Research in Computer
and Communication Engineering
(An ISO 3297: 2007 Certified Organization)
Vol. 3, Issue 6, June 2015
III. IMPLEMENTATION OF COMPUTER INTERFACE SOFTWARE
The CDU of MWR has an RS232 interface to the user computer. So the software should be able to acquire
RS232 data with the following specifications:
Baud rate
Data bit
Stop bit
Parity
Flow control
:
:
:
:
:
9600
8
1
None
None
The user has to select the serial port by using the dropdown menu. The software will receive the data string from CDU
and provide an online display. The data string from MWR contains $ as starting character, date, time, filter number,
signal value and background signal value in milli-volts for all ten wavelength filters. The software identifies the starting
of the data string by using starting character $. After a scan of ten wavelengths, the software will display the data in a
tabular format with respect to the filter wavelength. The software will also display the signal value of all 10 filters with
respect to time in a graphical format. The software will create a folder namely “Data” in the installation directory and
save the data in to a file inside the “data” folder. The file name will be the date of operation and will be
DDMMYYYY.acq format. There will be only one data file for a particular day and the file will be appended for
multiple data acquisition. Another feature is an Ephemeris calculator. The user can enter the required date to calculate
the declination, radius vector and equation of time. A detailed help menu is also provided to explain about the software
and the step-by-step operation of the MWR.
The important function which the software performs is the implementation of cloud screening algorithm which
removes the unwanted cloud points in acquired data. The software will make the Langley plot [5, 6] by using cloud
screened data and the aerosol optical depth will be calculated.
IV.RESULTS AND DISCUSSIONS
The computer Interface software has been implemented in Lab VIEW. Fig. 1 shows the front panel of the computer
interface software.
Figure 1. front panel of computer interface software
The user has to select the serial port of the computer by using dropdown menu. The indicator will become green after
getting the first string of data from MWR CDU. The software will display the date and time. The filter number and
signal value and background value are displayed using text indicators. The time of last scan performed will also
Copyright to IJIRCCE
DOI: 10.15680/ijircce.2015.0306024
5127
ISSN(Online): 2320-9801
ISSN (Print): 2320-9798
International Journal of Innovative Research in Computer
and Communication Engineering
(An ISO 3297: 2007 Certified Organization)
Vol. 3, Issue 6, June 2015
displayed. It will display the file path of the stored data. There is a graphical display of voltages acquired during each
acquisition with respect to time. The voltages corresponding to all 10 wavelengths of acquisition have been combined
and plotted on a single graph. Three main menus are provided on the front panel of the software. The “Process” menu
contains “acq to dat”, “Cloud Screen”, “FN AN” and “Ephemeris” submenus. The “Analysis” contains “Langley Plot”
submenu and the “Help” menu contains “about” and “MWR” sub menus.
The software will write the data to DDMMYYYY.acq file in the order of data acquisition. For analysis the data has to
be formatted and to be arranged in the order of filter number. The “acq to dat” sub program will perform this
conversion. Fig. 2 shows the operation of conversion from .acq to .dat file.
Figure 2. Conversion from .acq to .dat
The user has to select the .acq file to be formatted. User can select the condition of the sky on the data acquisition day,
from the drop down menu. The drop down menu contains 4 item namely “Clear”, “Hazy”, “Cloudy”, and “Partially
cloudy” to represent the sky condition. The user has to press OK button to start the conversion. The software will
calculate the ephemeris parameters and write to .dat file. The user selected sky condition will also be saved to file. This
information is required to assess the AOD for a particular day. The .dat file will be stored in the same directory where
the .acq file is stored. Fig.3 shows the .acq file and .dat file.
Figure 3. Data saved as .acq and .dat file
The “date.acq” file contains the data in the order of acquisition. First line is the date of the data acquisition in
“dd mm yyyy” format. Second line to eleventh line contains the time in “hhmmss” format, filetr no, signal voltage
value and signal background value corresponds to all 10 wavelength of data acquisition. Line 1 to line 11 is called one
set of data. This block will be repeated for each set of data acquisition. The default value of data acquisition interval is
Copyright to IJIRCCE
DOI: 10.15680/ijircce.2015.0306024
5128
ISSN(Online): 2320-9801
ISSN (Print): 2320-9798
International Journal of Innovative Research in Computer
and Communication Engineering
(An ISO 3297: 2007 Certified Organization)
Vol. 3, Issue 6, June 2015
2minuts. This file has to be converted to “date.dat” format for data analysis. The first line of “date.dat” file contains
date in “dd mm yyyy” format, sky condition as per user selection. The second line contains Declination angle, Equation
of time and Radius vector. Third line contains filter number 01 and number of data points corresponds to that filter.
Then the signal value corresponds to filter number 01 will be listed against the time of data acquisition. This block will
be repeated for acquired data for all 10 filters.
The MWR is operated generally on clear days when the sky is free from visible clouds. If it is operating on
partly cloudy days, the clouds entering the field of view during the measurement may affect some of the data points,
which are then to be removed by the clouds screening algorithm in the software. Fig. 4 shows the implementation of
cloud screening algorithm.
Figure 4. Cloud screening process
This sub program can be initiated from “Process” menu. The user has to select the date.dat file. Pressing “OK” button
will make polynomial fit of the signal values and plot them in 10 different windows according to wavelengths. Pressing
“Mark” button will calculate the standard deviation and mark on the plot. The user has to press the “Screen” button to
perform the cloud screening. The data points lying outside of the standard deviation will be deleted from the data set.
This process will be repeated three times for performing a smooth cloud screening. The user has to assess the cloud
screened data plot and if the data quality is good, user can save the data by pressing “Save” button or discard by
pressing the “Discard” button. The cloud screened data will be stored in the folder from where the date.dat file is
selected. The software will display the path of the cloud screened data file.
The cloud screened data is used to estimate the total columnar atmospheric Optical Depth from which spectral Aerosol
Optical Depths are retrieved. The data set has to be split in to forenoon and afternoon for calculating Aerosol Optical
Depth for forenoon and afternoon. The user has to use the “FN AN” submenu from “Process” menu to split the data to
forenoon data and afternoon data.
The user has to take “Langley Plot” submenu from “Analysis” menu to make the Langley plot and estimate Aerosol
Optical Depth. User has to select the cloud screened data and press OK to make the Langley plot. The software will
estimate the relative airmass corresponding to the time of each measurement. The logarithmic value of the signal is
calculated and the Langley plot is implemented with relative airmass (m) along x-axis and logVλ. along y-axis. The
software is utilizing students-T distribution to refine the data set. The slope of the langley plot gives the total columnar
optical depth (Ʈλ). Fig. 5 shows the implementation of langley plot.
Copyright to IJIRCCE
DOI: 10.15680/ijircce.2015.0306024
5129
ISSN(Online): 2320-9801
ISSN (Print): 2320-9798
International Journal of Innovative Research in Computer
and Communication Engineering
(An ISO 3297: 2007 Certified Organization)
Vol. 3, Issue 6, June 2015
Figure 5. Langley plot implementation
The total columnar optical depth (Ʈλ) estimated from the Langley plot is the sum of the optical depths due to molecular
scattering, extinction due to aerosols and absorption due to gas molecules and water vapour. All these parameter except
extinction due to aerosols can be estimated readily from the climatological values. Aerosol optical depth can be
calculated by subtracting these parameters from total columnar optical depth. The user has to press „Save” button to
save the calculated Aerosol Optical Depth values for all 10 wavelengths. The AOD file will be saved in the same
directory from where the cloud screened data has been selected.
A part of the main program is shown in Fig.6. The program is developed in LabVIEW. The program is designed in
such a way that separate subprograms are developed for individual task and all the subprograms are called from the
main program as and when required.
Figure 6. A part of source code
Copyright to IJIRCCE
DOI: 10.15680/ijircce.2015.0306024
5130
ISSN(Online): 2320-9801
ISSN (Print): 2320-9798
International Journal of Innovative Research in Computer
and Communication Engineering
(An ISO 3297: 2007 Certified Organization)
Vol. 3, Issue 6, June 2015
V. CONCLUSION
Efficient and user-friendly computer interface and data analysis software has been implemented for Multiwavelength Radiometer using LabVIEW. The software can be installed on windows operating system.
REFERENCES
[1] B H Subbaraya, A. Jayaraman, K Krishna Moorthy and M Mohan, “Atmospheric aerosol studies under ISRO‟s Geosphere Biosphere
Programme”, J. Ind. Geophys. Union, 4, 77-90, 2000
[2] Shaw, G.E., “Sun Photometry”, Bull. Amer. Meteorol. Soc., 64, 4-10, 1983
[3] Bates, D.R., “Rayleigh scattering by air”, Planet. Space Sci., 32, 785-790, 1984
[4] LabVIEW User Manual : National Instruments.
[5] Shaw, G.E., “Error analysis of multi-wavelength sun photometry”, Pure. Appl. Geophys., 114, 1-14 1976
[6] Schmid, B. and Wehrli, C., “ Comparison of Sun photometer calibration by use of the Langley technique and the standard lamp”. Applied
Optics, 4512.
Copyright to IJIRCCE
DOI: 10.15680/ijircce.2015.0306024
5131