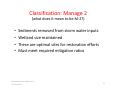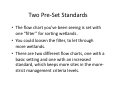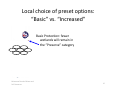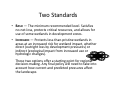
1
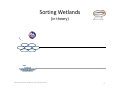
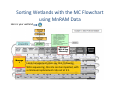
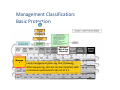
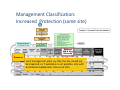
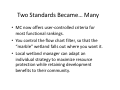
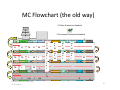
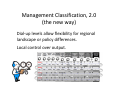
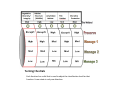
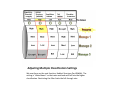
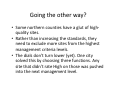
Automated, Individualized Management Classification
Using MnRAM Results
A Visual User Manual
Management Classification
A standard method for assessing MnRAM results, endorsed by the MnRAM Workgroup.
• Guides policy approaches using MnRAM wetland data.
• Two preset levels for no‐fuss assessment.
• Dial‐up levels allow flexibility for regional landscape or policy differences.
Management Classification, Theory and Practice
• Classification provides a basis for developing wetland management recommendations. It is the next step after gathering field data in MnRAM. • The objective is to achieve no net loss of wetland functions and values within the management area while providing flexibility for economic development that may require wetland impacts. • Impacts to wetlands include not only direct impacts such as filling, draining, and excavating, but also indirect impacts from stormwater inputs, changes to local surface and ground water hydrology, and pollutant loading. • Each wetland can be classified according to a recommended level of wetland protection and acceptable hydrologic changes. • A wetland management classification system with management standards provides certainty to land use managers and developers.
Management Classification, in Practice
Each wetland can be classified according to a recommended level of wetland protection and acceptable hydrologic changes. Management Criteria address :
The protection level and hydrologic changes together are called Management Criteria. Each aspect addresses a known stress factor for wetlands.
• Stormwater (Pre)Treatment
• Wetland Buffers
• Hydrologic Characteristics
– Bounce
– Inundation Period
• Mitigation (replacement ratio)
Minnesota Board of Water and Soil Resources
4
MC is a regulatory process
• Step One: apply MnRAM and look at the functional rating scores.
• Step Two: sort the wetlands into their classification levels, based on their MnRAM ratings.
• Step Three: formally adopt management criteria for each classification level.
Sorting Wetlands
(in theory)
Preserve
Manage 1
Manage 2
Minnesota Board of Water and Soil Resources
6
Veg.
Habitat
Amph.
Fish
Shore
E Preserve
E
E
H
E
H
Manage 1
H
H
M
H
M
Manage 2
M
M
L
M
L
Manage 3
L
Aesth & Hab
L
n/a
Minnesota Board of Water and Soil Resources
L
n/a
Sens.&Veg
WQ&Veg.
Hyd.&Veg.
E H H &
&
&
&
H
M
H
H
H H H H &
&
&
&
M
M
M
M
Flood
Comm.
Sorting Wetlands with the MC Flowchart
D. WQ
H
M &L
L &L
H
H
7
Sorting Wetlands with the MC Flowchart using MnRAM Data
Here is your wetland
Wetland
WQ & Veg
Diversity
Manage
1
Local management plans say that, following WCA sequencing, this site can be impacted, with a minimum replacement ratio set at 3:1.
How the flowchart works for a higher‐
ranked wetland
Veg.
Habitat
Amph.
Fish
Shore
Preserve
E
E
H
E
H
Aesth & Hab
Sens.&Veg
WQ&Veg.
Hyd.&Veg.
E E H H &
&
&
&
H
M
H
H
Flood
Comm.
1.1 Basic Protection Standard D. WQ
Site doesn’t meet criteria for “Preserve” When one category rating applies, you’re based on these functional rankings…
done for that wetland.
Minnesota Board of Water and Soil Resources
9
Classification: Preserve
(What does it mean to be classified as “Preserve”?)
• High quality wetlands
– Critical value to local ecosystem
– Sensitive wetlands—still have good vegetative quality
– Preserve or improve to most pristine state
• Wide, natural buffers
• Perpetual easements
Minnesota Board of Water and Soil Resources
10
Classification: Manage 1
(What does it mean to be M‐1?)
• Protected from increased use
– Including indirect effects of local development
– Maintain natural buffers
• Replacement ratios ‐ meet or exceed required minimums
Minnesota Board of Water and Soil Resources
11
How the flowchart works for a lower‐ranked wetland
Veg.
Habitat
Amph.
Fish
Shore
Preserve
E
E
H
E
H
Manage 1
H
H
M
H
M
Manage 2
M
M
L
M
L
Manage 3
L
L
n/a
L
n/a
Aesth & Hab
Sens.&Veg
WQ&Veg.
Hyd.&Veg.
E &H
E &
M
H &H
H &H
H &
M
H &
M
H &
M
H &
M
Comm.
1.1 Basic Protection Standard Flood
D. WQ
H
M &L
L &L
H
H
It meets Manage 2 criteria based on Site doesn’t meet criteria for “Preserve” Aesthetics & Habitat combined or “Manage 1”, based on functional functional ranking.
rankings. It is now being assessed for “Manage 2” classification…
Minnesota Board of Water and Soil Resources
12
Classification: Manage 2
(what does it mean to be M‐2?)
•
•
•
•
Sediments removed from storm water inputs
Wetland size maintained
These are optimal sites for restoration efforts
Must meet required mitigation ratios
Minnesota Board of Water and Soil Resources
13
Two Pre‐Set Standards
• The flow chart you’ve been seeing is set with one “filter” for sorting wetlands.
• You could loosen the filter, to let through more wetlands. • There are two different flow charts, one with a basic setting and one with an increased standard, which keeps more sites in the more‐
strict management criteria levels.
Local choice of preset options:
“Basic” vs. “Increased”
Basic Protection: fewer wetlands will remain in the “Preserve” category
Increased Standard keeps more wetlands in the stronger protection levels.
Minnesota Board of Water and Soil Resources
15
Two Standards
• BASIC — The minimum recommended level. Satisfies no‐net‐loss, protects critical resources, and allows for use of some wetlands in development zones. • INCREASED — Protects less‐than‐pristine wetlands in areas at an increased risk for wetland impact, whether direct (outright loss by development pressures) or indirect (ecological impact from increased use or hydrologic changes). These two options offer a starting point for regional decision‐making. Any final policy will need to take into account how current and predicted pressures affect the landscape. Management Classification:
Basic Protection
Wetland
WQ & Veg
Diversity
Manage
1
Local management plans say that, following WCA sequencing, this site can be impacted, with a minimum replacement ratio set at 3:1.
Management Classification:
Increased Protection (same site)
Wetland
WQ & Veg
Diversity
Preserve
Local management plans say that this site should not be impacted, or, if avoidance is not possible, only with a minimum replacement ratio set at 10:1.
Two Standards Became… Many
• MC now offers user‐controlled criteria for most functional rankings.
• You control the flow chart filter, so that the “marble” wetland falls out where you want it.
• Local wetland manager can adapt an individual strategy to maximize resource protection while retaining development benefits to their community.
MC Flowchart (the old way)
1.1 Basic Protection Standard Veg.
Habitat
Amph.
Fish
Shore
H E Preserve
HE
HE
M
H
HE
M
H
M
H
LM M
H
LM
Manage 2
M
M
LM
M
L M
L
Manage 3
L
&&
MH
M H Manage 1
M
H
Aesth & Hab
L
n/a
Minnesota Board of Water and Soil Resources
L
n/a
& &
LM
Sens.&Veg
WQ&Veg.
Hyd.&Veg.
HE MH MH MM
MH
MH
MH MH MH MM
LM
LM
& &
&&
&&
& &
Flood
Comm.
1.2 Increased Protection Standard D. WQ
&&
& &
M
H
LM & &L
L
L &L
H
H
20
Management Classification, 2.0 (the new way)
Dial‐up levels allow flexibility for regional landscape or policy differences.
Local control over output.
Start with Basic Protection Standard
The wetland starts out here, classified as Manage 1 under the Basic Protection Standard.
Turning the dials
Each function has a dial that is used to adjust the classification level for that function. It can rotate in only one direction.
Modifying the Classification Functional Levels
Each function is adjusted in turn, until one matches the wetland profile. The Focusing on the next level up, Preserve, the User begins to adjust the adjustment has changed the classification of the wetland. It is the Habitat Classification, broadening the definition of “Preserve” one function at a time.
Structure (Wildlife) function that proves to be the key element in this scenario.
Modifying to a higher classification
If “Preserve” was less restrictive, this wetland would fall into that Because the wetland’s Vegetative Functional rating is Moderate, the category. Here, we rotate the rankings to set the Vegetative function to wetland falls into the Preserve classification after we adjust the “Moderate” instead of “Exceptional.” category value.
Adjusting Multiple Classification Settings
We now focus on the next function, Habitat Structure (for Wildlife). The setting is “dialed down” so that more wetlands will fall into the higher classification. Restricting the filter limits the fall‐through rate.
Going the other way?
• Some northern counties have a glut of high‐
quality sites.
• Rather than increasing the standards, they need to exclude more sites from the highest management criteria levels.
• The dials don’t turn lower (yet). One city solved this by choosing three functions. Any site that didn’t rate High on those was pushed into the next management level.
Decreasing your management criteria
This site falls into the Preserve category based on its ratings for Wetland Water Quality and Vegetative Diversity. If that category were eliminated, the site would fall into the next level down, Manage 1.
Management Classification, Redux
• Once you set the dials, every wetland must be run through at the same setting. • Classification provides a basis for developing wetland management recommendations. It is the next step after gathering field data in MnRAM. • Management Criteria provide flexibility for economic development that may require wetland impacts. • Mitigation ratios, protection from stormwater runoff, and buffer protection are adjusted for each management level: Preserve, Manage 1, Manage 2, and Manage 3. • Management standards provide certainty to land use managers and developers.