1
UM1294
User manual
ST200 Micro Toolset
Introducing the ST200 Micro Toolset
The ST200 Micro Toolset is a cross-development system for developing and debugging C
and C++ embedded applications on STMicroelectronics’ range of products integrating the
ST200 cores. All ST200 devices include the debug support unit (DSU), available through the
JTAG port of the device, which provides access to on-chip debugging capabilities such as:
code and data breakpoints, watchpoints and memory peeking and poking.
The ST200 Micro Toolset provides an integrated set of tools to support the development of
embedded applications.
This user manual provides detailed information to:
October 2011
●
enable users to run and debug code built for the ST200 family of processors on silicon
and simulated targets
●
enable users to customize and extend the support of the ST200 Micro Toolset for new
hardware platforms that use ST200 processors
8063762 Rev 9
1/246
www.st.com
Contents
ST200
Contents
Introducing the ST200 Micro Toolset . . . . . . . . . . . . . . . . . . . . . . . . . . . . . . . . . . . . 1
Preface . . . . . . . . . . . . . . . . . . . . . . . . . . . . . . . . . . . . . . . . . . . . . . . . . . . . . . . . . . . . 10
Document identification and control . . . . . . . . . . . . . . . . . . . . . . . . . . . . . . . . . . . 10
License information. . . . . . . . . . . . . . . . . . . . . . . . . . . . . . . . . . . . . . . . . . . . . . . . 10
ST200 documentation suite . . . . . . . . . . . . . . . . . . . . . . . . . . . . . . . . . . . . . . . . . 10
Terminology . . . . . . . . . . . . . . . . . . . . . . . . . . . . . . . . . . . . . . . . . . . . . . . . . . . . . 11
Conventions used in this guide . . . . . . . . . . . . . . . . . . . . . . . . . . . . . . . . . . . . . . . 11
Acknowledgements. . . . . . . . . . . . . . . . . . . . . . . . . . . . . . . . . . . . . . . . . . . . . . . . 12
1
Toolset overview . . . . . . . . . . . . . . . . . . . . . . . . . . . . . . . . . . . . . . . . . . . 13
1.1
Toolset features . . . . . . . . . . . . . . . . . . . . . . . . . . . . . . . . . . . . . . . . . . . . 13
1.2
Distribution content . . . . . . . . . . . . . . . . . . . . . . . . . . . . . . . . . . . . . . . . . . 14
1.3
1.4
1.5
2
2/246
Tools . . . . . . . . . . . . . . . . . . . . . . . . . . . . . . . . . . . . . . . . . . . . . . . . . . . 14
1.2.2
Libraries . . . . . . . . . . . . . . . . . . . . . . . . . . . . . . . . . . . . . . . . . . . . . . . . . 15
1.2.3
Configuration scripts . . . . . . . . . . . . . . . . . . . . . . . . . . . . . . . . . . . . . . . 16
1.2.4
Sources . . . . . . . . . . . . . . . . . . . . . . . . . . . . . . . . . . . . . . . . . . . . . . . . . 16
1.2.5
Examples . . . . . . . . . . . . . . . . . . . . . . . . . . . . . . . . . . . . . . . . . . . . . . . . 16
Libraries delivered . . . . . . . . . . . . . . . . . . . . . . . . . . . . . . . . . . . . . . . . . . 17
1.3.1
The C library (newlib) . . . . . . . . . . . . . . . . . . . . . . . . . . . . . . . . . . . . . . . 17
1.3.2
The C++ library (libstdc++) . . . . . . . . . . . . . . . . . . . . . . . . . . . . . . . . . . 18
1.3.3
The libdtf library . . . . . . . . . . . . . . . . . . . . . . . . . . . . . . . . . . . . . . . . . . . 18
1.3.4
The syscalls low-level I/O interface . . . . . . . . . . . . . . . . . . . . . . . . . . . . 18
Release directories . . . . . . . . . . . . . . . . . . . . . . . . . . . . . . . . . . . . . . . . . 19
1.4.1
The documents directory . . . . . . . . . . . . . . . . . . . . . . . . . . . . . . . . . . . . 19
1.4.2
GDB command scripts directory . . . . . . . . . . . . . . . . . . . . . . . . . . . . . . 20
The examples directory . . . . . . . . . . . . . . . . . . . . . . . . . . . . . . . . . . . . . . 20
Introducing OS21 . . . . . . . . . . . . . . . . . . . . . . . . . . . . . . . . . . . . . . . . . . 22
2.1
3
1.2.1
OS21 features . . . . . . . . . . . . . . . . . . . . . . . . . . . . . . . . . . . . . . . . . . . . . 24
Code development tools . . . . . . . . . . . . . . . . . . . . . . . . . . . . . . . . . . . . . 25
3.1
Toolset overview . . . . . . . . . . . . . . . . . . . . . . . . . . . . . . . . . . . . . . . . . . . . 25
3.2
st200cc command line . . . . . . . . . . . . . . . . . . . . . . . . . . . . . . . . . . . . . . . 26
8063762 Rev 9
ST200
4
Contents
Board target configuration . . . . . . . . . . . . . . . . . . . . . . . . . . . . . . . . . . . 27
4.1
4.2
4.3
4.4
Configuring the run-time code for a target . . . . . . . . . . . . . . . . . . . . . . . . 27
4.1.1
The sysconf code module . . . . . . . . . . . . . . . . . . . . . . . . . . . . . . . . . . . 28
4.1.2
Generating code for a board target . . . . . . . . . . . . . . . . . . . . . . . . . . . . 28
Understanding target dependent settings . . . . . . . . . . . . . . . . . . . . . . . . 30
4.2.1
Toolset configuration . . . . . . . . . . . . . . . . . . . . . . . . . . . . . . . . . . . . . . . 30
4.2.2
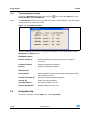
Configuration matrix . . . . . . . . . . . . . . . . . . . . . . . . . . . . . . . . . . . . . . . . 33
Customizing board targets . . . . . . . . . . . . . . . . . . . . . . . . . . . . . . . . . . . . 34
4.3.1
Overriding the memory layout of an existing board target . . . . . . . . . . . 34
4.3.2
Modifying the memory protection settings . . . . . . . . . . . . . . . . . . . . . . . 35
4.3.3
Defining a custom board target and compiling a program . . . . . . . . . . . 35
4.3.4
Building and debugging a program on a custom board target . . . . . . . . 37
Customizing SoC targets . . . . . . . . . . . . . . . . . . . . . . . . . . . . . . . . . . . . . 37
4.4.1
5
Defining a custom SoC target . . . . . . . . . . . . . . . . . . . . . . . . . . . . . . . . 38
Cross development tools . . . . . . . . . . . . . . . . . . . . . . . . . . . . . . . . . . . . 40
5.1
Loading and executing a target program . . . . . . . . . . . . . . . . . . . . . . . . . 40
5.2
Target code structure and initialization . . . . . . . . . . . . . . . . . . . . . . . . . . . 41
5.3
5.4
5.2.1
Target address space usage . . . . . . . . . . . . . . . . . . . . . . . . . . . . . . . . . 41
5.2.2
Initialization sequence . . . . . . . . . . . . . . . . . . . . . . . . . . . . . . . . . . . . . . 42
5.2.3
Start parameters . . . . . . . . . . . . . . . . . . . . . . . . . . . . . . . . . . . . . . . . . . 42
5.2.4
Other initializations . . . . . . . . . . . . . . . . . . . . . . . . . . . . . . . . . . . . . . . . 42
5.2.5
Initialization hook . . . . . . . . . . . . . . . . . . . . . . . . . . . . . . . . . . . . . . . . . . 43
The GNU debugger . . . . . . . . . . . . . . . . . . . . . . . . . . . . . . . . . . . . . . . . . 43
5.3.1
Using GDB . . . . . . . . . . . . . . . . . . . . . . . . . . . . . . . . . . . . . . . . . . . . . . . 43
5.3.2
The .lxgdbinit file . . . . . . . . . . . . . . . . . . . . . . . . . . . . . . . . . . . . . . . . . . 46
5.3.3
Connecting to a running target . . . . . . . . . . . . . . . . . . . . . . . . . . . . . . . 46
5.3.4
GDB command line reference . . . . . . . . . . . . . . . . . . . . . . . . . . . . . . . . 48
5.3.5
GDB command quick reference . . . . . . . . . . . . . . . . . . . . . . . . . . . . . . . 49
5.3.6
ST200 GDB commands . . . . . . . . . . . . . . . . . . . . . . . . . . . . . . . . . . . . . 51
Using st200xrun . . . . . . . . . . . . . . . . . . . . . . . . . . . . . . . . . . . . . . . . . . . . 55
5.4.1
Setting the environment . . . . . . . . . . . . . . . . . . . . . . . . . . . . . . . . . . . . . 55
5.4.2
st200xrun command line reference . . . . . . . . . . . . . . . . . . . . . . . . . . . . 55
5.4.3
st200xrun command line examples . . . . . . . . . . . . . . . . . . . . . . . . . . . . 56
8063762 Rev 9
3/246
Contents
6
ST200
Using STWorkbench . . . . . . . . . . . . . . . . . . . . . . . . . . . . . . . . . . . . . . . . 58
6.1
Getting started with STWorkbench . . . . . . . . . . . . . . . . . . . . . . . . . . . . . 58
6.1.1
7
6.2
STWorkbench tutorials . . . . . . . . . . . . . . . . . . . . . . . . . . . . . . . . . . . . . . . 62
6.3
ST200 System Analysis tutorials and reference pages . . . . . . . . . . . . . . 63
Using Insight . . . . . . . . . . . . . . . . . . . . . . . . . . . . . . . . . . . . . . . . . . . . . . 64
7.1
Launching Insight . . . . . . . . . . . . . . . . . . . . . . . . . . . . . . . . . . . . . . . . . . . 64
7.2
Using the Source Window . . . . . . . . . . . . . . . . . . . . . . . . . . . . . . . . . . . . 65
7.2.1
Source Window toolbar . . . . . . . . . . . . . . . . . . . . . . . . . . . . . . . . . . . . . 65
7.2.2
Context-sensitive menus . . . . . . . . . . . . . . . . . . . . . . . . . . . . . . . . . . . . 66
7.3
Debugging a program . . . . . . . . . . . . . . . . . . . . . . . . . . . . . . . . . . . . . . . . 67
7.4
Changing the target . . . . . . . . . . . . . . . . . . . . . . . . . . . . . . . . . . . . . . . . . 68
7.5
Configuring breakpoints . . . . . . . . . . . . . . . . . . . . . . . . . . . . . . . . . . . . . . 69
7.5.1
The Breakpoints window . . . . . . . . . . . . . . . . . . . . . . . . . . . . . . . . . . . . 70
7.6
Using the help . . . . . . . . . . . . . . . . . . . . . . . . . . . . . . . . . . . . . . . . . . . . . 70
7.7
Using the Stack window . . . . . . . . . . . . . . . . . . . . . . . . . . . . . . . . . . . . . . 71
7.8
Using the Registers window . . . . . . . . . . . . . . . . . . . . . . . . . . . . . . . . . . . 72
7.9
Using the Memory window . . . . . . . . . . . . . . . . . . . . . . . . . . . . . . . . . . . . 73
7.9.1
Displaying multiple Memory windows . . . . . . . . . . . . . . . . . . . . . . . . . . 74
7.10
Using the Watch window . . . . . . . . . . . . . . . . . . . . . . . . . . . . . . . . . . . . . 75
7.11
Using the Local Variables window . . . . . . . . . . . . . . . . . . . . . . . . . . . . . . 76
7.12
Using the Console Window . . . . . . . . . . . . . . . . . . . . . . . . . . . . . . . . . . . 77
7.13
Using the Function Browser window . . . . . . . . . . . . . . . . . . . . . . . . . . . . 78
7.14
Using the Processes window . . . . . . . . . . . . . . . . . . . . . . . . . . . . . . . . . . 79
7.15
Using the ST200 Statistics window . . . . . . . . . . . . . . . . . . . . . . . . . . . . . 80
7.16
Using the Performance Monitoring window . . . . . . . . . . . . . . . . . . . . . . . 81
7.17
Using the Debug Support Unit Window . . . . . . . . . . . . . . . . . . . . . . . . . . 82
7.17.1
4/246
The STWorkbench workbench . . . . . . . . . . . . . . . . . . . . . . . . . . . . . . . 59
Editing a DSU register . . . . . . . . . . . . . . . . . . . . . . . . . . . . . . . . . . . . . . 82
8063762 Rev 9
ST200
8
Contents
ST200 simulator . . . . . . . . . . . . . . . . . . . . . . . . . . . . . . . . . . . . . . . . . . . . 83
8.1
9
Simulator pack . . . . . . . . . . . . . . . . . . . . . . . . . . . . . . . . . . . . . . . . . . . . . 84
8.1.1
Customized simulator targets . . . . . . . . . . . . . . . . . . . . . . . . . . . . . . . . 84
8.1.2
Simulated boards naming convention . . . . . . . . . . . . . . . . . . . . . . . . . . 85
8.1.3
Simulator targets . . . . . . . . . . . . . . . . . . . . . . . . . . . . . . . . . . . . . . . . . . 85
8.2
Target configuration options . . . . . . . . . . . . . . . . . . . . . . . . . . . . . . . . . . . 86
8.3
The sample device plugin for the ST200 simulator . . . . . . . . . . . . . . . . . 90
8.3.1
Callbacks into the simulator . . . . . . . . . . . . . . . . . . . . . . . . . . . . . . . . . . 91
8.3.2
Building and running the plugin . . . . . . . . . . . . . . . . . . . . . . . . . . . . . . . 91
OS21 source guide . . . . . . . . . . . . . . . . . . . . . . . . . . . . . . . . . . . . . . . . . 92
9.1
Configurable options . . . . . . . . . . . . . . . . . . . . . . . . . . . . . . . . . . . . . . . . 92
9.1.1
9.2
Building the OS21 board support libraries . . . . . . . . . . . . . . . . . . . . . . . . 94
9.2.1
9.3
Generation of the shtdi server data tables . . . . . . . . . . . . . . . . . . . . . . . 95
Booting OS21 from Flash ROM . . . . . . . . . . . . . . . . . . . . . . . . . . . . . . . 96
10.1
11
Adding support for new boards . . . . . . . . . . . . . . . . . . . . . . . . . . . . . . . 94
GDB OS21 awareness support . . . . . . . . . . . . . . . . . . . . . . . . . . . . . . . . 94
9.3.1
10
Configurable options in the standard OS21 libraries . . . . . . . . . . . . . . . 93
Overview of booting from Flash ROM . . . . . . . . . . . . . . . . . . . . . . . . . . . 96
OS21 Trace . . . . . . . . . . . . . . . . . . . . . . . . . . . . . . . . . . . . . . . . . . . . . . . . 98
11.1
User trace records . . . . . . . . . . . . . . . . . . . . . . . . . . . . . . . . . . . . . . . . . . 98
11.1.1
os21usertrace host tool . . . . . . . . . . . . . . . . . . . . . . . . . . . . . . . . . . . . . 99
11.1.2
User definition file . . . . . . . . . . . . . . . . . . . . . . . . . . . . . . . . . . . . . . . . 100
11.1.3
os21usertracegen host tool . . . . . . . . . . . . . . . . . . . . . . . . . . . . . . . . . 103
11.1.4
os21usertracegen example . . . . . . . . . . . . . . . . . . . . . . . . . . . . . . . . . 106
11.2
Print a string to the OS21 Trace buffer . . . . . . . . . . . . . . . . . . . . . . . . . . 107
11.3
Building an application for OS21 Trace . . . . . . . . . . . . . . . . . . . . . . . . . 107
11.4
Running the application . . . . . . . . . . . . . . . . . . . . . . . . . . . . . . . . . . . . . 108
11.4.1
11.5
Trace buffer . . . . . . . . . . . . . . . . . . . . . . . . . . . . . . . . . . . . . . . . . . . . . 109
Analyzing the results . . . . . . . . . . . . . . . . . . . . . . . . . . . . . . . . . . . . . . . 109
11.5.1
Usage of the -m mode option . . . . . . . . . . . . . . . . . . . . . . . . . . . . . . . 111
11.5.2
os21decodetrace control file . . . . . . . . . . . . . . . . . . . . . . . . . . . . . . . . 112
8063762 Rev 9
5/246
Contents
ST200
11.6
Examples . . . . . . . . . . . . . . . . . . . . . . . . . . . . . . . . . . . . . . . . . . . . . . . . 113
11.6.1
OS21 activity and OS21 API trace . . . . . . . . . . . . . . . . . . . . . . . . . . . . 113
11.6.2
User API and user activity trace . . . . . . . . . . . . . . . . . . . . . . . . . . . . . 113
11.7
Trace overhead . . . . . . . . . . . . . . . . . . . . . . . . . . . . . . . . . . . . . . . . . . . . 115
11.8
Structure of trace binary files . . . . . . . . . . . . . . . . . . . . . . . . . . . . . . . . . 115
11.9
11.8.1
os21trace.bin . . . . . . . . . . . . . . . . . . . . . . . . . . . . . . . . . . . . . . . . . . . . 116
11.8.2
os21trace.bin.ticks . . . . . . . . . . . . . . . . . . . . . . . . . . . . . . . . . . . . . . . . 116
11.8.3
os21tasktrace.bin . . . . . . . . . . . . . . . . . . . . . . . . . . . . . . . . . . . . . . . . . 117
GDB commands . . . . . . . . . . . . . . . . . . . . . . . . . . . . . . . . . . . . . . . . . . . 117
11.9.1
Buffer full action . . . . . . . . . . . . . . . . . . . . . . . . . . . . . . . . . . . . . . . . . . 117
11.9.2
Enable OS21 Trace . . . . . . . . . . . . . . . . . . . . . . . . . . . . . . . . . . . . . . . 117
11.9.3
Enable trace control commands . . . . . . . . . . . . . . . . . . . . . . . . . . . . . 118
11.9.4
Enable OS21 activity . . . . . . . . . . . . . . . . . . . . . . . . . . . . . . . . . . . . . . 118
11.9.5
Enable OS21 API . . . . . . . . . . . . . . . . . . . . . . . . . . . . . . . . . . . . . . . . . 118
11.9.6
Enable OS21 activity event . . . . . . . . . . . . . . . . . . . . . . . . . . . . . . . . . 119
11.9.7
Enable OS21 API function . . . . . . . . . . . . . . . . . . . . . . . . . . . . . . . . . . 119
11.9.8
Enable task information logging . . . . . . . . . . . . . . . . . . . . . . . . . . . . . . 120
11.9.9
Dump buffer to file . . . . . . . . . . . . . . . . . . . . . . . . . . . . . . . . . . . . . . . . 121
11.9.10 Flush buffers and reset . . . . . . . . . . . . . . . . . . . . . . . . . . . . . . . . . . . . 121
11.9.11 Type and event enables . . . . . . . . . . . . . . . . . . . . . . . . . . . . . . . . . . . . 121
11.10 User GDB control commands . . . . . . . . . . . . . . . . . . . . . . . . . . . . . . . . . 123
11.10.1 User activity control commands . . . . . . . . . . . . . . . . . . . . . . . . . . . . . . 123
11.10.2 User API control commands . . . . . . . . . . . . . . . . . . . . . . . . . . . . . . . . 124
11.10.3 Miscellaneous commands . . . . . . . . . . . . . . . . . . . . . . . . . . . . . . . . . . 125
11.11 Trace library API . . . . . . . . . . . . . . . . . . . . . . . . . . . . . . . . . . . . . . . . . . . 126
11.12 Variables and APIs that can be overridden . . . . . . . . . . . . . . . . . . . . . . 138
11.13 User trace runtime APIs . . . . . . . . . . . . . . . . . . . . . . . . . . . . . . . . . . . . . 139
11.13.1 User activity control APIs . . . . . . . . . . . . . . . . . . . . . . . . . . . . . . . . . . . 139
11.13.2 User API control APIs . . . . . . . . . . . . . . . . . . . . . . . . . . . . . . . . . . . . . 140
11.13.3 User activity APIs . . . . . . . . . . . . . . . . . . . . . . . . . . . . . . . . . . . . . . . . . 142
11.14 Correspondence between GDB commands and APIs . . . . . . . . . . . . . . 142
11.15 Trace always on . . . . . . . . . . . . . . . . . . . . . . . . . . . . . . . . . . . . . . . . . . . 143
6/246
8063762 Rev 9
ST200
12
Contents
Relocatable loader library . . . . . . . . . . . . . . . . . . . . . . . . . . . . . . . . . . 145
12.1
Run-time model overview . . . . . . . . . . . . . . . . . . . . . . . . . . . . . . . . . . . . 145
12.2
Relocatable run-time model . . . . . . . . . . . . . . . . . . . . . . . . . . . . . . . . . . 146
12.2.1
12.3
Relocatable loader library API . . . . . . . . . . . . . . . . . . . . . . . . . . . . . . . . 148
12.3.1
12.4
12.5
13
The relocatable code generation model . . . . . . . . . . . . . . . . . . . . . . . . 148
rl_handle_t type . . . . . . . . . . . . . . . . . . . . . . . . . . . . . . . . . . . . . . . . . . 148
Customization . . . . . . . . . . . . . . . . . . . . . . . . . . . . . . . . . . . . . . . . . . . . . 161
12.4.1
Memory allocation . . . . . . . . . . . . . . . . . . . . . . . . . . . . . . . . . . . . . . . . 161
12.4.2
File management . . . . . . . . . . . . . . . . . . . . . . . . . . . . . . . . . . . . . . . . . 161
Building a relocatable library or main module . . . . . . . . . . . . . . . . . . . . 161
12.5.1
Importing and exporting symbols . . . . . . . . . . . . . . . . . . . . . . . . . . . . . 162
12.5.2
Optimization options . . . . . . . . . . . . . . . . . . . . . . . . . . . . . . . . . . . . . . 163
12.6
Debugging support . . . . . . . . . . . . . . . . . . . . . . . . . . . . . . . . . . . . . . . . . 164
12.7
Profiling support . . . . . . . . . . . . . . . . . . . . . . . . . . . . . . . . . . . . . . . . . . . 165
12.8
Memory protection support . . . . . . . . . . . . . . . . . . . . . . . . . . . . . . . . . . 166
12.9
Load time decompression . . . . . . . . . . . . . . . . . . . . . . . . . . . . . . . . . . . 166
Dynamic OS21 profiling . . . . . . . . . . . . . . . . . . . . . . . . . . . . . . . . . . . . 167
13.1
Overview . . . . . . . . . . . . . . . . . . . . . . . . . . . . . . . . . . . . . . . . . . . . . . . . 167
13.2
Building an application for dynamic OS21 profiling . . . . . . . . . . . . . . . . 168
13.3
Running the application . . . . . . . . . . . . . . . . . . . . . . . . . . . . . . . . . . . . . 168
13.4
GDB commands . . . . . . . . . . . . . . . . . . . . . . . . . . . . . . . . . . . . . . . . . . . 168
13.5
Analyzing the results . . . . . . . . . . . . . . . . . . . . . . . . . . . . . . . . . . . . . . . 172
13.6
Example . . . . . . . . . . . . . . . . . . . . . . . . . . . . . . . . . . . . . . . . . . . . . . . . . 172
13.7
Profiler library API . . . . . . . . . . . . . . . . . . . . . . . . . . . . . . . . . . . . . . . . . 172
13.7.1
Function definitions . . . . . . . . . . . . . . . . . . . . . . . . . . . . . . . . . . . . . . . 172
13.7.2
Overrides . . . . . . . . . . . . . . . . . . . . . . . . . . . . . . . . . . . . . . . . . . . . . . . 173
Appendix A Toolset tips . . . . . . . . . . . . . . . . . . . . . . . . . . . . . . . . . . . . . . . . . . . . 175
A.1
Managing memory partitions with OS21 . . . . . . . . . . . . . . . . . . . . . . . . . 175
A.2
Memory managers . . . . . . . . . . . . . . . . . . . . . . . . . . . . . . . . . . . . . . . . . 177
A.3
OS21 scheduler behavior . . . . . . . . . . . . . . . . . . . . . . . . . . . . . . . . . . . . 178
A.4
Managing critical sections in OS21 . . . . . . . . . . . . . . . . . . . . . . . . . . . . . 178
A.4.1
task / interrupt critical sections . . . . . . . . . . . . . . . . . . . . . . . . . . . . . . . 178
A.4.2
task / task critical sections . . . . . . . . . . . . . . . . . . . . . . . . . . . . . . . . . . 179
8063762 Rev 9
7/246
Contents
ST200
A.5
Access to uncached memory . . . . . . . . . . . . . . . . . . . . . . . . . . . . . . . . . 182
A.6
Debugging with OS21 . . . . . . . . . . . . . . . . . . . . . . . . . . . . . . . . . . . . . . . 183
A.7
A.6.1
Understanding OS21 stack traces . . . . . . . . . . . . . . . . . . . . . . . . . . . . 183
A.6.2
Identifying a function that causes an exception . . . . . . . . . . . . . . . . . . 184
A.6.3
Catching program termination with GDB . . . . . . . . . . . . . . . . . . . . . . . 186
General tips for GDB . . . . . . . . . . . . . . . . . . . . . . . . . . . . . . . . . . . . . . . . 186
A.7.1
Handling target connections . . . . . . . . . . . . . . . . . . . . . . . . . . . . . . . . . 186
A.7.2
Windows path names . . . . . . . . . . . . . . . . . . . . . . . . . . . . . . . . . . . . . . 186
A.7.3
Power up and connection sequence . . . . . . . . . . . . . . . . . . . . . . . . . . . 187
A.8
Polling for keyboard input . . . . . . . . . . . . . . . . . . . . . . . . . . . . . . . . . . . . 187
A.9
Just in time initialization. . . . . . . . . . . . . . . . . . . . . . . . . . . . . . . . . . . . . . 188
A.10
Using Cygwin . . . . . . . . . . . . . . . . . . . . . . . . . . . . . . . . . . . . . . . . . . . . . 189
A.11
Watchpoint support . . . . . . . . . . . . . . . . . . . . . . . . . . . . . . . . . . . . . . . . . 190
Appendix B ST200 board support package (BSP). . . . . . . . . . . . . . . . . . . . . . . 191
B.1
Error handling . . . . . . . . . . . . . . . . . . . . . . . . . . . . . . . . . . . . . . . . . . . . . 191
B.2
Caches . . . . . . . . . . . . . . . . . . . . . . . . . . . . . . . . . . . . . . . . . . . . . . . . . . 192
B.3
B.4
B.5
B.2.1
Managing the caches . . . . . . . . . . . . . . . . . . . . . . . . . . . . . . . . . . . . . . 192
B.2.2
Cache header file: machine/bsp/cache.h . . . . . . . . . . . . . . . . . . . . . . . 192
B.2.3
L2 cache . . . . . . . . . . . . . . . . . . . . . . . . . . . . . . . . . . . . . . . . . . . . . . . . 193
Memory management . . . . . . . . . . . . . . . . . . . . . . . . . . . . . . . . . . . . . . . 194
B.3.1
Initial memory map . . . . . . . . . . . . . . . . . . . . . . . . . . . . . . . . . . . . . . . . 194
B.3.2
Managing the MMU . . . . . . . . . . . . . . . . . . . . . . . . . . . . . . . . . . . . . . . 194
B.3.3
MMU header file: machine/bsp/mmu.h . . . . . . . . . . . . . . . . . . . . . . . . . 194
B.3.4
Speculative control unit (SCU) . . . . . . . . . . . . . . . . . . . . . . . . . . . . . . . 195
Timers . . . . . . . . . . . . . . . . . . . . . . . . . . . . . . . . . . . . . . . . . . . . . . . . . . . 196
B.4.1
Input clock frequency . . . . . . . . . . . . . . . . . . . . . . . . . . . . . . . . . . . . . . 196
B.4.2
Tick duration . . . . . . . . . . . . . . . . . . . . . . . . . . . . . . . . . . . . . . . . . . . . . 196
B.4.3
Reading the current time . . . . . . . . . . . . . . . . . . . . . . . . . . . . . . . . . . . 196
B.4.4
ST200 timer assignments . . . . . . . . . . . . . . . . . . . . . . . . . . . . . . . . . . . 196
B.4.5
Timer header file: machine/bsp/timer.h. . . . . . . . . . . . . . . . . . . . . . . . . 197
Performance monitor (PM) . . . . . . . . . . . . . . . . . . . . . . . . . . . . . . . . . . . 198
B.5.1
B.6
8/246
Hardware abstraction layer for the PM module. . . . . . . . . . . . . . . . . . . 198
Exception handling . . . . . . . . . . . . . . . . . . . . . . . . . . . . . . . . . . . . . . . . . 198
B.6.1
Exceptions types. . . . . . . . . . . . . . . . . . . . . . . . . . . . . . . . . . . . . . . . . . 198
B.6.2
Exceptions header file: machine/bsp/core.h . . . . . . . . . . . . . . . . . . . . . 199
8063762 Rev 9
ST200
Contents
B.7
Interrupts . . . . . . . . . . . . . . . . . . . . . . . . . . . . . . . . . . . . . . . . . . . . . . . . . 200
B.7.1
Interrupt handler installation . . . . . . . . . . . . . . . . . . . . . . . . . . . . . . . . . 200
B.7.2
Interrupts header file: machine/bsp/interrupt.h . . . . . . . . . . . . . . . . . . . 200
B.8
User handles . . . . . . . . . . . . . . . . . . . . . . . . . . . . . . . . . . . . . . . . . . . . . . 201
B.9
Retrieving internal run-time data . . . . . . . . . . . . . . . . . . . . . . . . . . . . . . . 203
B.10
BSP function definitions . . . . . . . . . . . . . . . . . . . . . . . . . . . . . . . . . . . . . 204
Appendix C Branch trace buffer . . . . . . . . . . . . . . . . . . . . . . . . . . . . . . . . . . . . . 223
C.1
Branch trace buffer modes . . . . . . . . . . . . . . . . . . . . . . . . . . . . . . . . . . . 223
C.2
The branchtrace command . . . . . . . . . . . . . . . . . . . . . . . . . . . . . . . . . . . 224
C.3
Output format . . . . . . . . . . . . . . . . . . . . . . . . . . . . . . . . . . . . . . . . . . . . . 225
Appendix D Profiler plugin. . . . . . . . . . . . . . . . . . . . . . . . . . . . . . . . . . . . . . . . . . 226
D.1
Profiler plugin reference . . . . . . . . . . . . . . . . . . . . . . . . . . . . . . . . . . . . . 227
D.2
Trace profile output format. . . . . . . . . . . . . . . . . . . . . . . . . . . . . . . . . . . . 229
D.3
Range profile output format. . . . . . . . . . . . . . . . . . . . . . . . . . . . . . . . . . . 230
D.4
ST Micro Connect configuration options . . . . . . . . . . . . . . . . . . . . . . . . . 231
D.5
Examples. . . . . . . . . . . . . . . . . . . . . . . . . . . . . . . . . . . . . . . . . . . . . . . . . 232
Appendix E
E.1
Appendix F
ST TargetPack plugin. . . . . . . . . . . . . . . . . . . . . . . . . . . . . . . . . . . . 233
The targetpack command . . . . . . . . . . . . . . . . . . . . . . . . . . . . . . . . . . . . 233
GDB os21_time_logging user command. . . . . . . . . . . . . . . . . . . . 235
Revision history . . . . . . . . . . . . . . . . . . . . . . . . . . . . . . . . . . . . . . . . . . . . . . . . . . . 236
Index . . . . . . . . . . . . . . . . . . . . . . . . . . . . . . . . . . . . . . . . . . . . . . . . . . . . . . . . . . . . . 240
8063762 Rev 9
9/246
Preface
ST200
Preface
Comments on this manual should be made by contacting your local STMicroelectronics
sales office or distributor.
Document identification and control
Each book carries a unique identifier of the form:
nnnnnnn Rev x
where nnnnnnn is the document number, and x is the revision.
Whenever making comments on this document, quote the complete identification
nnnnnnn Rev x.
License information
The ST200 Micro Toolset is based on a number of open source packages. Details of the
licenses that cover all these packages can be found in the file license.htm. This file is
located in the doc subdirectory and can be accessed from index.htm.
ST200 documentation suite
The ST200 documentation suite comprises the following volumes:
ST200 Micro Toolset user manual (8063762)
This manual describes the overall contents of the ST200 Micro Toolset, including brief
introductions to the code development tools, the OS21 run-time kernel library and the
STWorkbench interactive development environment. It describes in detail the
cross-development tools used to run and debug an ST200 binary executable on an ST200
simulator or on a silicon target system including an ST200 CPU core. It describes the target
libraries available and also how to configure the toolset to support a new type of target.
ST200 Micro Toolset compiler manual (7508723)
This manual provides a detailed guide to using the ANSI C and C++ compiler drivers for
compiling and linking source code to produce an executable binary. The compiler drivers
are introduced in terms of how they fit into the complete ST200 toolchain. The manual then
concentrates on the facilities provided by the compiler drivers to produce efficient code. It
covers: command line options, predefined macros, supported pragmas, compiler
optimization techniques, GNU C and C++ language extensions and asm construct, the
assembly language and intrinsic functions.
ST200 Run-time architecture manual (7521848)
This manual describes the common software conventions for the ST200 processor run-time
architecture.
10/246
8063762 Rev 9
ST200
Preface
OS21 user manual (7358306)
This manual describes the royalty free, light weight, OS21 multitasking operating system.
OS21 for ST200 user manual (7410372)
This manual describes the use of OS21 on ST200 platforms. It describes how specific
ST200 facilities are exploited by the OS21 API. It also describes the OS21 board support
packages for ST200 platforms.
ST200 ELF specification (7932400)
This document describes the use of the ELF file format for the ST200 processor. It provides
information needed to create and interpret ELF files and is specific to the ST200 processor.
ST231 Core and instruction set architecture (7645929)
This manual describes the architecture and the instruction set of the ST231 core as used by
STMicroelectronics.
ST240 Core and instruction set architecture (8059133)
This manual describes the architecture and the instruction set of the ST240 core as used by
STMicroelectronics.
Terminology
The first ST Micro Connect product was named the “ST Micro Connect”; it is now known as
the “ST Micro Connect 1” and the term “ST Micro Connect” is used to refer to the family of
ST Micro Connect devices. The “ST Micro Connect 2” replaces the “ST Micro Connect 1”.
These names are abbreviated to “STMC”, “STMC1” and “STMC2”.
Conventions used in this guide
General notation
The notation in this document uses the following conventions:
●
sample code, keyboard input and file names,
●
variables, code variables and code comments,
●
equations and math,
●
screens, windows, dialog boxes and tool names,
●
instructions.
Hardware notation
The following conventions are used for hardware notation:
●
REGISTER NAMES and FIELD NAMES,
●
PIN NAMES and SIGNAL NAMES.
8063762 Rev 9
11/246
Preface
ST200
Software notation
Syntax definitions are presented in a modified Backus-Naur Form (BNF) unless otherwise
specified.
●
Terminal strings of the language, that is those not built up by rules of the language, are
printed in teletype font. For example, void.
●
Non-terminal strings of the language, that is those built up by rules of the language, are
printed in italic teletype font. For example, name.
●
If a non-terminal string of the language starts with a non-italicized part, it is equivalent
to the same non-terminal string without that non-italicized part. For example,
vspace-name.
●
Each phrase definition is built up using a double colon and an equals sign to separate
the two sides (‘::=’).
●
Alternatives are separated by vertical bars (‘|’).
●
Optional sequences are enclosed in square brackets (‘[’ and ‘]’).
●
Items which may be repeated appear in braces (‘{’ and ‘}’).
Mathematical notation
A range of values can be shown using square braces, [], and round braces, (). Square
braces mean the nearest value is included, and round braces mean the nearest value is not
included.
For example:
[1 .. 3]
is the values 1, 2, 3
[1 .. 3)
is the values 1, 2
(1 .. 3]
is the values 2, 3
(1 .. 3)
is the value 2 only
Acknowledgements
Microsoft®, MS-DOS® and Windows® are registered trademarks of Microsoft Corporation in
the United States and/or other countries.
Linux® is a registered trademark of Linus Torvalds.
Red Hat® is a registered trademark and RPMTM and InsightTM are trademarks of Red Hat
Software, Inc.
CygwinTM and InsightTM are trademarks of Red Hat Software, Inc.
UNIX® is a registered trademark of The Open Group.
12/246
8063762 Rev 9
ST200
1
Toolset overview
Toolset overview
The ST200 Micro Toolset is a cross-development system for developing and debugging C
and C++ embedded applications on STMicroelectronics’ range of products integrating the
ST200 family of cores.
All ST200 devices include the debug support unit (DSU), available through the JTAG port of
the device, for on-chip debugging capabilities such as: code and data breakpoints,
watchpoints and memory peeking and poking.
The ST200 Micro Toolset provides an integrated set of tools to support the development of
embedded applications.
1.1
Toolset features
The ST200 Micro Toolset has the following features.
●
Supported host platforms
The toolset is available on Windows XP and Windows 7 and Red Hat Linux Enterprise
Workstation Version 4.0 and 5.0 for x86.
●
Code development tools (assembler, compiler and linker)
Program development is supported by the GCC compatible optimizing C and C++
compilers, GNU assembler, linker and archiver (librarian) tools.
●
The ST200 simulator
This provides an accurate software simulation of the entire family of
STMicroelectronics’ ST200 CPU cores.
●
Cross development with GDB
The GNU debugger (GDB) supports both the ST200 simulator and the hardware
development boards. GDB also includes a text user interface and the Insight GUI as a
graphical user interface on all supported host platforms. The st200xrun tool is also
available to provide a command line driven interface to simplify downloading and
running applications on the supported targets using GDB.
●
STWorkbench Integrated Development Environment (IDE)
The STWorkbench is built on the Eclipse IDE. The framework is extended using the
CDT (C/C++ Development Tools) and ST200 specific plugins which provide a fully
functional C and C++ IDE for STWorkbench. This allows the user to develop, execute
and debug ST200 applications interactively. Additionally, the ST Profiler and Coverage
features enable profiling and coverage analysis to be collected.
●
OS21 real-time kernel
The software design of embedded systems is supported by a real-time kernel (OS21)
which facilitates the decomposition of a design into a collection of communicating tasks
and interrupt handlers.
●
A C/C++ run-time system
The newlib C library provides ANSI C/C++ run-time functions including support for C
I/O using the facilities of the host system. The C++ run-time system is provided by the
GNU GCC libstdc++ library which includes support for the STL and iostream ISO C++
standard libraries.
●
File I/O is provided as well as terminal I/O
8063762 Rev 9
13/246
Toolset overview
ST200
●
Trace and statistical data analysis tools
The ST200 simulator provides tools to visualize performance information and for the
ST240, GDB branch trace facilities are supported.
●
Rebase tool
The st200-rebase tool enables the memory layout of an application to be changed
after linking and is described in the ST200 Micro Toolset compiler manual (7508723).
●
Flash ROM examples
Several Flash ROM examples are provided. These create applications which are able
to boot from ROM on the supported targets.
●
Support for the ST Micro Connect
Provides the download route to the board through the JTAG interface. The ST Micro
Connect supports download through Ethernet from any host machine. The ST Micro
Connect interface is connected to the DSU unit of the target device, which is used to
control and communicate with the device during development.
●
ST TargetPacks
ST TargetPacks are a method of describing target systems based on SoC devices. ST
TargetPacks provide a single, definitive description of a target system for use by
various tools within the development environment (such as st200xrun).
●
Profiler support
Performance data can be obtained when running an application on an ST200 simulator
and used to generate statistical and trace information. Performance data can also be
acquired from an application running on a target board connected to an ST Micro
Connect. The data can be analyzed using STWorkbench or a tool such as st200gprof.
The targets supported by the ST200 toolset are:
●
STMicroelectronics development boards
These boards provide development platforms for the STMicroelectronics
system-on-chip devices which use the ST200 cores.
●
ST200 simulator
GDB command scripts for simulator targets can be found in the directory lx-elf32.
1.2
Distribution content
The ST200 Micro Toolset distribution includes tools, libraries, configuration scripts and
examples.
1.2.1
Tools
From the binutils GNU package
14/246
st200as
GNU assembler
st200ld
GNU linker
st200addr2line
Convert addresses into file names and line numbers
st200ar
Create, modify, and extract from archives
st200++filt
Demangle encoded C++ symbols
st200gprof
GNU profiler
8063762 Rev 9
ST200
Toolset overview
st200nm
List symbols from object files
st200objcopy
Copy and translate object files
st200objdump
Display information from object files
st200ranlib
Generate index to archive contents
st200readelf
Display the contents of ELF format files
st200size
List file section sizes and total size
st200strings
List printable strings from files
st200strip
Discard symbols
From the GNU make package
mingw32-make
GNU make (only on MS Windows)
From the GCC GNU package
gcov
GNU test coverage tool
gcov-dump
GNU tool to print coverage files content
From the GDB/Insight GNU package
st200gdb
GNU target debugger
st200insight
Graphical User Interface for the debugger
Others
st200c++
GCC compatible optimizing C++ compiler
st200cc
GCC compatible optimizing C compiler
st200xrun
ST200 target loader
os21decodetrace
Decode tool for OS21 Trace
os21prof
OS21 profiler (implemented as a Perl script)
st200-rebase
Enables the application’s memory layout to be changed after linking.
st200rltool
Relocatable library tool (implemented as a Perl script)
st200version
Display of the ST200 toolset version
st200symbolise
Augment the simulator STISS trace information
st240symbolise
1.2.2
Libraries
There are libraries for each of the possible target configurations supported by st200cc: one
version for each permutation of the ST200 specific compiler options that affect code
generation and for the Application Binary Interface (ABI), such as floating-point and
endianness. Therefore, whatever permutation a user program is compiled against, a library
8063762 Rev 9
15/246
Toolset overview
ST200
with the same permutation (except for optimizations) exists and is automatically selected by
the compiler driver.
Compiler run-time libraries
An ISO/ANSI C run-time library (libc and libm) and header files. The run-time libraries also
provide support for low-level I/O and additional math functions.
The low-level I/O is implemented by the libdtf library (libdtf, see Section 1.3.3 on page 18.),
and a run-time library (libgprof) is also provided to support profiling with st200gprof.
An ISO/ANSI C++ run-time library (libstdc++) and header files supporting I/O streams and
the standard templates library (the STL).
Compiler support libraries
Compiler intrinsic libraries (libgcc and variants) and a run-time library libgcov to support
code coverage with st200gcov are also provided.
Others
1.2.3
●
The OS21 real-time kernel library and header files, and OS21 board support libraries
for the various supported platforms.
●
The relocatable loader library and header files.
Configuration scripts
st200gdb, st200insight and st200xrun need a set of GDB command scripts to establish
connections to:
●
hardware targets supported by ST TargetPacks (supplied with the ST Micro
Connection Package)
●
hardware targets not supported by a TargetPack, in this case the configuration scripts
implement the connection procedures
●
simulator targets
To retrieve the configuration scripts, st200gdb, st200insight and st200xrun
automatically, read the GDB startup script file (.lxgdbinit) found in the subdirectory
lx-elf32/stdcmd of the ST200 Toolset installation directory.
Note:
ST TargetPack, the connection support package for ST200 hardware platforms, is
described in the ST TargetPack user manual (8020851). The simulator pack, which has the
same role for simulated targets, is described in Section 8.1: Simulator pack on page 84.
1.2.4
Sources
This package contains full sources for the OS21 real-time kernel library. The combined
source package containing the open source components of the ST200 Micro Toolset can be
found on the ftp site from which the toolset was obtained.
1.2.5
Examples
Various example applications including those using OS21 and illustrating the construction of
Flash ROM systems are supplied, see Section 1.5: The examples directory on page 20.
16/246
8063762 Rev 9
ST200
1.3
Toolset overview
Libraries delivered
ANSI/ISO C and C++ run-time libraries and header files are shipped with the ST200 Micro
Toolset supporting both OS21 and bare machine applications for various target application
configurations.
Note:
A bare machine application is a non-OS21 application built without real-time kernel libraries.
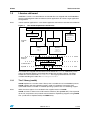
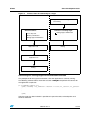
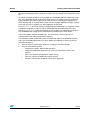
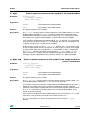
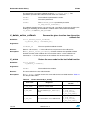
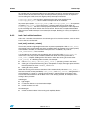
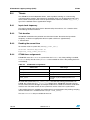
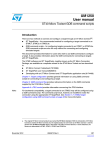
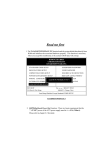
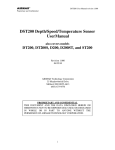
Figure 1.
The relationship between the libraries
Application
Relocatable loader
Compiler
intrinsic library
librl.a librl_s.so
OS21
Program
code
libos21.a libbsp.a
C++
iibgcc.a
libstdc++.a
libgcc_eh.a
Target-specific
libraries
newlib
libc.a
libm.a
Back end
interface
syscalls
Data transfer format
Communication
System
libcore.a
libsoc.a
libboard.sa
ST200 simulator
Hardware
The header files shipped with the toolset are located in the include subdirectory of the
release installation directory and include the header files for OS21 support. The OS21
header files are located under include/os21. The target specific libraries are made
available including the header file include/platform.h.
1.3.1
The C library (newlib)
newlib implements a version of the C library that is suitable for use in embedded systems.
newlib supports the most common functions used in C programs, but not the more
specialized features available in standard operating systems such as networking support.
Note:
Wide character support is not enabled in the supplied version of newlib.
newlib assumes a minimal set of OS interface functions (the syscalls API). These provide
all the I/O, and process entry and exit control functions required by programs using newlib.
The syscalls API is implemented by the libdtf library.
8063762 Rev 9
17/246
Toolset overview
1.3.2
ST200
The C++ library (libstdc++)
The C++ library is part of GNU Compiler Collection and uses the underlying C library for its
basic functionality.
1.3.3
The libdtf library
libdtf is intended to be the newlib backend library. To enable access to I/O and other
system resources through a standardized trap interface recognized by the GNU GDB
simulator, libdtf implements the interface between newlib and the underlying system.
The data transfer format (DTF) component
The DTF component of the libdtf library implements the POSIX I/O mechanism used with
the ST Micro Connect or the ST200 simulator. It implements most of the basic file I/O
features required by the C library. The debug link performs the I/O and requires the correct
host side software to be present (the supplied GDB connection commands handle this
automatically).
1.3.4
The syscalls low-level I/O interface
The syscalls low-level I/O interface consists of the following functions. The functions are:
_chmod, _chown, _close_r, _creat, _execv, _execve_r, _exit, _fork_r,
_fstat_r, _getenv, _getpid_r, _gettimeofday_r, _kill_r, _link_r,
_lseek_r, _open_r, _pipe, _pollkey, _raise, _read_r, _readenv_r,
_rename_r, _sbrk_r, _stat_r, _system_r, _times_r, _unlink_r,
_utime, _wait_r, _write, __setup_argv_and_call_main, __writev,
isatty.
The syscalls functions provide all the I/O, entry and exit, and process control routines that
newlib requires.
DTF provides four additional functions:
opendir, closedir, readdir, rewinddir.
The example provided with the toolset contains minimal implementations of the functions.
These versions are sufficient to compile, link and execute an application (see the syscalls
directory in the examples directory). However, the application cannot perform I/O or utilize
any of the services that these functions provide until fully implemented versions are
provided.
The example implementation provides an overview of each function but for further
information the POSIX standard should be used as a reference.
Note:
18/246
It is not required to implement all functions.
8063762 Rev 9
ST200
1.4
Toolset overview
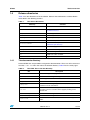
Release directories
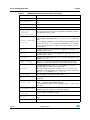
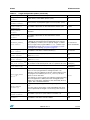
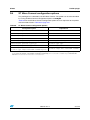
Table 1 lists the directories of the installation. Some of these directories are described in
more detail in the following sections.
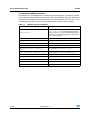
Table 1.
The release directories
Directory
Contents
bin
The tools.
doc
The documentation set, see Section 1.4.1: The
documents directory.
examples
Example applications.
include
C/C++ library header files.
lib/cmplrs
Host compiler library files.
lib/<core>/<endianess>/<runtime> Run-time library files.
1.4.1
lx-elf32/stdcmd
GDB command script files, see Section 1.4.2: GDB
command scripts directory.
man
man manual pages.
microprobe
ST Micro Connect support files.
share
GDB GUI configuration files.
src
ST200 source files for OS21.
target
Target libraries.
The documents directory
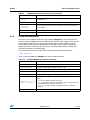
Several HTML files are provided to navigate the documentation. These can all be accessed
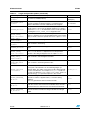
from the index.htm file in the release installation directory. Table 2 lists the main pages.
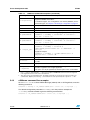
Table 2.
The HTML files in the doc directory
File
Description
acknow.htm
The acknowledgements page.
acroread.htm
Instructions on installing and using Acrobat Reader.
buglist.htm
Known bugs list.
cdmap.htm
An index of the information provided.
docbug.htm
Instructions on how to get support on the toolset and report
problems in the documentation.
docs.htm
A list of the documentation supplied with the toolset. Each
document can be accessed from this page by clicking on the
relevant link.
installation_linux.htm
Instructions on installing under Linux.
installation_win.htm
Instructions on installing under Windows.
licence.htm
Links to each of the licence files that the software is shipped
under.
8063762 Rev 9
19/246
Toolset overview
Table 2.
ST200
The HTML files in the doc directory (continued)
File
1.4.2
Description
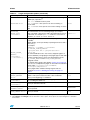
release.htm
Release notes.
STS-toolsReg.htm
ST200 registration.
versionIDs.htm
ST200 cores version identifiers.
GDB command scripts directory
The directory lx-elf32/stdcmd contains GDB command script files for a selection of
target evaluation boards supplied by STMicroelectronics for which the TargetPack is not
available and for the simulator targets, see Chapter 8: ST200 simulator on page 83.
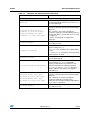
1.5
The examples directory
The examples directory has a set of subdirectories with examples of programs that use the
bare run-time.
20/246
bsptest
Usage of the bare run-time (cannot run in OS21 mode).
clock_example
Possible implementation of the posix clock() call based on
ST200 run-time. The clock() function is obtained using the
bsp_timer_now() function.
cpuclock
Contains an example that shows how to measure elapsed
time between two C-code lines of a ST200 program.
hello
Contains a simple “Hello World” program.
hellomulti
Contains an example of parallel debugging on multiple ST200
cores.
lpng125
Contains an implementation of the png library. This is an
example of a nontrivial application that includes two static
libraries.
profiling
How to build an application for profiling, and how to use
st200gprof.
sleep
Illustrates the use of the system function to execute a
sleep <seconds> command on the host.
symbolise
Illustrates the use of the
st200symbolise/st240symbolise tool to augment the
simulator STISS trace with a large amount of information
delivered from the trace.
syscalls
Contains a sample implementation of the syscalls low level
I/O interface (see Section 1.3.4: The syscalls low-level I/O
interface on page 18).
8063762 Rev 9
ST200
Toolset overview
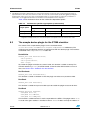
OS21 examples
The examples/os21 subdirectory contains some examples of programs using the features
of OS21.
os21/autostart
Illustrates extending the .init section of an application to
automatically initialize and start OS21 before main.
os21/dynamic
How to build a simple application that loads a dynamic library
from the host file system.
os21/failsafe
Illustrates the use of a “fail-safe application” in the flash layout.
os21/mandelbrot
A multi-tasking example that generates a Mandelbrot pattern.
os21/profilingos21
How to use the profiling feature of OS21.
os21/romdynamic
How to use the Relocatable Loader Library to load a dynamic
library from Flash ROM from an application that is boots out of
Flash ROM.
os21/rombootram
Demonstrates how a simple boot from ROM, execute from
RAM application may be created and written to Flash memory.
os21/rombootrom
Demonstrates how a simple boot from ROM, execute from
ROM application may be created and written to Flash
memory.
os21/soaktest
A simple stress test program, designed to act as a confidence
test for OS21 running on the target platform.
os21/timer
How the OS21 API can implement a simple timer. Tasks are
able to create timer objects, which have a programmable
duration, and can run in one shot or periodic mode. When a
timer fires, a user supplied callback function is called in the
context of a high priority task. The example contains the
source for the timer library, and a small test program that uses
the library.
os21/os21_trace
Demonstrates how to extract OS21 system trace information
from a simple OS21 example using tasks. The example
makes use of the os21trace library and tools for decoding
trace output into several readable formats including
STWorkbench.
os21/walklight
How to use OS21 in a C++ application.
8063762 Rev 9
21/246
Introducing OS21
2
ST200
Introducing OS21
OS21 is a royalty-free, lightweight, multi-tasking operating system developed by
STMicroelectronics. It is an evolution of the OS20 API and is intended for applications
where a small footprint and excellent real-time responsiveness are required. It has a multipriority preemptive scheduler, with low context switch and interrupt handling latencies.
OS21 assumes an unprotected, single address-space model and is easily portable between
chip architectures.
OS21 provides an OS20-compatible API to handle task, memory, messaging,
synchronization and time management. In addition, OS21 enhances the OS20 memory API
and introduces API extensions to control mutexes, event flags and target-specific APIs for
interrupts and caches.
OS21 aware debugging is available through GDB.
Multi-tasking is widely accepted as the optimal method of implementing real-time systems.
Applications can be broken down into a number of independent tasks that co-ordinate their
use of shared system resources such as memory and CPU time. External events arriving
from peripheral devices are made known to the system through interrupts.
The OS21 real-time kernel provides comprehensive multi-tasking services. Tasks
synchronize their activities and communicate with each other through semaphores, event
flags, mutexes and message queues. Real world events are handled through interrupt
routines and communicated to tasks using semaphores and event flags. Memory allocation
for tasks is selectively managed by OS21, the C run-time library or the user. Tasks can be
given priorities and are scheduled accordingly. Timer functions are provided to implement
time and delay functions.
An OS21 application is a single executable image(a) that can be loaded on the target either
through a debug port or from Flash ROM. This single executable is typically written in C and
statically linked with the C run-time library, the OS21 library and the OS21 board support
library. The application author has control of initializing the OS21 kernel and switching on
preemptive multi-tasking support. When the OS21 kernel starts, the full OS21 API can be
used.
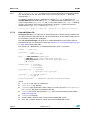
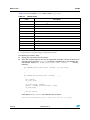
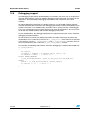
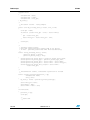
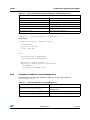
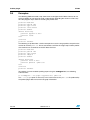
A very simple OS21 application (test.c) is shown below:
#include <os21.h>
#include <os21/st200.h>
#include <stdio.h>
void my_task (char * message)
{
printf("Hello from the child task.\nMessage is '%s'\n", message);
}
int main (void)
{
task_t * task;
kernel_initialize(NULL);
kernel_start();
a. This executable can load relocatable libraries, see Chapter 12: Relocatable loader library on page 145.
22/246
8063762 Rev 9
ST200
Introducing OS21
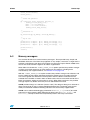
printf("Hello from the root task\n");
task = task_create((void (*)(void*))my_task,
"Hi ya!",
OS21_DEF_MIN_STACK_SIZE,
MAX_USER_PRIORITY,
"my_task",
0);
task_wait(&task, 1, TIMEOUT_INFINITY);
printf("All tasks ended. Bye.\n");
return 0;
}
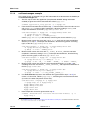
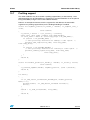
To compile and run this program on the ST231 processor of an IPBR1100 platform (mb424)
connected to an ST Micro Connect with IP address <STMC IP address>:
$> st200cc -mruntime=os21 -mcore=st231 -msoc=sti5300 -mboard=mb424 -o test.out test.c
$> st200xrun -c st200tp -t <STMC IP address>:mb424:st231 -e test.out
The output is:
Hello from the root task
Hello from the child task.
Message is ’Hi ya!’
All tasks ended. Bye.
For more information on OS21, see the OS21 user manual (7358306) and the OS21 for
ST200 user manual (7410372).
8063762 Rev 9
23/246
Introducing OS21
2.1
ST200
OS21 features
The following summarizes the key features of OS21.
●
OS21 is a simple, royalty-free multi-tasking package.
●
There is a single address space and single name space (the application has one
executable image).
●
There is a 256 level, priority-based FIFO scheduler.
●
It has optional timeslicing.
●
It has inter-task synchronization.
●
Counting semaphores:
●
●
24/246
–
can be initialized to any count
–
can be signalled from interrupts
–
for FIFO semaphores, the longest waiting task gets the semaphore
–
for priority semaphores, the highest priority task gets the semaphore
Mutexes can:
–
create critical sections between tasks
–
be recursively acquired by the owning task without deadlock
–
for FIFO mutexes, the longest waiting task gets the mutex
–
for priority mutexes, the highest priority task gets the mutex, supports priority
inheritance to avoid priority inversion
Event flags where:
–
tasks can poll, or wait for all or any event flag within a group
–
events can be posted from a task or interrupt
●
There is inter-task communication that uses simple FIFO message queues.
●
There are user-installable interrupt handlers.
●
There are user-installable exception handlers.
●
It has extensive cache API.
●
The memory management has:
–
heaps
–
a fixed block allocator
–
a simple (non-freeable) allocator
–
user-definable allocators
–
system heap managed by OS21 or C run-time
●
There is task-aware profiling. The OS21 profiler enables profiling of a single task, a
single interrupt level or the system as a whole
●
The Board support package (BSP) libraries enable customization for new boards.
●
OS21 is based on the GNU toolset, using newlib C run-time library.
8063762 Rev 9
ST200
3
Code development tools
Code development tools
This is a brief introduction to the code development tools. For detailed information please
refer to the ST200 Micro Toolset compiler manual (7508723).
The code development tools are invoked through the st200cc compilation driver tool. Its
purpose is to manage the stages of the compilation process: preprocessing, compiling into
assembly language, assembling and linking.
The assembler file is compiled using st200as and linked using st200ld to provide an ST200
binary image. All these phases are hidden using the driver tool st200cc. A GNU C++
compiler is provided by the driver tool st200c++.
3.1
Toolset overview
The ST200 Micro Toolset is a set of tools that enable C and C++ programs compiled for an
ST200 target to be simulated on a host workstation or executed on an ST200 target.
Supported platforms are:
●
RedHat Enterprise Linux 4.0 and 5.0
●
Windows XP and Windows 7
The ST200 Micro Toolset is intended for tool developers, for operating system development
and for applications that require modeling interrupts and real-time behavior. It includes the
complete set of tools for manipulating ST200 object files and includes the:
●
ST200 assembler
●
compiler
●
linker
●
load/run tool
●
debugger
●
archiver
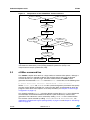
ST200 assembler files are translated to ST200 object files that the linker merges to produce
an ST200 executable image. This image file does not run natively on the host workstation
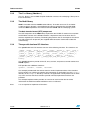
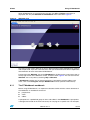
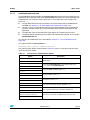
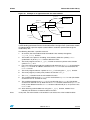
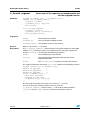
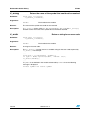
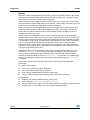
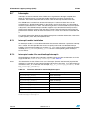
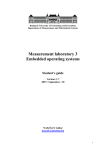
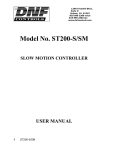
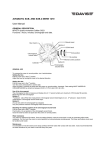
and requires an interpreter to be executed. Figure 2 shows the main components of the
ST200 Micro Toolset.
8063762 Rev 9
25/246
Code development tools
Figure 2.
ST200
Components of the ST200 Micro Toolset interfaces
.c source files
.cxx source files
ST200 C/C++ Compiler
ST200 assembler
files (.s)
ST200 assembler
(st200as)
ST200 object file
ST200 object file
ST200 libraries
target board
boot and sysconf
files
ST200 linker (st200ld)
ST200 binary (.elf)
ST200 load/run tool
(st200xrun)
ST200 debugger
(st200gdb)
Figure 2 does not include the binary optimizer tool (instruction cache placement, dead code
and dead data elimination) or the profiling feedback optimization (PFO) or the
interprocedural analysis optimization (IAO).
3.2
st200cc command line
The st200cc compiler driver tool has a large number of command line options, although a
minimal set of them is required to identify and configure the binaries with the desired
run-time libraries for a specific target. A minimal command line for st200cc, which
generates the executable hello.out from the hello.c source file, has the following form.
$> st200cc -mcore=<core> -msoc=<soc> -mboard=<board> -o hello.out hello.c
Where <core>, <soc> and <board> are the system configuration parameters that specify
the core variant (ST231 or ST240), the system on chip (SoC) and the board for which the
program is been built. These options are used by the linker, (see Chapter 4: Board target
configuration on page 27).
This example compiles hello.c using the default run-time library (bare) to be linked with
the executable and the default mode of endianness (little endianness) used for code
generation. The endianness can be selected by adding -EB or -EL to the command line.
The run-time can be selected by adding -mruntime=bare or -mruntime=os21, see
Appendix B: ST200 board support package (BSP) on page 191 and Chapter 2: Introducing
OS21 on page 22.
26/246
8063762 Rev 9
ST200
4
Board target configuration
Board target configuration
In the context of the ST200 toolset, a board target (or board) identifies:
●
a silicon target composed of one core processor on a specific System on Chip (SoC)
●
a specific system board
●
all the resources assigned to the processor, including:
–
the assigned RAM address space (by hardware or software design choices)
–
peripherals
For example, the STi7109-Mboard (MB442) is based on one STi7109 SoC, that has one
ST40 core, two ST231 cores and a complex set of on-chip peripherals. Therefore, this
system board hosts a number of boards (as intended in the ST200 development system
terminology) identified as: mb442_audio, mb442_video, mb442_7109_audio,
mb442_7109_video, mb442_se_7109_audio and mb442_se_7109_video. The toolset
supports all of these boards.
This chapter describes:
4.1
●
how to configure the run-time for a board
●
the contents of the toolset target-dependent structure and how to configure it with the
-mcore, -msoc and -mboard toolset options
●
how to customize an existing board for customer needs
●
how to configure a new board or SoC for an ST200 family core
Configuring the run-time code for a target
As stated in Section 3.2: st200cc command line on page 26 there are three system
configuration parameters that are required by st200cc to compile and link an application for
a specified board target:
●
core level
The settings that are related to a core type and independent of either the SoC in which
the core is embedded, or the board on which the SoC is used.
●
SoC level
The settings necessary for a given SoC, independent of any board.
●
board level
The settings required to configure a given board target. For each board, several board
targets can exist, one for each ST200 CPU.
To configure the execution of the user program so that it is specific for the board target, the
run-time must be aware of the sysconf parameters. These parameters are hardware
parameters (such as the core and bus clock frequency) that, together with the handling of
their access, are found in the sysconf.c module. By default, the sysconf module linked
with the application fits the needs of all simulator targets. For hardware boards, a dedicated
sysconf module specific to each board must override the default sysconf.
8063762 Rev 9
27/246
Board target configuration
Note:
ST200
To load and run an application on a target board or simulator, a detailed description of the
target system in the form of an ST TargetPack or simulator pack is specified to st200xrun,
see Chapter 5: Cross development tools on page 40 for details.
To get valid results and for benchmarking purposes, time functions such as clock()
require a correct run-time configuration.
4.1.1
The sysconf code module
The toolset delivers a set of sysconf code modules located in the
<tools-dir>/target/board directory. Within the board directory there is one
subdirectory for each board.
src/sysconf.c
The module managing sysconf parameters for the corresponding
board target.
board.ld
The board target-specific linker directives, including the memory map
definition. It defines the memory configuration for the board target.
makefile
The makefile to rebuild bootboard.o and libboard.a.
A template directory within the board directory contains a template for sysconf.c The
template shows where to add code to create a new board target used by the toolset.
The sysconf parameters can be accessed directly from a user program. For example:
#include <stdio.h>
#include <machine/sysconf.h>
main()
{
unsigned int fclock, pclock, ramsize, rambase;
fclock = sysconf(_SC_LX_CORE_CLOCK_FREQ);
pclock = sysconf(_SC_LX_PERIPH_CLOCK_FREQ);
ramsize = sysconf(_SC_LX_RAMSIZE);
rambase = sysconf(_SC_LX_RAMBASE);
printf("cpu clock %dMhz periph clock %dMhz ramsize 0x%8.8x
rambase 0x%8.8\n", clock/1000000, pclock/1000000, ramsize,
rambase);
}
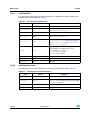
4.1.2
Generating code for a board target
To address an application for a given board target, a specific option must be given at link
time when generating the application.
-mcore=<core_target>
28/246
Enables the selection of a core target (a specified core
type). This option automatically adds the bootcore.o and
libcore.a files to the list of object files to link together and
automatically selects the core-specific core.ld linker file. If
the -mcore option is missing, the compiler driver assumes
“ST231” settings.
8063762 Rev 9
ST200
Board target configuration
-msoc=<soc_target>
Enables the selection of a SoC target. This option
automatically adds the libsoc.a file (located in the
target/core/<core_target>/<endianness>/<runtime> directory) to the list of object files to link together and
automatically selects the core-specific soc.ld linker file. If
the -msoc option is missing, the compiler driver assumes
“default” settings.
-mboard=<board_target> Enables the selection of a board target. This option
automatically adds the libboard.a file (located in the
target/board/<board_target>/core/<endianness
>/<run-time> directory) to the list of object files to link
together and automatically selects the board-specific
board.ld linker file. If the -mboard option is missing, the
compiler driver assumes “default” settings. The “default”
[core, soc, board, endianness] combination chosen by the
toolset corresponds to [st231, default, default, LE].
When the linker is invoked, the selected core.ld, soc.ld and board.ld are
automatically combined through a general platform.ld file to provide an entire and
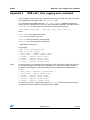
consistent linker script. For example, the command:
<tools-dir>/bin/st200cc -o hello.out -mcore=st231 -msoc=sti7200
-mboard=mb519_audio0 hello.c
is equivalent to:
<tools-dir>/bin/st200cc -o hello.out \
-EL \
-nostdlib \
-L<tools-dir>/target/core/st231/le/bare \
-L<tools-dir>/target/soc/sti7200/st231/le/bare \
-L<tools-dir>/target/board/mb519_audio0/st231/le/bare \
-L<tools-dir>/lib/st231/le/bare \
<tools-dir>/lib/st231/le/bare/crt1.o \
<tools-dir>/lib/st231/le/bare/crti.o \
<tools-dir>/lib/st231/le/bare/crtbegin.o \
<tools-dir>/target/core/st231/le/bare/bootcore.o \
-I<tools-dir>/target/core/st231 \
-I<tools-dir>/target/soc/sti7200 \
-I<tools-dir>/target/board/mb519_audio0 \
hello.c \
-lc -ldtf -lboard -lsoc -lcore -lgcc \
<tools-dir>/lib/st231/le/bare/crtend.o \
<tools-dir>/lib/st231/le/bare/crtn.o \
-T <tools-dir>/target/platform.ld
8063762 Rev 9
29/246
Board target configuration
4.2
ST200
Understanding target dependent settings
This section describes the target-dependent contribution to the toolset (that is, core, SoC
and board contributions). The board/<my_board> directory contains the majority of the
target-dependent information.
4.2.1
Toolset configuration
To control the executable generation and execution there are three options:
●
-mcore adds the core type specific contribution
●
-msoc adds the SoC specific contribution
●
-mboard adds the board contribution
When one of the options is not defined, the default value is used.
The configuration data related to the target configuration is in the <tools-dir>/target
directory.
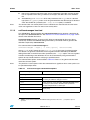
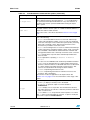
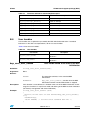
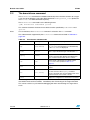
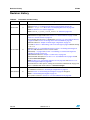
Table 3 lists the parameters managed by the toolset and how they interact with each other.
Table 3.
ST200 toolset parameters
Item
30/246
Set-up by
Used by
Core include path
Compiler driver
C Preprocessor
SoC include path
Compiler driver
C Preprocessor
Board include path
Compiler driver
C Preprocessor
Macros (for example, __ST231__...)
Compiler driver
C Preprocessor
crt1.o
Compiler driver
Linker
crti.o
Compiler driver
Linker
crtn.o
Compiler driver
Linker
crtbegin.o
Compiler driver
Linker
crtend.o
Compiler driver
Linker
Core initialization library
Compiler driver
Linker
Core library search path
Compiler driver
Linker
SoC initialization library
Compiler driver
Linker
SoC library search path
Compiler driver
Linker
Board initialization library
Compiler driver
Linker
Board library search path
Compiler driver
Linker
DEFAULT_RAMEND
Linker script
Linker/loader
DEFAULT_RESET_ADDRESS
Linker script
Linker/Run-time
DEFAULT_BOOT_ADDRESS
Linker script
Linker/Run-time
DEFAULT_TEXT_BASE
Linker script
Linker/Run-time
STACK_POINTER
Linker script
Linker/Run-time
CPU clock
Run-time/simulator
Run-time
8063762 Rev 9
ST200
Board target configuration
Table 3.
ST200 toolset parameters (continued)
Item
Set-up by
Used by
Bus clock
Run-time/simulator
Run-time
.bootreset section address
DEFAULT_RESET_ADDRESS Linker
.boot section address
DEFAULT_BOOT_ADDRESS
Linker
Program sections address
(.text, .rodata, .data, .bss)
DEFAULT_TEXT_BASE
Linker
bootcore.o
Compiler driver
Linker
Hardware memory map
Linker script
Linker/Loader
Early hardware initialization
TargetPack(1)
Loader
1. See ST TargetPack user manual (8020851).
The following sections describe the toolset target-dependent settings and how and where to
configure them.
Note:
In Table 4, Table 5 and Table 6, <endianness> is either le or be, <run-time> is either
bare or os21 and <my_core> is the core name.
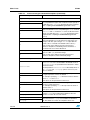
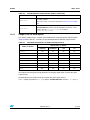
Core contribution
The -mcore=<my_core> option controls the core contribution. Only cores delivered in the
toolset can be referenced using the -mcore option.
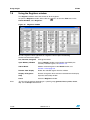
Table 4.
Core contribution
Item
Value
Parameter location
Include search path
-I<tools-dir>/target/core/
<my_core>
Macros
-D__<my_core>__
-D__<MY_CORE>__
crt1.o
crt1.o
<tools-dir>/lib/<my_core>/<endianness>
/<run-time>/crt1.o
crti.o
crti.o
<tools-dir>/lib/<my_core>/<endianness>
/<run-time>/crt1.o
crtn.o
crtn.o
<tools-dir>/lib/<my_core>/<endianness>
/<run-time>/crt1.o
crtbegin.o
crtbegin.o
<tools-dir>/lib/<my_core>/<endianness>
/<run-time>/crt1.o
crtend.o
crtend.o
<tools-dir>/lib/<my_core>/<endianness>
/<run-time>/crt1.o
Core library search
path
-L<tools-dir>/lib/<my_core>/
<endianness>/<run-time>
Core initialization
library
-lcore (libcore.a)
<tools-dir>/target/core/<my_core>/
<endianness>/<run-time>
8063762 Rev 9
31/246
Board target configuration
Table 4.
ST200
Core contribution (continued)
Item
Value
Parameter location
<tools-dir>/target/core/<my_core>/
<endianness>/<run-time>/bootcore.o
bootcore.o
Core initialization
__init_core() function
<tools-dir>/target/core/<my_core>/
<endianness>/<run-time>/libcore.a
SoC contribution
The -msoc=<my_soc> option controls the SoC contribution.
Table 5.
SoC contribution
Item
Value
Parameter location
Include search path
-I<tools-dir>/target/soc/
<my_soc>
SoC library search
path
-L<tools-dir>/target/soc/
<my_soc>/<my_core>/
<endianness>/<run-time>
SoC initialization
library
-lsoc (libsoc.a)
<tools-dir>/target/soc/<my_soc>/
<my_core>/<endianness>/<run-time>
SoC initialization
__init_soc() function
<tools-dir>/target/soc/<my_soc>/
<my_core>/<endianness>/<run-time>/
libsoc.a
Board contribution
The -mboard=<my_board> option controls the board contribution.
Table 6.
Board contribution
Item
Value
Parameter location
Include search path
-I<tools-dir>/target/board/
<my_board>
Board library search
path
-L<tools-dir>/target/board/
<my_board>/<my_core>/
<endianness>/<run-time>/
Board initialization
library
-lboard (libboard.a)
<tools-dir>/target/board/<my_board>/
<my_core>/<endianness>/<run-time>
Board initialization
__init_board() function
<tools-dir>/target/board/<my_board>/
<my_core>/<endianness>/<run-time>/
libboard.a
Memory map
definitions
FLASH, RAM area definition
<tools-dir>/target/board/<my_board>/
board.ld
DEFAULT_RESET_A
DDRESS
Definition is needed at linking time
only if the .boot and .boot_reset
are linked
<tools-dir>/target/board/<my_board>/
board.ld
32/246
8063762 Rev 9
ST200
Board target configuration
Table 6.
Board contribution (continued)
Item
Value
Parameter location
DEFAULT_BOOT_
ADDRESS
Definition is needed at linking time
only if the .boot and .boot_reset
are linked
<tools-dir>/target/board/<my_board>/
board.ld
DEFAULT_TEXT_
BASE
Definition is mandatory
<tools-dir>/target/board/<my_board>/
board.ld
DEFAULT_RAMEND
Definition is mandatory
<tools-dir>/target/board/<my_board>/
board.ld
STACK_POINTER
Definition is mandatory
<tools-dir>/target/board/<my_board>/
board.ld
4.2.2
Configuration matrix
Table 7 lists the interaction between the -mcore, -msoc, -mboard options and the
different level of contribution in the <tools-dir>/target directory.
Table 7.
Configuration matrix
Item
Default
-mcore -msoc -mboard
X
Location
Compiler driver
Core include path
<tools-dir>/target/core/st231
SoC include path
<tools-dir>/target/soc/default
Board include path
<tools-dir>/target/board/default
Macros
__ST231__, __st231__,...
X
Compiler driver
crt1.o
ST231
X
Compiler driver
crti.o
ST231
X
Compiler driver
crtn.o
ST231
X
Compiler driver
crtbegin.o
ST231
X
Compiler driver
crtend.o
ST231
X
Compiler driver
Core initialization library
N/A
X
libcore.a
Core library search path
N/A
X
Compiler driver
SoC initialization library
N/A
X
libsoc.a
SoC library search path
N/A
X
Compiler driver
X
Compiler driver
X
Compiler driver
Board initialization library N/A
X
libboard.a
Board library search path N/A
X
Compiler driver
DEFAULT_RESET_
ADDRESS
N/A
X
board.ld
DEFAULT_BOOT_
ADDRESS
N/A
X
board.ld
DEFAULT_TEXT_BASE
N/A
X
board.ld
DEFAULT_RAMEND
N/A
X
board.ld
STACK_POINTER
N/A
X
board.ld
8063762 Rev 9
33/246
Board target configuration
4.3
ST200
Customizing board targets
This section describes different ways to create and debug custom board targets.
By default, the libboard.a and board.ld files are taken from the
<tools-dir>/target/board/default/ directory, according to the core type and the
run-time.
Note:
During a toolset update, the entire <tools-dir>/target directory is overwritten and if
any changes have been made in this location, they are lost. Target dependent libraries as
well as memory and run-time settings in the board.ld file are no longer available.
4.3.1
Overriding the memory layout of an existing board target
The memory layout for a given board is defined in the linker script file:
<tools-dir>/target/board/targetboard/board.ld
by the following linker variables:
●
__rambase
●
__ramsize
●
__rombase
●
__romsize
●
_stack
The default values of these variables can be overridden for a particular application build by
using the following st200cc option:
-Wz,--defsym,<variable>=<new_value>
This option passes the <new_value> to the link phase.
It is also necessary to use an alternate linker script called platform_nomem.ld using the
st200cc -T option.
For example:
To change the default memory layout of an MB424 board to start the RAM at 0xD0000000
and make the RAM size 0x100000, use the following command:
st200cc -mcore=st231 -msoc=sti5301 -mboard=mb424
-Wz,--defysm,__rambase=0xD0000000 -Wz,--defysm,__ramsize=0x100000
-T <tools>/target/platform_nomem.ld -o hello -c hello.c
Alternatively, define custom board.ld and companion board_nomem.ld files, using the
custom values in the directory:
<tools-dir>/target/board/targetboard/<configuration_directory>
For example:
<tools-dir>/target/board/targetboard/st231/le/bare
34/246
8063762 Rev 9
ST200
4.3.2
Board target configuration
Modifying the memory protection settings
It is possible to override the default setting of the memory protection so that it is set before
the main() function execution. Use the startup initialization hook mechanism, see
Section 5.2.4: Other initializations on page 42.
The default memory protection setting is found in:
<tools-dir>/target/core/<core>/src/mmu.c
The memory translation and protection unit implements the memory protection settings, see
the ST231 Core and instruction set architecture manual (7645929) and ST240 Core and
instruction set architecture manual (8059133).
To simplify the user settings, there are two bare run-time functions,
bsp_mmu_memory_map() and bsp_mmu_memory_unmap(), see Section B.10: BSP
function definitions on page 204.
Note:
For ST231 onward, any address area unknown to the core and outside the program RAM
usage (from __text_start to _ramend) requires an explicit mapping. For example, before
accessing the 0x08900000 device address, use the following C code:
int * device_control = 0x08900000;
#include <machine/mmu.h>
...
bsp_mmu_memory_map(0x08900000, 0x100,
PROT_SUPERVISOR_WRITE|PROT_SUPERVISOR_READ, 0,
0x08900000);
*device_control = 0;
4.3.3
Defining a custom board target and compiling a program
The following procedure describes how to define a board target and to keep the changes
during an update.
1.
Create a new target directory outside the <tools-dir> directory (for example,
<new_target_dir>) containing a board directory with a subdirectory for each board
target (for example, <my_board>).
The new target tree is:
~/new_target_dir/board/my_board
2.
Copy the file <tools-dir>/target/defines.mkf into the new target directory
<new_target_dir> and edit the file, changing the value of the variable
ST200TOOLS_DIR with the path of the toolset <tools-dir>.
3.
Recursively copy the files from the <tools-dir>/target/board/template
directory to the newly created subdirectory, for example <my_board>.
(Alternatively, instead of using the template directory, use an existing board directory
that is similar to the required new directory).
4.
If required, modify the mapping settings in the linker script file board.ld. The
board.ld file is located in the <new_target_dir>/board/<my_board> and
contains the following mappings:
__rambase, __ramsize, __rombase, __romsize
8063762 Rev 9
35/246
Board target configuration
ST200
For example, to define a board with 16 Mbytes of RAM at address 0x12000000 and 4
Mbytes of Flash at address 0x00000000, enter the following definitions:
___rambase
...
___ramsize
...
___rombase
...
___romsize
= DEFINED(___rambase) ? ___rambase : 0x12000000;
= DEFINED(___ramsize) ? ___ramsize : 16M ;
= DEFINED(___rombase) ? ___rombase : 0x0;
= DEFINED(___romsize) ? ___romsize : 4M ;
Replicate the same information in the MEMORY section, for example:
{
reset_flash : ORIGIN = 0x0,
LENGTH = 0x10000
boot
: ORIGIN = 0x1000,
LENGTH = 4M - 0x10000
ram
: ORIGIN = 0x12000000, LENGTH = 16M
}
The two entries reset_flash and boot only need to be modified if the application is
built to start from Flash and does not use the standard configuration for Flash (which
can be viewed in the /template/..../os21/board.ld file).
board_nomem.ld contains similar information but does not contain the MEMORY
section and is only needed in association with:
<tools-dir>/target/platform_nomem.ld.
5.
Edit the makefile changing the value of the variable LIST_CONFIG with the required
configuration and modify the path to include the defines.mkf file in
<toolset_dir>/target/defines.mkf.
The valid values for LIST_CONFIG have the following format:
<core>-<endianess>-<runtime>
For example:
LIST_CONFIG = st231-le-bare
LIST_CONFIG = st231-le-os21
6.
7.
Update the src/sysconf.c and src/init.c files with the board-specific code. The
file sysconf.c contains the _sys_custom_sysconf function pointer, which must
point to the board specific function <boardname>_sys_custom_sysconf(). This
function is also contained in sysconf.c, and returns the board configuration
parameter of choice. The init.c file contains two functions, which can be
customized, and that are executed respectively at the beginning and at the end of the
execution.
Build the board library running make in the board directory, for example:
a)
Navigate to ~/new_target_dir/board/my_board
b)
> make
A new directory tree is created to contain the libraries for the selected configurations.
For example, if the only selected configuration is st231-le-bare (see step 5.) the
following directory is created:
~/new_target_dir/board/my_board/st231/le/bare.
This directory contains libboard.a, used when building an application for this board.
36/246
8063762 Rev 9
ST200
Board target configuration
8.
4.3.4
Create new TargetPack and simulator pack files for the new board to adjust the
memory initialization for hardware and simulator targets, this is mandatory for ST200
program execution. TargetPacks are provided with the ST Micro Connection Package.
They are described in the ST TargetPack user manual (8020851) together with
instructions about how to customize them. Simulator packs are described in
Section 8.1: Simulator pack on page 84.
Building and debugging a program on a custom board target
For a simulated target, a generated program can be executed without having to carry out
additional steps. For a hardware board, define the new custom board <my_board> (see
Section 4.3.3: Defining a custom board target and compiling a program) and define its new
TargetPack, see ST TargetPack user manual (8020851).
To build and run the hello.c application, the st200cc option -mtargetdir is used to
specify an alternative directory where new SoC and board directories are searched first.
Use the following commands:
<tools-dir>/bin/st200cc -mcore=<core> -mboard=<my_board>
-msoc=<my_soc> -mtargetdir=<full path>/new_target_dir -o hello.out
hello.c
To run the application use the commands:
<tools-dir>/bin/st200xrun -c st200tp -t
<IPaddress>:<my_boardtype>:<my_targetcore> -e hello.out -a
<arguments>
4.4
Customizing SoC targets
In the majority of cases a new SoC can be targeted, by simply building with the default SoC
definition:
<tools-dir>/bin/st200cc -mcore=<core> -mboard=<my_board>
-msoc=default -mtargetdir=<full path>/new_target_dir -o hello.out
hello.c
The only case where a new SoC definition must be created is when specific SoC translation
look aside buffer (TLB) entries are required for the SoC. In this case a custom SoC may be
build using a similar procedure to that used to create a custom board definition.
(See Appendix B: ST200 board support package (BSP) on page 191 for more information
about TLBs).
8063762 Rev 9
37/246
Board target configuration
4.4.1
ST200
Defining a custom SoC target
The following procedure describes how to define a custom SoC target and to keep the
changes during an update.
1.
Create a new target directory outside the <tools-dir> directory (for example,
<new_target_dir>) containing a SoC directory with a subdirectory for each SoC
target (for example, <my_soc>).
The new target tree is:
~/new_target_dir/soc/my_soc
2.
Copy the file <tools-dir>/target/defines.mkf into the new target directory
<new_target_dir> and edit the file, changing the value of the variable
ST200TOOLS_DIR with the path of the toolset <tools-dir>.
3.
Recursively copy the files from the <tools-dir>/target/soc/template directory
to the newly created subdirectory, for example <my_soc>.
4.
Modify the file src/init.c to create TLB entries in the initialization of the memory
areas, which are defined in the table of SoCs.
The memory map table is defined as an array of structures of type
bsp_memory_map_t, terminated by a NO_MAP element. The bsp_memory_map_t
structure has the following format:
typedef struct bsp_memory_map_s
{
void * addr;
size_t len;
int page_size;
int policy;
int user_prot;
int super_prot;
} bsp_memory_map_t;
Where addr and len are the starting point and the length of the memory area to be
mapped. The page_size parameter specifies the preferred size of the page to be
used for the TLBs; allowed values are:
–
PAGE_256MB Page size of 256 MBytes
–
PAGE_4MB
Page size of 4 MBytes
–
PAGE_8KB
Page size of 8 KBytes
–
PAGE_4KB
Page size of 4 KBytes (ST240 only)
The policy parameter can have the following values:
–
LXTLB_ENTRY0_POLICY_UNCACHED 0 Uncached mode
–
LXTLB_ENTRY0_POLICY_CACHED 1 Cached mode
–
LXTLB_ENTRY0_POLICY_WCUNCACHED 2 Write combining uncached
The parameters user_prot and super_prot define the protection rating for the area
used for user and supervisor applications. Allowed values are:
–
LXTLB_PROT_EXECUTE 1 Execute permission
–
LXTLB_PROT_READ
2 Read (Prefetch & Purge) permission
–
LXTLB_PROT_WRITE
4 Write permission
For example, the following code will create a TLB entry in bare runtime initialization
int STIxxxx_PERIPHERAL_BASE_PMA= 0xf0000000; /* Periph at 0xf0000000 */
int STIxxxx_PERIPHERAL_SIZE = 0x10000000; /* 256 MB, */
38/246
8063762 Rev 9
ST200
Board target configuration
bsp_memory_map_t STIxxxx_maps [] = {
{
(void *)&STIxxxx_PERIPHERAL_BASE_PMA,
&STIxxxx_PERIPHERAL_SIZE,
PAGE_256MB,
LXTLB_ENTRY0_POLICY_UNCACHED,
LXTLB_PROT_READ | LXTLB_PROT_WRITE,
LXTLB_PROT_READ | LXTLB_PROT_WRITE
},
NO_MAP
};
bsp_memory_map_t *bsp_map_init(void)
{
return STIxxxx_maps;
}
5.
Edit the makefile changing the value of the variable LIST_CONFIG with the required
configuration and modify the path to include the defines.mkf file in
<toolset_dir>/target/defines.mkf.
The valid values for LIST_CONFIG have the following format:
<core>-<endianess>-<runtime>
For example:
LIST_CONFIG = st231-le-bare
6.
Build the board library running make in the board directory, for example:
a)
Navigate to ~/new_target_dir/soc/my_soc
b) > make
A new directory tree is created to contain the libraries and linker scripts for the selected
configurations.
For example, if the only selected configuration is st231-le-bare (see step 5.) the
following directory is created:
~/new_target_dir/soc/my_soc/st231/le/bare
This directory contains libsoc.a and the linker script that are used when building an
application for this SoC.
8063762 Rev 9
39/246
Cross development tools
5
ST200
Cross development tools
The cross development tools enable an executable created by the code development tools
(see ST200 Micro Toolset compiler manual (7508723)) to run on a variety of simulator and
hardware platforms through the GNU debugger (GDB).
GDB has been enhanced in the ST200 configuration to provide better support for the ST200
simulator and silicon targets, see Section 5.3: The GNU debugger on page 43.
ST TargetPacks are used to configure a target through an ST Micro Connect 2 or an
ST Micro Connect 1, see the ST TargetPack user manual (8020851). Simulation packs
provide configuration data for simulated targets and are described in Chapter 8: ST200
simulator on page 83.
For a complete list of the ST TargetPacks supplied with the ST Micro Connect, see the ST
Micro Connect Release Notes and follow the link to the ST TargetPacks. This also lists the
elements that form the TargetString that is used to specify a particular TargetPack. See
Connecting to a target in Section 5.3.1: Using GDB on page 43.
5.1
Loading and executing a target program
To build the program a.out for the IPBR1100 target platform (mb424) from the source file
hello.c:
st200cc -mcore=st231 -msoc=sti5300 -mboard=mb424 -o a.out hello.c
The following example uses st200xrun to execute the a.out application on an IPBR1100
connected to an ST Micro Connect with the network IP address IP_address, see
Section 5.4: Using st200xrun on page 55.
st200xrun -c st200tp -t IP_address:mb424:st231 -e a.out
The option -c specifies the connection procedure to be used. In this case st200tp
specifies that a TargetPack rather than a simulator pack is to be used.
The option -t specifies the target string.
The option -e specifies the name of the executable.
Note:
-c st200tp is an st200xrun default and so need not be specified, it is included here for
completeness.
Further information about TargetPacks and TargetStrings can be found in the
ST TargetPack user manual (8020851) supplied with the ST Micro Connect.
To launch the a.out application on the ST200 simulator configured to simulate the
IPBR1100, use the following command:
st200xrun -c st200sp -t mb424sim -e a.out
40/246
8063762 Rev 9
ST200
5.2
Cross development tools
Target code structure and initialization
This section describes the Target address space usage, initialization sequence and start
parameters.
5.2.1
Target address space usage
By default, the toolset is configured for the program to load and execute in 8 Mbytes of LMI
RAM memory (from 0x08000000 to 0x08800000). Figure 3 shows how the toolset uses the
ST200 address space to load and execute a C program when the program is compiled and
executed with the default options.
In order to change the memory location where the program is loaded and executed, memory
settings must be changed in the board.ld linker script located in
<tools-dir>/target/board/<my_board>.
When DEFAULT_RAMEND, DEFAULT_TEXT_BASE and memory mapping are modified, build
and run the program as usual. An example provided in <tools-dir>/examples/hello.
shows how they are modified. See the README file for more information.
Board configuration is flexible, so that it is possible to add a custom board with different
memory and run-time settings, see Section 4.3: Customizing board targets on page 34.
Figure 3.
ST200 address space usage
0x08000000
TEXT_BASE
Memory Space
Comments
.text
Section loaded
It contains the __start() entry point of the program.
.data
Section loaded. Initialized C global variables are
directly mapped at these addresses.
.bss
Not loaded. Initialized to 0 at __start() execution,
as per ANSI C standard.
During the execution, the stack grows towards the
default area where sections are loaded and the heap
for malloc grows from the end of the .bss section
towards the stack.
stack_pt -->
scratch area
16 bytes aligned area to setup the stack.
kernel stack
16 bytes reserved for the kernel stack.
scratch area
RAMEND
16 bytes aligned are to setup the kernel stack.
kstack_pt -->
0x08800000
_ramend
This base address is configurable through the
board.ld script link dedicated to the target.
0xffffffff
Note:
During normal execution the stack pointer points to the top of the stack, and a 16-byte
scratch area is required by the ABI for the initial context saving between function calls.
Similarly, the kernel stack identifies the stack used during trap handling and a 16-byte
corresponding scratch space is necessary. Refer to ST200 Run-time architecture manual
(7521848) for details.
8063762 Rev 9
41/246
Cross development tools
5.2.2
ST200
Initialization sequence
Core registers are initialized after the program loads and before the program execution
starts. Software initialization parameters (main() arguments and environment variables)
are passed to the host by the __start() entry point function. This configuration is done
according to st200xrun options or st200gdb commands.
After the program starts and before the main() function is called, the program executes the
internal real time run-time initialization.
5.2.3
Start parameters
int argc
char **argv
These are the arguments passed to the ST200 program from the st200xrun command line
(st200xrun -a [ARGUMENTS]) or st200gdb commands (set args). They are passed
through a syscall during the execution of the __start() function.
5.2.4
Other initializations
Internal C run-time initialization
At the execution of the __start() function, before the BSP initialization, the kernel stack is
set up.
The C run-time initialization sequence is located in the crti.o module linked with the
program.
The C run-time initialization invokes the BSP initialization (calling the three hooks
__init_core(), __init_board() and __init_soc()) before calling main().
Run-time initialization
Before calling main(), the following default initialization is performed in __init_core():
●
the ST200 exception handler is setup
●
the hardware is initialized for clock function setting (in bare mode only)
●
the memory access units and dismissable loads behavior are set to a default value
●
performance monitor initialization (for ST240 targets)
The default setting for the memory access unit is iis initialized to enable the use of the data
cache for all memory access between __text_start and _ramend and prevents any
dismissable load in the peripheral control register area.
The default initialization sequence is located in the libcore.a, libboard.a and
libsoc.a modules linked with the program. The source code for the initialization sequence
is in the following directories:
<tools-dir>/target/core/<st2xy>/src
<tools-dir>/target/board/<board>/src
<tools-dir>/target/soc/<soc>/src
42/246
8063762 Rev 9
ST200
5.2.5
Cross development tools
Initialization hook
If it is necessary to change the behavior of the init sequence before main() (for example,
peripheral initialization or target environment setup), use the hook mechanism put in place
in the startup phase of the run-time.
To enable user initialization of hardware or software before executing the main program,
there are two types of hooks.
5.3
●
The bsp_user_start_handle() and bsp_user_end_handle() are invoked from
the libcore.a library in the BSP initialization respectively at the start and the end of
the BSP initialization, see Section B.10: BSP function definitions on page 204.
●
The __init_soc() and __init_board() functions are located in the libsoc.a
and libboard.a libraries respectively.
The GNU debugger
The GNU debugger (GDB) supports the downloading and debugging of applications on:
●
silicon (using the ST Micro Connect)
●
the ST200 simulator
Although the GDB supplied includes the text user interface (TUI) and the Insight GUI, this
section describes only the standard command line interface. Details of the TUI are provided
in the GNU Debugging with GDB manual and the Insight GUI is described in Chapter 7:
Using Insight on page 64. The STWorkbench IDE is also provided to build and debug, see
Chapter 6: Using STWorkbench on page 58.There are several tools supplied with the GDB
for debugging applications:
The following GDB tools support the ST200 simulators and silicon:
●
st200gdb
●
st200insight
st200insight is identical to st200gdb except that it defaults to starting the Insight GUI
instead of the command line interface. Therefore, wherever st200gdb is referenced the
same also applies to st200insight.
5.3.1
Using GDB
GDB can execute any program, but it can only be used effectively to debug programs
compiled with debugging information (using the -g compilation option).
When a program is compiled, start GDB as follows:
st200gdb executable
GDB shows a message describing its version and configuration followed by a command
prompt (gdb).
There are many GDB commands available. For full instructions on all these commands use
the GDB help command or refer to the GNU Debugging with GDB manual.
All of the commands can be abbreviated to the shortest name that is still unique. The GDB
command line supports auto-completion of both commands and, where possible,
parameters. In addition, many of the most common commands have single letter aliases.
Most of the commands serve no purpose until GDB has connected to and initialized a
target.
8063762 Rev 9
43/246
Cross development tools
ST200
Connecting to a target
There is a range of different target types that can be used to debug the executable. The
connection command varies according to this type.The connection commands for st200gdb
have three forms, based on the following line:
(gdb) <connection command> <TargetString>
●
Connections to several silicon targets are supported by the ST200 TargetPack, for
these targets the <connection command> is st200tp.
The ST TargetPack notation is the recommended method for describing target systems
based on ST system-on-chip (SoC) devices. It is part of the ST Micro Connection
Package, the software companion of the ST Micro Connect host-target interface (some
legacy silicon targets are not supported). For example, to connect st200gdb to an
IPBR1100 board through an ST Micro Connect having the IP address <address>, the
connection command is:
(gdb) st200tp <address>:mb424:st231
In this case <address>:mb424:st231 is the <TargetString>.
●
The ST200 simulator connects to st200gdb using the st200sp (ST200 simulator
pack) <connection command>. The ST200 simulator pack is the set of st200gdb
procedures that enable the usage of st200gdb on the ST200 simulator. For example,
to connect st200gdb to the ST200 simulator set up for the IPBR1100 board (mb424)
use the following connection command:
(gdb) st200sp mb424sim
In this case, mb424sim is the <TargetString>.
●
Some silicon targets are not supported by the ST200 TargetPack. For these targets a
<connection command> exists for each board target, and the <TargetString> is
the IP address of the ST Micro Connect used for the connection. For example, to
connect st200gdb to an mb392_audiodec board target through an ST Micro Connect
that has the IP address <address>, the connection command is:
(gdb) mb392_audioenc <address>
In this case, <address> is the <TargetString>.
Executing the program
If the program loads and executes immediately, it simply runs until it reaches completion or
an error. To ensure that the program stops at a point of interest, set a breakpoint to enable
inspection or single-stepping of the program state.
Breakpoints can be set on specific functions, lines or addresses using the break command,
for example:
(gdb) break main
(gdb) break 21
(gdb) break *0xc0000408
Download the program, set any arguments (if required) and start the program on the target
by invoking the continue command:
(gdb) load
(gdb) set args argument1 argument2 argument3...
(gdb) continue
44/246
8063762 Rev 9
ST200
Cross development tools
The program runs until it completes, hits a breakpoint, is interrupted by the user with a
Ctrl+C or encounters an error. When the program stops, a short explanatory message is
displayed and the GDB prompt returns. To resume execution, invoke the continue
command again.
The following commands step execution a line, or a machine instruction at a time.
step
Moves on to the next source line (even if it is in a different function). Abbreviated
to s.
stepi
Moves on a single machine instruction before pausing the program again.
Abbreviated to si.
next
This is the same as step, but moves to the next line in the current function
rather than the next line in the program and steps over any function calls.
Abbreviated to n.
nexti
The machine code equivalent of next, it moves to the next instruction in the
sequence even if the current one is a call.
Examining the target
All the GDB commands for interrogating targets are available.
To view the register set, use the info registers command. For a more compact display,
use the regs command.
To disassemble the current function, use the disassemble command.
To disassemble the current instruction, use the (gdb) x/i $pc command.
To inspect the memory, use the x (examine) command, for example:
(gdb) x 0xC0000000
For other formats, use the / modifier. For example, strings:
(gdb) x/s 0x08001234
To view by name any variable currently in scope, use with the print (or p) command. It
can also be used with expressions, for example:
(gdb) p foo+bar*2
To format the displayed information, use the printf command, for example:
(gdb) printf "%s %d %d\n", 0x8001234, foo, foo+bar*2
Changing the state of the program
To alter memory locations, registers and variables, use the set command:
(gdb) set variable i = 0
The expression syntax is similar to C (or C++ depending what is being debugged), but there
are some extensions, see the GNU Debugging with GDB manual.
Exiting GDB
When the debug session is complete, use the quit (or q) command to exit GDB.
8063762 Rev 9
45/246
Cross development tools
5.3.2
ST200
The .lxgdbinit file
On startup, GDB searches for the.lxgdbinit file, first in the home directory and then in
the current working directory. If either of these files exist, GDB sources their contents. The
GDB -nx option prevents GDB from sourcing these files. In addition, if the st200gdb or
st200insight tools launch GDB, a default .lxgdbinit file is sourced before any other file.
This file enables support for the ST200 simulator and silicon targets. The -nx option has no
effect on this file.
Any commands in the .lxgdbinit files that require confirmation assume affirmative
responses. Any line beginning with # is ignored.
Using the st200gdb or st200insight tools
When the st200gdb or st200insight tools launch GDB, there is no requirement to create
any additional .lxgdbinit files. However, the .lxgdbinit files are still useful for setting
user preferences and defaults.
Using the lx-elf32-gdb, lx-elf32-insight or lx-elf32-gdbtui tools
When the lx-elf32-gdb, lx-elf32-insight or lx-elf32-gdbtui tools launch GDB, a
user-defined .lxgdbinit file can enable the ST200 simulator and silicon support. Use the
source command to source the default .lxgdbinit (in the subdirectory
lx-elf32/stdcmd of the release installation directory).
The default .lxgdbinit file assumes that the lx-elf32/stdcmd directory is on the GDB
search path. To display the path, use the GDB show directories command and to set
the path, use the GDB dir command.
The standard command files, containing the ST200 configuration and target connection
mechanisms, are located in the lx-elf32/stdcmd directory and have a .cmd extension.
5.3.3
Connecting to a running target
The ST200 Micro Toolset supports connecting to a running target attached to either an ST
Micro Connect 1 or an ST Micro Connect 2. This feature provides the full debugging
interface that would be available after a standard connect without disrupting the application
already running on the target.
A typical situation where this would be used, is when an application has been burnt to flash
and is running after a reboot of the target. In order to debug the application, the “connect to
a running target” mechanism is used to avoid core reset and memory initialization, that
would destroy the running process.
Figure 4: Process flows for connecting to a target on page 47 shows the different process
steps for each connection method and their different characteristics.
46/246
8063762 Rev 9
ST200
Cross development tools
Figure 4.
Process flows for connecting to a target
Flow A
Flow B
Application burnt on target flash
and running
Standard connect
Connect to a running target
Debug support initialization
Core chip reset
Memory initialization
Debug support initialization
Application load
Debug
Application run
Debug
Connecting to a running target with the executable available
The prerequisite for this type of connection is that the application is currently running.
The following command lines show how to launch st200gdb and perform the connect for
the application sample.out:
$> st200gdb sample.out
(gdb) st200tp <IP_address>:<board>:><core>,no_reset=1,no_pokes=1
.
.
(gdb)
After the target has been halted it is possible to inspect the code, set breakpoints and
continue execution.
8063762 Rev 9
47/246
Cross development tools
ST200
Connecting to a running target without the executable available
Even if the program executing on the target is not known and thus not available on the host
machine, it is still possible to connect to the running target. The only information that
st200gdb must be aware of is the target architecture.
The following command lines show how to launch st200gdb, perform the connect, set the
architecture and disassemble code starting from the current program counter.
$> st200gdb
(gdb) st200tp <IP_address>:<board>:><core>,no_reset=1,no_pokes=1
.
.
(gdb) set architecture <st231 | st240>
(gdb)
(gdb) disass $pc $pc+10
5.3.4
GDB command line reference
Table 8 lists some of the most useful command line options.
Table 8.
st200gdb command line options
Option
48/246
Description
-nw
-nowindows
Disables the Insight GUI and uses the command line interface.
Equivalent to the option -interpreter=console.
-n
-nx
Prevents GDB from sourcing any .lxgdbinit files or reading the
.gdbtkinit file (if they exist).
If the environment variable INSIGHT_FORCE_READ_PREFERENCES
is set, then -nx does not prevent the reading of the .gdbtkinit
file.
-w
-windows
Enables the Insight GUI instead of the command line interface, see
Chapter 7: Using Insight on page 64.
Equivalent to the option -interpreter=insight.
-tui
Enables the GDB text user interface (TUI) instead of the command
line interface.
Equivalent to the option -interpreter=tui.
-args exe args
Debugs the program (exe) and passes the command line
arguments (args) to the program (exe).
-batch
Processes the command line options (including any scripts from the
-command option) and then exits.
-batch-silent
This option is similar to -batch except that the debugger
suppresses all normal output messages other than errors.
-command file
-x file
Sources the commands in the file file. This is useful for setting up
functions or automating downloads.
-eval-command command
-ex command
Executes the specified GDB command, command. This option can
be specified multiple times to execute multiple commands. When
used in conjunction with -command, the commands and scripts are
executed in the order specified on the command line.
8063762 Rev 9
ST200
Cross development tools
Table 8.
st200gdb command line options (continued)
Option
5.3.5
Description
-interpreter interface
-ui interface
-i interface
Sets the GDB user interface to interface. Standard user
interfaces are console, tui, insight and mi.
-return-child-result
The return value given by GDB is the return value from the target
application (unless an explicit value is given to the GDB quit
command, or an error occurs).
GDB command quick reference
Table 9 lists some of the most useful GDB commands. It does not include any of the
additional commands for connecting and controlling targets that have been added in the
ST200 configuration, see Section 5.3.6: ST200 GDB commands on page 51. The GNU
Debugging with GDB manual provides further details on GDB commands and the GNU
debugger.
At the start of every user defined GDB command, an $argc GDB convenience variable is
automatically defined specifying the number of arguments to the command. This enables a
command to test how many parameters are passed to it.
Table 9.
st200gdb command quick reference
Command
Description
backtrace n [full]
Prints a backtrace of all the stack frames (function calls). If n is
specified and is positive then give the top n frames. If n is specified and
is negative then give the bottom n frames. If the word full is given
then it also prints the values of the local variables.
The bt command may be used as an alias for backtrace.
break function|line
|file:line
|*address
Sets a breakpoint on the specified function, line or address.
clear function|line
|file:line
|*address
Clears a breakpoint on the specified function, line or address.
continue
Continues execution of the program.
delete [number]
Deletes the numbered breakpoint or all breakpoints.
disable [number]
Disables the numbered breakpoint or all breakpoints.
disassemble [add1]
[add2]
Disassembles the machine code between the addresses add1 and
add2. If one address is omitted then the code around the one given is
disassembled. If both are omitted then it uses the program counter as
the address to use.
disconnect
Release the target from GDB control.
file file
Uses file as the program to be debugged.
finish
Completes the current function.
help
GDB commands assistance.
info all-registers
Prints the contents of all the registers.
8063762 Rev 9
49/246
Cross development tools
Table 9.
ST200
st200gdb command quick reference (continued)
Command
50/246
Description
info breakpoints
Lists all breakpoints.
info registers
Prints the contents of the registers. This provides more information than
regs.
list
Lists the next ten source lines.
list -
Lists the previous ten source lines.
list function|line
|file:line
|*address
|file:function
Lists specific source code. Any two arguments separated by a comma
are required to specify a range.
load [file] [LMA|VMA]
[offset]
Downloads the file to the target. If no file is given, the executable
from the GDB command line or the file (or exec-file) command is
used.
LMA (Load Memory Address) or VMA (Virtual Memory Address) specify
the area of memory file is copied to. If unspecified, LMA is assumed.
offset specifies the offset to add to each section loaded into memory.
The default is 0.
next [n]
Continues execution to next source line, stepping over functions. If n is
specified, do this n times.
nexti [n]
Executes exactly one instruction, stepping over subroutine calls. If n is
specified, do this n times.
print exp|$r
Prints the value of the expression exp or contents of the register $r (for
example, $r0 or $pc).
printf "format",
arg1,..., argn
Same as print but with a format-string. It enables more than one
parameter to be printed. Parameters must be separated by commas.
quit [code]
Exits GDB with the return value code, if specified. If code is not
specified, GDB exits with the return value of 0.
Note that the GDB convenience variable $_exitcode is set to the
return value of the target application and therefore may be used as the
value for code, for example quit $_exitcode.
rbreak regexp
Sets a breakpoint on all functions that match regexp.
regs
Prints the contents of the registers. info registers provides more
information.
run [file] args
Runs the program. The program must already have been downloaded
(using load) when using the GDB simulator.
If an executable was given on the command line then file must not be
given here.
set args [args_list]
The command set args takes a list of arguments to be passed to the
application program. Used before starting the program.
set variable
var = exp
Sets the value of a variable or register.
step [n]
Continues execution to next source line. If n is specified, do this n
times.
stepi [n]
Executes exactly one instruction. If n is specified, do this n times.
8063762 Rev 9
ST200
Cross development tools
Table 9.
st200gdb command quick reference (continued)
Command
5.3.6
Description
set trace-commands
on|off
Sets trace-commands on/off. Enables the tracing of GDB commands.
The default is off.
show trace-commands
Displays the current state of GDB CLI command tracing.
tbreak function|line
|file:line
|*address
Sets a temporary (one time only) breakpoint on the specified function,
line or address.
watch exp
Sets a watchpoint for the expression exp.
where n [full]
This is identical to the backtrace command.
ST200 GDB commands
There are several additional features in the supplied st200gdb that are not found in the
standard version of GDB from the Free Software Foundation (FSF). These are not specific
to the ST200 configuration, but are generic features that have been added in order to
provide better support for the implementation of the GDB scripts used for connecting to
STMicroelectronics simulators and silicon parts. The commands become available only
after the connection to an ST200 target.
To get online help about these commands, from the GDB command prompt type:
(gdb) help STM
Table 10 lists the additional st200gdb non-specific GDB commands.
Table 10.
ST200 st200gdb non-specific commands
Command
Description
callplugin
Calls an installed target interface plugin.
compare-sections
Compares section data on target to the exec file.
console
Enables or disables the target I/O console.
installplugin
Installs a plugin to drive the target interface layer directly.
msglevel
Sets the target debug interface message level.
ondisconnect = none
| reset | restart
Set the action to perform on disconnecting from the target. The default
is none.
– none does nothing when disconnecting
– reset, this option resets the target before disconnecting, (this is not
compatible with the ST Micro Connect 2)
– restart, this option restarts the target from where it was last
stopped
rtos
Enables or disables RTOS awareness.
8063762 Rev 9
51/246
Cross development tools
ST200
st200gdb extended features
st200gdb offers also commands for the ST200 simulator and ST200-specific devices, that
is, the performance monitor block and the DSU interface.
Table 11 lists the simulator and DSU commands.
Table 11.
Simulator and DSU commands
Command
Description
Simulator commands
52/246
bus-trace-off
Turn off bus traffic tracing.
bus-trace-on
Turn on bus traffic tracing.
flush
Flush the trace output stream.
get_config config_item
Give the value of a specified configuration item.
profile-off
Turn profiling off.
profile-on
Turn profiling on.
reset-statistics
Reset the simulator statistics counter to zero.
set-bus-trace-file
Set the current bus tracing file.
set-trace-file
Set the current tracing file.
start-statistics
Start the simulator statistic counters.
statistics
Output the current simulator statistics to screen.
statistics > filename
Output the current simulator statistics to file.
statistics >> filename
Append the current simulator statistics to file.
stop-statistics
Stop the simulator statistic counters.
trace-off
Turn tracing off.
trace-on
Turn tracing on.
8063762 Rev 9
ST200
Cross development tools
Table 11.
Simulator and DSU commands (continued)
Command
Description
DSU commands (only available when connected to a silicon target)
enable_dsu
Enables the DSU commands. enable_dsu is
executed automatically when the host connects to a
physical ST200 target.
dsu
dsu
dsu
dsu
The DBREAK_CONTROL registers determine the
comparison operations performed on the breakpoint
addresses.
If the comparison is true then a breakpoint
exception is signaled. For the data breakpoints, the
data effective address of loads and stores are used
for comparison.
Prefetches and purges do not trigger data
breakpoints.
dbreak
dbreak
dbreak
dbreak
either lower upper
in_range lower upper
masked lower upper
out_range lower upper
dsu dbreak disable
Disables dbreak, if a dbreak was already set, range
and condition are lost.
dsu dpeek reg [numregs]
Read and show the contents of numregs DSU
registers starting from reg.
If numregs is not specified, only one DSU register
is read.
If reg and numregs parameters are not specified,
all DSU registers are read.
dsu dpoke reg DATA
Write 32-bit word value in hex format (prepend by
0x) in the DSU register.
dsu flush low_address high_address
Flush an address range from data and instruction
caches using the DSU_FLUSH debug ROM
operation as described in the ST231 Core and
Instruction Set Architecture Manual (7645929).
low_address and high_address specify the
inclusive address range and must be aligned to
word addresses.
dsu
dsu
dsu
dsu
The IBREAK_CONTROLE registers determine the
comparison operations performed on the breakpoint
addresses.
If the comparison is true then a breakpoint
exception is signaled. For the instruction
breakpoints, the currently executing bundle address
(PC) is used for comparison.
ibreak
ibreak
ibreak
ibreak
either lower upper
in_range lower upper
masked lower upper
out_range lower upper
dsu ibreak disable
Disables ibreak, if an ibreak was already set, range
and condition are lost.
8063762 Rev 9
53/246
Cross development tools
ST200
The pmblock st200gdb command
The ST200 cores are equipped with a performance monitoring block. This block is capable
of recording core-relevant events such as data cache hits, instruction cache hits and several
others, see the appropriate Core and instruction set architecture manual. The pmblock set
of commands gives the user access to this block on both simulator and real targets.
Table 12.
PMblock specific commands
Command
Description
enable_pmblock
Enables the performance monitoring commands.
enable_pmblock is executed automatically when
the host connects to a physical ST200 target. When
connected to a simulated target, this command can
be executed at anytime.
pmblock listevents
List all the available event types.
pmblock reset
Reset all counters.
pmblock resetidle
Reset idle flag.
pmblock setclock <value>
Set the clock counter to <value>.
pmblock setcounter <counter>
<value>
Set the counter <counter> to <value>.
pmblock setevent <counter> <event> Set the counter <counter> to count <event>.
54/246
pmblock show
Display the PM block registers content.
pmblock showclock
Display the clock counter value.
pmblock showcounter <counter>
Display the content of counter <counter>.
pmblock start
Enable (starts) the event counting.
pmblock stop
Disable (stops) the event counting.
8063762 Rev 9
ST200
5.4
Cross development tools
Using st200xrun
st200xrun provides a simple batch mode interface to GDB. This enables users to connect
and configure a target system, then load and execute an application on the target system.
st200xrun invokes GDB with all the options and scripts required to execute the program.
5.4.1
Setting the environment
The setup of st200xrun is identical to the setup of GDB, see Section 1.2.3: Configuration
scripts on page 16.
5.4.2
st200xrun command line reference
To display the help, invoke st200xrun with the -h option.
Usage
st200xrun [-c procedure] [-d directory] [-e file] [-f] [-g gdbpath] [-h] [-i
filename] [-t target] [ -u gdbname] [-v] [-x filename] [-A gdb_command] [-B
gdb_command] [-C target_opt] [-D] [-T timeout] [-V][-a|-- ][arguments]
Note:
The command order is important, -a or -- must always be the last option as this indicates
that all the following arguments are to be passed to the target application.
Table 13.
st200xrun command line options
Option
Description
-c procedure
Specifies the target configuration procedure (GDB command) to be
invoked.
The two supported configuration procedures are:
st200tp, the ST200 TargetPack, used for silicon targets; this is the
default used if a procedure is not specified
st200sp, the ST200 simulator pack, used for simulator targets
The configuration procedure must be compatible with the target being
used.
-d directory
Add a directory to GDB’s search path. The command dir directory is
issued to GDB.
This option can be specified more than once.
-e file
Specify the executable file to be loaded onto the target(1).
-f
Ignored by st200xrun (included for backward compatibility).
-g gdbpath
Specify the full path to the GDB executable to be used. This should be a
version compatible with the version of GDB supplied by
STMicroelectronics.
-h
Display the help for st200xrun.
-i filename
Execute the GDB script file filename. The command source filename
is issued to GDB. The GNU Debugging with GDB manual provides
examples of script file syntax.
This option can be specified more than once.
8063762 Rev 9
55/246
Cross development tools
Table 13.
ST200
st200xrun command line options (continued)
Option
Description
-t targetstring
Specifies the target with which to be connected, in the ST
TargetPack/SimulatorPack idiom.
For hardware targets, see ST TargetPack user manual (8020851) and for
simulated targets, see Chapter 4: Board target configuration on page 27.
-u gdbname
Specify the name of GDB.
-v
Display verbose information.
-x filename
Execute filename as the default startup script instead of .lxgdbinit.
-A <gdbcommand>
Execute <gdbcommand> after running the program(2). For example:
st200xrun -c st200sp -t st231simle -A "statistic >
file.txt" -e hello.out
-B <gdbcommand>
Execute <gdbcommand> before running the program(2). For example:
st200xrun -c st200sp -t st231simle -B "statistic >
file.txt" -e hello.out
-C
Sets further target options(2). For example:
st200xrun -c st200sp -t st231sim -C
"DUMP_CONFIG_FILE=filename.txt" -C "MODE=FAST" -e
hello.out
Targetpack example:
st200xrun -c st200tp -t <ipaddr>:mb424:st231 -C
"msglvel=info" -e hello.out
<target_opt>
-D
Debug (verbose information)
-T timeout
The maximum time for executing on the target. timeout is expressed in
seconds.
-V
Display the version of st200xrun.
-a arguments
-- arguments
Specify that the remainder of the command line arguments are to be
passed as arguments to the target application.
This option can only be specified as the final option in the command line.
1. If the -e option is omitted (and the -i option is not used) then st200xrun assumes that the first argument
in the argument list is the name of the executable file.
2. This option can be issued multiple times. The GDB commands are executed in the order specified in the
command line, Options passed using -C are handled in the order specified by the sequence of -C calls.
5.4.3
st200xrun command line examples
To run hello.out on a silicon IPBR1100 target (mb424) with an ST TargetPack, enter the
following command:
st200xrun -c st200tp -t <IP_address>:mb424:st231 -e hello.out [-a arg1 arg2 ...]
The default configuration procedure is st200tp, so in the previous example the
-c st200tp could be omitted to give the following command line:
st200xrun -t <IP_address>:mb424:st231 -e hello.out [-a arg1 arg2 ...]
56/246
8063762 Rev 9
ST200
Cross development tools
It is also possible to omit the -e, by specifying the following command line:
st200xrun -t <IP_address>:mb424:st231 -- hello.out [-a arg1 arg2 ...]
In this case the -- option is used to specify to st200xrun that the first argument in the list
following -- is the name of the executable.
To run hello.out on the mb424sim simulator (a profile of the ST231 simulator that
simulates the IPBR1100), enter the following command:
st200xrun -c st200sp -t mb424sim -e hello.out
To run hello.out using a script file, enter the following command:
st200xrun -i load.rc
Where the contents of the script file, load.rc, could be:
file hello.out
st200tp <IP_address>:mb424:ST231
load
c
To run hello.out with target program arguments, enter the following command:
st200xrun -c st200tp -t <IP_address>:mb424:st231 -e hello.out -a arg1 arg2 arg3
arg4
8063762 Rev 9
57/246
Using STWorkbench
6
ST200
Using STWorkbench
This chapter describes how to use the STWorkbench Integrated Development Environment
(IDE) for the ST200 Micro Toolset. STWorkbench is available on all supported host
platforms.
The STWorkbench is delivered with CDT (C/C++ Development Tooling) included. CDT
provides a fully functional C and C++ IDE for the STWorkbench platform and enables the
user to develop, execute and debug applications interactively.
The STWorkbench is built on the Eclipse IDE. The Eclipse development environment and
related information can be found at the Eclipse website www.eclipse.org. Information on
CDT can be found at www.eclipse.org/cdt.
Note:
STWorkbench is a separate release to the ST200 Micro Toolset.
6.1
Getting started with STWorkbench
Under Linux, start STWorkbench from the shell by entering stworkbench.
Under Windows, start STWorkbench by selecting the appropriate option from the Start
menu: Programs > STM Tools > STWorkbench Rn.n.n > STWorkbench, where n.n.n is
the STWorkbench version number.
Note:
The precise menu options displayed are dependant upon the version of STWorkbench you
are using and the choices made when STWorkbench was installed.
When STWorkbench is launched, the Workspace Launcher dialog is displayed (see
Figure 5). Use this dialog to enter or select the location of the workspace. The workspace is
the directory where the project data, files and directories are stored.
Figure 5.
Workspace Launcher
If the workspace directory does not already exist, STWorkbench creates it for you.
Note:
58/246
1
Do not use spaces in the workspace path and name as it causes problems with the tools.
2
The workspace can be changed at any time by selecting Switch Workspace from the File
menu.
8063762 Rev 9
ST200
Using STWorkbench
When STWorkbench is launched for the first time, the C/C++ Projects perspective is
displayed, with only the Welcome to STWorkbench view visible. See Figure 6.
Figure 6.
Welcome view
The icons on this screen allow you to access documentation about STWorkbench, tutorials
and sample code. If you are a first-time user, then you should take some time to explore the
documentation to learn more about STWorkbench.
Proceed from the Welcome view to the Workbench by clicking on the curved arrow icon in
the top right corner of the Welcome screen, circled in red in Figure 6. You can return to the
Welcome view at any time by selecting Help > Welcome.
A Workbench provides one or more perspectives. A perspective contains editors and
views, such as the Navigator. Multiple Workbenches can be opened simultaneously.
6.1.1
The STWorkbench workbench
Before using STWorkbench, it is important to become familiar with the various elements of
the workbench. A workbench consists of:
●
perspectives
●
views
●
editors
A perspective is a predefined group of views and editors in the Workbench. A perspective
is designed to include all the views necessary for carrying out a specific task. For example,
8063762 Rev 9
59/246
Using STWorkbench
ST200
the C/C++ perspective contains views required for C/C++ development (including the C/C++
Projects view and the Outline view) and the Debug perspective contains views required
when debugging (including the Debug, Variables and Breakpoints views). One or more
perspectives can exist in a single workbench. Each perspective contains one or more views
and editors. Each perspective may have a different set of views but all perspectives share
the same set of editors.
A view is a window within the workbench. It is typically used to navigate through a hierarchy
of information (such as the resources in the workbench), open an editor, or display
properties for the active editor. Modifications made in a view are saved immediately.
Several views in the Debug perspective can be duplicated to show multiple views of the
same type of information, with each locked into different contexts in the Debug view. For
more information, see STWorkbench Help > Pin and Clone.
The title bar of the Workbench indicates which perspective and workspace is active. In
Figure 7, the C/C++ Projects perspective is in use, and the workspace is located at
C:Tutorial\Workspace.
Figure 7.
C/C++ perspective
An editor is a visual component within the workbench. It is typically used to edit or browse a
resource. Multiple instances of an editor may exist within a workbench window.
Depending on the type of file being edited, the appropriate editor appears in the editor area.
For example, if a .txt file is being edited, a text editor appears. The name of the file
60/246
8063762 Rev 9
ST200
Using STWorkbench
appears in the editor tab. If an asterisk (*) appears on the left of the tab, it shows the editor
has unsaved changes. If you try to close the editor or exit the workbench without saving, a
prompt to save the editor's changes appears.
When an editor is active, the workbench menu bar and toolbar contain operations applicable
to the editor. When a view becomes active, the editor operations are disabled. However,
certain operations may be appropriate in a view and remain enabled.
The editors can be stacked in the editor area. Click the tab for a particular editor to use it.
Editors can also be tiled side-by-side in the editor area so their content can be viewed
simultaneously.
Changing a perspective’s views
The views that make up a perspective can be changed. For example, to add the
Disassembly view to the Debug perspective, perform the following steps:
1.
If necessary, change to the Debug perspective by selecting Window >
Open Perspective > Debug or Window > Open Perspective > Other... > Debug.
2.
Select Window > Show View > Disassembly to display the Disassembly view.
3.
Select Window > Save Perspective As.... The Save Perspective As... dialog is
displayed.
Figure 8.
4.
Save Perspective As... dialog
Select Debug in the Existing Perspectives list and click on OK.
You are prompted:
A perspective with the name ‘Debug’ already exists. Do you want to overwrite?
5.
Click on Yes, to save the Debug perspective with the currently open views.
8063762 Rev 9
61/246
Using STWorkbench
6.2
ST200
STWorkbench tutorials
The on-line help provides a number of tutorials to guide the user through the steps to build,
run and debug an ST200 application. The tutorials are accessed through the STWorkbench
help system by selecting Help > Help Contents > STWorkbench for ST200 Micro Toolset
menu.
Concepts
The purpose of this tutorial is to familiarize new users with the various basic elements of the
workbench.
Getting Started
This tutorial provides instructions on how to build a simple OS21 “Hello World” C
application.
Import an existing project
This tutorial describes how to build a C/C++ application by importing an existing source tree,
complete with its own makefile, into a wrapper project with STWorkbench.
At the end of the tutorial you will have built an ST200 application that can be run or
debugged.
Debugging C/C++ Applications
This tutorial describes the process of starting an ST200 debug session with a previously
built binary executable. It also describes common debugging steps, such as modifying
breakpoints, examining variables, call stacks and tasks.
Running C/C++ Applications
This tutorial describes the process of running an ST200 application with a previously built
binary executable.
Branch Trace View
This page describes how to use the Branch Trace view to display the last eight branches
that the program performed before arriving at the place where the debugger is currently
stopped.
Execute from Command Line
STWorkbench supports the ability to launch a debug session directly from the command
line. This page describes how to use this facility.
Performance Monitor view
This page describes how to use the ST200 Performance Monitor view to examine the data
provided by the ST200 Performance Monitor facility.
Statistics view (simulator only)
This page describes how to display ST200 simulator statistics using the ST200 Statistics
view.
62/246
8063762 Rev 9
ST200
6.3
Using STWorkbench
ST200 System Analysis tutorials and reference pages
There are several tutorials on how to use the ST System Analysis (formerly the Profiling and
Coverage) features. The tutorials are accessed through the STWorkbench help system by
selecting Help > Help Contents > ST200 trace, profile and coverage.
ST200 Static Analysis
STWorkbench supports the generation and display of profiling, coverage and OS21 Profiler
data. These features are described in the following tutorials:
●
STgprof
This tutorial describes the STgprof profiler and provides a guide on using this tool to
determine which parts of a program take most of the execution time.
●
STgcov
This tutorial describes the STgcov profiler and provides a guide on using this tool to
identify the parts of a program that have never been exercised.
●
OS21 Profiler
This tutorial describes the OS21Profiler profiler and provides a guide on using this tool
to analyze the performance characteristics of an OS21 application.
ST200 Interactive Analysis
Interactive support is available for OS21 System Activity, STMC sampling and OS21
Profiler. These features are described in the following help pages.
●
OS21 System Activity
This tutorial describes the OS21 Activity analyzer and provides a guide for using this
tool to analyze and monitor the life cycles of interrupts and tasks in an OS21
application.
●
STMC sample profiler
These pages describe the STMC sample profiler, a facility that uses the ST Micro
Connect to obtain profiling data on the application. The generated result is similar to
STgprof.
●
STMC sample history
These pages describe the STMC sample history, which uses the same approach as
the STMC sample profiler but provides a sequential view of the application’s activities
over a period of time.
●
OS21 Profiler
These pages describe the OS21 Profiler view in the debugger perspective. This view
shows the OS21 Profiler data in a graphical form. The OS21 Profiler is described in
Chapter 11: OS21 Trace on page 98.
8063762 Rev 9
63/246
Using Insight
7
ST200
Using Insight
Insight is a Graphical User Interface for GDB that is available on all supported host
platforms. It enables the user to execute and debug applications interactively. The
command line interface for GDB is described in Section 5.3: The GNU debugger on
page 43.
Insight can display several windows that contain source and assembly level code together
with a range of system information. In addition, Insight has a Console Window for entering
GDB commands on the command line.
Insight has several features.
7.1
●
For many parts of a window, click the right-hand mouse button to open a
context-sensitive menu, see Section 7.2.2: Context-sensitive menus on page 66.
●
When the mouse pointer hovers over a button, tooltips are displayed.
●
When Insight launches, it restores the configuration and open windows from the state
saved in the user’s home directory (specified by the HOME environment variable) in a
file named .gdbtk200init on Unix, or gdbtk200.ini on Windows. This state is
saved each time Insight closes.
Launching Insight
To launch the Insight GUI on the command line, enter either st200gdb -w or
st200insight. Alternately, under Windows, click the Start button and select Programs >
STM Tools > ST200 Micro Toolset R6.0 > Insight.
Note:
64/246
When Insight launches for the first time, the Source Window opens, see Section 7.2.
8063762 Rev 9
ST200
7.2
Using Insight
Using the Source Window
The Source Window is the main window that opens when Insight launches, see Figure 9.
Section 7.2.1 describes the toolbar buttons.
Figure 9.
7.2.1
Source Window
Source Window toolbar
Table 14 lists the buttons on the Source Window toolbar.
Table 14.
The Source Window buttons
Button
Name
Description
Run (R)
Start the program executing.
Step (S)
Step into the next statement.
Next (N)
Step over the next statement.
Finish (F)
Step out of the current function.
Continue (C)
Continue the program after a breakpoint.
Step Asm Inst (S)
Step one instruction.
Next Asm Inst (N)
Step over the next instruction.
8063762 Rev 9
65/246
Using Insight
ST200
Table 14.
The Source Window buttons (continued)
Button
7.2.2
Name
Description
Registers (Ctrl+R)
Display the Registers window.
Memory (Ctrl+M)
Display the Memory window.
Stack (Ctrl+S)
Display the Stack window.
Watch Expressions
(Ctrl+W)
Display the Watch Expressions window.
Local Variables (Ctrl+L)
Display the Local Variables window.
Breakpoints (Ctrl+B)
Display the Breakpoints window.
Console (Ctrl+N)
Display the Console Window.
Down Stack Frame
Move to the stack frame called by the current frame.
Up Stack Frame
Move to the stack frame that called the current frame.
Go To Bottom of Stack
Move to the bottom most stack frame.
Context-sensitive menus
Many parts of a window have context-sensitive menus, to open a context-sensitive menu,
click the right-hand mouse button. For example, right-clicking on a breakpoint position
(shown as a hyphen) displays a context-sensitive menu with the following options.
Continue to Here
Continue the application and stop at the selected line.
Jump to Here
Jump directly to the specified line(1). Unlike the Continue
option, this modifies only the Program Counter. This option is
advantageous for going backward after the contents of a
variable has been manually modified or for skipping over
defective code.
Set Breakpoint
Set a breakpoint on the selected line. The breakpoint is shown
as a red square.
Set Temporary Breakpoint Set a temporary (one time only) breakpoint on the selected
line. The breakpoint is shown as an orange square.
Set Breakpoint on Thread(s)...
Set a breakpoint on the thread. If more than one thread is
available the Thread Selection window opens to select the
required threads. The breakpoint is shown as a pink square.
1. In optimized code, this may not work as expected due to the compiler reordering code.
66/246
8063762 Rev 9
ST200
7.3
Using Insight
Debugging a program
The following procedure demonstrates debugging a program using the getting started
example, see Section 1.5: The examples directory on page 20.
1.
Launch Insight, see Section 7.1 on page 64.
2.
Click the
3.
Select the executable file and click the Open button. The Target Selection window
opens.
4.
Complete the Target Selection window, see Section 7.4: Changing the target. The
program launches and stops at the breakpoint set at the main() function, see
Figure 10.
button. The Load New Executable dialog box opens.
Figure 10. hello.c stopped at breakpoint
5.
Debug the program using the menu and toolbar options.
To toggle breakpoints on and off, click on the hyphen symbols to the left of the code.
Breakpoints are shown as red squares.
8063762 Rev 9
67/246
Using Insight
7.4
ST200
Changing the target
1.
From the File menu, select Target Settings.... The Target Selection window opens,
see Figure 11.
Figure 11. Target Selection window
2.
From the Target drop-down list, select ST Debug Interface, see Figure 12.
3.
Specify any Options required, for example, to run the example on an IPBR1100 board
(mb424) connected to an ST Micro Connect with a network address of <IPaddress>,
enter st200tp <IPaddress>:mb424:ST231, see Figure 12.
Alternatively to run on a simulator target enter st200sp st231simle.
Figure 12. Target Selection window- example
4.
68/246
Click the OK button.
8063762 Rev 9
ST200
7.5
Using Insight
Configuring breakpoints
When a program runs, it continues as far as the first breakpoint. If Set breakpoint at ‘main’
in the Target Selection window is selected, this is the first real line of the program.
Figure 13. Breakpoint examples
The red square in the left-hand margin indicates the position of a breakpoint. The hyphens
indicate valid positions for potential breakpoints.
The green highlighting shows the position of the current PC (program counter). Orange
highlighting shows the current position in that stack frame (the real position is at the top of
the stack).
When the mouse pointer hovers over a variable or function name, a tooltip shows the
current value of that variable. Variables and types have a context-sensitive menu (right-click
on the item to open the context menu) that has various actions, for example, setting
watchpoints and dumping memory.
To set a breakpoint, click on the hyphen next to the line of code. The breakpoint is shown as
a red square.
Right-click on a breakpoint position (shown as a hyphen) to open the context-sensitive
menu for the following breakpoint options.
Set Breakpoint
Set a breakpoint on the selected line. The breakpoint is
shown as a red square.
Set Temporary Breakpoint
Set a temporary (one time only) breakpoint on the
selected line. The breakpoint is shown as an orange
square.
Set Breakpoint on Thread(s)... Set a breakpoint on the thread. If more than one thread is
available the Thread Selection window is displayed to
select the required threads. The breakpoint is displayed
as a pink square.
To replace the three Set Breakpoint options with Disable Breakpoint and Delete
Breakpoint options, right-click on an existing breakpoint. Disabled breakpoints appear as
black squares.
8063762 Rev 9
69/246
Using Insight
7.5.1
ST200
The Breakpoints window
To open the Breakpoints window, either click the
Source Window, select Breakpoints.
Note:
button or from the View menu in the
The Breakpoints window does not enable the creation of new breakpoints, but does permit
existing ones to be viewed and edited.
Figure 14. Breakpoints window
Click on a breakpoint to select it. To change the breakpoint, use the check boxes and the
Breakpoint and Global menus.
Breakpoint menu
Normal, Temporary
Set the breakpoint to normal (permanent) or temporary
(one-time).
Enabled, Disabled
Enable or disable the breakpoint.
Remove
Delete the selected breakpoint.
Global menu
7.6
Show Threads
Add an additional column to the window showing the threads
the breakpoint is set on.
Disable All, Enable All
Disable or enable all of the breakpoints.
Remove All
Delete all of the breakpoints.
Store Breakpoints...
Save the breakpoints to a file.
Restore Breakpoints...
Restore breakpoints from a file.
Using the help
To open the help files, from the Help menu, select Help Topics.
70/246
8063762 Rev 9
ST200
7.7
Using Insight
Using the Stack window
The Stack window shows a list of all the frames currently on the stack.
To open the Stack window, either click the
Window, select Stack.
button or from the View menu in the Source
Figure 15. Stack window
To select a frame, click on the appropriate frame line. The line is highlighted in yellow and
the Registers and Local Variables windows show the associated data. The Source
Window shows the associated source line, see Figure 16 on page 72, Figure 20 on
page 76 and Figure 9 on page 65.
8063762 Rev 9
71/246
Using Insight
7.8
ST200
Using the Registers window
The Registers window shows the content of all the registers.
To open the Registers window, either click the
Source Window, select Registers.
button or from the View menu in the
Figure 16. Registers window
To edit a register’s value, right-click on a register’s value to open the following
context-sensitive menu options.
Note:
72/246
Hex, Decimal, Unsigned
Change the format.
Open Memory Window
Open a Memory window at the location specified by the
currently selected register, see Section 7.9.
Add to Watch
Add the selected register to the Watch window, see
Section 7.10 on page 75.
Remove from Display
Delete the selected register from the window.
Display all Registers
Restore all registers that have been removed from the display.
Help
Open the online help window.
Close
Close the Registers window.
To view only the registers belonging to a specific group (general, float, system, vector,
all), use the Group selection box.
8063762 Rev 9
ST200
7.9
Using Insight
Using the Memory window
The Memory window enables you to view and modify the current state of memory on the
target. The window can be resized to view more memory information.
To open the Memory window, either click the
Source Window, select Memory.
button or from the View menu in the
Figure 17. Memory window
Click on a memory location to edit the contents. To customize the display, use the
Addresses menu.
Addresses menu
Auto Update
If the state of the target changes, the memory information updates
automatically (default).
Update Now
Manually override the auto-update to show the memory state at that
instant.
Preferences...
Opens the Memory Preferences window, the options are:
●
size
●
format
●
number of bytes
●
miscellaneous
Right-click on a memory location to open the following context-sensitive menu options.
Go To...
Show the selected memory location.
Open New Window at...
Open an additional Memory window showing the selected
memory location.
8063762 Rev 9
73/246
Using Insight
7.9.1
ST200
Displaying multiple Memory windows
To show multiple Memory windows, either click the
Source Window, select Memory.
Figure 18. Multiple memory windows
74/246
8063762 Rev 9
button or from the View menu in the
ST200
7.10
Using Insight
Using the Watch window
Use the Watch window to set and edit user-specified expressions. Each time the program
halts, the expressions are reevaluated and shows the program state.
Note:
Watch expressions are not the same as watchpoints. Watchpoints must be set through the
console window.
To open the Watch window, either click the
Window, select Watch Expressions.
button or from the View menu in the Source
Figure 19. Watch window
There are two ways to add expressions to the Watch window.
Note:
●
Type an expression into the field at the bottom of the window and click the Add Watch
button.
●
In the Source Window or Registers window, right-click on the expression to open the
context-sensitive menu and select Add to Watch.
The expression must use the same syntax as the language being debugged. For example,
to watch for fred being assigned the value 42 when debugging a C application, enter
fred==42. Using assignment operators by mistake, for example, fred=42, changes the
value of the variable in the program.
Right-click on a watch expression to open the following context-sensitive menu options.
Format
Change the format to Hex, Decimal, Binary, Octal or Natural
(mantissa and exponent for floating-point values).
Edit
Edit the expression value.
Delete
Delete the highlighted expression from the list.
Dump Memory at...
Displays the selected watch expression in the Memory
window.
Help
Displays the online help window.
Close
Close the Watch window.
8063762 Rev 9
75/246
Using Insight
ST200
The display of values can also be adjusted by normal C type casting. Structures and classes
can be expanded as a tree.
Note:
The look and feel of the Watch window was enhanced in Insight 6.1. The following
information is displayed for each item:
<item_name> = <type> <value> <string pointed by value as an address>
7.11
Using the Local Variables window
The Local Variables window shows all the variables in the current stack frame. To open the
Local Variables window, either click the
button or from the View menu in the Source
Window, select Local Variables.
Figure 20. Local Variables window
Right-click on a variable to open following the context-sensitive menu options.
Format
Change the format of the variable. It can be Hex, Decimal,
Octal, Binary or Natural (mantissa and exponent for float
variables).
Edit
Edit the value of the selected variable.
Delete
Delete the highlighted expression from the list.
Dump Memory at...
Displays the selected variable in the Memory window.
Help
Displays the online help window.
Close
Close the Local Variables window.
To expand the structure of a variable, click on the plus (+) sign. To collapse the structure,
click the minus (-) sign.
76/246
8063762 Rev 9
ST200
7.12
Using Insight
Using the Console Window
The Console Window is the underlying GDB console and enables the user to issue
commands directly to GDB.
To open the Console Window, either click the
Source Window, select Console.
button or from the View menu in the
Figure 21. Console Window
If the Console Window is open when a GDB command is issued, it shows the output. For
example the load command.
Note:
Insight GUI commands such as continue or step are not visible in the Console Window
unless they are issued directly at the Console Window prompt.
The display output of the Insight GUI and the GDB console commands are synchronized.
To view the ST200 simulator instruction trace data or to switch the performance data
gathering of the simulator on or off, use the console.
You can issue any GDB command through the Console Window.
Note:
If you use console off, the program output is visible on the terminal from which Insight
was launched and not in the console window. For this reason, use console on in
conjunction with Insight.
8063762 Rev 9
77/246
Using Insight
7.13
ST200
Using the Function Browser window
To search for functions in the application and show the source code for that function, use
the Function Browser window, see Figure 22. This makes it easy to add breakpoints
throughout the code.
To open the Function Browser window, from the View menu in the Source Window,
select Function Browser.
The following fields are available to search for functions.
Function Filter
Searches for an expression.
starts with lists all functions that start with the expression.
contains lists all functions that contain the expression.
ends with to list all functions which end with the expression.
matches regexp lists all functions that match the regular expression.
Files
This shows all the files within the application. Only the selected files are
searched for using the expression.
Functions
This shows all the functions within the selected files. To delete and set
breakpoints at the start of each function, use the Delete BP and Set BP
buttons.
The lower section of the window shows the source code for the selected function. To set
breakpoints, use the same method as for the Source Window, see Section 7.5: Configuring
breakpoints on page 69.
Figure 22. Function Browser window
78/246
8063762 Rev 9
ST200
7.14
Using Insight
Using the Processes window
The Processes window shows the active threads. To open the Processes window, from
the View menu in the Source Window, select Thread List, see Figure 23.
Figure 23. Processes window
The Processes window shows the thread number and details such as current status. To set
a thread as the current thread, click on it. This causes the debugger to switch contexts and
updates all windows.
8063762 Rev 9
79/246
Using Insight
7.15
ST200
Using the ST200 Statistics window
The ST200 Statistics window is available only on the simulator target. The ST200
Statistics window shows the results of the statistics command. The window updates
each time the state of the processor changes. Figure 24 shows an example of the ST200
Statistics window.
To display the ST200 Statistics window, do one of the following:
●
click the
●
from the View menu in the Source Window, select ST200 Statistics
●
press the Ctrl+I keys on the keyboard.
button
Figure 24. The ST2x0 Statistics window
The Start button calls the start-statistics command. It starts the statistics counters
for the ST200 processor. By default, the counting is enabled.
The Stop button calls the stop-statistics command. It stops the statistics counters for
the ST200 processor.
The Reset button calls the reset-statistics command. For example, to compute the
statistics, use this before executing a sequence of code.
80/246
8063762 Rev 9
ST200
7.16
Using Insight
Using the Performance Monitoring window
The Performance Monitoring window gives access to all the features provided by the
ST200 cores performance monitoring block. The counter values update whenever their
values change. To set the type of event counted by the counters and their values, it is
possible to start and stop the event counting. Figure 25 shows an example of the
Performance Monitoring window.
To display the Performance Monitoring window, do one of the following:
●
click the
●
from the View menu in the Source Window, select Performance Monitoring
●
press the Ctrl+X keys on the keyboard
button
Figure 25. The Performance Monitoring window
To make any changes in the editable fields effective, click the Apply button. The buttons in
the Switches area of the window are active immediately. When counting events is enabled,
the Start button toggles to Stop.
8063762 Rev 9
81/246
Using Insight
7.17
ST200
Using the Debug Support Unit Window
The Debug support unit (DSU) allows both the software and hardware to be debugged from
a host by giving direct access to the ST2xx core.
The Debug Support Unit window provides a simple interface to monitoring and editing
DSU registers.
Note:
DSR0 is always read-only, while DSR31 is read-only just on ST240 cores because it
represents the virtual PC.
To display the Debug Support Unit window, do one of the following:
●
click the
●
from the View menu in the Source Window, select Dsu viewer
●
press the Ctrl+J keys on the keyboard
button
Figure 26. The Debug Support Unit window
In Figure 26 the registers are displayed on the left and their values on the right.
A register highlighted in blue indicates it is the currently selected register.
Each time the program stops, the Debug Support Unit window automatically updates the
register contents in the display. Registers that have changed since the last stop are
highlighted in black.
7.17.1
Editing a DSU register
To edit a register:
Note:
1.
Click on the register with the left mouse button to select it.
2.
Type in the new value.
3.
Press Return on the keyboard.
Currently only hex numbers can be entered.
It is also possible to edit single bits of the selected register using the same editing method.
Press the Escape key on the keyboard to cancel an edit.
82/246
8063762 Rev 9
ST200
8
ST200 simulator
ST200 simulator
The ST200 simulator has three modes of simulation of the ST200 CPU cores. They reflect
the trade off in simulation accuracy against simulation speed.
Reference (or cycle accurate) mode
This mode executes code in a similar manner to the hardware, that is, it behaves as
expected in all exceptional circumstances. This includes the modelling of all types of bus
errors, interrupts, debug interrupts and exceptions. As a result, it has the lowest
performance of the three modes.
The following are modelled faithfully.
●
the pipeline and the caches, by default, are configured to be at the highest level of
detail
●
the memory subsystem/bus (including the write buffer and prefetch buffer)
●
the translation unit (memory management unit)
ISS (or instruction set accurate) mode
Each instruction runs to completion before the next instruction begins. It models the caches
(basic versions) and the translation units. It behaves in a manner similar to the hardware.
This mode does not model:
●
pipeline
●
latencies
●
interlocking
Fast (functional) mode
This mode models only the minimal set of components required to run correct code
‘correctly’. This mode has the highest performance, but the lowest accuracy. This mode
does not model:
●
memory subsystem
●
caches
●
protection units
●
bus errors
●
external interrupts
●
device plugin functionality
8063762 Rev 9
83/246
ST200 simulator
8.1
ST200
Simulator pack
The simulator pack (st200sp) configuration procedure for st200xrun and st200gdb is the
entry point for all the configurations of the ST200 simulator.
The simulator uses the TargetString to identify the simulator configuration name. The
associated GDB command file implements the simulator configuration name and passes the
configuration options at start time to the ST200 simulator.
For example, to run the program hello.out on the ST200 simulator built for the default
ST231 simulator in little endian with the command:
$> st200cc -mcore=st231 -msoc=default -mboard=default -EL -o
hello.out hello.c
use st200xrun with the following command line:
$> st200xrun -c st200sp -t st231simle -e hello.out
The command st200sp hooks the simulator pack to st200xrun and the TargetString
st231simle identifies the ST231 default simulator configuration in little endian mode.
8.1.1
Customized simulator targets
From R6.0 of the ST200 toolset, all supported boards have a board definition for the
simulator. The customization uses the same memory layout as the real hardware, and
configures the PLL clock registers to the same values found on the boards. Applications that
are compiled for a real board can run on a simulated board without modification.
A GDB command script located in the <ST200TOOLS>/lx-elf32/stdcmd subdirectory
manages the ST200 simulator.
The simulated target is selected by st200gdb and st200xrun using st200sp as the
command and an appropriate procedure name as the target. For example, to run the “hello”
application on a simulated IPBR1100 board (mb424) use the command:
$ st200xrun -c st200sp -t mb424sim -e hello.out
or
$ st200gdb hello.out
(gdb) st200sp mb424sim
To add a specific customization, change the configuration string inside the correct
st200targets-<board>.cmd file.
The following example changes the clock frequency of the core for the IPBR1100 board.
1.
Open the st200targets-mb424.cmd file with the editor.
2.
Locate the correct command, in this case mb424sim.
3.
Locate the configuration string:
CORE_MHZ 300 PERIPHERAL_BASE 0x30000000 EXTERNAL_MEMORY_BASE
0xC0000000 EXTERNAL_MEMORY_SIZE 0x2000000 EXTERNAL_MEMORY_BASE1
0x20f00000 EXTERNAL_MEMORY_SIZE1 0x1FFF EXTERNAL_MEMORY_BASE2
0x7f801000 EXTERNAL_MEMORY_SIZE2 0xc0 BOOT_ROM_BASE 0x7FFFFF00
BOOT_ROM_SIZE 0x10
84/246
8063762 Rev 9
ST200
ST200 simulator
4.
Change the CORE_MHZ value and save the file.
CORE_MHZ 200 PERIPHERAL_BASE 0x30000000 EXTERNAL_MEMORY_BASE
0xC0000000 EXTERNAL_MEMORY_SIZE 0x2000000 EXTERNAL_MEMORY_BASE1
0x20f00000 EXTERNAL_MEMORY_SIZE1 0x1FFF EXTERNAL_MEMORY_BASE2
0x7f801000 EXTERNAL_MEMORY_SIZE2 0xc0 BOOT_ROM_BASE 0x7FFFFF00
BOOT_ROM_SIZE 0x10
8.1.2
Simulated boards naming convention
In the <tools-dir>/lx-elf32/stdcmd subdirectory, any command file starting with the
prefix st200targets- contains the hardware definition of the board (through the target
configuration options) and some standard commands, see Table 15.
Table 15.
Simulator pack
GDB command
8.1.3
Description
<board>sim
The simulated version of the board <board>.
<board>passedsim
The same as <board>sim with the additional capability to get the path
of the simulator dynamic library as argument.
<board>profsim
The same as <board>sim with profiling enabled.
Simulator targets
The st200targets-stsim.cmd command file contains the definitions for some standard
simulator configurations, see Table 16.
Table 16.
Simulator targets
GDB command
Description
st2XYsimle
The simulated st2XY board in little endian mode.
st2XYfastsimle
The same as st2XYsimle with the target option MODE = FAST.
st2XYpassedsimle
The same as st2XYsimle with the capability to get the path of the
simulator dynamic library as an argument.
st2XYprofsimle
The same as st2XYsimle with profiling enabled.
st2XYsimbe
The simulated st2XY board in big endian mode.
st2XYfastsimbe
The same as st2XYsimbe with the target option MODE = FAST.
st2XYpassedsimbe
The same as st2XYsimbe with the capability to get the path of the
simulator dynamic library as an argument.
st2XYprofsimbe
The same as st2XYsimbe with profiling enabled.
8063762 Rev 9
85/246
ST200 simulator
8.2
ST200
Target configuration options
Table 17 lists the simulator options. To customize the simulator options, use the ST200
toolset simulator target command files in the <tools-dir>/lx-elf32/stdcmd directory
as examples.
Table 17.
Target configuration options
Option
Description
Default value
CONFIG_FILE
<filename>
Read options from the specified CONFIG_FILE (see
DUMP_CONFIG_FILE).
DUMP_CONFIG_FILE
<filename>
Dump all user definable options to the specified file.
MODE [FAST|ISS
|REFERENCE|REF]
The operation mode, the options are FAST, ISS and REFERENCE
(or REF). See Chapter 4: Board target configuration on page 27.
REFERENCE
ICACHE_MODEL
<string>
Valid values are:
NONE
BASIC
DETAILED
For a detailed description, see DCACHE_MODEL.
See Table 18 on
page 90
DCACHE_MODEL
<string>
Although the following explanation refers to DCACHE_MODEL
values, it applies to both data and instruction caches (see
ICACHE_MODEL).
NONE
Cache modelling is not required. In practice this situation is
modelled using a null cache that transmits requests through to a
simple bus model.
BASIC
A more detailed model that takes account of the cost of memory
transactions through user-configurable latencies. When basic
cache models are specified for both instruction and data caches,
they act independently and do not accurately represent situations
where bus transactions would interact. It does not model some
parts of the memory subsystem (for example, the write buffer and
prefetch buffer).
DETAILED
Incorporates a more accurate account of the interaction between
the caches and the bus. In particular, the data cache has an
added write-back buffer. Both caches compete for bus cycles
through the CMC (core memory controller), and the bus itself
models the latency associated with the bus and its attached
devices.
Noncached reads and writes bypass the caching mechanism and
generate requests directly.
The CMC is responsible for arbitrating between reads and writes
from the data cache and reads from the instruction cache. This is
done according to a fixed priority scheme, therefore, data reads
have highest priority and data writes have lowest priority.
See Table 18 on
page 90
CORE_MHZ <number>
Processor clock speed (in MHz).
450
BUS_MHZ <number>
Bus clock speed (in MHz).
166
MEMSYSTEM_
LATENCY <number>
Internal latency of memory subsystem (in processor cycles).
5
86/246
8063762 Rev 9
ST200
ST200 simulator
Table 17.
Target configuration options (continued)
Option
Description
Default value
BUS_LATENCY
<number>
Intrinsic latency of the STBus (in bus cycles).
40
PERIPHERAL_
LATENCY <number>
Memory latency for peripheral register accesses (in bus cycles).
15
BUS_BYTES_PER_
CYCLE <number>
The number of bytes that can be transferred in one bus cycle.
8 bytes
TRANSACTION_
SETUP_CYCLES
<number>
The number of extra processor cycles required for each bus
transaction.
1
BUS_BYTES_PER_
TRANSACTION
<number>
The number of bytes that can be transferred in one bus
transaction.
32
EXTERNAL_MEMORY_
SIZE <number>
Size of external memory (in bytes).(1)
By default, the toolset generates programs that use 0x800000
bytes (8 Mbytes) of memory size. To specify a larger or smaller
memory usage for the program edit the board.ld linker script
and rebuild the program, see Section 4.3.3: Defining a custom
board target and compiling a program on page 35.
0x4000000 for
ST231 and ST240
EXTERNAL_MEMORY_
BASE <number>
Byte address of the base of external memory.(1)
0x8000000
EXTERNAL_MEMORY_
SIZEx <number>
Size of external memory (in bytes).
Where x is 1, 2 or 3.
0x0
EXTERNAL_MEMORY_
BASEx <number>
Byte address of the base of external memory.
Where x is 1, 2 or 3.
0x0
The size (in bytes) of noncacheable memory. Buffers associated
0x4000
NONCACHEABLE_
MEM_SIZE <number> (2) with a number of I/O related system calls are copied into this area. (16 Kbytes)
KERNEL_STACK_
SIZE <number> (2)
Size of the kernel stack (in bytes)
BOOT_FROM_RESET
<bool> (2)
In a real operational context, the processor typically executes
some sort of boot program before starting execution of an
application code. By loading bootcode into external memory and
specifying the reset address (see RESET_ADDRESS) the boot
sequence can be exercised.
false
In the majority of cases, however, it is sufficient to begin executing
code at the application’s start symbol after having placed the
simulator in a state that is equivalent to that achieved by the boot
program. This is the default behavior.
RESET_ADDRESS
<number> (2)
This option is only meaningful when BOOT_FROM_RESET is set to
true.
This is the value of the program counter immediately after reset
and can equivalently be thought of as the entry point to the boot
code.
0
RESET_DELAY_
CYCLES <number>
The number of processor cycles it takes to reset the core.
512
BOOT_ROM_BASE
<number>
Byte address of the base of the boot ROM.
0x0
8063762 Rev 9
0x4000
(16 Kbytes)
87/246
ST200 simulator
Table 17.
ST200
Target configuration options (continued)
Option
Description
Default value
BOOT_ROM_SIZE
<number>
Size of the boot ROM (in bytes).
0x10000
(64 Kbytes)
PERIPHERAL_BASE
<number>
The addresses of registers associated with the timer, interrupt
controller and DSU are defined relative to a peripheral base
address. All ST200 cores have a dedicated control register.
0x1F000000
TRACING_ON <bool>
This determines whether or not the simulator produces a code
execution trace. If set to true, the default operation is to output a
textual trace to stdout. An alternative location can be specified
by setting the OUTPUT_TRACE_FILE configuration item.
false
OUTPUT_TRACE_
FILE "<filename>"
This item only takes effect when TRACING_ON is set to true. It’s
effect is to output the trace to the specified filename. If the string is ""
empty or the file cannot be opened, the trace is output to stdout.
TRACE_START_
CYCLE <number>
Cycle on which to start tracing.
0
TRACE_END_CYCLE
<number>
Cycle on which to end tracing.
0
BUS_TRAFFIC_
TRACING_ON <bool>
Enables a textual trace describing all the traffic on the bus to be
output.
false
BUS_TRAFFIC_
OUTPUT_TRACE_
FILE "<filename>"
This item only takes effect when BUS_TRAFFIC_TRACING_ON is
set to true. It’s effect is to output the trace to the specified
filename. If the string is empty the trace is output to stdout.
""
BUS_TRAFFIC_
TRACE_START_
CYCLE <number>
Cycle on which to start tracing the bus traffic.
0
BUS_TRAFFIC_
TRACE_END_CYCLE
<number>
Cycle on which to end tracing the bus traffic.
0
OUTPUT_LOG_FILE
"<filename>"
By default, output from the simulator is recorded in a file in which
the last part of the filename is an incrementing integer (for
example, 0042). The width of this numeric field is determined by
"simlog****"
the form of the filename. For example simlog**** results in a
succession of filenames: simlog0000, simlog0001, and so on.
If the null string ("") is specified, output is to the console.
HAZARD_CHECKING_
ON <bool>
If hazard checking is switched on, the instruction stream is
checked for violation of pipeline latency constraints during
simulation.
This is not guaranteed to detect all static hazards.
false
BUNDLE_CHECKING_
ON <bool>
Setting this item to true enables the simulator’s bundle-checking
mode. This checks that each instruction bundle obeys the rules
specified in the Core and Instruction Set Architecture manuals.
true
BUNDLE_CHECKING_
RE_ON <bool>
Setting this item to true prints an error message to the screen
when the simulator’s bundle-checking mode detects an illegal
bundle.
false
88/246
8063762 Rev 9
ST200
ST200 simulator
Table 17.
Target configuration options (continued)
Option
Description
Default value
PROFILING <bool>
When this is set to true the simulator produces the following
(gprof-style) output files(3):
gmon.out - standard execution profile
false
gmon.outDCACHE - time spent in each function waiting on
Dcache stalls
gmon.outICACHE - time spent in each function waiting on Icache
stalls
PROFILING_
OUTPUT_FILE
"<filename>"
By default, profiler information is recorded in a file in which the last
part of the filename is an incrementing integer (for example,
0042). The width of this numeric field is determined by the form of "gmon****"
the filename. For example gmon**** results in a succession of
filenames: gmon0000, gmon0001, and so on.
DEVICE_PLUGIN_
MODULES
"<filename>"
[;"<filename>"]
Device plugins are used to simulate memory mapped devices on
the STBus
Multiple plugins can be specified by separating their names with a
semicolon (;).
For example:
st200xrun -c st200sp -t st231simle
-C "DEVICE_PLUGIN_MODULES
c:\plugins\dev1.dll;c:\plugins\dev2.dll"
--prog.exe
If an external SDI device also has memory-mapped registers, it
can be modelled by a single plugin. This plugin supports both SDI ""
and device plugin interfaces and is specified against both the
SDI_PLUGIN_MODULE and DEVICE_PLUGIN_MODULES
configuration items.
The sample device plugin is described in Section 8.3 on page 90.
The source of a sample device plugin can be found in the standard
release under <tools-dir>/host/st200sim/
src/Plugins/SampleDevice.
Device plugins which simulate existing target boards are
described Section 8.3.2: Building and running the plugin on
page 91.
DSU_DEFAULT_
MODULE_ENABLED
<bool>
By default, the debug support handler code is compiled into the
simulator. This option ensures that this code is loaded into
memory at the beginning of a simulation.
true
DSU_ROM_IMAGE
"<filename>"
Allows the user to specify their own debug support code module,
thus overriding the default one.
""
STIMULATION_FILE
"<filename>"
Path of pin stimulation data file.
""
EXTERNAL_MEMORY_
PATTERN <number>
If set, this option initializes the whole of memory to the 4-byte
pattern specified.
0xBADDBABE
CLEAR_MEMORY <bool>
If set to 1 (and EXTERNAL_MEMORY_PATTERN is set to zero) then
true
memory is cleared.
1. If required, to model additional blocks of memory, use EXTERNAL_MEMORY_SIZE and EXTERNAL_MEMORY_BASE.
2. The st200xrun and st200gdb tools are insensitive to these options. These options are only meaningful for co simulation
environments.
8063762 Rev 9
89/246
ST200 simulator
ST200
3. The gmon format employs 16-bit numbers to represent time intervals. Because this gives insufficient dynamic range for
typical simulations, time values have had to be scaled. As a result, the column headers produced by gprof (specifying the
underlying unit of time) are incorrect. We recommend that analysis of execution profiles is restricted to consideration of
relative times, see the gprof documentation for information on the interpretation of the output files.
Table 18 lists the default values for the architecture dependent options.
Table 18.
Architecture-specific target options (cache models)
Default value
Target option
MODE FAST
MODE ISS
MODE REFERENCE/REF
ICACHE_MODEL
See (1)
ICACHE_MODEL_BASIC
ICACHE_MODEL_DETAILED
DCACHE_MODEL
(1)
DCACHE_MODEL_BASIC
DCACHE_MODEL_DETAILED
See
1. The FAST mode of simulation does not model the caches but accesses the memory directly. If the
configuration is dumped to file, the cache model options correspond to those used in reference mode.
8.3
The sample device plugin for the ST200 simulator
The source of the sample device plugin is in the standard release
<tools-dir>/host/st200sim/src/Plugins/SampleDevice subdirectory. The
simulator uses the following functions to communicate with the device plugin. The functions
are defined in the SampleDevice.h header file.
DevInitialise
DEVICE_API void DevInitialise(
void *pinout,
void *pinoutStruct,
char *args)
To enable the plugin to initialize any state it holds, this function is called at startup. The
CPinout reference (pinout) should be stored so that the other API functions can use it
later, see Section 8.3.1: Callbacks into the simulator.
DevTerminate
DEVICE_API void DevTerminate()
This function is called at shutdown so that the plugin can release any resources held.
DevClock
DEVICE_API void DevClock()
This function is called once per core clock-cycle to enable the plugin to account for time.
DevRead
DEVICE_API
unsigned
unsigned
unsigned
bool DevRead(
char *to,
int address,
int numBytes)
This function is called whenever a read is requested on the STBus. The plugin returns true
if a read at the given address is handled. It returns false if it does not map the address. If
90/246
8063762 Rev 9
ST200
ST200 simulator
the plugin decides to handle the request, it completes the to array with numBytes of data.
Ensure that the data uses the endianness of the ST200 being modelled.
DevWrite
DEVICE_API bool DevWrite(
const unsigned char *from,
unsigned int address,
unsigned int numBytes,
const char* byteEnables)
This function is called whenever a write is requested on the STBus. The plugin returns true
if a write at the given address is handled. It returns false if it does not map the address. If
the plugin handles the request, it reads numBytes of data from the from array and deals
with it appropriately. If byteEnables is not NULL, then it specifies which of the numBytes
are valid. Ensure that the data uses the endianness of the ST200 being modelled.
8.3.1
Callbacks into the simulator
The plugin can make use of the CPinout object (in a C++ environment) or the SPinout (in
a C environment) object passed into the DevInitialise() function. These enable the
plugin to have access to the internals of the core. Examples of how to use this functionality
are in the SampleDevice code. Details of CPinout and SPinout are in Pinout.h and
PinoutC.h respectively.
8.3.2
Building and running the plugin
The sample plugin shows how to use some of the functions defined in the
SampleDevice.h header file.
To build the sample:
On Windows:
Note:
The Windows version requires the Microsoft development environment for Windows.
On Linux:
Note:
nmake CONFIG=ReleaseLE -f MakefilePC.mak
make CONFIG=ReleaseLE -f MakefileLinux.mak
The Linux version requires the GNU development environment for the host platform.
To build a big-endian version, substitute LE with BE, this builds the .dll (or .so) in the
ReleaseLE directory.
To instruct the simulator to use a specific device plugin, specify a configuration item to the
simulator in the usual way (either on the command line or in a configuration file). To
customize the sample plugin, use the ST231-EVAL board (STi5300) plugin sources
provided with the toolset as a starting point.
8063762 Rev 9
91/246
OS21 source guide
9
ST200
OS21 source guide
Within the terms and conditions of the OS21 Software License Agreement, you may freely
rebuild OS21 for your own purposes. A copy of the license agreement is available from the
licence.htm file in the doc subdirectory of the release installation directory.
The toolset release includes the source code for OS21, located in the subdirectory
src/os21 of the release installation directory. To build OS21 and its board support
libraries, use the makefile (GNU make compatible) in this directory. This top level
makefile has three build rules.
build
Build all of OS21 and its board support libraries (the default rule).
buildbsp
Build just the OS21 board support libraries.
clean
Remove all built files (object files and libraries).
The resulting libraries are placed in the directory src/os21/lib/.
The OS21 source enables you to:
●
refer to the OS21 source for a clearer understanding of OS21’s behavior
●
refer to the OS21 source to aid debugging
●
rebuild OS21 with different compiler options
●
enable configurable options within OS21 that are not enabled in the shipped binaries
●
build your own board support libraries
Note:
To build OS21, GNU make and Perl (version 5.6.1) must be available on your system.
9.1
Configurable options
OS21 supports a number of configurable options. These options are selectively enabled at
build time by defining preprocessor symbols. Table 19 lists the preprocessor symbols that
are available for configuring OS21 for the ST200.
Table 19.
OS21 configurable options
Symbol name
Description
CONF_DEBUG
Enable debug checking within the OS21 kernel.
CONF_DEBUG_ALLOC
Enable additional debug checking for memory allocators.
CONF_DEBUG_CHECK_EVT
Perform extra validation checks on events.
CONF_DEBUG_CHECK_MTX
Perform extra validation checks on mutexes.
CONF_DEBUG_CHECK_SEM
Perform extra validation checks on semaphores.
CONF_DISPLAY_CLOCK_FREQS OS21 reports certain ST200 clock settings on kernel boot.
92/246
CONF_FINE_GRAIN_CLOCK
Program the system clock to operate at as high a frequency as
possible, hence yielding greater accuracy.
CONF_FPU_SINGLE_BANK
Restrict FPU save and restore to the bank of FPU registers used
by GCC.
8063762 Rev 9
ST200
OS21 source guide
Table 19.
OS21 configurable options (continued)
Symbol name
Description
CONF_INLINE_FUNCTIONS
Inline certain functions.
CONF_NO_FPU_SUPPORT
OS21 does not save/restore FPU registers on context switch.
Note:
To alter the options listed in Table 19, edit the file makeST200.inc (located in the at the
top level of the OS21 source code directory). By default, none of the configuration options
are enabled in this file.
9.1.1
Configurable options in the standard OS21 libraries
The standard OS21 libraries (selected by st200cc -mruntime=os21) are built with
CONF_NO_WRITE_LATENCY_WORKAROUND defined. The debug OS21 libraries (selected
during build with -mruntime=os21_d) are built with CONF_DEBUG defined.
CONF_DEBUG
To produce a debug OS21 kernel, define the CONF_DEBUG preprocessor symbol. This
kernel contains many self checks to ensure internal integrity and to check that user calls into
the kernel are correct.
CONF_DEBUG_ALLOC
To produce an OS21 kernel with special checks added to the memory management code
(including the detection of heap scribbles and the freeing of bad pointers), define the
CONF_DEBUG_ALLOC preprocessor symbol.
CONF_DEBUG_CHECK_SEM, CONF_DEBUG_CHECK_MTX and
CONF_DEBUG_CHECK_EVT
To produce an OS21 with extra integrity checks enabled for semaphores, mutexes and
event flags respectively, define these preprocessor symbols. Every time one of these
objects is referenced, OS21 performs extra checks to ensure that its structure is not corrupt
and that it has not been previously deleted.
CONF_DISPLAY_CLOCK_FREQS
To produce an OS21 kernel that reports certain key ST200 clock frequencies when the
kernel is initialized, define the CONF_DISPLAY_CLOCK_FREQS preprocessor symbol.
CONF_INLINE_FUNCTIONS
To produce an OS21 with inlined list manipulation functions, define the
CONF_INLINE_FUNCTIONS preprocessor symbol. This can yield a slight performance
improvement.
8063762 Rev 9
93/246
OS21 source guide
9.2
ST200
Building the OS21 board support libraries
Instructions on building the OS21 board support libraries are in the src/os21/README
file, which can also be used on Linux also as a shell script.
Note:
Building the OS21 board support libraries overwrites the original libraries. To restore the
original libraries, perform a new installation of the ST200 toolset.
9.2.1
Adding support for new boards
To add OS21 board support to a custom target board, refer to Chapter 4: Board target
configuration on page 27 and follow the src/os21/README guidelines for the OS21
specific information.
When a new board support has been set up (for example mbXYZ_cpu1, with core type
st231 and SoC named stxABCD), the compiler driver selects the OS21 support for the
board:
st200cc -mcore=st231 -msoc=stxABCD -mboard=mbXYZ_cpu1 -mruntime=os21 -o hello.out
hello.c
9.3
GDB OS21 awareness support
The shtdi GDB target provides OS21 task-aware debugging. The shtdi GDB target installs
a service that runs on the host and has knowledge of the data structures used in OS21. A
dependency exists between the version of OS21 in use and the version of the shtdi service.
OS21 has static data tables that expose the layout of certain critical data structures to the
shtdi service. Each data table has a cyclic redundancy check (CRC) calculated for it that is
stored statically. These data tables are auto-generated as part of the OS21 build process. At
the same time, a header file is auto-generated and imported into the build of the shtdi
service. This header file contains the same CRC values and some key type definitions.
The data tables are offset/size pairs that identify particular fields within OS21 data
structures. The tables are indexed by enumerated types, which are the types imported by
the shtdi service. There is one data table per OS21 data structure type that the shtdi
service has to be aware.
The CRC value for each table is calculated using the field nam. The order of the fields
relative to each other is important because it is a CRC. If a field changes name between
releases or fields alter position within a data structure (relative to each other), then the CRC
for the data table also changes.
When the shtdi service examines a target system to determine if it can debug it in OS21
aware mode, it examines the data table CRCs in memory and checks to see if they match
the ones it was built with. If they do, then OS21 awareness is enabled and the shtdi service
uses the in-memory data tables to determine how to parse the OS21 data structures. If the
CRCs do not match, then the shtdi service and OS21 were not built from the same source
base and the shtdi service cannot operate in OS21 aware mode.
Note:
94/246
When modifying OS21, changing the relative order of certain fields in key data structures, or
renaming them, can render the shtdi service unable to debug the resulting OS21
executables with task awareness.
8063762 Rev 9
ST200
9.3.1
OS21 source guide
Generation of the shtdi server data tables
The following Perl script (invoked automatically as part of the build process) performs the
generation of the shtdi server data:
src/os21/scripts/mkgdb.pl
Key OS21 header files are scanned for special mark-ups that identify which structures (and
the fields in those structures) are exposed to the shtdi server. The mark-ups are very
simple and invisible to the C compiler.
GDB_STRUCT(struct)
Declares this structure as containing information required by the shtdi server. This
declaration triggers the generation of the following data objects:
–
a size_t, with the size of the structure, given the name struct_size,
–
an array of offset and size descriptors, given the name struct_descs,
–
a size_t, with the value of the number of elements in the above array, given the
name struct_descs_size,
–
an unsigned int with the value of the calculated CRC for the above array,
given the name struct_descs_crc.
GDB_FIELD(enum_prefix, field)
Declares that a field in the current structure is to be exposed to the shtdi server. An
enum called enum_prefix_field is generated and stored in the export header file to
correspond to this fields index in the array of descriptors.
GDB_ARRAY_FIELD(enum_prefix, field, field_index, enum_suffix)
Declares that a particular field in the structure array is to be exposed to the shtdi
server. An enum called enum_prefix_field_enum_suffix is generated and
stored in the export header file to correspond to this field’s index in the array of
descriptors.
GDB_BEGIN_EXPORT, GDB_END_EXPORT
These two markers are used to identify a section of header file which is to be copied
verbatim into the export header file.
8063762 Rev 9
95/246
Booting OS21 from Flash ROM
10
ST200
Booting OS21 from Flash ROM
Examples of booting from Flash ROM are located in the examples/os21 subdirectory of
the release installation directory. Full details are in the readme.txt files in these
directories. Table 20 lists some examples.
Table 20.
10.1
Examples of booting from Flash ROM
Example name
Description
rombootram
Before running, the ROM bootstrap copies the application to RAM.
rombootrom
The application runs directly from Flash ROM.
Overview of booting from Flash ROM
The ST200 Micro Toolset supports both single CPU and multicore CPU chips where each
CPU boots from the same Flash ROM.
Note:
This section does not consider chips that have ST200 cores where the host processor is an
ST40 core, because the ST40 Micro Toolset supports the ROM booting.
The STi5300 has a single ST231 core and boots from offset 0x7FFFFFFFF in Flash ROM.
The OS21 examples in the ST200 Micro Toolset that use Flash ROM, provide tools for
laying out the Flash ROM in the same way for most chips. The layout used by the tools in
the examples supports:
●
boot vectors for up to eight CPUs at 0x40 byte offsets from the base of the Flash ROM
●
bootstrap information for up to eight CPUs
●
an optional fail-safe application that runs before the main applications to check the
integrity of the Flash ROM and report/fix any problems
●
a main application image directory
●
main application image-control structures for images in the directory that point to the
real code/data sections located throughout the rest of the Flash ROM
More detail on the Flash ROM layout are in the comments near the start of the flasher.c
or mkbinrom.pl files in the examples that use Flash ROM.
The flasher Flash ROM programming tool included in the examples can place applications
in Flash ROM. The flasher tool can either take component image files (for example, for
bootvectors, bootstraps or applications) or a complete Flash ROM image file that can be
created by the mkbinrom.pl tool, as its input.
To create a self-flashing executable tool that programs the Flash ROM from the embedded
image, the flasher tool can be combined with a Flash ROM image created by the
mkbinrom.pl tool.
Note:
All Flash ROM examples create a self-flashing executable tool.
The flasher tool has a companion tool called flashdir that displays the contents of Flash
ROM.
The mkimage.pl Perl script converts target executable files into the component image file
format. It can process ST40 and ST200 ELF files (executable files and relocatable libraries),
as well as ST20 hex and S-record ROM format files. Executable files and relocatable
96/246
8063762 Rev 9
ST200
Booting OS21 from Flash ROM
libraries are decomposed into a number of sections that are placed in the component image
file.
To update the existing contents of Flash ROM, use the flasher tool with component image
files. Any component image file placed in Flash results in an update to the Flash directory
pages. Multiple application images can be stored in Flash. Each image is tagged in the
Flash directory with its relevant CPU. A CPU can have multiple application images stored in
Flash, but only one is tagged as the boot application for that CPU.
The mkbinrom.pl Perl script creates a complete binary ROM image in a single file. It takes
component image files as input as well as executable and relocatable library ELF files
directly (mkimage.pl is called automatically to convert them into component image files).
Use the flasher tool to program the complete binary ROM image to Flash ROM.
You cannot update complete ROM images, you must create a new image from all
constituent ELF files and/or component image files.
The examples provide sample boot vector and bootstrap code for the ST200 that locates
and starts the ST200 application in the Flash ROM. The following list shows the flow of
execution on booting.
1.
The host processor boot vector code runs, jumping to its bootstrap code.
2.
The host core bootstrap code:
–
configures the clocks, EMI and LMI interfaces
–
locates the ST200 boot application (or a fail-safe application if there is one
present)
–
moves any sections to RAM which require moving
–
zeros any sections in RAM which require zeroing
–
transfers control to the ST200 fail-safe or main application
8063762 Rev 9
97/246
OS21 Trace
11
ST200
OS21 Trace
The ST200 Micro Toolset supports tracing of the OS21 kernel activity and APIs and also
user defined APIs and activities. To trace the OS21 kernel activity and APIs, an application
is linked with instrumented versions of the supplied libraries; this instrumentation writes
events to a memory buffer allocated on the target.
To assist with tracing the user’s application and any user-supplied libraries, the ST200
Micro Toolset provides the tools os21usertrace and os21usertracegen.
The tool os21usertrace accepts a user-supplied definition file, specifying the APIs and
events to be traced, and then generates all the output files required to build a version of the
application that is instrumented for tracing. The user events are written to the same memory
buffer as the OS21 events. See Section 11.1.1: os21usertrace host tool on page 99.
The tool os21usertracegen accepts an ELF object or executable file and a list of function
names and generates a definition file that can be used by os21usertrace. See
Section 11.1.3: os21usertracegen host tool on page 103.
The trace data is extracted by dumping the trace memory buffer to a file on the host. This file
is then decoded using the os21decodetrace tool. See Section 11.5: Analyzing the results
on page 109.
Support and visualization of OS21 Trace is provided in STWorkbench. For more
information, search for OS21 System Activity in the STWorkbench help system.
In addition, the user may control OS21 Trace using GDB commands (see Section 11.9:
GDB commands on page 117 and Section 11.10: User GDB control commands on
page 123) and by embedding function calls in the application to enable and disable tracing
for specific parts of the application (see Section 11.11: Trace library API on page 126 and
Section 11.13: User trace runtime APIs on page 139).
11.1
User trace records
User APIs and user defined events are organized into a three tier hierarchy: group, class,
and name. For any application, there can be one or more groups, each of which contain one
or more classes, and each class can contain one of more names. name is either the name
of an API that is to be traced, or a reference to a specific event to be traced. The group and
class levels are customizable, and should be chosen to reflect the way in which tracing may
be applied.
Tracing can be controlled at any of the three levels. For instance, all the APIs and events
belonging to a group can be traced as a single entity, or particular classes within a group
can be traced individually. The user can control tracing at runtime, either through
customized GDB commands (see Section 11.10: User GDB control commands on
page 123) or by using APIs linked with the application (see Section 11.13: User trace
runtime APIs on page 139).
98/246
8063762 Rev 9
ST200
11.1.1
OS21 Trace
os21usertrace host tool
The ST200 Micro Toolset provides the os21usertrace tool to help with instrumenting a user
application for tracing with OS21 Trace. os21usertrace accepts one or more definition files
created by the user, and from these it generates a set of output files. These output files
consist of:
●
a single GDB command script that defines the control commands for STWorkbench
and GDB (see Section 11.10: User GDB control commands on page 123)
●
a single C source and header file containing the implementation of the instrumented
user APIs, custom activity APIs and control APIs to be compiled and linked into the
application
●
a single linker script file containing the linker options for wrapping the user APIs
●
a single control file describing the user APIs and activities being traced, for use by the
os21decodetrace tool
The structure of the definition files is described in Section 11.1.2: User definition file on
page 100.
The command line for os21usertrace is:
os21usertrace {option} {definition-file}
The command line options are described in Table 21. There is a long form and short form
alternative for each option.
Table 21.
os21usertrace command line options
Option
Description
--help
Display help.
-h
--decode-script file
Create the os21decodetrace control file (passed to the
-user option of os21decodetrace).
-d file
--gdb-script file
Create the GDB command script file.
-g file
--link-script file
Create the linker script file.
-l file
--wrap-source file
Create the C source file.
-s file
--user-prefix name
User control name space prefix. Default is user.
-up name
--user-code-base code
User activity and API trace code base. Default is 0.
-ucb code
--user-code-script
FUNCTION@FUNCTION@FILE
This option is reserved for STMicroelectronics use only.
-ucs FUNCTION@FUNCTION@FILE
8063762 Rev 9
99/246
OS21 Trace
Note:
ST200
The --wrap-source option creates both a C source file and its corresponding header
file. The header file has the same name as the source file but with the .c extension
replaced with .h.
The following example accepts a definition file called myapp.def, and generates an
os21decodetrace control file called myapp.in, a GDB command script called myapp.cmd,
a linker script called myapp-wrap.ld, and a C source file called myapp-wrap.c. Although
the file is not explicitly named on the command line, using the -s option also creates a
header file for myapp-wrap.c called myapp-wrap.h.
os21usertrace -d myapp.in -g myapp.cmd -l myapp-wrap.ld -s myapp-wrap.c myapp.def
11.1.2
User definition file
os21usertrace takes as its input one or more definition files. This file contains details of the
user APIs to be traced by OS21 Trace, and the specifications for the custom activity APIs to
be created for use by the user application.
The tool os21usertracegen can generate a suitable definition file from an ELF object or
executable file and a list of function names. See Section 11.1.3: os21usertracegen host tool
on page 103 for more information.
The structure of a definition file, in modified Backus-Naur Form, is as follows:
format ::= spec-list
spec-list ::= spec
| spec-list spec
spec ::= USER-INCLUDE header-spec
| USER-API group-class-name type-spec-list
| USER-ACTIVITY group-class-name type-spec-list
| # comment
header-spec ::= filename
| <filename>
| "filename"
type-spec-list ::= type-spec
| type-spec-list type-spec
type-spec ::= { type @ format }
| { type }
group-class-name ::= identifier @ identifier @ identifier
where:
100/246
●
filename is the name of a header file
●
identifier is a C identifier
●
type is a C type specification, which is either a C basic type (such as unsigned int)
or a typedef defined in an included header file
●
format is the format specification for type, and is one of the format codes listed in
Table 22 on page 102
●
comment is a comment
●
all text in bold is literal and are not part of the modified BNF syntax
●
the { and } symbols are literal and not part of the modified BNF syntax
8063762 Rev 9
ST200
OS21 Trace
In addition:
●
a spec definition is terminated by the end of a line (and so cannot be split across
multiple lines)
●
group-class-name describes the hierarchy of the API or activity, and always
consists of three components, group, class and name. The group and class
components are reflected in the GDB control commands (see Section 11.10: User
GDB control commands on page 123) and runtime control APIs (see Section 11.13:
User trace runtime APIs on page 139). The final component, name is either the name
of the user function being traced, or is a name used to derive the name of a custom
activity API (see Section 11.13.1: User activity control APIs on page 139).
A typical example of a group-class-name specification is libc@heap@_malloc_r,
which names the _malloc_r API from the class heap in the group libc.
●
USER-INCLUDE specifies the name of the include file which defines a type referenced
by a type-spec.
The os21usertrace tool preserves the style of the header-spec used in a
USER-INCLUDE definition when generating the C source file except when the form
filename is used, which is transformed into the <filename> style of header-spec.
●
USER-API specifies the API within the application to be traced, and consists of two
parts. The group-class-name provides the name of the API, and the
type-spec-list specifies the prototype for the API.
The order of elements in the type-spec-list is important. The return type for the
API is the first type-spec specified in the type-spec-list. The types of the
parameters of the API are specified by the second and subsequent elements in the
type-spec-list. For example:
USER-API libc@heap@_malloc_r {void*@p} {struct _reent*@p} {size_t*@d}
indicates that the _malloc_r() API returns an object pointer of type void, and
accepts two parameters, the first being a pointer to a _reent structure and the second
being a size_t.
If the return type is void, or if the API takes no parameters, use the form of
type-spec with no format, that is: {type}. For example:
USER-API libc@heap@_free_r {void} {struct_reent*@p} {void*@p}
●
USER-ACTIVITY specifies the name of the custom activity API to be created by the
os21usertrace tool. The specification of type-spec-list is the same as for
USER-API, except that it only specifies the type of each parameter for the API as the
return type is always void.
●
if type specifies an explicit function pointer type (that is, type is not a typedef), then
a %s placeholder for the parameter name must be inserted into the type definition. This
is to aid os21usertrace in the generation of the C source file. For example, if the
parameter type is int (*)(void), then the type specification must be int
(*%s)(void).
8063762 Rev 9
101/246
OS21 Trace
ST200
Table 22 lists the available format codes used by type-spec:
Table 22.
Format codes
Code
Description
b
8-bit word
B
pointer to 8-bit word(1)
w
16-bit word
W
pointer to 16-bit word(1)
d
32-bit word
D
pointer to 32-bit word(1)
q
64-bit word
Q
pointer to 64 bit word(1)
s
string(2)
p
object pointer
P
function pointer
T
OS21 task_t pointer
1. If a NULL pointer is used with these format codes, the de-referenced value is assumed to be zero.
2. If a NULL pointer is used with a string, an empty string is assumed.
The following restrictions apply.
●
Strings are truncated to 255 characters.
●
APIs with variable argument lists are not supported. If possible, convert the API into an
equivalent form that takes a va_list parameter, and define this in the definition file.
For example, replace int TRACE_Print(const char *format, ...) with the
following:
int TRACE_VPrint(const char *format, va_list args)
{
...
}
int TRACE_Print(const char *format, ...)
{
int result;
va_list args;
va_start(args, format);
result = TRACE_VPrint(format, args);
va_end(args);
return result;
}
Next, define TRACE_VPrint in the definition file as follows:
USER-API STAPI@TRACE@TRACE_VPrint {int@d} {const char*@s} {va_list@p}
102/246
8063762 Rev 9
ST200
OS21 Trace
●
Non-scalar argument and return types are not supported. If possible, convert the API
into an equivalent form taking a reference to the type and define this in the definition
file.
●
Avoid defining USER-ACTIVITY APIs with parameters with a type that is a derived
type (that is, a typedef), unless it can be guaranteed that the derived type is declared
when the header file (created by the --wrap-source option) is included.
Note:
The format codes are used by OS21 Trace to decide how to decode and store the return
value and arguments of the user and custom activity APIs.
11.1.3
os21usertracegen host tool
The ST200 Micro Toolset provides the os21usertracegen tool to generate a definition file
for input to the os21usertrace tool. See Section 11.1.2: User definition file on page 100 for
details of the definition file format.
os21usertracegen accepts as input an ELF object or executable file (but not a library
archive file) and uses the DWARF debug information(a) contained within to generate the
definitions required by os21usertrace.
The command line for os21usertracegen is:
os21usertracegen --input | -i file {option | function-name}
where file is an ELF format file and function-name is the name of a global function.
The default is to generate a definition file for all global functions defined by the DWARF
debug information in the ELF format file specified by the --input option. The set of global
functions contributing to the definitions file can be customized by using command line
options to only include functions satisfying a specified criteria.
The command line options are described in Table 23. There is a long form and short form
alternative for each option.
Note:
The position of some options within the command line is significant. Also some options can
be specified multiple times.
Table 23.
os21usertracegen command line options
Option
Description
General options
--input file
-i file
--warn
-w
Name of the ELF format object or executable input file
containing the DWARF debug information.
Enable warnings. If specified then os21usertracegen issues
a warning for each function definition that specifies an
unsupported parameter or return type.
--help
Display help.
-h
a. st200cc creates an ELF format file with DWARF debug information when the -g compilation option is
specified.
8063762 Rev 9
103/246
OS21 Trace
ST200
Table 23.
os21usertracegen command line options (continued)
Option
Description
Output format options
--decl
-b
--tag
-t
--deref
-n
--string
-s
Output definitions using their declared types. The default is to
use compatible base types, this avoids the need to specify C
include files (see --include) declaring the types (required
when compiling the os21usertrace generated source).
Output definitions using C struct or enum tags as their base
types. The default is to use compatible types, void* instead
of struct* and int instead of enum; this avoids the need to
specify C include files (see --include) declaring the types
(required when compiling the os21usertrace generated
source).
Output definitions with format codes to de-reference pointer
types. The default is not to de-reference pointer types. For
example, with this option the type int* is output with the
format code of D instead of the default format code of p.
Only use this option with functions that are known to
reference valid (that is, initialized) pointers and where a
de-reference does not have side effects
Output definitions with the s format code to decode char*
types as a NUL (\0) terminated strings.
Only use this option with functions that are known to
reference valid (that is, NUL terminated) strings.
Function match options
function-name
--regexp
-x
--noregexp
-X
--file regexp
-f regexp
--dir regexp
-d regexp
104/246
Specifies that only functions that match the name
function-name are to be included in the definitions file. If
no function-name is specified then the default is to match
all function names.
The interpretation of function-name is dictated by which of
the --regexp and --noregexp options are in force (see
below for details).
Specifies that the function names following this option contain
a regular expression. This is the default.
For example, specifying -x t1 will match functions with the
names t1, t10 and test1.
This option can be specified more than once.
Specifies that the function names following this option do not
contain a regular expression.
For example, specifying -X t1 will only match the function
with the name t1.
This option can be specified more than once
Specifies that only functions with a source file name that
matches regexp are included in the definitions file. The
default is to match all source file names.
Specifies that only functions with a compilation directory
name that matches regexp are included in the definitions
file. The default is to match all compilation directories.
8063762 Rev 9
ST200
OS21 Trace
Table 23.
os21usertracegen command line options (continued)
Option
Description
Output grouping options
--output file
-o file
--group name
-g name
--class name
-c name
--include file
-I file
Output the generated definitions to file. The default is to
send the output to the console.
This option resets the --group and --class options to their
default values and clears the set of C include files specified
by the --include option (see below for details).
This option can be specified more than once.
Specify name as the definition group name for the following
function names until the next --group or --output option
or to the end of the command line, whichever is the sooner.
The default is group_default. This option can be specified
more than once in order to define multiple group names.
Specify name as the definition class name for the following
function names until the next --class or --output option
or to the end of the command line, whichever is the sooner.
The default is class_default. This option can be specified
more than once in order to define multiple class names.
Specify the name of a C include file to add to the definitions
file. The set of C include files specified by this option is
cleared by the next --output option.
file can also be specified as "file" or <file>.
This option can be specified more than once.
os21usertracegen output file format
os21usertracegen generates an annotated version of the definition file format (see
Section 11.1.2: User definition file on page 100) where the annotations provide the following
additional information:
●
the version of the os21usertracegen tool
●
the name of the ELF format input file from which the definitions file is derived
●
for each contributing compilation unit: the locations of the compiled source file
(##compile unit annotation) and the compilation directory (##comp_dir
annotation)
●
for each matching function name in the compilation unit: the name of the function
(##function annotation), the function prototype (##decl annotation) and an
equivalent function prototype specified with compatible base types (##base_decl
annotation)
●
if no function definition can be generated (because its specification is not supported by
OS21 Trace) then the reason is included in the ##function annotation
In addition:
●
functions appear in the definitions file in the order that they are defined in the DWARF
debug information, not in the order they are specified on the command line
●
a function definition can only be defined once in the definitions file
8063762 Rev 9
105/246
OS21 Trace
11.1.4
ST200
os21usertracegen example
This section shows an example using an ELF executable file to demonstrate the flexibility of
the os21usertracegen tool.
1.
The first step is to link the application (compiled with DWARF debug information
enabled) to generate an ELF executable file called myapp.out:
st200cc application_link_options -g -o myapp.out
2.
From the ELF executable file created in step 1., match function names that do not start
with DEBUG_write and have been compiled in a directory ending in debug, and
output their definitions to the file myapp-debug-other.def:
os21usertracegen -i myapp.out -o myapp-debug-other.def
-d 'myapp-directory.*debug$'
-g debug -c other '^(?!DEBUG_write)'
where myapp-directory is the directory containing the source code for myapp.
3.
Match function names that start with DEBUG_write and have the same compilation
directory as in step 2., and output their definitions, de-referencing pointer and string
types, to the file myapp-debug-write.def:
os21usertracegen -i myapp.out -o myapp-debug-write.def
-d 'myapp-directory.*debug$' -n -s
-g debug -c write '^DEBUG_write'
4.
Match function names that start with OS_, EVENT_ or TRACE_ that have not been
compiled in a directory ending in debug, and output their definitions, de-referencing
pointer and string types, to the file myapp-deref.def:
os21usertracegen -i myapp.out -o myapp-deref.def
-d 'myapp-directory.*(?<!debug)$' -n -s
-g myapp -c OS '^OS_' -c EVENT '^EVENT_' -c TRACE '^TRACE_'
5.
Match function names that have the same compilation directory as in step 4. but
excluding those that start with OS_, EVENT_ or TRACE_, and output their definitions to
the file myapp-other.def:
os21usertracegen -i myapp.out -o myapp-other.def
-d 'myapp-directory.*(?<!debug)$'
-g myapp -c other '^(?!(OS_|EVENT_|TRACE_))'
6.
Use os21usertrace to process the definition files (generated in steps 2. to 5.), to
create a C source file, called myapp-wrap.c, containing the instrumented functions
(as well as the other companion source files):
os21usertrace -d myapp.in -g myapp.cmd
-l myapp-wrap.ld -s myapp-wrap.c
myapp-debug-other.def
myapp-debug-write.def
myapp-other.def
myapp-deref.def
7.
Next compile the source file generated in step 6.:
st200cc -mruntime=os21 -fno-zero-initialized-in-bss(b) -g -c
myapp-wrap.c
b. See Building on page 114 in Section 11.6.2: User API and user activity trace for further information about the
-fno-zero-initialized-in-bss option.
106/246
8063762 Rev 9
ST200
OS21 Trace
8.
The final step is to re-link the application with trace enabled (see Section 11.3: Building
an application for OS21 Trace for details):
st200cc application-link-options -g -o myapp.out
myapp-wrap.o -trace -trace-api -trace-api-no-time
-Wl,@myapp-wrap.ld
Note:
The use of single quotes (') in the above examples are not required (nor accepted) by the
os21usertracegen tool but are present to illustrate the use of quoting to protect the regular
expressions from being interpreted by a Unix shell. Under Windows, use double quotes (“)
instead of single quotes to protect the regular expressions.
Use of regular expressions
os21usertracegen uses the Perl Compatible Regular Expressions (PCRE) library, which is
more powerful and flexible than many other regular expression libraries. This is an
open-source library (see www.pcre.org for details), with many reference and tutorial
resources available on the Internet.
11.2
Print a string to the OS21 Trace buffer
It is possible to invoke a USER-ACTIVITY function to record that the program has reached
a specified point in its execution. It is also possible to print a string to the OS21 Trace buffer
with the OS21_TRACE_PRINT API. See os21_trace_status on page 135 for more
information.
11.3
Building an application for OS21 Trace
To enable tracing for an application, link it with the appropriate command line options,
-trace or -trace -trace-api.
Note:
Enabling OS21 API tracing also requires OS21 activity tracing to be enabled. Therefore, to
enable OS21 API tracing, the -trace linker command line option must always precede
-trace-api.
Table 24 lists the st200cc linker options required to enable the OS21 Trace features.
8063762 Rev 9
107/246
OS21 Trace
ST200
Table 24.
st200cc linker options to enable OS21 Trace
st200cc options
Description
-trace
Initialize OS21 Trace support.
Install OS21 callbacks to monitor kernel events. (See the
“Callbacks” chapter in the OS21 User Manual for more details.)
This option uses the default ld linker script file, os21trace.ld
located at <toolset_dir>/target/os21.
-trace-api
Use in conjunction with -trace to initialize OS21 API tracing for
all functions in the OS21 API.
When this option is used, all public OS21 functions are wrapped
using the GNU linker --wrap option. The wrapper functions
record the parameters and return values of the OS21 APIs into
the trace buffer.
This option uses the special linker script files os21wrap.ld and
os21wrap.ld-class located at
<toolset_dir>/target/os21.
-trace-api-class
Use in conjunction with -trace to initialize OS21 API tracing for
all functions in the specified class of OS21 API(1). For example:
-trace -trace-api-cache
performs tracing only on the OS21 functions that belong to the
class event.
-trace-api-no-class
Use this option in conjunction with the -trace-api option to
exclude the specified class of API from tracing(1). For example:
-trace -trace-api -trace-api-no-cache
performs tracing on all OS21 functions except those that belong
to the class cache.
-trace-no-constructor
Use this option to disable the automatic initialization of the OS21
Trace buffers.
1. Where class is one of the following: cache, callback, event, exception, interrupt, kernel,
memory, message, mutex, partition, power, profile, scu, semaphore, task, time, or vmem.
11.4
Running the application
By default, an application built for OS21 Trace initially starts with trace logging disabled. To
enable tracing of the OS21 kernel and API from GDB, invoke the following commands:
source os21trace.cmd
enable_os21_activity_global
enable_os21_api_global
Note:
The command script os21trace.cmd automatically creates two breakpoints. One is on the
function that is invoked when the trace buffer is full, and the other is on the function that is
invoked when the task information buffer is full.
To enable tracing for user defined APIs and activities, source the GDB command script that
was generated by the --gdb-script option of os21usertrace. In the following example,
that file is named myapp.cmd. The example also assumes the default prefix of user.
source myapp.cmd
enable_user_activity_global
enable_user_api_global
108/246
8063762 Rev 9
ST200
11.4.1
OS21 Trace
Trace buffer
The default for the trace buffer is to wrap. This means that when this buffer is full, tracing
wraps to the start of the buffer and overwrites the oldest existing events. In this case, the
trace buffer full breakpoint does not occur. When the buffer wraps, time stamping
continues from the previously recorded sample.
Note:
The time recorded also includes time spent when profiling is disabled either as a result of an
I/O request or because the ST200 is under control of GDB.
With tracing enabled and while the target is running, timestamped events are written to the
trace buffer. To access this data, GDB must take control of the target. To do this, either set
a breakpoint and wait for the break to match, or stop the target, either with a Ctrl+C from
within GDB or the Stop button in STWorkbench or Insight.
When GDB has control of the target, extract the trace data by invoking the following GDB
command:
flush_all_trace_buffers
This command extracts data from the task information and trace buffers, writes them to files
on the host and then resets the buffers. The following binary files are created:
os21trace.bin
This file contains the contents of the trace buffer.
os21trace.bin.ticks OS21 time information (time_ticks_per_sec value for the
trace timestamps and the absolute time of the last event saved
in the trace buffer).
os21tasktrace.bin
This file contains the contents of the task information buffer
Section 11.8: Structure of trace binary files on page 115 provides a description of the format
for each of these files.
11.5
Analyzing the results
After the OS21 Trace and the task information buffers have been saved on the host, use the
decoder tool os21decodetrace to convert this data into various output formats for viewing
and analysis.
The command line for os21decodetrace is:
os21decodetrace {option} trace-file
The command line options for os21decodetrace are described in Table 25.
Table 25.
os21decodetrace command line options
Option
Description
-e exe-file
Optional name of target executable file. Required to obtain the
symbolic names of interrupt handlers.
-n task-trace-file
Optional name of the task information data file (for example
os21tasktrace.bin). This file provides the name and other useful
information for each task.
8063762 Rev 9
109/246
OS21 Trace
ST200
Table 25.
os21decodetrace command line options (continued)
Option
110/246
Description
-o output-file
Optional output file name. The default is to output to the console.
Trace data files must be given the extension .osa to enable them to
be opened automatically in STWorkbench. If any other extension is
used, the files must be opened in STWorkbench using the “Open
with...” option.
-os21 file
Optional name of the control file describing the OS21 APIs and
traceable activities. Use this option to override the default definition of
OS21 APIs and traceable activities.
The format of the control file is described in Section 11.5.2 on page
112.
-m mode
Use -m to modify the format selected by the -t option, where mode is
one of the following:
– details shows detailed information for each task and interrupt
context. This includes the number of trace records associated with
each task or interrupt context, and the time spent (in ticks) executing
in the task or interrupt context. Task priority and stack location
information is provided for each task context.
– metrics shows timing metrics for each recorded task and interrupt
context. The metrics include the number of times a task or interrupt
was scheduled or descheduled, and the minimum, maximum and
average times that the task or interrupt context was active or inactive.
– zero includes in the report the tasks and interrupt handlers that
have zero time.
– max is equivalent to specifying -m details -m metrics
-m zero.
– min does not show individual task and interrupt handler information.
– simple uses an alternative time accounting regime that is based
upon the context information recorded with each trace record instead
of context changes reported by the OS21 activity monitors. This
option is most useful when API tracing has been enabled.
– ticks to output timing information in ticks.
– usecs to output timing information in real time at microsecond
resolution. This is the default.
Not all of the modes are applicable to all output formats. See
Section 11.5.1 on page 111 for more information on the usage of this
option.
-t type
Optional output format, where type is one of the following:
– summary to display a summary. This is the default.
– workbench to generate output in a format suitable for
STWorkbench.
– text to display one record per line. The first field is the absolute
time. OS21 API trace records also contain the parameters and return
value of each function.
– csv is similar to text except that the token separator is a comma.
The -t option can be followed by an optional -m option to modify the
format of the output of os21decodetrace.
8063762 Rev 9
ST200
OS21 Trace
Table 25.
os21decodetrace command line options (continued)
Option
11.5.1
Description
-user file
Optional name of the control file describing the user APIs and
traceable activities.
The format of the control file is described in Section 11.5.2 on page
112.
trace-file
Trace data file (for example os21trace.bin).
os21decodetrace assumes that the OS21time information can be
found in the file trace-file.ticks (for example
os21trace.bin.ticks)
Usage of the -m mode option
The various modes of the -m option are intended to be used with specific output formats.
Table 26 shows how the -m modes can be combined with the different output formats.
Table 26.
Permitted combinations of mode and output format
Output format (-t option)
Mode (-m option)
summary
workbench
text
csv
details
Yes
No
No
No
metrics
Yes
Yes
No
No
zero
Yes
No
No
No
max
Yes
No
No
No
min
Yes
No
No
No
simple
Yes
No
No
No
ticks
Yes
Yes
Yes
Yes
usecs
Yes(1)
Yes
Yes
Yes
1. Displays real time in microseconds, milliseconds, seconds, minutes and hours.
Yes indicates that the given mode generates meaningful output when used for the given
output format.
No indicates that the mode cannot be used for the given output format.
If no -t option precedes the -m mode option, os21decodetrace assumes -t summary.
8063762 Rev 9
111/246
OS21 Trace
11.5.2
ST200
os21decodetrace control file
The os21decodetrace options -os21 and -user both require a control file that describes
the APIs and activities being traced. For user-defined APIs and activities, this file is
generated by the --decode-script option of the os21usertrace tool.
The structure of a control file, in modified Backus-Naur Form, is as follows:
file-format ::= spec-list
spec-list ::= spec
| spec-list spec
spec ::= A = code group-class-name parameter-type-spec
| P = code group-class-name return-type-spec
parameter-type-spec
return-type-spec ::= format
| format type-list
parameter-type-spec ::= format
| format type-list
type-list ::= type
| type-list type
where:
112/246
●
code is a number.
●
group-class-name, format and type are strings.
●
A record of type A specifies an activity and a record of type P specifies an API.
●
group-class-name is the same as used in the USER-API and USER-ACTIVITY
specifications, but with all white space removed. See Section 11.1.2 on page 100.
●
format is a concatenation of all the format codes specified for the parameters of an
API or activity. It is zero length for a void return type or an empty parameter list, in
which case a type-list is not present.
●
type is the the same as used in the USER-API and USER-ACTIVITY specifications,
but with all superfluous white space removed. See Section 11.1.2 on page 100.
8063762 Rev 9
ST200
OS21 Trace
11.6
Examples
11.6.1
OS21 activity and OS21 API trace
A simple example is provided in the examples/os21/os21_trace directory of the
toolset. A makefile is available in this location to build/run the application and decode the
resulting OS21 Trace. Data is automatically dumped to the host in a file called
test.tracedump. A README file provides further details about how to launch the test.
The example is driven by the GDB command script (traceexec.cmd). This script enables
OS21 tracing (both activity and API), executes the application and then flushes the trace
buffers onto the default host file before exiting.
The example application is a simple demonstration of OS21 task usage with time slicing
enabled.
11.6.2
User API and user activity trace
This section provides a simple example of using OS21 Trace to trace APIs and some
custom activity events within a user application.
os21usertrace
The first step is to create a definition file for os21usertrace. This specifies each of the user
API functions and user activity events to trace, using the format described in Section 11.1.2:
User definition file on page 100.
Figure 27. Example definition file, myapp.def
USER-INCLUDE stdlib.h
USER-INCLUDE malloc.h
USER-INCLUDE os21.h
USER-API libc@sys@_sbrk_r {void*@p} {struct _reent*@p} {ptrdiff_t@d}
USER-API libc@heap@_malloc_r {void*@p} {struct _reent*@p} {size_t@d}
USER-API libc@heap@_memalign_r {void*@p} {struct _reent*@p} {size_t@d} {size_t@d}
USER-API libc@heap@_calloc_r {void*@p} {struct _reent*@p} {size_t@d} {size_t@d}
USER-API libc@heap@_realloc_r {void*@p} {struct _reent*@p} {void*@p} {size_t@d}
USER-API libc@heap@_free_r {void} {struct _reent*@p} {void*@p}
USER-ACTIVITY test@esr@esr_signal {unsigned int@d}
USER-ACTIVITY test@isr@isr_signal {unsigned int@d}
USER-ACTIVITY test@task@task_signal {unsigned int@d}
USER-API test@esr@esr_api {const char*@s} {size_t@d}
USER-API test@isr@isr_api {const char*@s} {size_t@d}
USER-API test@task@task_api {const char*@s} [task_t*@T}
The example definition file in Figure 27, myapp.def, specifies:
●
several of the C library heap allocation APIs (_sbrk_r, _malloc_r, _memalign_r,
_calloc_r, _realloc_r and _free_r)
●
three custom activity event API definitions (esr_signal, isr_signal and
task_signal)
●
three APIs from the user application (esr_api, isr_api and task_api)
Each are defined using an appropriate group-class-name triplet, and each API has its
return value and parameters defined. Several header files are also required, as these define
the types referenced by the APIs.
8063762 Rev 9
113/246
OS21 Trace
ST200
To generate the source files necessary for building the application, run os21usertrace with
the following command line.
os21usertrace -d myapp.in -g myapp.cmd -l myapp-wrap.ld -s myapp-wrap.c myapp.def
Building
Use st200cc to compile the generated C source file, myapp-wrap.c:
st200cc -mruntime=os21 -fno-zero-initialized-in-bss -g -c myapp-wrap.c
Warning:
The generated C source file must be compiled using the
-fno-zero-initialized-in-bss option to ensure that the
data structures in target memory used by the generated GDB
command scripts are correctly initialized when the
application is loaded onto the target.
The next step performs the final link of the application with the generated linker script:
st200cc -mboard=platform -mruntime=os21 -trace ... myapp-wrap.o -Wl,@myapp-wrap.ld
Execution
Use GDB to load and run the application. The following GDB session uses the ST
TargetPack st200tp command to connect to the platform.
(gdb)
(gdb)
(gdb)
(gdb)
(gdb)
file a.out
st200tp stmc:platform:core
load
break main
continue
Source the command script myapp.cmd in order to use the GDB commands for controlling
tracing:
(gdb) source myapp.cmd
(gdb) enable_user_activity_global
(gdb) enable_user_api_global
When the trace data has been gathered, use flush_all_trace_buffers to flush the
data to file. Finally, use os21decodetrace to decode the trace file.
os21decodetrace -e a.out -user myapp.in -n os21tasktrace.bin os21trace.bin
Note:
114/246
The -user myapp.in option is required so that os21decodetrace can interpret the data
for the user defined APIs and activities.
8063762 Rev 9
ST200
11.7
OS21 Trace
Trace overhead
It should be understood that OS21 Trace is intrusive. The level of intrusiveness depends
upon the choice of linker and runtime options. Therefore, take this into consideration when
analyzing the trace results, as tracing affects the real time behavior of the application.
The following points identify some of the costs to consider when using OS21 Trace.
Note:
●
The default trace buffer requires 2 Mbytes of heap. Use the variable
os21_trace_constructor_size to change the size of the buffer.
●
The default trace buffer constructor can be disabled using the
-trace-no-constructor option. The user can then initialize the trace buffer directly
using os21_trace_initialize().
●
The default task information buffer requires 64 Kbytes of heap. Use the variable
os21_task_trace_constructor_size to change the size of the buffer.
●
The default task information buffer constructor can be disabled using the
-trace-no-constructor option. The user can then initialize the task information
buffer directly using os21_task_trace_initialize().
For more information on the variables and functions named above, see Section 11.11: Trace
library API on page 126.
●
●
●
11.8
For a representative audio and video decode application that contains 4 Mbytes of
code, the approximate increases in code size are as follows:
–
OS21 activity tracing adds 3 Kbytes (0.1% increase)
–
OS21 API tracing adds 17 Kbytes (0.4% increase), including OS21 activity
For the same representative application, the approximate times to fill the default sized
trace buffer (the core is actually 50% idle during the run) are as follows:
–
OS21 activity tracing takes 25 secs
–
OS21 API tracing takes 1.2 secs, including OS21 activity
The profile of code and data cache utilization is perturbed.
Structure of trace binary files
As described in Section 11.4: Running the application on page 108, the command
flush_all_trace_buffers outputs the contents of the trace buffer to three binary files.
This section describes the internal structure of each of these files.
In the format column in Table 27, Table 28 and Table 29:
●
INT8 is an 8-bit unsigned integer
●
INT16 is a 16-bit unsigned integer, little endian format
●
INT32 is a 32-bit unsigned integer, little endian format
●
INT64 is a 64-bit unsigned integer, little endian format
8063762 Rev 9
115/246
OS21 Trace
11.8.1
ST200
os21trace.bin
This file contains the contents of the trace buffer. It is a sequence of records, where each
record has the structure given in Table 27.
Table 27.
File format of os21trace.bin
Field
Format
time-stamp
INT32
Delta from previous trace record
context-code
INT8
See os21_context_e in
os21trace/tracecodes.h
context
INT32
task_t object pointer or interrupt INTEVT code.
trace-type
INT8
See os21_trace_type_e in
os21trace/tracecodes.h
INTn
n is defined by the code-size field in the
os21trace.bin.ticks format (see Table 28).
See os21_activity_e and os21_api_e in
os21trace/tracecodes.h
options
INT32
The following bits are set to indicate which of the
optional fields are included in the record:
0 to 7: number of arguments
8: caller-address field
9: frame-address field
caller-address
INT32
Optional
frame-address
INT32
Optional
arguments
INT32
Optional
trace-code
11.8.2
Comment
os21trace.bin.ticks
This file contains OS21 time information. It consists of the fields described in Table 28.
Table 28.
File format of os21trace.bin.ticks
Field
116/246
Format
Comment
version
INT32
For the current version, this is 0x00000003
code-size
INT32
Size of the trace-code field in the
os21trace.bin format (see Table 27). The valid
sizes are 1, 2 or 4 bytes.
tick-rate
INT64
time_ticks_per_sec()
last-time
INT64
time_now() for most recent trace record
8063762 Rev 9
ST200
11.8.3
OS21 Trace
os21tasktrace.bin
This file contains the contents of the task information buffer. It is a sequence of records,
where each record has the structure given in Table 29.
Table 29.
File format of os21tasktrace.bin
Field
11.9
Format
Comment
handle
INT32
Task task_t object pointer
priority
INT32
Task priority when created
stack-base
INT32
Location of task stack
stack-size
INT32
Size of task stack
task-name
INT8[16]
Task name
GDB commands
This section lists the OS21 Trace GDB commands accessible when the file
os21trace.cmd is sourced within GDB. For more information on a given command, use
the GDB command help command.
11.9.1
Buffer full action
os21_trace_set_mode stop|wrap
os21_task_trace_set_mode stop|wrap
(Default mode is wrap)
(Default mode is stop)
If either mode is set to stop, then a breakpoint is enabled to signal when the buffer is
full. If set to wrap, this breakpoint is disabled.
If the buffer is not operating in wrap mode, the data is logged into the buffer only while
space is available. When the buffer is full, no more logging occurs until the buffer is
emptied and reset.
When the buffer full breakpoint is raised, a GDB script invokes the appropriate
function to flush the buffer and then continues. The function is one of the following:
–
for os21_trace_set_mode, the script calls flush_os21_trace_buffer
–
for os21_task_trace_set_mode, the script calls
flush_os21_task_trace_buffer
This means that the contents of the buffer are automatically extracted when full to
provide a complete log. However, the target is stopped for a comparatively long time
during each download.
11.9.2
Enable OS21 Trace
enable_os21_trace
Enable OS21 Trace logging for both OS21 and user trace events. OS21 Trace logging
is enabled by default.
disable_os21_trace
Disable OS21 Trace logging.
enable_os21_trace
Display the status of OS21 Trace logging.
8063762 Rev 9
117/246
OS21 Trace
11.9.3
ST200
Enable trace control commands
The following GDB commands control the saving of arguments and context information in
the trace records for both OS21 and user trace events.
enable_os21_trace_control control
Enable the saving of the information indicated by control, where control is one of
the following: save_activity, save_api_enter, save_api_exit,
save_activity_args, save_api_enter_args, save_api_exit_args,
save_caller_address or save_frame_address.
disable_os21_trace_control control
Disable the saving of information indicated by control.
show_os21_trace_control control
Shows whether control is enabled or disabled.
enable_os21_trace_control_all
Enable all controls as a single operation.
disable_os21_trace_control_all
Disable all controls as a single operation.
show_os21_trace_control_all
Display the controls that are enabled or disabled.
11.9.4
Enable OS21 activity
enable_os21_activity_global
Enable the logging of OS21 activity types, which is disabled by default.
disable_os21_activity_global
Disable the logging of OS21 activity types.
show_os21_activity_global
Display the logging status of the OS21 activity types.
11.9.5
Enable OS21 API
enable_os21_api_global
Enable the logging of OS21 API types, which is disabled by default.
disable_os21_api_global
Disable the logging of OS21 API types.
show_os21_api_global
Display the logging status of the OS21 API types.
118/246
8063762 Rev 9
ST200
11.9.6
OS21 Trace
Enable OS21 activity event
show_os21_activity_classes
Display the OS21 activity event classes. The supported classes are task, interrupt
and exception.
enable_os21_activity_class_all
Enable the logging of all OS21 activity events in all classes.
disable_os21_activity_class_all
Disable the logging of all OS21 activity events in all classes.
show_os21_activity_class_all
Display the logging status of all OS21 activity events in all classes.
enable_os21_activity_class_class
Enable the logging of the OS21 activity events in the class class, where class is one
of the classes listed by show_os21_activity_classes.
disable_os21_activity_class_class
Disable the logging of the OS21 activity events in the class class.
show_os21_activity_class_class
Display the logging status of the OS21 activity events in the class class.
enable_os21_activity code
Enable the logging of the OS21 activity event specified by code. All events are enabled
by default. The command show_os21_activity_class_all lists all valid code
parameters (see Section 11.9.11: Type and event enables on page 121).
For an event to be logged, both the event code and the type (OS21 activity in this
case) must be enabled. Disabling the type prevents logging of all the events that
belong to that type, although it does not disable them.
disable_os21_activity code
Disable the logging of the OS21 activity event specified by code.
show_os21_activity code
Display the logging status of the OS21 activity event specified by code.
11.9.7
Enable OS21 API function
show_os21_api_classes
Display the OS21 API classes. The supported classes are cache, callback, event,
exception, interrupt, kernel, memory, message, mutex, partition, power,
profile, reset, semaphore, task, time or vmem.
enable_os21_api_class_all
Enable logging of all OS21 APIs in all classes.
disable_os21_api_class_all
Disable logging of all OS21 APIs in all classes.
show_os21_api_class_all
Display logging status of all OS21 APIs in all classes.
8063762 Rev 9
119/246
OS21 Trace
ST200
enable_os21_api_class_class
Enable logging of the OS21 API in the class class, where class is one of classes
reported by show_os21_api_classes.
disable_os21_api_class_class
Disable logging of the OS21 API in the class class.
show_os21_api_class_class
Display the logging status of the OS21 API in the class class.
enable_os21_api code
Enable the logging of the OS21 API specified by code. All APIs are enabled by default.
The command show_os21_api_class_all provides the list of valid code
parameters (see Section 11.9.11: Type and event enables on page 121).
For an event to be logged, both the API code and the type (OS21 API in this case)
must be enabled. Disabling the type prevents logging of all the events that belong to
that type, although it does not disable them.
disable_os21_api code
Disable the logging of the OS21 API specified by code.
show_os21_api code
Display the logging status of the OS21 API specified by code.
11.9.8
Enable task information logging
enable_os21_task_trace
Enable logging of task information. Take care to ensure that logging is enabled when
tasks are created, otherwise os21decodetrace and STWorkbench are not able to
associate task names with trace data. Logging of task information is enabled by
default.
disable_os21_task_trace
Disable logging of task information.
show_os21_task_trace
Display the logging status of task information.
enable_os21_activity_task_trace
Enable logging of task information by OS21 activity events (task_create and
task_switch), this is enabled by default.
disable_os21_activity_task_trace
Disable logging of task information by OS21 activity events.
show_os21_activity_task_trace
Display the status of logging task information by OS21 activity events.
120/246
8063762 Rev 9
ST200
11.9.9
OS21 Trace
Dump buffer to file
dump_os21_trace_buffer file [0|1]
dump_os21_task_trace_buffer file [0|1]
Dump the contents of the buffer to file.
The optional second parameter is the buffer reset argument. If 1 (the default) then the
buffer is cleared, otherwise it is not reset and the trace data remains intact.
Note:
file is created the first time that data is written. Subsequent invocations append data to
the existing file. Take care to always use the same name for the task information buffer
as this holds details of all the tasks created by the application.
A file named file.ticks is also created when dumping the trace buffer.
11.9.10
Flush buffers and reset
flush_os21_trace_buffer
is equivalent to invoking
dump_os21_trace_buffer os21trace.bin
flush_os21_task_trace_buffer
is equivalent to invoking
dump_os21_task_trace_buffer os21tasktrace.bin
flush_all_trace_buffers
is equivalent to invoking
flush_os21_trace_buffer
flush_os21_task_trace_buffer
These functions flush the contents of both the trace and task information buffers to
predefined file names and then reset the buffers. They write data to the files (if any data
is extracted) os21trace.bin, os21trace.bin.ticks and
os21tasktrace.bin.
11.9.11
Type and event enables
To support convenient enabling and disabling of related OS21 events with a single
operation, the events are divided into classes; and classes are divided into types. A trace
event is logged (written into the trace buffer) only if the event itself is enabled as well as its
type.
Two types are supported:
●
OS21 activity
●
OS21 API
For each of these, the following command displays the logging status of the type (see
Section 11.9.4: Enable OS21 activity on page 118 and Section 11.9.5: Enable OS21 API on
page 118):
show_type_global
The following command lists all the classes in a type:
show_type_classes
8063762 Rev 9
121/246
OS21 Trace
ST200
For example:
(gdb) show_os21_activity_classes
exception
general
interrupt
task
The following command displays the logging status of all the events that belong to a class:
show_type_class_class
For example, display the logging status of the OS21 APIs in the time class with the
command:
(gdb) show_os21_api_class_time
time_after = enabled
time_minus = enabled
time_now = enabled
time_plus = enabled
time_ticks_per_sec = enabled
The following command displays the logging status of a specific event:
show_type event
For example, display the status of the OS21 API semaphore_wait event with the
command:
(gdb) show_os21_api semaphore_wait
semaphore_wait = enabled
The following alternative command displays the logging status of all events for a type:
show_type_class_all
Each of the show commands has an enable/disable equivalent, except the
show_type_classes commands. For example:
(gdb) disable_os21_activity task_switch
(gdb) disable_os21_activity_class_interrupt
(gdb) show_os21_activity_class_all
excp_enter = enabled
excp_exit = enabled
excp_install = enabled
excp_uninstall = enabled
general_print = enabled
intr_enter = disabled
intr_exit = disabled
intr_install = disabled
intr_uninstall = disabled
task_create = enabled
task_delete = enabled
task_exit = enabled
task_switch = disabled
122/246
8063762 Rev 9
ST200
11.10
OS21 Trace
User GDB control commands
When used with the --gdb-script command line option, the tool os21usertrace creates
a GDB command script that defines a set of GDB commands for controlling the generation
of user trace records. These commands are used to show the status of tracing, or to enable
or disable tracing for a given group, class or event.
To make these commands available when debugging the application, source the generated
command script (see Section 11.4: Running the application on page 108).
Note:
The element user in the names of the GDB commands listed in the following sections can
be changed with the option --user-prefix of the os21usertrace tool.
11.10.1
User activity control commands
os21usertrace creates the following commands for controlling the generation of trace
records for user activities. Use these commands for enabling or disabling tracing for any
group, class or named activity that was specified in the os21usertrace definition file.
Note:
If no user activities are defined, then none of the following commands are defined.
show_user_activity_groups
Display all the user activity trace groups in the application as a simple list.
enable_user_activity_group_all
disable_user_activity_group_all
Enable or disable the logging of all the activities for all groups.
show_user_activity_group_all
Display the logging status of all the activities for all groups.
show_user_activity_group_group_classes
Display all the classes of the user trace group group, where group is one of the
groups listed by show_user_activity_groups.
enable_user_activity_group_group_class_all
disable_user_activity_group_group_class_all
Enable or disable the logging of all the activities for all classes of the user trace group
group.
show_user_activity_group_group_class_all
Display the logging status of all the activities for all classes of the user trace group
group.
enable_user_activity_group_group_class_class
disable_user_activity_group_group_class_class
Enable or disable the logging of all the activities within the class class of the user
trace group group, where class is one of the classes listed by
show_user_activity_group_group_classes.
show_user_activity_group_group_class_class
Display the logging status of all the activities within the class class of the user trace
group group.
8063762 Rev 9
123/246
OS21 Trace
ST200
enable_user_activity code(c)
disable_user_activity code(c)
Enable or disable the logging of the user activity code. All activities are enabled by
default. The command show_user_activity_group_all lists all the valid code
parameters (see Section 11.9.11: Type and event enables on page 121).
For an event to be logged, both the activity code and the type (user activity in this
case) must be enabled. Disabling the type prevents logging of all the events that
belong to that type, although it does not disable them.
show_user_activity code(c)
Display the logging status of the user activity code.
enable_user_activity_global
disable_user_activity_global
Enable or disable the logging of user activity types. User activity trace is disabled by
default.
show_user_activity_global
Display the logging status of user activity types.
11.10.2
User API control commands
os21usertrace creates the following commands for controlling the generation of trace
records for user APIs. Use these commands for enabling or disabling tracing for any group,
class or named API that was specified in the os21usertrace definition file.
Note:
If no user APIs are defined, then none of the following commands are defined.
show_user_api_groups
Display all the user API trace groups in the application as a simple list.
enable_user_api_group_all
disable_user_api_group_all
Enable or disable the logging of all the APIs for all groups.
show_user_api_group_all
Display the logging status of all the APIs for all groups.
show_user_api_group_group_classes
Display all the classes of the user trace group group, where group is one of the
groups listed by show_user_api_groups.
enable_user_api_group_group_class_all
disable_user_api_group_group_class_all
Enable or disable the logging of all the APIs for all classes of the user trace group
group.
show_user_api_group_group_class_all
Display the logging status of all the APIs for all classes of the user trace group group.
c.
124/246
These commands are not qualified by class or group since the activity must be unique.
8063762 Rev 9
ST200
OS21 Trace
enable_user_api_group_group_class_class
disable_user_api_group_group_class_class
Enable or disable the logging of all the APIs within the class class of the user trace
group group, where class is one of the classes reported by
show_user_api_group_group_classes.
show_user_api_group_group_class_class
Display the status of all the APIs within the class class of the user trace group group.
enable_user_api code(d)
disable_user_api code(d)
Enable or disable the logging of the user API specified by code. All APIs are enabled
by default. The command show_user_api_group_all lists all the valid code
parameters (see Section 11.9.11: Type and event enables on page 121).
For an event to be logged, both the API code and the type (user API in this case) must
be enabled. Disabling the type prevents logging of all the events that belong to that
type, although it does not disable them.
show_user_api code(d)
Display the logging status of the user API specified by code.
enable_user_api_global
disable_user_api_global
Enable or disable the logging of user API types. User API trace is disabled by default.
show_user_api_global
Display the logging status of user API types.
11.10.3
Miscellaneous commands
The following GDB command is also created by os21usertrace.
show_user_decode_trace
Show the location of the associated os21decodetrace control file (that is, the
argument passed to its -user option).
d. These commands are not qualified by class or group since the API must have global scope and therefore be
unique.
8063762 Rev 9
125/246
OS21 Trace
11.11
ST200
Trace library API
The OS21 Trace library is provided in libos21trace.a and its associated header file is
os21trace.h. The functions defined by this API are described in the following sections.
os21_trace_initialize
Definition:
Create a trace buffer
typedef enum os21_trace_mode_e {
os21_trace_mode_stop = 1,
os21_trace_mode_wrap = 2
} os21_trace_mode_e;
void os21_trace_initialize(
void * data,
unsigned int size,
os21_trace_mode_e mode);
Arguments:
data
The buffer to use.
size
The size in bytes of the buffer to create.
mode
Buffer full action (stop or wrap).
Returns:
Void
Description:
This function allocates and initializes a trace buffer specified by the size parameter.
If data is NULL, the API returns the current buffer to the heap and allocates a new
buffer specified by size.
On startup of OS21 Trace, the default constructor invokes this function to create a
buffer of size 2 Mbytes (enough for 128k simple records) in
os21_trace_mode_wrap mode. This default size can be overridden by the user.
See Section 11.12: Variables and APIs that can be overridden on page 138.
os21_trace_initialize_data
Definition:
Replace an existing trace buffer
void os21_trace_initialize_data(
void * data,
unsigned int size);
Arguments:
data
The buffer to use.
size
The size in bytes of the buffer to create.
Returns:
Void
Description:
Replace the existing trace buffer with the buffer specified by the data and size
parameters. If data is NULL, the API returns the current buffer to the heap and
allocates a new buffer of the specified size.
This function must not be used before os21_trace_initialize() has been
called.
Note: os21_trace_initialize_data() can be used to clear the trace buffer if data
refers to the existing trace buffer.
126/246
8063762 Rev 9
ST200
OS21 Trace
os21_trace_initialize_activity_monitors
Initialize activity monitors
Definition:
void os21_trace_initialize_activity_monitors(void);
Arguments:
None
Returns:
Void
Description:
Use this function to initialize the activity monitors.
os21_trace_set_mode
Definition:
Set the action on trace buffer full
typedef enum os21_trace_mode_e {
os21_trace_mode_stop = 1,
os21_trace_mode_wrap = 2
} os21_trace_mode_e;
os21_trace_mode_e os21_trace_set_mode(os21_trace_mode_e mode);
Arguments:
mode
Buffer full action (stop or wrap).
Returns:
The previous trace mode.
Description:
Set the action to be performed when the task trace buffer is full. The options are stop
or wrap.
os21_trace_overflow
Definition:
User-defined trace overflow function
void os21_trace_overflow(
void * data,
unsigned int size);
Arguments:
data
The current trace buffer.
size
The size in bytes of data in the buffer.
Returns:
Void
Description:
A function with this name is called when the trace buffer overflows (in stop mode) or
before wraparound occurs (in wrap mode). The data and size parameters are the
current trace data buffer and the size of the data saved in the buffer.
The default implementation of this function is a no-op that the user can override with
their own implementation.
8063762 Rev 9
127/246
OS21 Trace
ST200
os21_task_trace_initialize
Definition:
Create a task information buffer
void os21_task_trace_initialize(
void * data,
unsigned int size,
os21_task_trace_mode_e mode);
Arguments:
data
The buffer to use.
size
The size in bytes of the buffer to create.
mode
Buffer full action (stop or wrap).
Returns:
Void
Description:
This function allocates and initializes a task information buffer specified by the size
parameter. If data is NULL, the API returns the current buffer to the heap and
allocates a new buffer specified by size.
On startup of OS21 Trace, the default constructor invokes this function to create a
buffer of size 64 Kbytes (enough for 2k records) in os21_trace_mode_wrap mode.
This default size can be overridden by the user. See Section 11.12: Variables and
APIs that can be overridden on page 138.
os21_task_trace_initialize_data Replace an existing task information buffer
Definition:
void os21_task_trace_initialize_data(
void * data,
unsigned int size);
Arguments:
data
The buffer to use.
size
The size in bytes of the buffer to create.
Returns:
Void
Description:
Replace the existing task information buffer with the buffer specified by the data and
size parameters. If data is NULL, the API returns the current buffer to the heap and
allocates a new buffer of the specified size.
This function must not be used before os21_task_trace_initialize() has
been called.
Note: os21_task_trace_initialize_data() can be used to clear the task
information buffer if data refers to the existing task information buffer.
128/246
8063762 Rev 9
ST200
OS21 Trace
os21_task_trace_overflow
Definition:
User-defined task information overflow function
void os21_task_trace_overflow(
void * data,
unsigned int size);
Arguments:
data
The current task information buffer.
size
The size in bytes of data in the buffer.
Returns:
Void
Description:
A function with this name is called when the task information buffer overflows (in stop
mode) or before wraparound occurs (in wrap mode). The data and size parameters
are the current buffer and the size of the data saved in the buffer.
The default implementation of this function is a no-op that the user can override with
their own implementation.
os21_task_trace_set_mode
Definition:
Set the action on task information buffer full
typedef enum os21_trace_mode_e {
os21_trace_mode_stop = 1,
os21_trace_mode_wrap = 2
} os21_trace_mode_e;
os21_task_trace_mode_e os21_task_ trace_set_mode
(os21_trace_mode_e mode);
Arguments:
mode
Buffer full action (stop or wrap).
Returns:
The previous trace mode.
Description:
Set the action to be performed when the task trace buffer is full. The options are stop
or wrap.
os21_trace_set_enable
Definition:
Enable trace logging
int os21_trace_set_enable(
int mode);
Arguments:
mode
Enable (1) or disable (0).
Returns:
The previous mode.
Description:
Enable or disable OS21 Trace logging. Initially set to 1.
8063762 Rev 9
129/246
OS21 Trace
ST200
os21_activity_set_global_enable
Definition:
Enable OS21 activity logging
int os21_activity_set_global_enable(
int mode);
Arguments:
Enable (1) or disable (0).
mode
Returns:
The previous mode.
Description:
Enable or disable OS21 activity logging. Initially set to 0.
os21_activity_set_class_enable
Definition:
Enable OS21 activity logging for class
typedef enum os21_activity_class_e {
os21_activity_class_exception,
os21_activity_class_interrupt,
os21_activity_class_task,
os21_activity_class_general
os21_activity_class_EOF
} os21_activity_class_e;
void os21_activity_set_class_enable(
os21_activity_class_e code, int mode);
Arguments:
code
OS21 activity event class.
mode
Enable (1) or disable (0).
Returns:
Void
Description:
Enable or disable logging for the specified OS21 activity event class.
130/246
8063762 Rev 9
ST200
OS21 Trace
os21_activity_set_enable
Definition:
Enable OS21 activity logging for activity
typedef enum os21_activity_e {
os21_activity_task_switch,
os21_activity_task_create,
os21_activity_task_delete,
os21_activity_task_exit,
os21_activity_intr_install,
os21_activity_intr_uninstall,
os21_activity_intr_enter,
os21_activity_intr_exit,
os21_activity_excp_install,
os21_activity_excp_uninstall,
os21_activity_excp_enter,
os21_activity_excp_exit,
os21_activity_general_print,
os21_activity_EOF
} os21_activity_e;
int os21_activity_set_enable(os21_activity_e code, int mode);
Arguments:
code
OS21 activity event type.
mode
Enable (1) or disable (0).
Returns:
The previous mode.
Description:
Enable or disable logging of the specified OS21 activity event type.
os21_activity_set_task_trace_enable
Definition:
Enable OS21 task
information logging
int os21_activity_set_task_trace_enable(int mode);
Arguments:
mode
Enable (1) or disable (0).
Returns:
The previous mode.
Description:
Enable or disable logging of task information by OS21 activity events (task_create
or task_switch).
os21_api_set_global_enable
Definition:
Enable OS21 API logging
int os21_api_set_global_enable(
int mode);
Arguments:
mode
Enable (1) or disable (0).
Returns:
The previous mode.
Description:
Enable or disable OS21 API logging. Initially set to 0.
8063762 Rev 9
131/246
OS21 Trace
ST200
os21_api_set_class_enable
Definition:
Enable OS21 API logging for class
typedef enum os21_api_class_e {
os21_api_class_cache,
os21_api_class_callback,
os21_api_class_event,
os21_api_class_exception,
os21_api_class_interrupt,
os21_api_class_kernel,
os21_api_class_memory,
os21_api_class_message,
os21_api_class_mmap,
os21_api_class_mutex,
os21_api_class_partition,
os21_api_class_power,
os21_api_class_profile,
os21_api_class_reset,
os21_api_class_semaphore,
os21_api_class_scu,
os21_api_class_task,
os21_api_class_time,
os21_api_class_vmem,
os21_api_class_xpu,
os21_api_class_EOF
} os21_api_class_e;
void os21_api_set_class_enable(
os21_api_class_e code, int mode);
Arguments:
code
OS21 API class.
mode
Enable (1) or disable (0).
Returns:
Void
Description:
Enable or disable logging for the specified OS21 API class.
132/246
8063762 Rev 9
ST200
OS21 Trace
os21_api_set_enable
Definition:
Enable logging for the given API
int os21_api_set_enable(os21_api_e code, int mode);
Arguments:
code
OS21 API type.
mode
Enable (1) or disable (0).
Returns:
The previous mode.
Description:
Enable or disable logging of the specified OS21 API type.
os21_task_trace_set_enable
Definition:
Enable task information logging
int os21_task_trace_set_enable(
int mode);
Arguments:
mode
Enable (1) or disable (0).
Returns:
The previous mode.
Description:
Enable or disable logging of task information. Initially set to 1.
os21_trace_get_control
Definition:
Get trace control
typedef struct os21_trace_control_s {
unsigned int save_activity:1;
unsigned int save_api_enter:1;
unsigned int save_api_exit:1;
unsigned int save_activity_args:1;
unsigned int save_api_enter_args:1;
unsigned int save_api_exit_args:1;
unsigned int save_caller_address:1;
unsigned int save_frame_address:1;
} os21_trace_control_t;
void os21_trace_get_control(os21_trace_control_t *control);
Arguments:
control
The control settings.
Returns:
Void
Description:
Get the control settings for OS21 Trace.
8063762 Rev 9
133/246
OS21 Trace
ST200
os21_trace_set_control
Definition:
Set trace control
typedef struct os21_trace_control_s {
unsigned int save_activity:1;
unsigned int save_api_enter:1;
unsigned int save_api_exit:1;
unsigned int save_activity_args:1;
unsigned int save_api_enter_args:1;
unsigned int save_api_exit_args:1;
unsigned int save_caller_address:1;
unsigned int save_frame_address:1;
} os21_trace_control_t;
void os21_trace_set_control(os21_trace_control_t *control);
Arguments:
The control settings
control
Returns:
Void
Definition:
Set the control settings for OS21 Trace.
os21_trace_print
Definition:
Print a string into the trace buffer
void OS21_TRACE_PRINT(const char *string)
Arguments:
The string to be written to the buffer
string
Returns:
Void.
Description:
Print a string into the trace buffer.
Use the OS21_TRACE_PRINT() API in preference to the alternative
os21_trace_print() API as the former allows the application to link successfully
when not linked with the OS21 Trace libraries, whereas the latter does not.
os21_trace_write_file
Definition:
Write trace buffer to a file
int os21_trace_write_file(
const char *name,
int reset);
Arguments:
name
File name to create.
reset
Clear (1) or keep (0) buffer.
Returns:
0 if OK, 1 if an error occurred.
Description:
Write the contents of the trace buffer to the file name.
The second parameter reset is the buffer reset argument. If 1 then the buffer is
cleared, otherwise it is not reset and remains intact.
134/246
8063762 Rev 9
ST200
OS21 Trace
os21_trace_status
Definition:
Get trace status
typedef struct os21_trace_status_s {
int version;
unsigned int codesize;
unsigned int size;
osclock_t tickrate;
osclock_t lasttime;
} os21_trace_status_t;
void os21_trace_status(os21_trace_status_t *status);
Arguments:
A structure status with the following fields to be filled in by the function:
version
The version number for the trace buffer format.
codesize
The size of the trace code field in the trace buffer.
Valid sizes are 1, 2, or 4 bytes (see Section 11.8.1:
os21trace.bin on page 116).
size
The current size of the data in the trace buffer.
tickrate
The time_ticks_per_sec value.
lasttime
The time when the last record was logged to the
trace buffer.
Returns:
Void.
Description:
Get the trace buffer status.
os21_trace_write_buffer
Definition:
Write trace data to memory
int os21_trace_write_buffer(
void *data,
int reset);
Arguments:
data
Destination buffer.
reset
Clear (1) or keep (0) buffer.
Returns:
0 if OK, 1 if an error occurred.
Description:
Write the contents of the trace buffer to the buffer specified by data. Use
os21_task_status() to obtain the size needed for the destination buffer.
The second parameter reset is the buffer reset argument. If 1 then the trace buffer
is cleared, otherwise it is not reset and the buffer remains intact.
Use this API in conjunction with os21_trace_status(). To ensure that the
information returned by os21_trace_status() remains valid for the call to
os21_trace_write_buffer(), these API calls must be encapsulated within calls
to os21_trace_set_enable(1) and os21_trace_set_enable(0).
8063762 Rev 9
135/246
OS21 Trace
ST200
os21_task_trace_write_file
Definition:
Write task information buffer to a file
int os21_task_trace_write_file(
const char *name,
int reset);
Arguments:
name
File name to create.
reset
Clear (1) or keep (0) buffer.
Returns:
0 if OK, 1 if an error occurred.
Description:
Write the contents of the task information buffer to the file name.
The second parameter reset is the buffer reset argument. If 1 then the buffer is
cleared, otherwise it is not reset and remains intact.
os21_task_trace_status
Definition:
Get task information status
typedef struct os21_task_trace_status_s {
int version;
unsigned int size;
} os21_task_trace_status_t;
void os21_task_trace_status(os21_task_trace_status_t *status);
Arguments:
A structure status with the following fields to be filled in by the function:
version
The version number for the task
information buffer format.
size
The current size of the data in the task
information buffer.
Returns:
Void.
Description:
Get the task information buffer status.
136/246
8063762 Rev 9
ST200
OS21 Trace
os21_task_trace_write_buffer
Definition:
Write task information data to a buffer
int os21_task_trace_write_buffer(
void *data,
int reset);
Arguments:
data
Destination buffer.
reset
Clear (1) or keep (0) buffer.
Returns:
0 if OK, 1 if an error occurred.
Description:
Write the contents of the task information buffer to the buffer specified by data. Use
os21_task_trace_status() to obtain the size needed for the destination buffer.
The second parameter reset is the buffer reset argument. If 1 then the buffer is
cleared, otherwise it is not reset and remains intact.
Use this API in conjunction with os21_task_trace_status(). To ensure that the
information returned by os21_task_trace_status() remains valid for the call to
os21_task_trace_write_buffer(), these API calls must be encapsulated
within calls to os21_task_trace_set_enable(1) and
os21_task_trace_set_enable(0).
8063762 Rev 9
137/246
OS21 Trace
11.12
ST200
Variables and APIs that can be overridden
OS21 Trace provides default constructors for the trace buffer and the task information
buffer. The user may customize the constructors for both buffers by overriding the functions
and variables listed in this section.
The following variables may be overridden by the user.
extern void *os21_trace_constructor_data;
Defaults to NULL, in which case the initial trace buffer is allocated by
os21_trace_initialize(). See also os21_trace_initialize_data on page 126.
extern const unsigned int os21_trace_constructor_size;
The size of the trace buffer in bytes, defaults to 128k records.
extern void *os21_task_trace_constructor_data;
Defaults to NULL, in which case the initial task information buffer is allocated by
os21_task_trace_initialize(). See also os21_task_trace_initialize_data on
page 128.
extern const unsigned int os21_task_trace_constructor_size;
The size of the task information buffer in bytes, defaults to 2k records.
The following APIs can be overridden by the user.
os21_trace_constructor_user
User-definable trace buffer constructor
Definition:
void os21_trace_constructor_user(void);
Returns:
Void.
Description:
The default trace buffer constructor calls a function with this name as its final action.
The default implementation of this function is a no-op that the user can override with
their own implementation (see Figure 28 on page 144 for an example).
os21_task_trace_constructor_user
User-definable task
information buffer constructor
Definition:
void os21_task_trace_constructor_user(void);
Returns:
Void.
Description:
The default task information buffer constructor calls a function with this name as its
final action. The default implementation of this function is a no-op that the user can
override with their own implementation.
138/246
8063762 Rev 9
ST200
11.13
OS21 Trace
User trace runtime APIs
When used with the --wrap-source command line option, the os21usertrace tool
creates source code that includes a set of APIs that can be called by the application to
control the generation of user trace records.
Note:
The initial element user in the names of the APIs listed in the following sections can be
changed with the option --user-prefix of the os21usertrace tool.
11.13.1
User activity control APIs
The following APIs are created by os21usertrace for controlling the generation of trace
records for custom user activity events.
Note:
If no user activities are defined, then none of these APIs are defined.
user_activity_set_group_enable
Definition:
Enable tracing for an activity group
void user_activity_set_group_enable(
user_activity_group_e code, int mode)
Arguments:
code
Activity group to enable or disable.
mode
Enable (1) or disable (0).
Returns:
Void.
Description:
Enable or disable the logging of all the activities for all classes of the user trace group
specified by code. The enumeration user_activity_group_e is defined in the
header file generated by os21usertrace.
user_activity_set_group_group_class_enable
Definition:
Enable tracing for
an activity class
void user_activity_set_group_group_class_enable(
user_activity_group_group_class_e code, int mode)
Arguments:
code
Activity class to enable or disable.
mode
Enable (1) or disable (0).
Returns:
Void.
Description:
os21usertrace generates a set of APIs for enabling or disabling the logging of
classes of user defined activities within each of the user defined trace groups. There
is one API for each group. For example, if there is a group of user defined activities
called libc, then the API to enable or disable the logging of any given class of
activity within the libc group is
user_activity_set_group_libc_class_enable().
An enumeration with the name user_activity_group_group_class_e, where
group is the name of an activity group, is defined for each activity group in the
header file generated by os21usertrace.
8063762 Rev 9
139/246
OS21 Trace
ST200
user_activity_set_enable
Definition:
Enable tracing for an activity
int user_activity_set_enable(user_activity_e code, int mode)
Arguments:
code
Activity to enable or disable.
mode
Enable (1) or disable (0).
Returns:
0 for success
Description:
Enable or disable the logging of the user defined activity specified by code. The
enumeration user_activity_e is defined in the header file generated by
os21usertrace.
user_api_set_global_enable
Definition:
Enable global tracing for activities
int user_activity_set_global_enable(int mode)
Arguments:
mode
Enable (1) or disable (0).
Returns:
0 for success
Description:
Enable or disable the logging of user activity types; initially set to 0.
11.13.2
User API control APIs
The following APIs are created by os21usertrace for controlling the generation of trace
records for user APIs.
Note:
If no user APIs are defined, then none of these APIs are defined.
user_api_set_group_enable
Definition:
Enable tracing for an API group
void user_api_set_group_enable(user_api_group_e code, int mode)
Arguments:
code
API group to enable or disable.
mode
Enable (1) or disable (0).
Returns:
Void.
Description:
Enable or disable the logging of all the APIs for all classes of the user trace group
specified by code. The enumeration user_api_group_e is defined in the header
file generated by os21usertrace.
140/246
8063762 Rev 9
ST200
OS21 Trace
user_api_set_group_group_class_enable
Definition:
Enable tracing for
an API class
void user_api_set_group_group_class_enable(
user_api_group_group_class_e code, int mode)
Arguments:
code
API class to enable or disable.
mode
Enable (1) or disable (0).
Returns:
Void.
Description:
os21usertrace generates a set of APIs for enabling or disabling the logging of
classes of user defined APIs within each of the user defined trace groups. There is
one API for each group. For example, if there is a group of user defined APIs called
libc, then the API to enable or disable the logging of any given class of API within
the libc group is user_api_set_group_libc_class_enable().
An enumeration with the name user_api_group_group_class_e, where group
is the name of an API group, is defined for each API group in the header file
generated by os21usertrace.
user_api_set_enable
Definition:
Enable tracing for an API
int user_api_set_enable(user_api_e code, int mode)
Arguments:
code
API to enable or disable.
mode
Enable (1) or disable (0).
Returns:
0 for success
Description:
Enable or disable the logging of the user defined API specified by code. The
enumeration user_api_e is defined in the header file generated by os21usertrace.
user_api_set_global_enable
Definition:
Enable global tracing for APIs
int user_api_set_global_enable(int mode)
Arguments:
mode
Enable (1) or disable (0).
Returns:
0 for success
Description:
Enable or disable the logging of user API types; initially set to 0.
8063762 Rev 9
141/246
OS21 Trace
11.13.3
ST200
User activity APIs
The os21usertrace tool creates a set of APIs for generating the user defined events
specified in the definition file. These are all named USER_ACTIVITY(), where ACTIVITY
is the name (in upper case letters) of the activity given by the USER-ACTIVITY specification
in the definition file (see Section 11.1.2: User definition file on page 100). The parameters of
the API are determined by the specification given in the definition file.
Note:
The preferred version of the API is USER_ACTIVITY(), as this enables the application to
be linked successfully even if it is not linked with the OS21 Trace libraries. There is an
alternative form of the API, with the name in lower case letters, which does not allow the
application to be linked unless it is also linked with the OS21 Trace libraries. Use of the
latter API is not recommended.
11.14
Correspondence between GDB commands and APIs
Table 30 lists the OS21 Trace GDB commands and their equivalent APIs.
Table 30.
Correspondence between GDB commands and APIs
GDB command
API
os21_trace_set_mode
os21_trace_set_mode()
os21_task_trace_set_mode
os21_task_trace_set_mode()
enable_os21_trace
os21_trace_set_enable()
disable_os21_trace
enable_os21_activity_global
os21_activity_set_global_enable()
disable_os21_activity_global
enable_os21_api_global
os21_api_set_global_enable()
disable_os21_api_global
enable_os21_activity_class_class
os21_activity_set_class_enable()
disable_os21_activity_class_class
enable_os21_activity
os21_activity_set_enable()
disable_os21_activity
enable_os21_api_class_class
os21_api_set_class_enable()
disable_os21_api_class_class
enable_os21_api
os21_api_set_enable()
disable_os21_api
enable_os21_trace_control
enable_os21_trace_control_all
os21_trace_set_control()
disable_os21_trace_control
disable_os21_trace_control_all
enable_os21_task_trace
os21_task_trace_set_enable()
disable_os21_task_trace
142/246
8063762 Rev 9
ST200
Table 30.
OS21 Trace
Correspondence between GDB commands and APIs (continued)
GDB command
API
enable_os21_activity_task_trace
os21_activity_set_task_trace_enable()
disable_os21_activity_task_trace
dump_os21_trace_buffer
os21_trace_write_file()
dump_os21_task_trace_buffer
os21_task_trace_write_file()
Table 31 lists the user GDB commands and their equivalent APIs.
Table 31.
Correspondence between GDB commands and APIs
GDB command
API
enable_user_api_group_all
disable_user_api_group_all
user_api_set_group_enable()
enable_user_api_group_group_class_all
disable_user_api_group_group_class_all
enable_user_api_group_group_class_class
user_api_set_group_group_class_enable()
disable_user_api_group_group_class_class
enable_user_api
user_api_set_enable()
disable_user_api
enable_user_api_global
user_api_set_global_enable()
disable_user_api_global
enable_user_activity_group_all
disable_user_activity_group_all
user_activity_set_group_enable()
enable_user_activity_group_group_class_all
disable_user_activity_group_group_class_all
enable_user_activity_group_group_class_class
user_activity_set_group_group_class_enable()
disable_user_activity_group_group_class_class
enable_user_activity
user_activity_set_enable()
disable_user_activity
enable_user_activity_global
user_activity_set_global_enable()
disable_user_activity_global
11.15
Trace always on
The default is that the OS21 activity and OS21 API logging is disabled at startup. The
expectation is that the user enables them using STWorkbench or GDB. However, it may be
convenient to always run an application with logging enabled from the outset.
The example in Figure 28 on page 144 customizes OS21 Trace without having to change
the application source. To use this example, compile the example code and add the object to
the link command line for the application.
8063762 Rev 9
143/246
OS21 Trace
ST200
The example defines the following functions.
Note:
●
os21_trace_constructor_user(). This function is called by the trace buffer
constructor os21_trace_constructor in the OS21 Trace library.
●
my_os21_trace_destructor(). This function runs after exit().
The destructor function may not be very useful as embedded applications typically never
terminate.
Figure 28.
#include
#include
#include
Example to customize trace
<stdio.h>
<os21.h>
<os21trace.h>
#if !defined(TRACE_SIZE)
#define TRACE_SIZE 256 /* Trace buffer size */
#endif
static int trace_enabled_flag = 0;
const unsigned int os21_trace_constructor_size = TRACE_SIZE;
/* Run by OS21 Trace constructor */
void os21_trace_constructor_user(void)
{
/* Enable trace */
os21_trace_set_enable(1);
os21_activity_set_global_enable(1);
os21_api_set_global_enable(1);
os21_task_trace_set_enable(1);
trace_enabled_flag = 1;
}
/* Run after exit */
void my_os21_trace_destructor(void)
__attribute__((destructor));
void my_os21_trace_destructor(void)
{
if (trace_enabled_flag) {
/* Disable trace */
os21_trace_set_enable(0);
os21_task_trace_set_enable(0);
/* Save trace and task information data */
os21_trace_write_file("os21trace.bin", 1);
os21_task_trace_write_file("os21tasktrace.bin", 1);
}
}
144/246
8063762 Rev 9
ST200
12
Relocatable loader library
Relocatable loader library
The relocatable loader library (rl_lib) supports the creation and loading of DSOs (dynamic
shared objects, also known as load modules) in an embedded environment. rl_lib
implements DSOs as defined in the standard for supporting ELF System V Dynamic
Linking.
Note:
For applications that do not rely on advanced OS features (such as file systems, virtual
memory management and multi process segment sharing), use rl_lib as an alternative to
the standard ELF System V Dynamic Loader (libdl.so).
12.1
Run-time model overview
The ELF System V ABI supports several run-time models. Only some run-time models are
suitable for embedded systems without the support of traditional operating system services.
The run-time model for an application dictates the method used for linking and loading.
Table 32 lists the different run-time models. Table 33 summarizes the features supported by
each model.
Note:
rl_lib implements only the R_Relocatable run-time model.
Table 32.
Run-time models
Run-time model
Description
R_Absolute
Absolute run-time model. The whole application is a single module that is
statically linked at a fixed load address.
R_Relocatable
Relocatable run-time model. The application has a main module and several
load modules. The main module is statically linked and loaded as for an
R_Absolute application. The load modules are loaded on demand (by
explicit calls to the loader) at run-time. The load modules are loaded at an
arbitrary address and dynamic symbol binding is applied by the loader for
symbols undefined in the load modules. In the hierarchy of loaded modules,
the dynamic symbol binding traverses the modules from the bottom up, see
Section 12.2: Relocatable run-time model for details.
R_PIC
System V run-time model. The application has a main module and several
load modules. The main module is typically statically linked but possibly has
references to symbols in the load modules. The main module is loaded with
support from the dynamic loader that also loads load modules and binds
symbols before the application starts. At run-time, the application can load
other modules on demand. The dynamic symbol-binding traverses the load
modules in an order defined by the static link order and the run-time loading
order. In addition to dynamic loading and linking, in a multi-process
environment, the load module’s segments can be shared between several
applications. This model usually relies on file system support and virtual
memory management.
8063762 Rev 9
145/246
Relocatable loader library
Table 33.
ST200
Run time models comparison
Supported features
12.2
R_Absolute
R_Relocatable
R_PIC
Application partitioning
1 single program
1 main program +
N load modules
1 main program +
N load modules
Static symbol binding
Yes
Yes
Yes
Dynamic loading
No
Startup time: No
Run-time: Yes
Startup time: Yes
Run-time: Yes
Dynamic symbol
binding
No
Main program: No
Load modules: Yes
Main program: Yes
Load modules: Yes
Explicit module
dependencies
N/A
No
Yes
Dynamic symbol lookup N/A
Bottom up (from loaded
Unrestricted order
to loader)
Symbol preemption
N/A
No
Yes
Segment sharing
(across processes)
N/A
No
Yes
Performance impact
N/A
Minimal
Yes
Code size impact
N/A
Minimal
Yes
Application writer
impact
N/A
Need explicit loading
No change by default
Build system impact
N/A
Compiler options
Load modules build
Compiler options
Load modules build
Relocatable run-time model
The R_Relocatable run-time model, as implemented by rl_lib, has the following features:
●
one main module loaded at application startup by the system
●
several load modules that can load at run-time and unload after use
●
several modules can be resident at the same time
●
a loaded module can load and unload other load modules (as for the main module)
●
load modules can be loaded anywhere
●
access to symbols in loaded modules from the loader through a call to the loader library
●
the loader performs dynamic symbol binding when loading a module and symbols are
searched in the load modules hierarchy bottom-up (to the main module)
●
sharing of code and data objects between modules is achieved by linking to the objects
in a common ancestor
●
the loader library is statically linked with the main module
●
the system support archive library should be linked with the main module
Figure 29 shows an example of an application that has four load modules A, B, C and D.
146/246
8063762 Rev 9
ST200
Relocatable loader library
Figure 29. Example of an application with four load modules
printf
Module B
printf
Module A
*exec_B
malloc
main
printf
malloc
*exec_A
*exec_D
*exec_C
malloc
Module C
printf
malloc
Module D
In Figure 29, curved arrows (from load modules to parent module) represent load time
symbol-binding performed while the load module loads. Straight arrows (from loader module
to loaded module) represent explicit symbol address resolution performed through the
loader library API.
The following describes a possible scenario.
1.
At run-time, the main module loads the module A into memory through the
rl_load_file() function.
2.
The loader, in the process of loading A into memory, binds the symbol printf
(undefined in A) to the printf function defined in main.
3.
The main program uses the rl_sym() function to retrieve a pointer to the function
symbol exec_A in A.
4.
For A, the main program loads the module D and references to printf are resolved to
the printf in main. In addition, references to malloc in D are also resolved to the
malloc in main.
5.
The main program retrieves a pointer to exec_D in D using the rl_sym() function.
6.
The main program (at some point) invokes the function exec_A.
7.
The exec_A function loads the two modules B and C.
8.
The undefined reference to printf in B is resolved to the printf in main (the loader
searches first in A, and then in main).
9.
The undefined reference to malloc in C is resolved to the malloc in A (the loader
searches for and finds it in A). Note that the malloc function called from D (malloc of
main) is then different from the malloc function called from B (or C, or A) which is the
malloc of A.
10. After retrieving symbol addresses using the rl_sym() function, module A can
indirectly call functions or reference data in B and C.
Note:
At any time, the main module or the module A can unload one of the loaded modules.
8063762 Rev 9
147/246
Relocatable loader library
12.2.1
ST200
The relocatable code generation model
The relocatable code generation model is the same as the code generation model for the
System V model with the following differences.
12.3
●
No symbol can be preempted. Dynamic symbol binding always searches the current
module first. This has the effect that a module containing a symbol definition can be
sure that it will use this definition. For example, this enables inlining in load modules.
●
Weak references are treated the same way as undefined references in load modules.
Therefore, when traversing the module tree bottom-up, the first definition found is
taken.
Relocatable loader library API
The relocatable loader library supports loading and unloading a module and for accessing a
symbol address in a module by name. The relocatable loader library is provided as a library
librl.a and its associated header file rl_lib.h.
The functions defined in this API are explained in the following sections.
12.3.1
rl_handle_t type
All the functions manipulating a load module use a pointer to the rl_handle_t type. This
is an abstract type for a load module handle.
A load module handle is allocated by the rl_handle_new() function and deallocated by
the rl_handle_delete() function.
The main module handle is statically allocated and initialized in the startup code of the main
module.
A module handle references one loaded module at a time. To load another module from the
same handle, the previous module must first be unloaded.
148/246
8063762 Rev 9
ST200
Relocatable loader library
rl_handle_new
Definition:
Allocate and initialize a new handle
rl_handle_t *rl_handle_new(
const rl_handle_t *parent,
int mode);
Arguments:
parent
The handle of the parent module.
mode
Reserved for future extensions.
Returns:
The newly initialized handle.
Description:
The rl_handle_new() function allocates and initializes a new handle that can be
used for loading and unloading a load module.
The handle of the parent module to which the loaded module will be connected is
specified by the parent argument.
The mode argument is reserved for future extensions and must always be 0.
Generally, a load module will be attached to the module using this function, therefore
a handle will typically be allocated as follows:
rl_handle_t *new_handle = rl_handle_new(rl_this(), 0);
rl_handle_delete
Definition:
Finalize and deallocate a module handle
int rl_handle_delete(
rl_handle_t *handle);
Arguments:
handle
The handle to deallocate.
Returns:
Returns 0 for success, -1 for failure.
Description:
The rl_handle_delete() function finalizes and deallocates a module handle.
The handle must not hold a loaded module. The loaded module must have been first
unloaded by rl_unload() before calling this function. If successful, the value
returned is 0. Otherwise the value returned is -1 and the error code returned by
rl_errno() is set accordingly.
rl_this
Return the handle for the current module
Definition:
rl_handle_t *rl_this(void);
Arguments:
None.
Returns:
The handle for the current module.
Description:
The rl_this() function returns the handle for the current module. If called from the
main module, it returns the handle of the main module. If called from a loaded
module, it returns the handle that holds the loaded module.
This function is used when allocating a handle with rl_handle_new(). It can also
be used, for example, to retrieve a symbol in the current module:
void *symbol_ptr = rl_sym(rl_this(), "symbol");
8063762 Rev 9
149/246
Relocatable loader library
rl_parent
ST200
Return the handle for the parent of the current handle
Definition:
rl_handle_t *rl_parent(void);
Arguments:
None.
Returns:
The handle for the parent of the current handle.
Description:
The rl_parent() function returns the handle for the parent of the current handle
(as returned by rl_this()).
It may be used, for example, to find a symbol in one of the parent modules:
void *symbol_in_parents = rl_sym_rec(rl_parent(), "symbol");
rl_load_addr
Definition:
Return the memory load address of a loaded module
const char *rl_load_addr(
rl_handle_t *handle);
Arguments:
handle
The handle for the loaded module.
Returns:
The memory load address of the loaded module, or NULL.
Description:
The rl_load_addr() function returns the memory load address of a loaded
module. It returns NULL if the handle does not hold a loaded module or if the handle
passed is the main program handle.
rl_load_size
Definition:
Return the memory load size of a loaded module
unsigned int rl_load_size(
rl_handle_t *handle);
Arguments:
handle
The handle for the loaded module.
Returns:
The memory load size of the loaded module, or 0.
Description:
The rl_load_size() function returns the memory load size of a loaded module. It
returns 0 if the handle does not hold a loaded module or if the handle passed is the
main program handle.
rl_file_name
Definition:
Return the filename associated with the loaded module handle
const char *rl_file_name(
rl_handle_t *handle);
Arguments:
handle
The handle for the loaded module.
Returns:
The filename associated with the loaded module handle, or NULL.
Description:
The rl_file_name() function returns the filename associated with the loaded
module handle. It returns NULL if no filename is associated with the current loaded
module, if the handle does not hold a loaded module or if the handle passed is the
main program handle.
150/246
8063762 Rev 9
ST200
Relocatable loader library
rl_set_file_name
Definition:
Specify a filename for the handle
int rl_set_file_name(
rl_handle_t *handle,
const char *f_name);
Arguments:
handle
The handle for the module.
f_name
The filename to specify for the handle.
Returns:
Returns 0 for success, -1 for failure.
Description:
The rl_set_file_name() function is used to specify a filename for a handle. This
filename is attached to the next module that will be loaded. It can be used to specify a
filename for modules loaded from memory or to force a different filename for a
module loaded from a file.
This function returns 0 if the filename was successfully set, or -1 and the error code
returned by rl_errno() is set accordingly if a module is already loaded or if the
application runs out of memory.
rl_load_buffer
Definition:
Load a relocatable module into memory
int rl_load_buffer(
rl_handle_t *handle,
const char *image);
Arguments:
handle
The handle for the module.
image
The image of the load module.
Returns:
Returns 0 for success, -1 for failure.
Description:
The rl_load_buffer() function loads a relocatable module into memory from the
image referenced by image.
It allocates the space for the loaded module in the heap, loads the segments from the
memory image of the loadable module, links the module to the parent module of the
handle and relocates and initializes the loaded module.
This function calls the action callback functions for RL_ACTION_LOAD after loading
and before executing any code in the loaded module.
The value 0 is returned if the loading was successful. The value -1 is returned on
failure and the error code returned by rl_errno() is set accordingly.
8063762 Rev 9
151/246
Relocatable loader library
rl_load_file
Definition:
ST200
Load a relocatable module into memory from a file
int rl_load_file(
rl_handle_t *handle,
const char *f_name);
Arguments:
handle
The handle for the module.
f_name
The file from which to load the relocatable module.
Returns:
Returns 0 for success, -1 for failure.
Description:
The rl_load_file() function loads a relocatable module into memory from the file
specified by f_name.
It opens the specified file with an fopen() call, allocates the space for the loaded
module in the heap, loads the segments from the file, links the module to the parent
module of the handle, relocates and initializes the loaded module. The file is closed
with fclose() before returning. This function calls the action callback functions for
the RL_ACTION_LOAD after loading and before executing any code in the loaded
module.
0 is returned if the load was successful, -1 is returned on failure and the error code
returned by rl_errno() is set accordingly.
152/246
8063762 Rev 9
ST200
Relocatable loader library
rl_load_stream
Definition:
Load a relocatable module into memory from a byte stream
typedef int rl_stream_func_t (
void *cookie,
char *buffer,
int length);
int rl_load_stream(
rl_handle_t *handle,
rl_stream_func_t *stream_func,
void *stream_cookie);
Arguments:
handle
The handle for the module.
stream_func
The user specified callback function.
stream_cookie
The user specified state.
Returns:
Returns 0 for success, -1 for failure.
Description:
The rl_load_stream() function loads a relocatable module into memory from a
byte stream provided through a user specified callback function stream_func and
the user specified state stream_cookie.
The callback function must be of type rl_stream_func_t. It is called multiple times
by the loader to retrieve the load module data in the buffer buffer of length length
until the module is loaded into memory. The loader always calls the callback function
with a buffer length strictly greater than 0. The stream_cookie argument passed to
rl_load_stream is passed to the callback function in its cookie parameter. The
cookie parameter is intended to be used by the callback function to update a private
state.
The callback function must return the number of bytes transferred. If the returned
value is less than the given buffer length or is -1, rl_load_stream() will in turn
return an error and the error code returned by rl_errno() is set accordingly.
The rl_load_stream() function allocates the space for the loaded module from
the heap, loads the segments by calling the callback function, links the module to the
parent module of the handle, relocates and initializes the loaded module. This
function calls the action callback functions for RL_ACTION_LOAD after loading and
before executing any code in the loaded module.
0 is returned if the load was successful, -1 is returned on failure and the error code
returned by rl_errno() is set accordingly.
This function can be used as an alternative to rl_load_buffer() or
rl_load_file() to allow any loading method to be implemented.
8063762 Rev 9
153/246
Relocatable loader library
ST200
The following example illustrates how the rl_load_file() function may be
implemented using the rl_load_stream() function:
/* User implementation of the callback function that read from
a file. */
static int rl_stream_read(FILE *file, char *buffer, int length)
{
int nbytes;
nbytes = fread(buffer, 1, length, file);
return nbytes;
}
...
{
/* Loads the module from a file.*/
FILE *file;
int status;
file = fopen(f_name, "rb");
if (file == NULL) { /*... error... */ }
status = rl_load_stream(handle, (rl_stream_func_t
*)rl_stream_read,
file);
if (status == -1) { /*... error... */ }
fclose(file);
}
...
rl_unload
Definition:
Unload a previously loaded relocatable module
int rl_unload(
rl_handle_t *handle);
Arguments:
handle
The handle for the module.
Returns:
Returns 0 for success, -1 for failure.
Description:
The rl_unload() function unloads a previously loaded relocatable module. It
finalizes, unlinks, and frees allocated memory for the loaded module. This function
calls the action callback functions for RL_ACTION_UNLOAD before unloading and
after having executed finalization code in the module.
The return value is 0 if the unloading is successful, otherwise the return value is -1
and the error code returned by rl_errno() is set accordingly.
154/246
8063762 Rev 9
ST200
rl_sym
Definition:
Relocatable loader library
Return a pointer reference to the symbol in the loaded module
void *rl_sym(
rl_handle_t *handle,
const char *name);
Arguments:
handle
The handle for the loaded module.
name
The symbol in the loaded module.
Returns:
The pointer reference to the symbol.
Description:
The rl_sym() function returns a pointer reference to the symbol named name in the
loaded module specified by handle. It searches the dynamic symbol table of the
loaded module and returns a pointer to the symbol. The handle parameter can be
the handle of any currently loaded module, or the handle of the main module.
If the symbol is not defined in the loaded module, NULL is returned. It is not generally
an error for this function to return NULL. For example, the user may conditionally call
a specific function only if it is defined in the module.
In this function, as well as in the rl_sym_rec() function, the name parameter must
be the mangled symbol name. For instance, on some targets, C names are mangled
by prefixing the name with an underscore (_). For example, to return a reference to
the printf() function, the symbol name passed to rl_sym() will be “_printf”.
Also, to access C++ symbols, the fully mangled name must be passed. The C++
mangling scheme is dependent on the processor specific C++ ABI implemented.
rl_sym_rec
Definition:
Return a pointer reference to the symbol in the loaded module or
one of its ancestors
void *rl_sym_rec(
rl_handle_t *handle,
const char *name);
Arguments:
handle
The handle for the loaded module.
name
The symbol in the loaded module.
Returns:
The pointer reference to the symbol.
Description:
The rl_sym_rec() function returns a pointer reference to the symbol named name
in the loaded module specified by handle or one of its ancestors.
This function searches the dynamic symbol table of the loaded module and returns a
pointer to the symbol if found. If the symbol is not found, the function iteratively
searches in the dynamic symbol table of the parent module until the symbol is found.
The handle parameter can be the handle of any currently loaded module, or the
handle of the main module.
If the symbol is not defined in the loaded module or one of its ancestors, NULL is the
returned. It is not generally an error for this function to return NULL.
The name parameter must be the mangled symbol name as for the rl_sym()
function.
8063762 Rev 9
155/246
Relocatable loader library
rl_foreach_segment
Definition:
ST200
Iterate over all the segments of loaded module and
call the supplied function
typedef rl_segment_info_t_ rl_segment_info_t;
typedef int rl_segment_func_t (
rl_handle_t *handle,
rl_segment_info_t *seg_info,
void *cookie);
int rl_foreach_segment(
rl_handle_t *handle,
rl_segment_func_t *callback_fn,
void *callback_cookie);
Arguments:
handle
The handle for the module.
callback_fn
The user specified callback function.
callback_cookie
The argument to pass to the function.
Returns:
Returns 0 for success, -1 for failure.
Description:
The rl_foreach_segment() function iterates over all the segments of the loaded
module handle and calls back the user supplied function. For each segment, the
function callback_fn is called with the following parameters.
handle
The handle passed to the function.
seg_info
The segment information pointer filled with the current
segment information.
cookie
The callback_cookie argument passed to the function.
The segment information returned in seg_info is a pointer to the following structure:
typedef unsigned int rl_segment_flag_t;
#define RL_SEG_EXEC
1
#define RL_SEG_WRITE
2
#define RL_SEG_READ
4
struct rl_segment_info_t_ {
const char *seg_addr;
unsigned int seg_size;
rl_segment_flag_t seg_flags;
};
The user callback function must return 0 on success or -1 on error.
In the case where the callback function returns an error, the
rl_foreach_segment() function returns -1 and the error code returned by
rl_errno is set to RL_ERR_SEGMENTF. Otherwise the function returns 0.
156/246
8063762 Rev 9
ST200
Relocatable loader library
rl_add_action_callback
Definition:
typedef
#define
#define
#define
Add a user action callback function to the user
action callback list
unsigned int rl_action_t;
RL_ACTION_LOAD
1
RL_ACTION_UNLOAD
2
RL_ACTION_ALL
((rl_action_t)-1)
typedef int rl_action_func_t (
rl_handle_t *handle,
rl_action_t action,
void *cookie);
int rl_add_action_callback(
rl_action_t action_mask,
rl_action_func_t *callback_fn,
void *callback_cookie);
Arguments:
action_mask
The set of actions for which the callback function must be
called.
callback_fn
The user specified callback function.
callback_cookie
The argument to pass to the function.
Returns:
Returns 0 for success, -1 for failure.
Description:
The rl_add_action_callback() function adds a user action callback function to
the user action callback list. It can be called multiple times with different callback
functions. The same callback function cannot be added more than once.
For each defined action, each callback function is called in the order it was added into
the callback list. The callback functions are not attached to a particular module and
are called for any further loaded/unloaded modules.
This function returns 0 on success and -1 on failure. It does not set any error codes.
This function can fail if a callback function is already in the callback list or if the
program goes out of memory.
The rl_action_t type defines the action flags for module loading/unloading and is
passed to the action function callback. The action flags can be OR-ed to create an
action mask that can be passed to the function rl_add_action_callback(). The
action defined are:
RL_ACTION_LOAD
The callback is called just after the module has been loaded in
memory and cache has been synchronized. No module code
has been executed.
RL_ACTION_UNLOAD The callback is called just before the module is unloaded from
memory. No module code will be executed after this point.
RL_ACTION_ALL
The callback will be called for any action.
8063762 Rev 9
157/246
Relocatable loader library
ST200
The type for the user action callback function is rl_action_func_t. The
parameters passed to the callback function when it is called are:
handle
The handle that performed the action.
action
The action performed.
cookie
The callback_cookie parameter passed to
rl_add_action_callback().
The callback function returns 0 on success and -1 on failure. In the case of failure, the
loading (or unloading) of the module is undone and the error code returned by
rl_errno() is set to RL_ERR_ACTIONF.
rl_delete_action_callback
Definition:
Remove the given function from the action
callback list
int rl_delete_action_callback(
rl_action_func_t *callback_fn);
Arguments:
callback_fn
The user specified callback function.
Returns:
Returns 0 for success, -1 if the callback was not present in the callback list.
Description:
The rl_delete_action_callback() function removes the specified callback
function from the action callback list. This function returns 0 if the callback was
removed, or -1 if it was not present in the callback list. No error code is set.
rl_errno
Definition:
Return the error code for the last failed function
int rl_errno(
rl_handle_t *handle);
Arguments:
The handle for the module.
handle
Returns:
The error code for the last failed function.
Description:
The rl_errno() function returns the error code for the last failed function. Table 34
lists the possible codes.
Table 34.
Errors returned by rl_errno()
Error code
Possible error causing
function
RL_ERR_NONE
No previous call has failed.
RL_ERR_MEM
Ran out of memory (rl_memalign()
failed).
rl_load_buffer(),
rl_load_file(),
rl_load_stream(),
rl_set_file_name()
The load module is not a valid ELF file.
rl_load_buffer(),
rl_load_file(),
rl_load_stream(),
rl_set_file_name()
RL_ERR_ELF
158/246
Diagnostic
8063762 Rev 9
ST200
Relocatable loader library
Table 34.
Errors returned by rl_errno() (continued)
Error code
Diagnostic
Possible error causing
function
RL_ERR_DYN
rl_load_buffer(),
rl_load_file(),
The load module is not a dynamic library.
rl_load_stream(),
rl_set_file_name()
RL_ERR_SEG
The load module has invalid segment
information.
rl_load_buffer(),
rl_load_file(),
rl_load_stream(),
rl_set_file_name()
RL_ERR_REL
The load module contains invalid
relocations.
rl_load_buffer(),
rl_load_file(),
rl_load_stream(),
rl_set_file_name()
RL_ERR_RELSYM
A symbol was not found a load time.
rl_errarg() returns the symbol
name.
rl_load_buffer(),
rl_load_file(),
rl_load_stream(),
rl_set_file_name()
RL_ERR_SYM
The symbol is not defined in the module.
rl_sym(),
rl_errarg() returns the symbol
rl_sym_rec()
name.
RL_ERR_FOPEN
The file cannot be opened by
rl_fopen().
rl_load_file()
RL_ERR_FREAD
Error while reading the file in
rl_fread().
rl_load_file()
RL_ERR_STREAM
Error while loading the file from a
stream.
rl_load_stream()
RL_ERR_LINKED
Module handle is already linked.
rl_load_file(),
rl_load_buffer(),
rl_load_stream(),
rl_handle_delete()
RL_ERR_NLINKED
Module handle is not linked
rl_unload(), rl_sym(),
rl_sym_rec(),
rl_foreach_segment()
RL_ERR_SEGMENTF
Error in segment function callback.
rl_foreach_segment()
RL_ERR_ACTIONF
Error in action function callback.
rl_load_file(),
rl_load_buffer(),
rl_load_stream()
8063762 Rev 9
159/246
Relocatable loader library
rl_errarg
Definition:
ST200
Return the name of the symbol that could not be resolved
const char *rl_errarg(
rl_handle_t *handle);
Arguments:
handle
The handle for the module.
Returns:
The name of the symbol that could not be resolved.
Description:
If rl_errno() returns either RL_ERR_RELSYM or RL_ERR_SYM, the rl_errarg()
function returns the name of the symbol that could not be resolved.
rl_errstr
Definition:
Return a string for an error code
const char *rl_errstr(
rl_handle_t *handle);
Arguments:
handle
The handle for the module.
Returns:
A string for the error code.
Description:
The rl_errstr() function returns a readable string for the error code reported by
rl_errno(). For example:
...
void *sym = rl_sym(handle, "symbol");
if (sym == NULL) fprintf(stderr, "failed: %s\n",
rl_errstr(handle));
...
If symbol is not defined in the module referenced by handle then the following
message is displayed:
failed: symbol not found: symbol
160/246
8063762 Rev 9
ST200
12.4
Relocatable loader library
Customization
The relocatable loader library defines a number of functions that it uses internally for
providing services such as heap memory management and file access. To provide custom
implementation of these functions, the application in the main module can override these
functions.
12.4.1
Memory allocation
void *rl_malloc(int size);
void *rl_memalign(int align, int size);
void rl_free(void *ptr);
These functions allocate free space for the load module image and for the handle objects.
The default behavior for these functions is to call the standard C library functions
malloc(), memalign() and free() respectively.
Note:
If providing a custom implementation, override all three functions.
12.4.2
File management
void *rl_fopen(const char *f_name, const char *mode);
int rl_fclose(void *file);
int rl_fread(char *buffer, int eltsize, int nelts, void *file);
The rl_load_file() function uses these functions to open, read and close a file handle.
The default behavior for these functions is to call the standard C library functions fopen(),
fread() and fclose() respectively.
Note:
If providing a custom implementation, override all three functions and link them with the
main program.
12.5
Building a relocatable library or main module
To build a relocatable library that can be loaded by the rl_lib loader, additional compile time
and link time options must be used.
The following is a simple example of building a hello world loadable module:
st200cc -o rl_hello.o -fpic -c rl_hello.c
st200cc -o rl_hello.rl --rlib rl_hello.o
Alternatively, the compile and link phases can be carried out with a single command:
st200cc -o rl_hello.rl -fpic --rlib rl_hello.c
To build a main module suitable for loading a relocatable library, specific link time options
are required. No specific compile time option are required for the main module.
The following is an example of building a main module:
st200cc -o prog.o prog.c
st200cc -o prog.exe --rmain prog.o
8063762 Rev 9
161/246
Relocatable loader library
ST200
The compile and link phases can be carried out with a single command:
st200cc -o prog.exe --rmain prog.c
12.5.1
Importing and exporting symbols
For the relocatable loader system to function, the main module (or a loaded module) must
provide services to the other load modules. To avoid a load error when loading a module, it
is usual for the referenced symbols to be linked into the main module.
When the services are present in a library, at the time of linking the main module, import the
corresponding symbols. To import symbols, the linker requires an import script.
The st200rltool utility can generate an import script. The following gives the two common
cases for generating an import script.
●
When the required services are well defined, pass the list of symbols to the st200rltool
utility.
●
When the list of services is not defined but the load modules are available, pass the
load modules to the st200rltool utility. The st200rltool utility generates an import
script from the set of symbols that the load modules require.
The following command generates an import script from a list of symbols specified in the file
prog_import.lst (one symbol per line):
st200rltool -i -s -o prog_import.ld prog_import.lst
The following command generates an import script that the main module can load from a list
of load modules, liba.rl and libb.rl:
st200rltool -i -o prog_import.ld liba.rl libb.rl
Use the import script to link the main module, for example:
st200cc -o prog.exe --rmain object_files.o prog_import.ld
In addition to import scripts, the st200rltool utility can also generate export scripts that
reduce the size of the dynamic symbol table in the main module or the load modules. The
export script defines the set of symbols (and only these) that must be exported to the other
modules through the dynamic symbol table. These symbols are then accessible by the load
time symbol binding process and by the calls to rl_sym() and rl_sym_rec(). The
export script is not mandatory as all global symbols are exported (by default).
There are two common cases for generating export scripts.
●
When an import script is required for the module, the export script can be generated at
the same time. This is because the symbols to export are generally those that are
imported.
●
For a load module that has a well known external interface, the export script can be
generated from a list of symbols to export.
The following example shows how to generate an export script and import script for a list of
modules that is then used when linking the main module. Only the symbols from liba.rl
and libb.rl are imported into the main module and exported by it.
st200rltool -i -e -o prog_import_export.ld liba.rl libb.rl
st200cc -o prog.exe --rmain object_files.o prog_import_export.ld
162/246
8063762 Rev 9
ST200
Relocatable loader library
To generate an export script for a load module with a well defined interface specified in the
file liba_export.lst (one symbol per line):
st200rltool -e -s -o liba_export.ld liba_export.lst
st200cc -o liba.rl --rlib *.o liba_export.ld
12.5.2
Optimization options
When compiling a load module with the -fpic option, some overhead occurs in the
generated code to access functions and data objects. Compiler options and C language
extensions can be used to reduce this overhead.
Relocatable libraries are not subject to symbol preemption, therefore, when generating
position independent code, the -fvisibility=protected option can be used in addition
to -fpic. The -fvisibility=protected option enables the inlining of global functions
and can be used as a default option for compiling relocatable libraries. For example:
st200cc -o a.o -fpic -fvisibility=protected a.c
In addition to this option, fine grain visibility can be specified with the
__attribute__((visibility(...)) GNU C extension at the source code level.
For example, if the external interface of a load module is well defined in a header file, the
__attribute__((visibility("protected")) can be attached to each function of
the external interface. To specify that all other defined functions are internal to the load
module, on the command line, use the -fvisibility=hidden option. This combination
of options optimize references from the same file to global objects that are not part of the
interface.
To specify the visibility of each symbol externally with the given <file>, use the
-mvisibility-decl=<file> option. In the case where the external services required by
a module (default visibility) and the external services provided by the module (protected
visibility) are known, all other functions or data objects can be declared as internal (hidden
visibility). This option can be used to specify these visibility declarations. In this case, only
the functions that are external have an associated overhead. The other internal functions
have a very reduced overhead.
For a full inter-procedural optimization of the relocatable library, use the -ipa option. In this
case, when combined with the declaration of external functions, the library is generated with
a minimal overhead for the dynamic linking support.
For detailed information on the visibility specification, refer to the compiler options
documentation and to the ELF System V Dynamic Linking ABI.
8063762 Rev 9
163/246
Relocatable loader library
12.6
ST200
Debugging support
The debugging of dynamically loaded modules is possible in the same way as for System V
dynamic shared objects. The main module debugging information loads at load time of the
application. The load modules debugging information loads at load time of the load
modules.
To update debugging information, the loader maintains a list of loaded modules together
with their filenames (the file contains the debugging information) and the load address of the
module. Each time a new module loads, the loader calls a specific function. The debugger
has to set a breakpoint on this specific function and, when the breakpoint is hit, traverse the
list to find new loaded modules and load the debugging information.
For the ST200 toolset, the debugger implements the required mechanism for the automatic
debugging of loaded modules.
To find the file that contains the debug information, the loader must know the path to the
load module. This is automatic in the case of rl_load_file() as the filename is specified
in the interface. For the rl_load_buffer() and rl_load_stream() functions, the user
must set the filename with a call to the rl_set_file_name() function.
For example, the following code enables automatic debugging of a load module loaded with
rl_load_buffer():
{
int status;
rl_handle_t *handle = rl_handle_new(rl_this(), 0);
if (handle == NULL) { /* error */ }
#ifdef DEBUG_ENABLED
rl_set_filename(handle, "path_to_the_file_for_the_module");
#endif
status = rl_load_buffer(handle, module_image);
if (status == -1) { /* error */ }
...
}
164/246
8063762 Rev 9
ST200
12.7
Relocatable loader library
Profiling support
The action callbacks may be used with a profiling support library, or alternatively, a user
defined package can be informed that a segment has just been loaded or is on the point of
being unloaded by using the user action callback interface.
Below is an example that iterates over the segment list and declares the executable
segments to a profiling support library on the loading/unloading of a module.
static int segment_profile(rl_handle_t *handle, rl_segment_info_t
*info,
void *cookie)
{
rl_action_t action = *((rl_action_t *)cookie);
const char *file_name = handle_file_name(handle);
if (file_name != NULL && (info->seg_flags & RL_SEG_EXEC) {
if (action == RL_ACTION_LOAD) {
/* Call profiling interface for adding a code region. */
profiler_add_region(file_name, info->seg_addr,
info->seg_size);
}
if (action == RL_ACTION_UNLOAD) {
/* Call profiling interface for removing a code region. */
profiler_remove_region(file_name, info->seg_addr,
info->seg_size);
}
}
return 0;
}
static int module_profile(rl_handle_t *handle, rl_action_t action,
void *cookie)
{
rl_foreach_segment(handle, segment_profile, (void *)&action);
return 0;
}
int main()
{
...
if (rl_add_action_callback(RL_ACTION_ALL, module_profile,
NULL)==-1){
fprintf(stderr, "rl_add_Action_callback failed\n");
exit(1);
}
...
status = rl_load_file(handle, file_name);
...
return 0;
}
8063762 Rev 9
165/246
Relocatable loader library
12.8
ST200
Memory protection support
When a new library segment has loaded into memory or is on the point of being unloaded
from memory, a system library (or the user) can use the user-action callback interface to
install a memory protection scheme.
To set user protection support, use the user-action callback, see Section 12.7: Profiling
support.
12.9
Load time decompression
The loader does not perform load time decompression. It is possible that this will change in
a future extension and the loader may load compressed or uncompressed code without
change to the interface.
For loading a compressed image of a load module into memory, use the
rl_load_stream() interface. In this case, the user must implement the decompression of
the stream in the callback function.
166/246
8063762 Rev 9
ST200
13
Dynamic OS21 profiling
Dynamic OS21 profiling
The ST200 Micro Toolset supports profiling using the OS21 profiler under the control of
GDB. For this, an application is linked with the dynamic OS21 profiler library. This library
enables GDB to control all aspects of the OS21 profiler by sending requests to the
application to configure, start and stop the OS21 profiler using standard OS21 APIs. Also,
GDB can write the data gathered by the OS21 profiler directly to a file on the host without
sending a request to the application. The profile data obtained by GDB can be analyzed
using the os21prof tool. For more information about OS21 profiling, see the OS21 user
manual (7358306).
For details of the GDB commands available to control the OS21 profiler, see Section 13.4:
GDB commands on page 168).
13.1
Overview
The dynamic OS21 profiler adds a monitor task to the application(a). The purpose of the
monitor task is to call OS21 profiler APIs on behalf of GDB.
When GDB needs to call an OS21 profiler API, it writes an action request to a structure in
target memory and then raises the OS21 interrupt OS21_INTERRUPT_DEBUGGER (reserved
for exclusive use by GDB). When the target is restarted, the monitor task is woken up and it
reads the structure and performs the requested action. On completion of the action, the
monitor task writes the result back to the same structure and calls a signal function to inform
GDB. GDB can then read the structure and report the result of the request to the user.
The interface between GDB and the monitor task can be configured by the user. For details
of the configuration options, see Section 13.7.2: Overrides on page 173.
a. The monitor task has the name OS21 Profiler in the OS21 task list.
8063762 Rev 9
167/246
Dynamic OS21 profiling
13.2
ST200
Building an application for dynamic OS21 profiling
Table 35 lists the st200cc linker options required to enable the dynamic OS21 profiling
features.
Table 35.
st200cc linker options to enable dynamic OS21 profiling
s200cc options
-profiler
Description
Initialize dynamic OS21 profile support.
– The dynamic OS21 profiler constructor is called by the OS21
API function kernel_start().
– The dynamic OS21 profiler destructor is called during OS21
shutdown.
Adding this option to the -profiler one disables the automatic
initialization of the dynamic OS21 profiler. This option also
prevents the destructor for the dynamic OS21 profiler from being
-profiler-no-constructor
installed. In this case the initialization and the deinitialization of
the dynamic OS21 profiler must be performed explicitly by the
application (see Chapter 13.7: Profiler library API).
13.3
Running the application
By default, an application built with dynamic OS21 profiling support initially starts with OS21
profiler disabled. To enable the GDB control of the dynamic OS21 profiler, use the following
command:
source os21profile.cmd
See Section 13.4: GDB commands on page 168 for a complete list of commands.
13.4
GDB commands
This section contains a list of the dynamic OS21 profiler GDB commands accessible when
the file os21profiler.cmd is sourced within GDB. For information on a given command,
use the GDB command help command.
OS21 profiler initialization
Use the following commands to initialize and de-initialize profiling.
os21_profiler_initialize instructions-per-bucket frequency
Configures the OS21 profiler by calling the OS21 API profile_init(). If profiling
has already been configured, this command removes the existing configuration by
calling profiler_deinit() and reconfigures it with the new parameters. If the
OS21 profiler is currently running when this command is issued, the OS21 API
profiler_stop() is called first.
168/246
8063762 Rev 9
ST200
Dynamic OS21 profiling
This command accepts two arguments:
–
instructions-per-bucket
The number of instructions allocated to a single bucket when capturing profile
data. (A bucket is a counter associated with an address range.)
–
frequency
Indicates the frequency that samples are to be taken, in hertz.
For example:
os21_profiler_initialize 16 5000
initializes the OS21 profiler to use 16 instructions per bucket and a sampling frequency
of 5 KHz.
os21_profiler_deinitialize
Destroys the OS21 profiler by calling the OS21 API profile_deinit() to release
the memory and resources allocated by profiler_init(). If the OS21 profiler is
currently running when this command is issued, the OS21 API profiler_stop() is
called first.
OS21 profiler start
When the OS21 profiler has been initialized, use one of the following commands to start
profiling. If the OS21 profiler is already running, the OS21 API profiler_stop() is called
first.
os21_profiler_start_all
Starts the system-wide OS21 profiler (that is, profiling every task and interrupt level) by
calling the OS21 API profile_start_all().
os21_profiler_start_interrupt interrupt-level
Starts the OS21 profiler for the specified interrupt level by calling the OS21 API
profile_start_interrupt().
os21_profiler_start_task task-handle
Starts the OS21 profiler for the task specified by task-handle by calling the OS21
API profile_start_task(). The argument task-handle is the address of an
OS21 task_t object. This address can be extracted from the thread list reported by
GDB.
os21_profiler_start_task_number task-number
Starts the OS21 profiler for the task specified by task-number, where task-number
is the OS21 task number, and not the number assigned to the task by GDB.
This command converts task-number into a task-handle by scanning the OS21
task list(b). The command then calls the OS21 API profile_start_task() with
task-handle.
b. Target memory is read when scanning the task list.
8063762 Rev 9
169/246
Dynamic OS21 profiling
ST200
OS21 profiler contextual initialization and start
The OS21 dynamic profiler can be initialized and started using the following combined
commands:
os21_profiler_initialize_and_start_all instructions-per-bucket frequency
os21_profiler_initialize_and_start_interrupt instructions-per-bucket frequency level
os21_profiler_initialize_and_start_task instructions-per-bucket frequency task
os21_profiler_initialize_and_start_task_number instructions-per-bucket frequency>
task-number
Each command is equivalent to the corresponding two line sequence:
os21_profiler_initialize instructions-per-bucket frequency
os21_profiler_start_* options
OS21 profiler stop
Use the following command to stop profiling.
os21_profiler_stop
Stops the OS21 profiler by calling the OS21 API profile_stop().
OS21 profiler write data
Use the following commands to write the gathered profile data to a file.
os21_profiler_write file
Writes the OS21 profile data to file by calling the OS21 API profiler_write(). If
the OS21 profiler is currently running, the OS21 API profiler_stop() is called first.
os21_profiler_dump file
Writes the OS21 profile data to file. The OS21 profiler does not stop if it is currently
running.
After invoking any of the commands listed above, restart the target to perform the requested
action.
Note:
The os21_profiler_dump command has immediate effect and therefore the target does
not have to be restarted in this case.
OS21 profiler cancel
Use the following command to cancel a previous command.
os21_profiler_cancel
Cancel a previous command if that command is still pending (that is, the dynamic
OS21 profiler is not in the BUSY state as reported by the
show_os21_profiler_monitor_status command).
Note:
170/246
All the commands listed above automatically cancel a previous command if it is still pending,
except for os21_profiler_dump, which has immediate effect.
8063762 Rev 9
ST200
Dynamic OS21 profiling
OS21 profiler status reporting
The reporting of the status of a OS21 profiler request is achieved by placing breakpoints on
the signal function called by the application when an action has been completed (see
os21_profiler_signaled on page 173). The effect of these breakpoints is controlled by the
following commands, which enable or disable the reporting the result of the request and
control the restart mode of the target:
enable_os21_profiler_report_signaled
Enable OS21 profiler request reporting. The target is automatically restarted after
reporting the result of the request.
disable_os21_profiler_report_signaled
Disable OS21 profiler request reporting.
enable_os21_profiler_stop_signaled
disable_os21_profiler_stop_signaled
The same as above, but the target remains stopped and must be manually restarted.
Profiler monitor status
show_os21_profiler_monitor_status
Show the status of the OS21 profiler monitor. Table 36 gives a list of possible states.
Table 36.
OS21 profiler monitor state
State
Description
INACTIVE
The monitor is not initialized.
IDLE
The monitor is waiting to perform an action.
BUSY
The monitor has yet to complete the action.
Profiler status
show_os21_profiler_status
Show the status of the OS21 profiler (including the type if active). Table 37 gives a list
of possible states.
Table 37.
OS21 profiler state
State
Description
INACTIVE
The profiler is not initialized.
INITIALIZED
The profiler is initialized but not started.
STARTED(1)
The profiler is running.
(1)
The profiler is stopped.
STOPPED
1. In this state, profile data is available for dumping by the os21_profiler_dump command.
show_os21_profiler_internal_status
This is similar to show_os21_profiler_status except that it shows the internal
status of the OS21 profiler.
8063762 Rev 9
171/246
Dynamic OS21 profiling
13.5
ST200
Analyzing the results
After the OS21 profile data has been saved (using the os21_profile_write or
os21_profile_dump commands), use the os21prof tool to perform the analysis.
The command line to invoke the os21prof tool is as follows:
os21prof executable-file profile-file
Information on the os21prof tool can be found in the OS21 user manual (7358306).
13.6
Example
The example examples/os21/profiling_os21 contains the source code of a simple
OS21 multitasking application and the GDB script for a GDB dynamic profiling session.
13.7
Profiler library API
The dynamic OS21 profiler library is provided as libos21profiler.a and its associated
header file is os21profiler.h.
13.7.1
Function definitions
This sections lists the function definitions for the dynamic OS21 profiler library.
os21_profiler_initialize
Definition:
Initialize profiling
typedef struct os21_profiler_init_s {
size_t instrs_per_bucket;
int hz;
} os21_profiler_init_t;
int os21_profiler_initialize(
const os21_profiler_init_t *init);
Arguments:
A structure init with the following fields:
instrs_per_bucket
The number of instructions included in each bucket.
hz
The sampling frequency in hertz.
Returns:
OS21_SUCCESS for success, or OS21_FAILURE if called with invalid parameters, or if
out of memory.
Description:
Use this function to initialize the dynamic OS21 profiler. If init is not NULL, then this
function calls the OS21 API profile_init(), using the contents of the
os21_profiler_init_t structure. If init is NULL, then profile_init() is not
called.
The dynamic OS21 profiler constructor invokes this function with a default
initialization parameter of NULL. The user can override this default. See
Section 13.7.2: Overrides.
172/246
8063762 Rev 9
ST200
Dynamic OS21 profiling
os21_profiler_deinitialize
Deinitialize profiling
Definition:
int os21_profiler_deinitialize(void);
Arguments:
None
Returns:
OS21_SUCCESS for success, or OS21_FAILURE if the dynamic OS21 profiler cannot
be deinitialized.
Definition:
Use this function to deinitialize the dynamic OS21 profiler. This function stops the
OS21 profiler (if it is running), releases all memory and resources allocated by
os21_profiler_initialize().
os21_profiler_signaled
User defined signal function
Definition:
void os21_profiler_signaled(void);
Arguments:
None
Returns:
None
Definition:
The dynamic OS21 profiler calls a function with this name when it completes an
action requested by the user from GDB.
The default implementation of this function is a stub that the user can override with
their own implementation.
13.7.2
Overrides
Customizing the constructor
The dynamic OS21 profiler provides constructor and destructor functions. The user may
customize the constructor by overriding the os21_profiler_constructor_init
variable.
os21_profiler_init_t os21_profiler_constructor_init;
The init argument passed to os21_profiler_initialize(). If this is not
defined, NULL is passed to this function.
Configuration of the dynamic OS21 profiler monitor task
The dynamic OS21 profiler uses a dedicated task to monitor for user requests from GDB.
See Section 13.1: Overview on page 167 for details. In the default configuration, GDB uses
the OS21 OS21_INTERRUPT_DEBUGGER interrupt to signal the monitor task of a pending
action. The user may change the interrupt used for signalling the monitor task by overriding
the following items.
●
Define the symbol:
interrupt_name_t os21_profiler_monitor_interrupt;
to specify the interrupt that GDB uses to signal to the monitor task. The default is
OS21_INTERRUPT_DEBUGGER. This should not normally need changing. This override
is defined using the linker --defsym option, as follows:
-Wl,--defsym,os21_profiler_monitor_interrupt=OS21_INTERRUPT_name
8063762 Rev 9
173/246
Dynamic OS21 profiling
●
ST200
If the symbol _os21_profiler_monitor_interrupt is defined, the dynamic OS21
profiler calls an external function (supplied by the user) to clear the interrupt. The
function has the following prototype:
void os21_profiler_monitor_interrupt_clear(interrupt_t *handle);
●
Define the GDB command os21_profiler_signal_raise to raise the interrupt
specified by the symbol _os21_profiler_monitor_interrupt.
This command is required only if the interrupt to be raised is not the default
(OS21_INTERRUPT_DEBUGGER).
If no interrupt is available, the monitor task can be configured to check periodically if an
action needs to be performed. The dynamic OS21 profiler provides the following variables to
configure this operation.
unsigned int os21_profiler_monitor_wakeup_period;
Use this variable to specify the frequency (in hertz) at which the monitor task is to
check if an action has been requested. The higher the frequency, the greater the
intrusion on the operation of the application. The default is 1 KHz.
unsigned int os21_profiler_monitor_priority;
Use this variable to define the priority at which the monitor task runs. By default, this is
the maximum OS21 priority (OS21_MAX_USER_PRIORITY). It should not be changed
unless the monitor task has been configured to periodically check if an action has been
requested. Reducing the priority of the monitor task increases the latency between the
request being raised and the monitor task performing the action.
174/246
8063762 Rev 9
ST200
Toolset tips
Appendix A
Toolset tips
The following sections give tips for using the ST200 Micro Toolset.
A.1
Managing memory partitions with OS21
For managing areas of memory, OS21 enables the creation of memory partitions, see the
OS21 user manual (7358306). There are several reasons for creating memory partitions, for
example:
●
to implement an allocation algorithm that is appropriate to an application (for example,
to apply some alignment constraint to allocated blocks)
●
to manage a special area of memory not visible to the normal memory managers (for
example, on-chip RAM or peripheral device RAM)
●
to manage a memory region that has special caching issues
To manage a memory partition, do the following.
1.
Find the location of the memory and its size. This can be implicitly known, for example,
the address and size of on-chip RAM is a characteristic of the CPU.
To select a pool of memory to manage with an allocator:
–
declare it statically:
static unsigned char *my_device_RAM = SOME_ADDRESS;
–
allocate it from another partition:
static unsigned char my_static_pool [65536];
–
allocate it from the general heap
unsigned char *my_alloced_pool = malloc (65536);
2.
Select the allocation strategy to use with the memory. OS21 has three managers, see
Section A.2: Memory managers on page 177.
my_pp = partition_create_simple (my_pool, 65536);
my_pp = partition_create_fixed (my_pool, 65536, block_size);
my_pp = partition_create_heap (my_pool, 65536);
Alternatively, use a special purpose allocator. Use the partition_create_any()
call to create a partition that uses the required memory management implementation.
This call takes the size of a control structure (that the allocator uses to manage the
memory) and the addresses of functions (that perform allocation, freeing, reallocation
and status reporting).
The following example implements a simple linear allocator, with no free or realloc
methods.
#include <os21.h>
#include <stdio.h>
/*
* Declare memory to be managed by our partition
*/
static unsigned char my_memory[65536];
/*
* Declare the management data we use to control the partition
*/
8063762 Rev 9
175/246
Toolset tips
ST200
typedef struct
{
unsigned char * base;
unsigned char * limit;
unsigned char * free_ptr;
} my_state_t;
/*
* Allocation routine - really simple!
*/
static void *my_alloc(my_state_t *state, size_t size)
{
void *ptr = NULL;
if(size && ((state->free_ptr + size) < state->limit))
{
ptr = state->free_ptr;
state->free_ptr = state->free_ptr + size;
}
return ptr;
}
/*
* Partition status routine
* Note that status->partition_status_used is not filled
* in here - partition_status sets this field automatically.
*/
static int my_status(my_state_t *state,
partition_status_t *status,
partition_status_flags_t flag)
{
status->partition_status_state = partition_status_state_valid;
status->partition_status_type = partition_status_type_user;
status->partition_status_size = state->limit - state->base;
status->partition_status_free = state->limit - state->free_ptr;
status->partition_status_free_largest = state->limit state->free_ptr;
}
/*
* Initialization routine, called when a partition is created
*/
static void my_initialize(partition_t *pp,
unsigned char *base,
size_t size)
{
my_state_t *state = partition_private_state(pp);
state->free_ptr = base;
state->base = base;
state->limit = base + size;
}
int main(void)
{
partition_t *pp;
void *ptr;
/*
* Start OS21
*/
176/246
8063762 Rev 9
ST200
Toolset tips
kernel_initialize(NULL);
kernel_start();
/*
* Create new partition
*/
pp = partition_create_any(sizeof (my_state_t),
(memory_allocate_fn)my_alloc,
NULL, /* no free method */
NULL, /* no realloc method */
(memory_status_fn)my_status);
/*
* Initialize it
*/
my_initialize(pp, my_memory, sizeof(my_memory));
/*
* Try it out!
*/
printf("Alloc 16 bytes : %p\n", memory_allocate(pp, 16));
printf("Alloc 10 bytes : %p\n", memory_allocate(pp, 10));
printf("Alloc 1 bytes : %p\n", memory_allocate(pp, 1));
printf("Done\n");
return 0;
}
A.2
Memory managers
The run-time libraries have several memory managers. These provide heap, simple and
fixed block allocators. The OS21 heap algorithm is very simple, It maintains a single free list
of blocks, and allocates from the first one which can satisfy the request. Blocks added to the
free list are coalesced with neighbors to reduce fragmentation.
When OS21 is built with the -DCONF_DEBUG_ALLOC option specified, the partition manager
in OS21 can provide extensive run-time checking for all partitions, including those
maintained by user-supplied routines, see Section A.1 on page 175.
With the -DCONF_DEBUG_ALLOC option enabled, the partition manager over-allocates and
places scribble guards above and below the block of memory that is passed back to the
user. These guards are filled with a known pattern when the block is allocated and are
checked when the block is freed in order to detect writes that have occurred outside of the
block (for example, writing past the end of an array). When OS21 terminates, the partition
manager reports any blocks of memory that are allocated but not freed.
newlib provides Doug Lea’s allocator (version 2.6.4). The design of Doug Lea’s allocator is
discussed at length in gee.cs.oswego.edu/dl/html/malloc.html. The design goals for this
widely used allocator include minimizing execution time and memory fragmentation.
newlib can be rebuilt with debugging switched on in malloc_r.c (-DDEBUG) to enable
extensive run-time checking. With debugging enabled, calls to malloc_stats() and
mallinfo() attempt to check that every memory block in the heap is consistent.
8063762 Rev 9
177/246
Toolset tips
A.3
ST200
OS21 scheduler behavior
The scheduler in OS21 provides priority-based preemptive FIFO scheduling with optional
timeslicing. The following list summarizes its behavior.
A.4
●
256 priority levels.
●
FIFO scheduling within priority level.
●
Tasks get preempted when higher priority tasks become runnable.
●
Preemption can be disabled and re-enabled with task_lock() and
task_unlock(), see task_lock() and task_unlock().
●
Preemptions held pending while task_lock() is in effect, occur when
task_unlock() releases the lock.
●
Tasks which get preempted are placed at the head of the run queue for their priority
level.
●
Tasks which yield are placed at the tail of the run queue for their priority level.
●
Tasks which become runnable are placed at the tail of the run queue for their priority
level.
●
Tasks which get timesliced are placed at the tail of the run queue for their priority level.
●
Timeslicing is optional (off by default), and can be enabled or disabled by calling
kernel_timeslice().
●
The default timeslice frequency is 50 Hz.
●
The timeslice frequency can be set between 1 and 500 Hz by changing the value of the
variable bsp_timeslice_frequency_hz, either before calling
kernel_initialize(), or in the BSP library routine bsp_initialize().
Managing critical sections in OS21
A critical section is a region of code where exactly one thread of execution can run at any
one time. There are two forms of critical section to consider:
A.4.1
●
task / interrupt
●
task / task
task / interrupt critical sections
Within the context of a running task, task / interrupt critical sections are implemented by
masking interrupts so that the interrupt handler you are serializing with cannot run. OS21
has three calls for interrupt masking and unmasking.
interrupt_mask(), interrupt_mask_all() and interrupt_unmask()
This OS21 API enables the priority level of the CPU to be raised and lowered. The CPU’s
interrupt level provides a simple mechanism to mask interrupts from reaching the CPU. Any
interrupts that have a priority that is strictly greater than the CPU’s interrupt priority can
interrupt the CPU. Any interrupts that have a priority less than or equal to the CPU’s
interrupt priority are masked out and cannot therefore affect the CPU.
The CPU’s interrupt level is normally zero, meaning that all interrupts are unmasked. Any
interrupt masked by the CPU’s interrupt level when it becomes active, is asserted to the
CPU when the CPU’s interrupt priority is lowered below that of the active interrupts.
178/246
8063762 Rev 9
ST200
Toolset tips
To serialize with an interrupt handler that is interrupting at level X, only the interrupts up to
level X need to be masked. This stops all interrupts with a priority less than or equal to X
from reaching the CPU, but leaves higher priority interrupts unaffected.
interrupt_mask() sets the CPU’s interrupt level to the value specified, and
interrupt_mask_all() sets the CPU’s interrupt level to its maximum.
To prevent pre-emption, interrupt_mask() and interrupt_mask_all() also perform
an implicit task_lock(). This is because if a context switch occurs while under an
interrupt_mask(), the CPU’s interrupt priority would be changed to the value required
by the incoming task which breaks the critical section. Ensure that an explicit deschedule
does not occur while interrupts are masked (for example, blocking on a busy semaphore or
mutex).
A.4.2
task / task critical sections
OS21 has a number of mechanisms for achieving task / task critical sections, each of which
has its own cost and benefit.
task_lock() and task_unlock()
These calls provide a lightweight mechanism to prevent preemption. With a task_lock()
the running task is guaranteed so that the scheduler does not preempt it if a higher priority
task becomes runnable, or a timeslice interrupt occurs. In addition, any calls to
task_reschedule() have no effect.
It is possible for the running task to explicitly give up the CPU while a task_lock() is
active. This is the only way to schedule another task while the running task holds a
task_lock(). Explicit yielding of the CPU occurs when the running task calls either
task_yield() or a blocking OS21 function, for example:
●
calls to task_delay() or task_delay_until() specifying a time in the future
●
waiting on an unposted event flag, busy semaphore or empty message queue with the
timeout period not set to TIMEOUT_IMMEDIATE
●
waiting for a busy mutex
When the running task resumes execution, OS21 automatically reinstates task_lock().
Due to the critical section provided by task_lock() and task_unlock() being broken, if
the task blocks, it is weak. If a strong critical section is required when using these calls,
ensure that called functions do not block. This is not always possible, for example, when
calling a library function.
Advantages:
●
light weight
●
no need to allocate a synchronization object
●
critical sections can nest
Disadvantages:
●
critical sections broken if the running task explicitly blocks
8063762 Rev 9
179/246
Toolset tips
ST200
Mutexes
Mutexes in OS21 provide robust critical sections. The critical section remains in place even
if the task in the critical section blocks. Exactly one task is able to own a mutex at any one
time. OS21 has two forms of mutex: FIFO and priority.
FIFO mutexes have the simplest semantics. When tasks try to acquire a busy FIFO mutex
they are queued in request order. When a task releases a FIFO mutex, ownership is passed
to the task at the head of the waiting queue, and it is unblocked.
Priority mutexes are more complex. When tasks try to acquire a busy priority mutex, they
are queued on the mutex in order of descending task priority. In this way, the task at the
head of the wait queue is always the one with the highest priority, regardless of when it
attempted to acquire the mutex.
Priority mutexes also implement what is known as priority inheritance. This mechanism
temporarily boosts the priority of the task that owns a mutex to be the same as the priority of
the task at the head of the wait queue. When the owning task releases the mutex, its priority
is returned to its original level. This behavior prevents priority inversion, where a low priority
task can effectively prevent a high priority task from running. This can happen if a low
priority task owns a mutex which a high priority task is waiting for, and a mid level priority
task starts running, the low priority task cannot run and therefore cannot release the mutex,
causing the high priority task to wait.
Ownership of FIFO or priority mutexes has the effect of making the task immortal, that is,
immune to task_kill(). This is intended to prevent deadlock in the event that a task
owning a mutex is killed; the mutex would otherwise be left owned by a dead task and
therefore it would be locked out for ever. If task_kill() is carried out on a mutex owning
task, the task remains running until it releases the mutex, at which point the task_kill()
is actioned.
Both forms of mutex can be recursively taken by the owning task without deadlock.
Advantages:
●
robust critical section
●
can be recursively taken without deadlock
●
tasks are immortal while holding a mutex
●
FIFO mutexes provide strictly fair access to the mutex
●
priority mutexes provide priority ordered access, with priority inheritance
Disadvantages:
180/246
●
mutexes have to be created before they can be used
●
more costly than task_lock() and task_unlock()
●
priority mutexes have a higher cost than FIFO mutexes, due to priority inheritance logic
●
strictly for task / task interlock, cannot be used by interrupt handlers
8063762 Rev 9
ST200
Toolset tips
Semaphores
Semaphores in OS21 can be used for a variety of purposes, see the OS21 for ST200 user
manual (7410372). They can be used to provide a robust critical section, in a similar fashion
to mutexes, but with some major differences.
●
Semaphores cannot be taken recursively; any attempt to do this results in deadlocking
the calling task.
●
Like mutexes, there are both FIFO and priority queuing models, but unlike priority
mutexes, priority semaphores do not implement priority inheritance.
●
Tasks are not automatically made immortal when they acquire a semaphore.
●
Semaphores can be used with care from interrupt handlers.
Advantages:
●
Robust critical section.
●
FIFO and priority queuing models are available, but no priority inheritance.
●
No difference in cost between a FIFO and a priority semaphore.
●
Due to simpler semantics, there is slightly lower execution cost compared to mutexes.
●
If TIMEOUT_IMMEDIATE is used when trying to acquire and the interrupt handler is
written to cope with not acquiring the semaphore, semaphores can be used in an
interrupt handler.
Disadvantages:
●
Semaphores have to be created before they can be used.
●
More costly than task_lock() and task_unlock().
●
Cannot be taken recursively because the system deadlocks.
●
No immortality while holding; killing an owning task would be dangerous.
Disabling timeslicing
When running with timeslicing enabled and a very light weight task / task critical section is
required (which does not involve accessing a synchronization object), it is possible to
temporarily disable timeslicing. For example:
kernel_timeslice (0);
...critical section...
kernel_timeslice (1);
Use this approach carefully as the kernel_timeslice() API has an immediate global
effect. If the task blocks in this region (for example, calls task_delay(), blocks waiting for
a synchronization object, or signals a synchronization object and gets preempted as a
result), then timeslicing remains disabled for all other tasks. This can result in a task not
timeslicing in order to share the CPU.
8063762 Rev 9
181/246
Toolset tips
A.5
ST200
Access to uncached memory
To get uncached views of physical memory, use the OS21 virtual memory API.
The following is the sequence of OS21 virtual memory API calls.
1.
To obtain the physical address for the virtual address to be accessed through an
uncached view, call vmem_virt_to_phys().
2.
To obtain a virtual address that gives an uncached view of the physical memory, call
vmem_create() with the physical address obtained in step 1. with the mode
VMEM_CREATE_UNCACHED|VMEM_CREATE_READ|VMEM_CREATE_WRITE.
3.
To release the virtual address when it is no longer required, call vmem_delete() with
the virtual address obtained in step 2.
If the virtual address has been dynamically mapped through the MMU, use
vmem_delete() to release a UTLB entry for reuse. This reduces page faults and
improves performance.
The following example uses the OS21 virtual memory APIs:
void *dev_phys;
struct device *dev, *dev_uc;
/*... */
assert(vmem_virt_to_phys(dev, &dev_phys) == OS21_SUCCESS);
dev_uc = (struct device *)
vmem_create(dev_phys, sizeof(struct device), NULL,
VMEM_CREATE_UNCACHED|VMEM_CREATE_READ|VMEM_CREATE_WRITE);
assert(dev_uc != NULL); /*... */
assert(vmem_delete(dev_uc) == OS21_SUCCESS);
182/246
8063762 Rev 9
ST200
Toolset tips
A.6
Debugging with OS21
Note:
Further information on debugging can be found in the Debugging with GDB manual.
A.6.1
Understanding OS21 stack traces
Every time OS21 is entered through an interrupt or exception, OS21 captures the context of
the CPU on the current stack. If interrupts nest, it captures multiple contexts, one for each
interrupt. The information stored includes the complete register state of the CPU, details of
what caused the context to be saved (interrupt or exception) and the task that was active at
the time.
Whenever an unexpected exception occurs, it produces a stack trace. On the ST200, these
stack traces have the following general form:
OS21: ============================================================
OS21: Stack trace (<n> of <N>)
OS21: Fatal exception detected: ST200 exception code
OS21: Description of exception, possibly with faulting address
+ OS21: Active Task ID
: task ID
+ OS21: Active Task Stackp: stack pointer
+ OS21: Active Task name : task name
<Register dump>
Note:
The lines marked with a ‘+’ are shown only if the stack frame belongs to a task, not if the
stack frame belongs to an interrupt handler.
The stack trace shows the state of the CPU at the time the exception occurred. It should be
possible to ascertain the cause of the exception from the description of the exception,
reported faulting addresses and the register dump.
For example, the following program creates a task that contains a deliberate misaligned
write to memory.
#include <os21.h>
void my_task(void *ptr)
{
*((unsigned int*)ptr) = 0xBA49;
}
int main (void)
{
kernel_initialize(NULL);
kernel_start();
(void)task_create(my_task, (void*)0x12344321, 32768,
OS21_MAX_USER_PRIORITY, "bang", 0);
task_delay(time_ticks_per_sec());
return 0;
}
8063762 Rev 9
183/246
Toolset tips
ST200
Building this program with the compiler options -g and -mruntime=os21, and running it
gives the following output:
OS21: ============================================================
OS21: Stack trace (1 of 1)
OS21: Fatal exception detected: 0x00000200.
OS21: misaligned access to 0x12344321
OS21: Active Task ID
: 0xC0034B38
OS21: Active Task Stackp: 0xC003CB1C
OS21: Active Task name : bang
OS21:
OS21:
OS21:
OS21:
OS21:
OS21:
PC
R14
R18
R22
R26
B0-7
0xC000041C
0x00000000
0x00000000
0x00000000
0x00000000
0 0 0 0 0 0 0
SP
R15
R19
R23
R27
0
0xC003CC38
0x00000000
0x00000000
0x00000000
0x00000000
LINK
R16
R20
R24
0xC0002D5C
0x12344321
0x00000000
0x00000000
PSW
R17
R21
R25
0x0000000E
0x12344321
0x00000000
0x00000000
OS21:
OS21:
OS21:
OS21:
OS21:
OS21:
OS21:
OS21:
OS21:
OS21:
OS21:
OS21:
R1
R5
R9
R28
R32
R36
R40
R44
R48
R52
R56
R60
0x00000000
0x00000000
0x0000BA49
0x00000000
0x00000000
0x00000000
0x00000000
0x00000000
0x00000000
0x00000000
0x00000000
0x00000000
R2
R6
R10
R29
R33
R37
R41
R45
R49
R53
R57
R61
0x00000000
0x00000000
0x00000000
0x00000000
0x00000000
0x00000000
0x00000000
0x00000000
0x00000000
0x00000000
0x00000000
0x00000000
R3
R7
R11
R30
R34
R38
R42
R46
R50
R54
R58
R62
0x00000000
0x00000000
0x00000000
0x00000000
0x00000000
0x00000000
0x00000000
0x00000000
0x00000000
0x00000000
0x00000000
0x00000000
R4
R8
R13
R31
R35
R39
R43
R47
R51
R55
R59
R63
0x00000000
0x12344321
0x00000000
0x00000000
0x00000000
0x00000000
0x00000000
0x00000000
0x00000000
0x00000000
0x00000000
0xC0002D5C
OS21: Aborted.
The exception has been decoded as a misaligned write to memory, and the bad address is
0x12344321.
A.6.2
Identifying a function that causes an exception
It is not possible to directly identify the function that causes an exception from an OS21
stack trace. However, there are several ways to indirectly establish the function.
Using GDB
To catch the exception in GDB, place a breakpoint on OS21’s unexpected exception
handler, for example:
(gdb) b _os21_exception_handler
Breakpoint 1 at 0xc0009cb4: file src/os21/exception/exception.c, line 114.
(gdb) c
Continuing.
[Switching to Thread 2147483647]
Breakpoint 1, _os21_exception_handler () at src/os21/exception/exception.c:114
114
for (lnp = _os21_list_give_node_front (&excpHandList);
(gdb) info threads
4 Thread 3 ("bang" (active & interrupted) [0xc0034b38]) 0xc000041c in my_task
(ptr=0x12344321) at /u/spilotro/work/samples/OS21_Exceptions/OS21_test.c:5
3 Thread 2 ("Idle Task" (active) [0xc0031630]) _os21_task_launch () at
184/246
8063762 Rev 9
ST200
Toolset tips
src/os21/task/task.c:1626
2 Thread 1 ("Root Task" (active) [0xc0024c08]) 0xc0006db0 in _md_kernel_syscall ()
* 1 Thread 2147483647 ("OS21 System Task" (active & running) [0 (PSEUDO)])
* _os21_exception_handler () at src/os21/exception/exception.c:114
In this example, the thread that hits the breakpoint is a pseudo thread called OS21 System
Task. This is fabricated by GDB to enable it to present the state of the system.
When the exception occurred, thread 4 is indicated as being interrupted as it was running.
To examine the state of this thread, change context to that thread:
(gdb) thread 4
[Switching to thread 4 (Thread 3)]#0 0x880017d4 in my_task
(ptr=0x12344321) at test.c:5
5
* ((unsigned int *) ptr) = 0xBA49;
(gdb) print /x ptr
$1 = 0x12344321
(gdb)
Using st200objdump
From the OS21 stack trace (see Section A.6.1: Understanding OS21 stack traces on
page 183), note the value of the PC register of the first stack trace (in the example, this is
0xC000041C). Use st200objdump to generate a disassembly, starting before and
stopping after this address. This shows the name of the function that generated the
exception. If it does not, start the disassembly further back. For example:
st200objdump -d -j .text --start-address=0xC0000408
--stop-address=0xC0000420 a.out
a.out:
file format elf32-littlelx
Disassembly of section .text:
c0000408 <my_task>:
c0000408:cc 0f 00 a5
c000040c:0c 84 00 a5
c0000410:5d 00 80 15
c0000414:40 92 04 08
c0000418:0c 82 00 a0
c000041c:48 02 00 a5
stw 0 (0x0)[$r12] = $r63;;
stw 8 (0x8)[$r12] = $r16;;
mov $r9 = 47689 (0xba49)
ldw $r8 = 8 (0x8)[$r12];;
stw 0 (0x0)[$r8] = $r9;;
Using st200addr2line
st200addr2line provides the source file and line number for a specified address. Taking the
PC to be the same as above (0xC000041C), pass it to st200addr2line, for example:
st200addr2line -e a.out -f 0xC000041C
my_task
<source-directory>/test.c:5
Note:
The program must contain debug information.
8063762 Rev 9
185/246
Toolset tips
A.6.3
ST200
Catching program termination with GDB
The normal exit path for an application is to call exit(), a breakpoint on this function
catches typical application exit scenarios.
However, if OS21 detects an internal error, it panics. This calls the _kernel_panic()
function with a string describing the situation. To catch abnormal kernel situations, place a
breakpoint on _kernel_panic(). _kernel_panic() calls down to bsp_panic(), that
provides a hook for your own panic handler.
Due to all the exit paths going through the internal run-time library function _exit(), a
breakpoint here catches every exit path.
A.7
General tips for GDB
This sections describes a variety of general tips for GDB.
A.7.1
Handling target connections
To avoid typing a sequence of commands when debugging using the GDB command line
interface, use a simple script and invoke it with -x. For example:
st200gdb -x script.cmd
To connect to your target, define a user-defined command in your .lxgdbinit file. The
following example sets up a command that connects to a target board (in this case an
STi5300 ST231 evaluation board connected to an ST Micro Connect with its IP address set
to <address>) and loads the program ready for debugging:
define target1
file $arg0
st200tp <address>:mb424:st231
load
end
To connect to the target from GDB with the executable a.out, invoke target1 with a.out
as its parameter:
(gdb) target1 a.out
A.7.2
Windows path names
Windows permits spaces to appear within path names. However, because spaces can
cause some GDB commands to break, do not use spaces in your path names.
When using autocomplete, GDB does not recognize the usual DOS path name separator,
the backslash (\), instead use the Unix style forward slash (/).
Windows permits file names to have 2-byte (wide) characters. Usually, this is not a problem
because although the tools do not understand them, they just pass them through and
Windows still recognizes them. However, some wide characters contain, as one of their two
bytes, the directory separator character ‘\’ or ‘/’. These are correctly interpreted by
Windows but in some cases are misinterpreted by the GNU tools leading to malformed
paths and apparently missing files and directories.
Note:
186/246
The preferred encoding for GNU is UTF-8, and there are no problems with 2- (or more) byte
unicode encodings being misinterpreted as slashes.
8063762 Rev 9
ST200
A.7.3
Toolset tips
Power up and connection sequence
STMicroelectronics recommends that the target board is either powered up after the
ST Micro Connect or that the target is reset after power up of the ST Micro Connect. The
reason for this is that the ribbon cable connection between the target and ST Micro Connect
can drag down the JTAG lines while the ST Micro Connect is not powered. During the
power up of the ST Micro Connect the JTAG signals are transiently undefined. To clear any
invalid state, use a target reset.
A.8
Polling for keyboard input
To enable host keyboard polling from an application running on the target, use the
_pollkey function.
_pollkey
Definition:
Poles the host keyboard
int _pollkey(int *keycode)
Arguments:
keycode
The address of an int to receive the ASCII keycode of the pressed
key.
Returns:
0 if no key was pressed, 1 if a key was pressed. No errors are returned.
Description:
_pollkey() polls the host keyboard for a keypress. If no keypress is detected, the
function returns 0. If a keypress is detected then the function returns 1, and the int
pointed to by keycode receives the ASCII keycode of the key that was pressed.
8063762 Rev 9
187/246
Toolset tips
A.9
ST200
Just in time initialization
A common problem when writing a library is performing just in time initialization. It is usually
accepted that the first thread to call a library function is responsible for initializing it. This
often requires allocating memory or synchronization objects like semaphores. The problem
is how to ensure that this is atomic, that is, the initialization is performed precisely once.
Allocation can result in the caller blocking, therefore, special consideration has to be given
as to how to achieve this atomic initialization.
The following example describes a simple strategy that guarantees atomicity.
For a library to initialize, the first caller must create a semaphore to serialize access to the
library resources. The following code, which omits error condition checking to aid clarity,
guarantees that the semaphore is created precisely once:
static semaphore_t *volatile library_sem;
...
if (library_sem == NULL)
{
semaphore_t *local_sem = semaphore_create_fifo (1);
task_lock ();
if (library_sem == NULL)
{
library_sem = local_sem;
}
task_unlock ();
if (library_sem != local_sem)
{
semaphore_delete (local_sem);
}
}
When the code completes, if necessary, the library semaphore has been created. The first
check, which occurs unlocked, is to see if the semaphore already exists. If it does, then
there is nothing more to do. If it does not, then the code allocates a new semaphore with the
address of the semaphore in a local variable. If the task is descheduled while creating the
semaphore, it is possible for another task to enter this routine. It too would see that no
library semaphore exists, and would similarly attempt to create a new one. When the task
returns from creating the semaphore, it locks the scheduler to prevent pre-emption. Under
this lock it again checks the library semaphore. If it still does not exist, the library semaphore
is assigned the address of the semaphore just created. The scheduler is now unlocked.
The lock ensured that precisely one of the competing tasks assigned a non-zero value to
the library semaphore pointer. When out of the lock the library semaphore is checked
against the local one. If they are identical, then it is known that the local semaphore was
used, and nothing more needs to be done. If they are different, then another task assigned
the library semaphore pointer. In this case, the local semaphore must be discarded; it is not
needed as the library semaphore already exists.
188/246
8063762 Rev 9
ST200
A.10
Toolset tips
Using Cygwin
The Windows toolset requires Windows XP or Windows 7. However, if a Unix-like
environment is required, use the toolset in conjunction with Cygwin (www.cygwin.net).
Cygwin adds a number of Unix-like features to its own applications but cannot extend this
support to other applications such as the ST200 Micro Toolset.
To improve interoperability and to use Cygwin as a build environment, the ST200 Micro
Toolset has a limited amount of Cygwin-like behavior.
Many of the tools accept Cygwin pathnames according to the ST_CYGPATH_MODE
environment variable, see Table 38.
Table 38.
ST_CYGPATH_MODE settings
Environment variable setting
Description
ST_CYGPATH_MODE=off
No pathname translation is attempted.
ST_CYGPATH_MODE=normal or
ST_CYGPATH_MODE is not set.
/cygdrive/X converts to X:/.
ST_CYGPATH_MODE=full
/cygdrive/X is converted as above and any other Cygwin
mount points (such as /usr) are also converted.
There are a few limitations:
●
paths must be specified in canonical form, that is, /cygdrive///c will not work
●
relative pathnames cannot pass through these paths, that is, ../../cygdrive/c will
not work
●
Cygwin symbolic links (short cuts) are not understood
The make utility is one of the ST200 Micro Toolset tools that does not have any Cygwin
support. The make utility is one of the tools in mingw32-make.exe. To use the Cygwin
make utility, place the Cygwin bin directory earlier in the PATH environment variable than
the toolset bin directory.
There are a number of other tools provided with the toolset that do not have Cygwin
pathname support. In these cases, only a proper Windows pathname works. To convert
pathnames from Cygwin format to Windows format (and back again), use the cygpath utility
(part of Cygwin).
8063762 Rev 9
189/246
Toolset tips
A.11
ST200
Watchpoint support
ST200 provides both hardware watchpoints supported only on silicon and software
watchpoints, supported on both silicon and in a simulation environment.(a)(b)
Hardware watchpoints are hardware assisted, that is, the ST200 provides registers to define
the watched memory region and comparison operation. Because ST200 register resources
are limited, only one hardware watchpoint is allowed at a time.
Hardware watchpoints are triggered when the instruction address matches criteria
established through the registers. In this condition, the target stops execution and sends
GDB a specific signal. See the ST2xx core and instruction set architecture Reference
manual for details.
Software watchpoints do not rely on hardware facilities and are therefore unlimited. This
kind of watchpoint is natively provided by GDB when executing in a simulation environment.
Another situation when software watchpoints are used is when setting more than one
watchpoint on silicon(a).
From the users point of view, software watchpoints provide the same functionality of
hardware ones, but differ in that they do not emulate the hardware watchpoint trigger
mechanism. When software watchpoints are used, GDB steps through every instruction
checking whether the value of the data in the watch region has been changed. Although this
is effective, it reduces program performance significantly.
To set a watchpoint, use one of the commands listed in Table 39, where location can be
either an address or a symbolic object name.
Table 39.
Hardware watchpoint commands
Command
When triggered
watch location
Write accesses only.
rwatch location
Read accesses only.
awatch location
Both read and write accesses.
Watchpoints set using the watch command, only trigger if the value of the data in the watch
region has been changed and not just written to.
a. Setting subsequent watchpoints is allowed but results in setting software watchpoints. In this case, even the
first (hardware) watchpoint is treated as a software watchpoint until all subsequent watchpoints are active
(neither deleted nor out of scope).
b. It is not possible to explicitly differentiate which type of watchpoints (hardware or software) to set using the
commands in Table 39. GDB makes this decision depending on the execution environment. On silicon, it can
be either type depending on the number of hardware watchpoint already set. On a simulator, only the software
type is allowed.
190/246
8063762 Rev 9
ST200
ST200 board support package (BSP)
Appendix B
ST200 board support package (BSP)
This appendix describes the board support package of the bare machine run-time software
for the STMicroelectronics ST200 family of processors.
The BSP has a set of function calls that enable you to command low-level functionalities
available on ST200-powered systems, such as cache management, timers programming,
performance monitoring and interrupts installation.
This bare-machine run-time software provides very low level control of the resources of the
ST200 CPU core. Most users are expected to use the OS21 run-time kernel which manages
the machine's low-level resources and so do not need to use this low-level API.
B.1
Error handling
All BSP functions, not directly returning a value, return an error condition that assumes one
of the following values:
BSP_OK
if there are no errors
BSP_FAILURE
if an error occurred
When an error is detected the global variable unsigned int bsp_errno is set to the
appropriate value at the exit of each BSP call. If there are no errors, bsp_errno is set to
BSP_OK, otherwise it is set to the appropriate error code, see Table 40.
Table 40.
BSP errors
Error
Note:
Description
BSP_OK
No errors.
BSP_FAILURE
General error condition.
BSP_EINVAL
An invalid argument is given.
BSP_EINTR
An error occurred installing an interrupt.
BSP_EBUSY
The resource is not available.
BSP_EMAPFAIL
There is an error mapping memory.
BSP_EMFILE
No TLB is available.
BSP_EINTNOTHNDL
The interrupt was not handled.
BSP_EINTNOTPENDING
No pending bits are set.
The function bsp_print_error() obtains a short error message corresponding to the
error received.
8063762 Rev 9
191/246
ST200 board support package (BSP)
B.2
ST200
Caches
All variants of the ST200 processor use caches to reduce the time taken for the CPU to
access memory and greatly increase system performance.
The ST200 has an instruction cache (I-cache) and a data or operand cache (D-cache). The
I-cache is read only, while the D-cache is read/write. Writes use a write-back method.
When using a data cache, there is a risk that it can become incoherent with main memory,
this is where the contents of the cache conflicts with the contents of main memory. For
example, devices that perform direct memory access (DMA) modify the main memory
without updating the contents of the cache, potentially leaving its contents invalid. For this
reason extra care should be taken when performing DMA.
On the ST200, the I-cache cannot be disabled, however, the D-cache can be selectively
disabled for specific regions of memory. It is also possible to flush specific blocks of memory
from either cache. In this way, application software can safely manage the cache.
B.2.1
Managing the caches
When the D-cache is enabled, any data written to main memory by the CPU is stored in the
D-cache and marked as dirty so that at some point in the future it can be properly stored to
main memory.
The BSP ST200 cache API can purge (that is, to simultaneously flush and invalidate)
specific D-cache lines. Purging is required when writing to data structures in memory that
are accessed through the D-cache, but are to be shared with another bus master, for
example, another CPU, or DMA device. You can use BSP to manipulate shared data either
avoiding the cache altogether or through the cache with software cache coherency support.
To safely handle dynamic code loading, the read-only I-cache can be invalidated.
B.2.2
Cache header file: machine/bsp/cache.h
All the definitions related to the cache are in the header file, machine/bsp/cache.h.
Table 41.
Functions defined in machine/bsp/cache.h
Function
192/246
Description
bsp_cache_invalidate_instruction()
Invalidates addresses within the specified range
from the instruction cache
bsp_cache_invalidate_instruction_
all()
Invalidates the entire instruction cache
bsp_cache_purge_data()
Purges addresses within the specified range from
the data cache
bsp_cache_purge_data_all()
Purges the entire data cache
8063762 Rev 9
ST200
B.2.3
ST200 board support package (BSP)
L2 cache
If a Level-2 cache interface is present in the hardware (refer to your SoC datasheet for
details) then the BSP requires customization in order to use it:
1.
Define the symbol L2_CACHE_SYSTEM_ADDRESS in the board_nomem.ld file (or
board.ld).
For example:
/* L2 Cache base address */
L2_CACHE_SYSTEM_ADDRESS = 0X1E000000;
2.
If the TLBs are configured, then define the TLB settings for the L2 cache in the BSP
For example:
"bsp_memory_map_t <platform>_l2_maps [] = { {(void *)&L2_CACHE_SYSTEM_ADDRESS,
0x200, 8*1024, 0, 7, 7}, NO_MAP};
bsp_memory_map_t * bsp_board_map_init(void)
{
return <platform>_l2_maps;
}
"
3.
In order to connect to hardware (and use L2 cache) then set the following parameter in
the connection string: l2cache=<address>
For example:
st200xrun -c st200tp -t "<stmc_ip>:<platform>:<core> l2cache=<address>" -e
<user_application>
st200gdb -ex "st200tp <stmc_ip>:<platform>:<core> l2cache=<address>"
<user_application>
Note:
The l2cache parameter must be used only in the connection with real hardware (it is not to
be used with a simulator).
8063762 Rev 9
193/246
ST200 board support package (BSP)
B.3
ST200
Memory management
Some variants of the ST200 processor (ST231 onwards) support a memory management
unit (MMU) and a speculative load control unit (SCU). The MMU has hardware that controls
the D-cache behavior across address ranges, as well as performing the traditional role of
controlling virtual address translation and protection. The MMU has a fixed number of
translation look aside buffers (TLBs) that describe and control the virtual address space on
the system.
The SCU controls whether or not speculative (also known as dismissible) loads from
physical address ranges are allowed. The SCU has a fixed number of entries that are used
to enable speculative loads for certain physical address ranges.
B.3.1
Initial memory map
When the ST200 comes out of reset, the MMU is disabled. In this mode all data fetches are
uncached.
The C run-time boot sequence programs the MMU to contain an identity mapping for system
RAM with caching enabled. It also programs the SCU so that speculation is enabled for
system RAM. The boot sequence then enables the MMU and the ST200 starts running from
a virtual address space.
The mapping set up in the TLBs by the bare run-time is an identity mapping, therefore, the
system RAM is shown in the virtual address space at the same addresses as it does in the
physical address map.
Table 42.
Initial memory map
Start address
B.3.2
Size
Supervisor /
User priv.
Cacheable
Description
__text_start
8 MBytes
rwx/rwx
Yes
RAM read/write/execute.
0x00000000
8 KBytes
rwx/rwx
No
boot ROM
Peripheral_base
16 KBytes
rw--/----
No
Peripheral registers.
Peripheral_base +
0x4000
8 KBytes
r--x/----
No
DSU ROM
Managing the MMU
The bare run-time Board Support Package only has a minimal support for the MMU and
SCU. The OS21 BSP has a more extended API for MMU and SCU modules.
B.3.3
MMU header file: machine/bsp/mmu.h
All the definitions related to the MMU available in bare run-time environment are in the
single header file, machine/bsp/mmu.h, see Table 43.
194/246
8063762 Rev 9
ST200
ST200 board support package (BSP)
Table 43.
Functions defined in bsp/mmu.h
Function
B.3.4
Description
bsp_mmu_reset()
Reset TLB settings
bsp_mmu_memory_map()
Map pages of program address space into ST200
physical addresses and set protections
bsp_mmu_memory_unmap()
Unmap pages of memory
bsp_mmu_dump_TLB_Settings()
Write on the stdio a list of TLBs with their
attributes
Speculative control unit (SCU)
To ensure that speculative bus requests are not sent out to peripherals and unmapped
memory regions, the SCU filters physical speculative load addresses (both cached and
uncached) and prefetches that miss the cache.
The SCU supports four regions of memory aligned to the smallest TLB page size (8 Kbytes).
If the physical address of the speculative load/prefetch address falls within one of the four
supported regions it is allowed, otherwise the SCU aborts the speculative load/prefetch and
either returns zero or the cancels the prefetch.
To configure the memory regions, use the SCU_BASEx and SCU_LIMITx control registers.
The SCU resets so that each of the four regions cover the whole of memory. This enables
speculative loads to be issued before the SCU has been initialized.
SCU header file: machine/bsp/mmap.h
All the definitions related to the SCU available in bare run-time environment are in the single
header file, machine/bsp/mmap.h, see Table 44.
Table 44.
Functions defined in bsp/mmap.h
Function
Description
bsp_scu_read()
Read the settings of the region
bsp_scu_write()
Write the start and end address of a region
bsp_scu_disable()
Disable a region
bsp_scu_dump_SCU_Settings()
Write on the stdio a list of SCU regions with their
address and size
The functions bsp_scu_read() and bsp_scu_write() use a struct to define start and
end addresses.
typedef struct
{
void * start_address;
void * end_address;
} bsp_scu_entry_t;
The two addresses are rounded to be aligned to the smallest TLB page size.
8063762 Rev 9
195/246
ST200 board support package (BSP)
B.4
ST200
Timers
The ST200 has three independent timers, each capable of running as a free-running
auto-reload 32-bit counter, with interrupt on underflow. Each can be programmed to count
some fraction of the input clock. Time is represented in clock ticks, with the bsp_clock_t
type. This is defined to be a signed 64-bit integer.
B.4.1
Input clock frequency
The precise speed of the input clock is determined by the end user; it is a function of the
board design and boot software.
B.4.2
Tick duration
ST200 BSP establishes the period of one tick when it boots. Based on the input clock
frequency, it selects an appropriate divisor to yield a tick that is approximately
1 microsecond.
B.4.3
Reading the current time
To read the value of system time, use bsp_timer_now().
#include <machine/bsp/timer.h>
bspclock_t bsp_timer_now(void);
B.4.4
ST200 timer assignments
ST200 BSP uses the Timer0 as system timer and Timer1 only if the profiling is enabled,
Timer2 is always free for users (Timer1 is also available for users if the profiling feature is
not enabled).
Table 45.
ST200 timer assignments
Timer name
BSP usage
TIMER_SYSTEM
System timer
TIMER_PROFILER
Profiling timer
TIMER_USER1
User timer 1
TIMER_USER2
User timer 2 (only available if profiler is not
present)
To return the system time, bsp_timer_now() uses the free running system timer. On
ST200, the system time (bsp_clock_t) is a 64-bit value. ST200 BSP maintains the top
32 bits of the 64-bit time through an interrupt handler that is called each time the 32-bit timer
reaches zero. The lower 32 bits of the system time are the value in the system timer.
If the profiling feature is enabled, the profiling timer is programmed to the profiling sampling
interval. otherwise it is available for the user (as TIMER_USER2)
The user Timer1 is always available for the user.
196/246
8063762 Rev 9
ST200
ST200 board support package (BSP)
Hardware abstraction layer (HAL) for the ST200 timer module
The BSP has a set of functions to help program the timer directly by acting on the timer
registers that hide the differences between ST200 cores. These functions are not checked
against conflicts against other timer functions (for example, bsp_timer_now()) and
should be only used to program user timer 2 and eventually the user timer 1 if profiling is not
enabled.
Table 46.
Functions defined in machine/bsp/timer.h
Functions
B.4.5
Description
bsp_timer_start()
Start the timer.
bsp_timer_start_all()
Start all the timers
bsp_timer_stop()
Stop the timer.
bsp_timer_divide_set()
Set the TIMEDIVIDE registry
bsp_timer_divide_get()
Get the TIMEDIVIDE registry
bsp_timer_count_set()
Set the initial value of the counter of the specific
timer
bsp_timer_count_get()
Get the initial value of the counter of the specific
timer
bsp_timer_reload_set()
Set the value to be reloaded into the specific timer
on reaching zero
bsp_timer_reload_get()
Get the reload value of the specific timer
bsp_timer_interrupt_enable()
Enable the timer interrupts the processor
bsp_timer_interrupt_disable()
Disable the timer interrupt
bsp_timer_interrupt_clear()
Clear the timer interrupt
Timer header file: machine/bsp/timer.h
All the definitions related to the timer available in bare run-time environment are in the single
header file machine/bsp/timer.h, see Table 47 and Table 48.
Table 47.
Functions defined in machine/bsp/timer.h
Function
Description
bsp_timer_now()
Return the current time
bsp_timer_user()
Set a user timer, eventually attach an interrupt
handle and enable the corresponding interrupt
bsp_timer_ticks_per_sec()
Return the number of clock ticks per second
Table 48.
Types defined by machine/bsp/timer.h
Type
bspclock_t
Description
Number of processor clock ticks
8063762 Rev 9
197/246
ST200 board support package (BSP)
B.5
ST200
Performance monitor (PM)
The PM module is a hardware instrumentation system that enables you to simultaneously
monitor up to four events in a variable set of predefined events.
B.5.1
Hardware abstraction layer for the PM module
The BSP has a set of functions to help program the performance monitor directly acting on
the registers, see Table 49.
Table 49.
Functions defined in machine/bsp/pm.h
Functions
B.6
Description
bsp_pm_reset()
Reset all counters
bsp_pm_start()
Start all the event counters
bsp_pm_stop()
Stop all the event counters
bsp_pm_clock_get()
Read the PM Clock counter
bsp_pm_clock_set()
Write the PM Clock counter
bsp_pm_counter_get()
Read the current value of a PM counter
bsp_pm_counter_set()
Write/change the current value of a PM counter
bsp_pm_event_get()
Returns the event monitored by the PM counter
bsp_pm_event_set()
Set the event being monitored by a PM counter
Exception handling
Exceptions on the ST200 can occur for the following reasons:
●
program request (syscall instruction)
●
external interrupt
●
program error (for example, misaligned access, bad instruction, failed protection
check)
After the BSP initialization, only external interrupts are handled.
The default behavior when an unexpected exception occurs is to print a message detailing
the exception, dump the whole context and then shut down by calling _exit().
To replace the currently installed exception handlers, use the BSP_CORE_EXTERN_INT
function.
All external interrupts are treated as BSP_CORE_EXTERN_INT exceptions; the interrupt
dispatcher is set during the BSP initialization.
B.6.1
Exceptions types
Table 50 lists the exceptions that can occur for ST231 and ST240 cores.
198/246
8063762 Rev 9
ST200
ST200 board support package (BSP)
Table 50.
ST231 and ST240 exceptions defined in machine/bsp/core.h
ST231 exceptions
BSP_CORE_STBUS_IC_ERROR
BSP_CORE_SYSCALL
BSP_CORE_STBUS_DC_ERROR
BSP_CORE_DBREAK
BSP_CORE_EXTERN_INT
BSP_CORE_MISALIGNED_TRAP
BSP_CORE_IBREAK
BSP_CORE_CREG_NO_MAPPING
BSP_CORE_ITLB
BSP_CORE_CREG_ACCESS_VIOLATION
BSP_CORE_SBREAK
BSP_CORE_DTLB
BSP_CORE_ILL_INST
BSP_CORE_SDI_TIMEOUT
The exception handlers are defined as:
typedef int (*InterruptVector_t)(regcontext *);
For example:
int MySyscallHandle( regcontext *regs)
{
DoSomething();
bsp_errno = BSP_OK;
return (BSP_OK);
}
main ()
{
InterruptVector_t OldHandler;
InterruptVector_t NewHandler;
...
NewHandler = MySyscallHandle;
bsp_core_interrupt_install( &NewHandler,
&OldHandler,
BSP_CORE_MISALIGNED_TRAP);
...
}
B.6.2
Exceptions header file: machine/bsp/core.h
All the definitions related to the exception handling are in the single header file,
machine/bsp/core.h.
Table 51.
Functions defined in machine/bsp/core.h
Functions
Description
bsp_core_interrupt_install()
Install an exception handler for a specified
exception cause
bsp_core_interrupt_lock()
Disable external interrupts at core level
bsp_core_interrupt_unlock()
Enable external interrupts at core level
8063762 Rev 9
199/246
ST200 board support package (BSP)
B.7
ST200
Interrupts
Interrupts are events external to the CPU that are signaled to it through sampled lines.
When an interrupt occurs, an interrupt handler interrupts the CPU’s normal flow of
execution. The normal execution flow resumes after the interrupt handler terminates.
The ST200 cores have 64 lines of external interrupts. A subset of these lines can be
masked (that is, disabled) individually. In the ST231, the first three lines are connected to
the three system timers 0, 1 and 2. The remaining 61 lines are connected to system specific
subsystems. The ST240 interrupt controller supports up to 64 external interrupt sources:
three internal interrupt sources from the timers and one internal interrupt source from the
performance monitors. Each of these 68 sources has a mask and a test bit associated with
it.
For specific information about the maskable interrupt lines and other information, refer to the
system-specific (core, SoC, board) datasheets.
B.7.1
Interrupt handler installation
An interrupt handler is a user-defined function that executes whenever a particular interrupt
line is raised. This API provides the means to specify and install user-defined interrupt
handlers. The interrupt handler has to return BSP_OK in case of success (interrupt correctly
installed) or BSP_FAILURE (and bsp_errno set to the corresponding error number) in
case of failure.
B.7.2
Interrupts header file: machine/bsp/interrupt.h
All the definitions related to the interrupts available in bare run-time environment are in the
single header file, machine/bsp/interrupt.h, see Table 52.
Note:
The introduction for the ST240 of two set of interrupts (internal and external) required the
definition of a new API for the interrupt handler. All functions that have _itc in their name are
renamed so that _itc is removed. For example, bsp_itc_interrupt_disable() is now
bsp_interrupt_disable().
Table 52.
Functions defined in machine/bsp/interrupt.h
Function
Description
bsp_interrupt_clear()
Clears an interrupt
bsp_interrupt_disable()
Disable an interrupt
bsp_interrupt_enable()
Enable an interrupt
bsp_interrupt_install()
Installs an interrupt handler
bsp_interrupt_poll()
Polls an interrupt
bsp_interrupt_raise()
Raises an interrupt
bsp_interrupt_uninstall()
Uninstalls an interrupt handler
For backward compatibility, Table 53 list the old-style functions defined in
machine/bsp/interupt.h.
200/246
8063762 Rev 9
ST200
ST200 board support package (BSP)
Table 53.
Functions defined in machine/bsp/interrupt.h
Function
B.8
Description
bsp_itc_interrupt_clear()
Clears an interrupt
bsp_itc_interrupt_disable()
Disable an interrupt
bsp_itc_interrupt_enable()
Enable an interrupt
bsp_itc_interrupt_install()
Installs an interrupt handler
bsp_itc_interrupt_poll()
Polls an interrupt
bsp_itc_interrupt_raise()
Raises an interrupt
bsp_itc_interrupt_uninstall()
Uninstalls an interrupt handler
User handles
User handles are an optional way to modify the BSP initialization behavior. If standard
behavior is in line with user expectations, do not use user handles.
Table 54 lists the user handles.
Table 54.
User handles
User handle
Description
bsp_user_start_handle
User handle called at the start of the BSP
initialization
bsp_user_end_handle
User handle called at the end of the BSP
initialization
bsp_user_start_handle
User handle called at the start of the BSP
initialization
Definition:
int bsp_user_start_handle(void);
Arguments:
None.
Returns:
RESUME
The execution continues in the standard BSP
initialization.
OVERWRITE
bsp_user_start_handle() handles all of the BSP
initialization and the standard initialization is skipped.
Description:
If this function is user-defined, it is invoked at the start of the BSP initialization. At this
stage, this function is in supervisor mode and nothing of the BSP has been initialized
(no memory management and timer initialization).
Example:
int bsp_user_start_handle (void)
{
kprintf("At the start of user defined bsp_user_start_handle()
\n");
Dosomething();
return RESUME; /* Continue with standard BSP init */
}
8063762 Rev 9
201/246
ST200 board support package (BSP)
bsp_user_end_handle
ST200
User handle called at the end of the BSP
initialization
Definition:
void bsp_user_end_handle(void);
Arguments:
None.
Returns:
None.
Description:
If this function is user-defined, it is invoked at the end of the BSP initialization. At this
stage, this function is in the mode requested (the default is supervisor) and the BSP
has been initialized. This function is called before main().
Note: This function is only invoked in the standard flow of BSP initialization. If the user
defined bsp_user_start_handle() has returned OVERWRITE
bsp_user_end_handle() is not called.
Example:
202/246
void bsp_user_end_handle (void)
{
kprintf("At the end of BSP init\n");
Dosomething();
}
8063762 Rev 9
ST200
B.9
ST200 board support package (BSP)
Retrieving internal run-time data
The bare machine run-time software stores configuration data records. All data is accessible
by using the function defined in the single header file, machine/rtrecord.h, see
Table 55.
Table 55.
Function defined in machine/rtrecord.h
Function
Description
Retrieve run-time configuration data.
bsp_rtrecord_get
Configuration data fields that can be retrieved are listed in Table 56.
Table 56.
Configuration data fields
Configuration data field
Description
Field format
RUNTIME_BOARDNAME
Board name.
char *
RUNTIME_BOOTADDRESS
.boot section address.
unsigned int
RUNTIME_BSSEND
End address of .bss section.
unsigned int
RUNTIME_BSSSTART
Start address of .bss section.
unsigned int
RUNTIME_BUSCLOCK
BUS clock frequency.
unsigned int
RUNTIME_CLEARDSS
Flag indicating if the .bss
section is cleared at boot.
unsigned int
RUNTIME_CORENAME
Core name.
char *
RUNTIME_CPUCLOCK
CPU clock frequency.
unsigned int
RUNTIME_DEBUGRAM
Debug RAM address.
unsigned int
RUNTIME_L2_CACHE_SYSTEM
_ADDRESS
L2 cache base address.
unsigned int
RUNTIME_MODE
run-time mode execution
(supervisor or user).
unsigned int
RUNTIME_PERIPH_BASE
Peripheral base address.
unsigned int
RUNTIME_RAMEND
RAM end address.
unsigned int
RUNTIME_SOC_ID
Device identifier.
unsigned int
RUNTIME_SOCNAME
SoC name.
char *
RUNTIME_STACK
Stack pointer address.
unsigned int
RUNTIME_TEXTADDRESS
.text section address.
unsigned int
RUNTIME_VERSION
ST200 toolchain version.
char *
8063762 Rev 9
203/246
ST200 board support package (BSP)
B.10
ST200
BSP function definitions
bsp_cache_invalidate_instruction Invalidate addresses within the specified
range from the instruction cache
Definition:
#include <platform.h>
int bsp_cache_invalidate_instruction (
void * base_address,
size_t length);
Arguments:
base_address
The start address of the range to invalidate.
length
The length of the range in bytes.
Returns:
Returns the error condition.
Description:
This function invalidates any valid instruction cache lines that fall within the address
range specified. If it is not possible to flush individual cache lines, then the entire
instruction cache is invalidated.
See also:
bsp_cache_invalidate_instruction_all
bsp_cache_invalidate_instruction_all
Invalidate the entire instruction
cache
Definition:
#include <platform.h>
int bsp_cache_invalidate_instruction_all (void);
Arguments:
None.
Returns:
Returns the error condition.
Description:
This function invalidates the entire instruction cache.
See also:
bsp_cache_invalidate_instruction
bsp_cache_purge_data
Definition:
Purge addresses within the specified range
from the data cache
#include <platform.h>
int bsp_cache_purge_data(
void * base_address,
size_t length );
Arguments:
base_address
The start address of the range to purge.
length
The length of the range in bytes.
Returns:
Returns the error condition.
Description:
This function purges any valid data cache lines which fall within the address range
specified. Any dirty cache lines are first written back to memory, and then the cache
lines are invalidated.
See also:
bsp_cache_purge_data_all
204/246
8063762 Rev 9
ST200
ST200 board support package (BSP)
bsp_cache_purge_data_all
Purge the entire data cache
Definition:
#include <platform.h>
int bsp_cache_purge_data_all (void);
Arguments:
None.
Returns:
Returns the error condition.
Description:
This function purges any valid data cache lines within the D-cache. Any dirty cache
lines are first written back to memory, and then the cache lines are invalidated.
See also:
bsp_cache_purge_data
bsp_core_interrupt_install
Definition:
Install an exception handler for a specified
exception cause
#include <platform.h>
int bsp_core_interrupt_install (
InterruptVector_t* NewExceptionHandler,
InterruptVector_t* OldExceptionHandler,
int ExceptionNumber );
Arguments:
NewExceptionHandler
The exception handler to attach to the specified
exception.
OldExceptionHandler
The previously installed exception handler.
ExceptionNumber
The exception to which the handler has to be attached.
Returns:
On successful completion, bsp_core_interrupt_install() returns BSP_OK;
otherwise, it returns BSP_FAILURE and sets bsp_errno to indicate an error.
Description:
This function installs the exception handler for the exception specified in
ExceptionNumber.
See also:
bsp_core_interrupt_lock, bsp_core_interrupt_unlock
bsp_core_interrupt_lock
Disable external interrupts at core level
Definition:
#include <platform.h>
int bsp_core_interrupt_lock (void);
Arguments:
None.
Returns:
On successful completion, bsp_core_interrupt_lock() returns BSP_OK;
otherwise, it returns BSP_FAILURE and sets bsp_errno to indicate an error.
Description:
This function disables all external interrupts at core level.
See also:
bsp_core_interrupt_install, bsp_core_interrupt_unlock
8063762 Rev 9
205/246
ST200 board support package (BSP)
ST200
bsp_core_interrupt_unlock
Enable external interrupts at core level
Definition:
#include <platform.h>
int bsp_core_interrupt_unlock (void);
Arguments:
None.
Returns:
On successful completion, bsp_core_interrupt_unlock() returns BSP_OK;
otherwise, it returns BSP_FAILURE and sets bsp_errno to indicate an error.
Description:
This function enables all external interrupts at core level.
See also:
bsp_core_interrupt_install, bsp_core_interrupt_lock
bsp_interrupt_clear
Definition:
Clear a specific interrupt
#include <platform.h>
int bsp_interrupt_clear(
int interrupt_number,
int type);
Arguments:
interrupt_number
The interrupt to clear.
type
Flag to select between eternal and internal interrupts.
Values accepted:
INTERNAL_INTERRUPTS
EXTERNAL_INTERRUPTS
Returns:
Returns the error condition.
Description:
This function clears a specific interrupt. bsp_itc_interrupt_clear is kept for
backward compatibility and it is equivalent to call bsp_interrupt_clear using
type=EXTERNAL_INTERRUPTS.
bsp_interrupt_disable
Definition:
Disable a specific interrupt
#include <platform.h>
int bsp_interrupt_disable(
int interrupt_number,
int type);
Arguments:
interrupt_number
The interrupt to enable.
type
Flag to select between eternal and internal interrupts.
Values accepted:
INTERNAL_INTERRUPTS
EXTERNAL_INTERRUPTS
Returns:
Returns the error condition.
Description:
This function disables a specific interrupt. bsp_itc_interrupt_disable is kept
for backward compatibility and it is equivalent to call bsp_interrupt_disable
using type=EXTERNAL_INTERRUPTS.
206/246
8063762 Rev 9
ST200
ST200 board support package (BSP)
bsp_interrupt_enable
Definition:
Enable a specific interrupt
#include <platform.h>
int bsp_interrupt_enable(
int interrupt_number,
int type);
Arguments:
interrupt_number
The interrupt to enable.
type
Flag to select between eternal and internal interrupts.
Values accepted:
INTERNAL_INTERRUPTS
EXTERNAL_INTERRUPTS
Returns:
Returns the error condition.
Description:
This function enables a specific interrupt. bsp_itc_interrupt_enable is kept for
backward compatibility and it is equivalent to call bsp_interrupt_enable using
type=EXTERNAL_INTERRUPTS.
8063762 Rev 9
207/246
ST200 board support package (BSP)
ST200
bsp_interrupt_install
Definition:
Install an interrupt handler
#include <platform.h>
int bsp_interrupt_install(
int interrupt_number,
int (*handler_function)(void* param_ptr),
int (**old_handler_function)(void* param_ptr),
void* stack_base,
int stack_size,
int type);
Arguments:
interrupt_number
The interrupt to which the handler is to be linked.
handler_function
The interrupt handler to be installed.
old_handler_function The interrupt handler previously installed.
stack_base
The pointer to the location in memory to be used as
stack base. If NULL, the default system stack pointer is
used instead.
stack_size
The stack size to be allocated for the handler; not used if
stack_base is NULL.
type
Flag to select between eternal and internal interrupts.
Values accepted:
INTERNAL_INTERRUPTS
EXTERNAL_INTERRUPTS
Returns:
Returns the error condition.
Description:
This function installs a new interrupt handler, returning the handler installed
previously. bsp_itc_interrupt_install is kept for backward compatibility and it
is equivalent to call bsp_interrupt_install using
type=EXTERNAL_INTERRUPTS.
208/246
8063762 Rev 9
ST200
ST200 board support package (BSP)
bsp_interrupt_poll
Definition:
Poll a specific interrupt
#include <platform.h>
int bsp_interrupt_poll(
int interrupt_number,
int* value,
int type);
Arguments:
interrupt_number
The interrupt to poll, in the range from 0 to 63.
value
The pointer to the returned value. If the returned value is
0, the interrupt has not been raised.
type
Flag to select between eternal and internal interrupts.
Values accepted:
INTERNAL_INTERRUPTS
EXTERNAL_INTERRUPTS
Returns:
Returns the error condition.
Description:
This function informs the user whether an interrupt has been raised.
bsp_itc_interrupt_poll is kept for backward compatibility and it is equivalent to
call bsp_interrupt_poll using type=EXTERNAL_INTERRUPTS.
bsp_interrupt_raise
Definition:
Raises a specific interrupt
#include <platform.h>
int bsp_interrupt_raise(
int interrupt_number,
int type);
Arguments:
interrupt_number
The interrupt to be raised.
type
Flag to select between eternal and internal interrupts.
Values accepted:
INTERNAL_INTERRUPTS
EXTERNAL_INTERRUPTS
Returns:
Returns the error condition.
Description:
This function raises a specific interrupt. bsp_itc_interrupt_raise is kept for
backward compatibility and it is equivalent to call bsp_interrupt_raise using
type=EXTERNAL_INTERRUPTS.
8063762 Rev 9
209/246
ST200 board support package (BSP)
ST200
bsp_interrupt_uninstall
Definition:
Uninstalls an interrupt handler
#include <platform.h>
int bsp_interrupt_unistall(
int interrupt_number,
int type);
Arguments:
interrupt_number
The interrupt to uninstall.
type
Flag to select between eternal and internal interrupts.
Values accepted:
INTERNAL_INTERRUPTS
EXTERNAL_INTERRUPTS
Returns:
Returns the error condition.
Description:
This function uninstalls a previously installed interrupt handle.
bsp_itc_interrupt_unistall is kept for backward compatibility and it is
equivalent to call bsp_interrupt_unistall using
type=EXTERNAL_INTERRUPTS.
bsp_mmu_dump_TLB_Settings
Write TLB’s settings on the stdio
Definition:
#include <platform.h>
int bsp_mmu_dump_TLB_Settings (void);
Arguments:
None.
Returns:
Returns BSP_OK.
Description:
The bsp_mmu_dump_TLB_Settings() function writes the TLB’s settings on the
stdio.
The following example shows the output of the bsp_mmu_dump_TLB_Settings()
function for an ST231 or ST240 simulation.
Index Asid Shared Sup/Usr
58
0
1
r-x/--59
0
1
rw-/--60
0
1
rw-/--61
0
1
rwx/rwx
62
0
1
rwx/rwx
63
0
1
rwx/rwx
210/246
Size
8KB
8KB
8KB
8KB
4MB
4MB
Vaddr
0x1F004000
0x1F002000
0x1F000000
0x00000000
0x08400000
0x08000000
8063762 Rev 9
Paddr Partition
0x1F004000 WAY0-3
0x1F002000 WAY0-3
0x1F000000 WAY0-3
0x00000000 WAY0-3
0x08400000 WAY0-3
0x08000000 WAY0-3
Policy
UNCACHED
UNCACHED
UNCACHED
UNCACHED
CACHED
CACHED
ST200
ST200 board support package (BSP)
bsp_mmu_memory_map
Definition:
Create a memory mapping and return a virtual
address range
#include <platform.h>
void * bsp_mmu_memory_map (void * address,
size_t length,
int prot,
int flags,
void * phaddr);
Arguments:
Returns:
address
The virtual address.
length
The length of region in bytes.
prot
The combination of supervisor and user mode accesses
permitted for the address being mapped.
flags
Other information about the handling of the mapped
data.
phaddr
The physical address of the region to map.
On successful completion, the bsp_mmu_memory_map() function returns the virtual
address at which the mapping was placed; otherwise, it returns a value of
BSP_FAILURE and sets bsp_errno to indicate the error.
If bsp_mmu_memory_map() fails for reasons other than BSP_EINVAL, some of the
mappings in the address range starting at address and continuing for length bytes
may be unmapped.
Description:
The bsp_mmu_memory_map() function establishes a mapping between a range of
virtual addresses accessed by the program and a range of physical address of the
same size. Protection attributes can be set for the access to this range of address.
The format of the call is as follows:
va = bsp_mmu_memory_map(addr, length, prot, flags, phaddr);
In this example, bsp_mmu_memory_map() establishes a mapping between the
address space of the program at an address va for length bytes to the physical
address phaddr for length bytes. The value of va is exactly where the access at
addr starts and is a function of the addr argument and the value of flags, further
described below. A successful bsp_mmu_memory_map() call returns va as its
result.
As the result of bsp_mmu_memory_map(), a block of program address space
including the range [va, va + length) is mapped. The limits of this block are
rounded according to the hardware constraints, such as the page size.
The mapping established by bsp_mmu_memory_map() replaces any previous
mappings for those whole pages containing any part of the address space of the
program starting at va and continuing for length bytes.
The prot argument determines all the attributes of the mapping: access rights for
supervisor and user mode, policy related to the cache and partition attributes.
8063762 Rev 9
211/246
ST200 board support package (BSP)
ST200
The prot argument should be either PROT_NONE or the bitwise inclusive OR of one
or more of the following attributes defined in the header file
<target/core/include/bsp/mmu.h>.
PROT_USER_READ
The address can be read in user mode.
PROT_SUPERVISOR_READ The address can be read in supervisor mode.
PROT_USER_WRITE
The address can be written in user mode.
PROT_SUPERVISOR_WRITE
The address can be written in supervisor mode.
PROT_USER_EXECUTE
The address can be executed in user mode.
PROT_SUPERVISOR_EXECUTE
The address can be executed in supervisor mode.
PROT_NONE
The data cannot be accessed.
POLICY_CACHEABLE
Memory accesses are cached. (POLICY_CACHEABLE
replaces PROT_CACHEABLE, which is kept for backward
compatibility).
POLICY_UNCACHEABLE
Memory accesses are uncached.
POLICY_WCUNCACHEABLE Memory accesses are uncached write-combined.
PART_REPLACE
Place as specified by replacement counter and
increment the counter.
PART_WAY1
Place in way 1 only.
PART_WAY2
Place in way 2 only.
PART_WAY3
Place in way 3 only.
PAGE_DIRTY
Page is dirty; write accesses to this page will cause a
TLB_WRITE_TO_CLEAN exception.
PAGE_VALID
Writes to this page are allowed.
If an implementation of bsp_mmu_memory_map() for a specific platform cannot
support the combination of access types specified by prot, the call to
bsp_mmu_memory_map() fails.
The flags argument provides other information about the handling of the mapped
data. The value of flags is the bitwise inclusive OR of the following options defined
in <machine/bsp/mmu.h>.
MAP_FIXED
Interpret addr exactly.
MAP_LOCKED
Protect this TLB by random TLB replacement.
MAP_OVERRIDE
Override any existing mapping.
MAP_SPARE_RESOURCES
Spare mapping resources.
When MAP_FIXED is set in the flags argument, the system is informed that the
value of va must be addr exactly. If MAP_FIXED is set, bsp_mmu_memory_map()
may return MAP_FAILED and set bsp_errno to BSP_EINVAL. If a MAP_FIXED
request is successful, the mapping established by bsp_mmu_memory_map()
212/246
8063762 Rev 9
ST200
ST200 board support package (BSP)
replaces any previous mappings for the program’s pages in the range
[va, va + length).
When MAP_FIXED is set and the requested address is the same as previous
mapping, the previous address is unmapped and the new mapping is created on top
of the old one.
When MAP_FIXED is not set, the system uses addr to arrive at va. The va is an area
of the address space that the system deems suitable for a mapping of length bytes
to the physical address phaddr. The value of addr is taken to be a suggestion of a
program address near which the mapping should be placed.
When the system selects a value for va and MAP_OVERRIDE is not set, existing
mappings are not overridden. This includes the mapping set at program initialization
time in BSP-like code.
When MAP_SPARE_RESOURCES is set, the hardware resources are spared so that a
reasonable amount of hardware resources remain available for further
bsp_mmu_memory_map() usage. The implementation of this flag is ST200
architecture dependent.
When MAP_LOCKED is set, the LIMIT field of the TLB REPLACE register is changed.
To avoid this, TLB could be impacted from random TLB replacement routines.
ST200 implementation specifics
The bsp_mmu_memory_map() utility is implemented for the ST231 architecture
using the TLB hardware feature. The policy of the TLB index allocation is to use high
index values first, starting at TLB_SIZE-1, and decreasing toward 0.
The MAP_SPARE_RESOURCES specific allocation policy ensures that no more than
half of the TLB index is used to map a single area. It may also increase the page size
used to cover the area despite the lack of accuracy. This function invalidates any valid
instruction cache lines which fall within the address range specified. If it is not
possible to flush individual cache lines, then the entire instruction cache is invalidated.
See also:
bsp_mmu_memory_unmap()
8063762 Rev 9
213/246
ST200 board support package (BSP)
ST200
bsp_mmu_memory_unmap
Definition:
Delete a memory mapping
#include <platform.h>
int bsp_mmu_memory_unmap (
void *address,
size_t length);
Arguments:
Returns:
address
The virtual start address of the range to invalidate.
length
The length of the range in bytes.
On successful completion, bsp_mmu_memory_unmap() returns BSP_OK; otherwise,
it returns BSP_FAILURE and sets bsp_errno to indicate an error.
If the removed TLBs were set as MAP_LOCKED then the LIMIT field of the TLB
REPLACE register is adjusted accordingly.
Description:
The bsp_mmu_memory_unmap() function removes the mapping and protection for a
block of program address space, including the range [address, address +
length) assumed to have been set by bsp_mmu_memory_map().
If address is not the address of a mapping established by a prior call to
bsp_mmu_memory_map(), the behavior is undefined.
The bsp_mmu_memory_map() function may perform an implicit
bsp_mmu_memory_unmap().
See also:
bsp_mmu_memory_map
bsp_mmu_reset
Reset TLBs settings
Definition:
#include <platform.h>
int bsp_mmu_reset (void);
Arguments:
None.
Returns:
Returns the error condition.
Description:
Resets the MMU unit in TLB settings.
bsp_pm_clock_get
Read the PM Clock counter
Definition:
#include <platform.h>
long long bsp_pm_clock_get(void);
Arguments:
None.
Returns:
Returns the current value of the Clock counter.
Description:
This function reads the PM Clock counter and returns its current value.
See also:
bsp_pm_clock_set
214/246
8063762 Rev 9
ST200
ST200 board support package (BSP)
bsp_pm_clock_set
Definition:
Write the PM Clock counter
#include <platform.h>
int bsp_pm_clock_set(
long long value);
Arguments:
The initialization value to be loaded in PM clock.
value
Returns:
Returns the error condition.
Description:
This function writes value to the PM Clock counter.
See also:
bsp_pm_clock_get
bsp_pm_counter_get
Definition:
Read the current value of a PM counter
#include <platform.h>
unsigned int bsp_pm_counter_get(
int counter);
Arguments:
The counter to read.
counter
Returns:
Returns the current value of the counter.
Description:
This function reads the PM counter and returns its current value.
See also:
bsp_pm_counter_set
bsp_pm_counter_set
Definition:
Write/change the value of a PM counter
#include <platform.h>
int bsp_pm_counter_set(
int counter,
unsigned int value);
Arguments:
counter
The counter to write.
value
The value to assign to the counter.
Returns:
Returns the error condition.
Description:
This function writes value to the PM counter specified in counter.
See also:
bsp_pm_counter_get
8063762 Rev 9
215/246
ST200 board support package (BSP)
bsp_pm_event_get
Definition:
ST200
Returns the event monitored by the PM counter
#include <platform.h>
unsigned int bsp_pm_event_get(
int counter);
Arguments:
The counter to read.
counter
Returns:
Returns the event associated with the counter.
Description:
This function reads the PM counter specified in counter and returns the event with
which it is associated.
See also:
bsp_pm_event_set
bsp_pm_event_set
Definition:
Set the event being monitored by a PM counter
#include <platform.h>
int bsp_pm_event_set(
int counter,
unsigned int event);
Arguments:
counter
The counter to set.
event
The event to assign to the counter.
Returns:
Returns the error condition.
Description:
This function sets the PM counter specified in counter to monitor the event specified
in event.
See also:
bsp_pm_event_get
bsp_pm_reset
Reset all counters
Definition:
#include <platform.h>
int bsp_pm_reset(void);
Arguments:
None.
Returns:
Returns BSP_OK.
Description:
This function resets all of the PM counters.
bsp_pm_start
Start all the event counters
Definition:
#include <platform.h>
int bsp_pm_start(void);
Arguments:
None.
Returns:
Returns BSP_OK.
Description:
This function starts all of the event counters.
See also:
bsp_pm_stop
216/246
8063762 Rev 9
ST200
ST200 board support package (BSP)
bsp_pm_stop
Stop all the event counters
Definition:
#include <platform.h>
int bsp_pm_stop(void);
Arguments:
None.
Returns:
Returns BSP_OK.
Description:
This function stops all of the event counters.
See also:
bsp_pm_start
bsp_rtrecord_get
Definition:
Returns the run-time configuration data
#include <platform.h>
void* bsp_rtrecord_get(int data);
Arguments:
The data field that is required to be returned from the
run-time configuration data.
data
Returns:
Returns the associated data. The return value must be cast in the correct field format,
see Table 56 on page 203.
Description:
This function reads from the run-time configuration record the field specified by data
and returns the related information as void *.
bsp_scu_disable
Definition:
Disable an SCU region
#include <platform.h>
unsigned int bsp_scu_disable(
unsigned int regno);
Arguments:
The SCU region number to be disabled.
regno
Returns:
Returns the error condition (BSP_OK or BSP_FAILURE).
Description:
This function disables the specified SCU region.
bsp_scu_dump_SCU_Settings
Dump on the I/O a list of the SCU regions
Definition:
#include <platform.h>
int bsp_scu_dump_SCU_Settings(void);
Arguments:
None.
Returns:
Returns BSP_OK.
Description:
This function writes the SCU region’s settings on the stdio.
8063762 Rev 9
217/246
ST200 board support package (BSP)
bsp_scu_read
Definition:
ST200
Read the start and stop address of an SCU region
#include <platform.h>
unsigned int bsp_scu_read(
unsigned int regno,
bsp_scu_entry_t *sect);
Arguments:
regno
The SCU region number to read.
sect
A pointer to an allocated structure of type
bsp_scu_entry_t.
Returns:
Returns the error condition (BSP_OK or BSP_FAILURE). In case of success, the
structure sect contains the start and end addresses of the region.
Description:
The bsp_scu_read() function reads the start and stop address of the SCU region
specified by regno. The addresses are returned in the structure sect.
bsp_scu_write
Definition:
Set the start and stop address of an SCU region
#include <platform.h>
unsigned int bsp_scu_write(
unsigned int regno,
bsp_scu_entry_t *sect);
Arguments:
regno
The SCU region number to be written.
sect
A pointer to an allocated structure of type
bsp_scu_entry_t containing the start and end
addresses.
Returns:
Returns the error condition (BSP_OK or BSP_FAILURE).
Description:
The bsp_scu_write() function sets the start and stop address of the SCU region
specified by regno to the addresses specified in the structure sect.
bsp_timer_count_get Get the initial value of the counter of the specific timer
Definition:
#include <platform.h>
unsigned int bsp_timer_count_get(
int timer);
Arguments:
timer
The timer for which to get the initial counter value, see
Table 45: ST200 timer assignments on page 196.
Returns:
The value of the counter of the required timer.
Description:
This function returns the counter of the given timer.
See also:
bsp_timer_count_set
218/246
8063762 Rev 9
ST200
ST200 board support package (BSP)
bsp_timer_count_set Set the initial value of the counter of the specific timer
Definition:
#include <platform.h>
int bsp_timer_count_set(
int timer,
unsiged int value);
Arguments:
timer
The timer to initialize, see Table 45: ST200 timer
assignments on page 196.
value
The value to be used for counter initialization.
Returns:
Returns the error condition.
Description:
This function initializes the counter of a given timer. It should only be used with
TIMER1 and TIMER2, however TIMER2 should only be used if the profiler is not
enabled. Do not use this function with TIMER_SYSTEM.
bsp_timer_interrupt_clear
Definition:
Clear the timer interrupt
#include <platform.h>
int bsp_timer_interrupt_clear(
int timer);
Arguments:
The timer interrupt to clean, see Table 45: ST200 timer
assignments on page 196.
timer
Returns:
Returns the error condition.
Description:
This function clears the interrupt of a given timer. It should only be used with TIMER1
and TIMER2, however TIMER2 should only be used if the profiler is not enabled. Do
not use this function with TIMER_SYSTEM.
bsp_timer_interrupt_enable
Definition:
Enable the timer interrupt
#include <platform.h>
int bsp_timer_interrupt_enable(
int timer);
Arguments:
The timer interrupt to enable, see Table 45: ST200 timer
assignments on page 196.
timer
Returns:
Returns the error condition.
Description:
This function enables the interrupt for the given timer. It should only be used with
TIMER1 and TIMER2, however TIMER2 should only be used if the profiler is not
enabled. Do not use this function with TIMER_SYSTEM.
8063762 Rev 9
219/246
ST200 board support package (BSP)
ST200
bsp_timer_now
Return the current time
Definition:
#include <platform.h>
bspclock_t bsp_timer_now(void);
Arguments:
None.
Returns:
Returns the number of ticks since the system started.
Description:
bsp_timer_now() returns the number of ticks since the system started running.
The exact time at which counting starts is implementation specific, but is done in the
core initialization.
The units of ticks is an implementation dependent quantity, but it is approximately
1 microseconds, see bsp_timer_ticks_per_sec on page 221.
bsp_timer_reload_get
Definition:
Get the reload value of the specific timer
#include <platform.h>
unsigned int bsp_timer_reload_get(
int timer);
Arguments:
The timer, see Table 45: ST200 timer assignments on
page 196.
timer
Returns:
The value to be reloaded into the timer on reaching zero.
Description:
This function returns the reload value of the given timer.
bsp_timer_reload_set
Definition:
Set the value to be reloaded into the specific
timer on reaching zero
#include <platform.h>
int bsp_timer_reload_set(
int timer,
unsigned int reload);
Arguments:
timer
The timer to reload, see Table 45: ST200 timer
assignments on page 196.
value
The value to be used for reload initialization.
Returns:
Returns the error condition.
Description:
This function initializes the reload register of a given timer. It should only be used with
TIMER1 and TIMER2, however TIMER2 should only be used if the profiler is not
enabled. Do not use this function with TIMER_SYSTEM.
220/246
8063762 Rev 9
ST200
ST200 board support package (BSP)
bsp_timer_start
Definition:
Start the timer
#include <platform.h>
int bsp_timer_start(
int timer);
Arguments:
The timer to start, see Table 45: ST200 timer
assignments on page 196.
timer
Returns:
Returns the error condition.
Description:
This function starts the timer. It should only be used with TIMER1 and TIMER2,
however TIMER2 should only be used if the profiler is not enabled. Do not use this
function with TIMER_SYSTEM.
bsp_timer_stop
Definition:
Stop the timer
#include <platform.h>
int bsp_timer_stop(
int timer);
Arguments:
The timer to stop, see Table 45: ST200 timer
assignments on page 196.
timer
Returns:
Returns the error condition.
Description:
This function stops the timer. It should only be used with TIMER1 and TIMER2,
however TIMER1 should only be used if the profiler is not enabled. Do not use this
function with TIMER_SYSTEM.
bsp_timer_ticks_per_sec
Return the number of clock ticks per second
Definition:
#include <platform.h>
bspclock_t bsp_timer_ticks_per_sec(void);
Arguments:
None.
Returns:
The number of ticks per second.
Description:
bsp_timer_ticks_per_sec() returns the number of clock ticks per second.
8063762 Rev 9
221/246
ST200 board support package (BSP)
bsp_timer_user
Definition:
ST200
Set a user timer, attach an interrupt handle and enable the
corresponding interrupt
#include <platform.h>
int bsp_timer_user(
int timer,
unsigned int const,
unsigned int reload,
int (* interrupt_handle)(void *param),
int (** old_handle)(void *param));
Arguments:
timer
The user timer to set (TIMER1 or TIMER2).
const
The value to load to initialize the timer.
reload
The value to be reloaded when reaching zero.
interrupt_handle
The handle of the interrupt.
old_handle
The interrupt handle previously associated with the
timer.
Returns:
Returns BSP_OK on success, on failure it returns BSP_FAILURE and sets
bsp_errno to indicate the error.
Description:
This function set a user timer, attaches an interrupt handle and enables the
corresponding interrupt.
222/246
8063762 Rev 9
ST200
Branch trace buffer
Appendix C
Branch trace buffer
The branch trace buffer is an ST240 hardware feature intended to aid debugging, showing
the flow of control during execution of a program by recording the non-sequential updates of
the program counter (PC).
The ST240 branch trace buffer is an eight level deep FIFO buffer, which stores the source
and destination addresses for the last eight branches. The branch trace buffer can be
configured for all branches, a class of branches or a combination of branch classes. The
branch classes defined are general, subroutine and traps (see Section C.1: Branch trace
buffer modes for further details).
The branch trace buffer features are accessible though the GDB branchtrace command.
C.1
Branch trace buffer modes
The branch trace buffer can be configured to trace branch classes selectively. The traceable
branch classes and their symbolic names are listed in Table 57.
Table 57.
Traceable branch classes
Traceable branch class
Symbol
Description
general
gn
BR, BRF and GOTO instructions.
subroutine
sb
CALL and RETURN instructions.
traps
traps
All non-debug traps and RFI traps.
No branches
none
Trace nothing.
8063762 Rev 9
223/246
Branch trace buffer
C.2
ST200
The branchtrace command
The branchtrace command is enabled automatically when the host connects to a target.
It can also be enabled by issuing the GDB command enable_branch_trace (defined in
the brtrace.cmd GDB command script file).
The branchtrace command has the following format:
(gdb) branchtrace subcommand options
This command controls the branch trace buffer function specified by subcommand and
options.
Note:
For convenience, the branchtrace command is aliased to the brt command.
The subcommands supported by the branchtrace command are listed in Table 58 on
page 224.
Table 58.
Branchtrace subcommands
Subcommand
Options
Description
help
[subcommand]
Display help for the branchtrace command. If a
subcommand is specified then more detailed help
for the subcommand is displayed.
decode
on | off
Switch the decoding of ST240 opcodes on or off in
order to report the branch type. The default is on.
display
[reset]
Display the branch trace buffer content.
If reset is specified, then display the initial branch
trace contents instead of the current contents.
mode
mode
Set the mode of the branch trace buffer, where
mode is one of the symbols in Table 57 on
page 223.
reset
Stop the trace an reset the branch trace buffer
content.
save
Write the branch trace to file. The file is written in
the same format as the display command.
If reset is specified, then save the initial branch trace
contents instead of the current contents.
status
file [reset]
Display the configuration for the branch trace buffer.
When using either the display or save subcommands, use the reset option to report the
data held in the branch trace buffer, immediately after connecting to the target with GDB.
This can be useful as a post-mortem debugging aid when reconnecting to a target after a
crash.
224/246
8063762 Rev 9
ST200
C.3
Branch trace buffer
Output format
The display and save subcommands report the details of the eight branches taken most
recently, with the details of each branch described as follows:
#index to
address in function [at location]
from address in function [at location]
Mode: type [opcode]
where:
index
This is the record number. 0 is the most recent branch performed by the
target, 7 is the oldest.
address
This is the address of the branch source or destination.
function
This is the name of the function at the given address. ?? indicates that
the function name is not known.
location
This is the source address of the given address, if known.
type
This is the class of branch being recorded. This can be gn, sb, traps or
N/A (if the class in unknown or decode mode is off. See Table 57 on
page 223 for details of traceable branch classes.
opcode
This is the mnemonic of the branch instruction or (if this is not a branch
instruction) a hexadecimal number. The report displays 0xffffffff if
decode mode is off.
Figure 30 shows an example of a branch trace report.
Figure 30. Example branch trace output
#0 to
0x40000b20 in
from 0x40000858 in
Mode: sb [RETURN]
#1 to
0x40000798 in
from 0x400009d0 in
Mode: sb [RETURN]
#2 to
0x40000910 in
from 0x40000aa0 in
Mode: sb [RETURN]
#3 to
0x400009d8 in
from 0x40000908 in
Mode: sb [CALL]
#4 to
0x40000860 in
from 0x40000790 in
Mode: sb [CALL]
#5 to
0x400006e8 in
from 0x40000b18 in
Mode: sb [CALL]
brtrace_subroutine () at test_brt/branch_sb.c:68
func1 () at test_brt/branch_sb.c:27
func1 () at test_brt/branch_sb.c:22
func2 () at test_brt/branch_sb.c:43
func2 () at test_brt/branch_sb.c:38
func3 () at test_brt/branch_sb.c:55
func3 () at test_brt/branch_sb.c:46
func2 () at test_brt/branch_sb.c:38
func2 () at test_brt/branch_sb.c:31
func1 () at test_brt/branch_sb.c:22
func1 () at test_brt/branch_sb.c:15
brtrace_subroutine () at test_brt/branch_sb.c:67
The example in Figure 30 shows the most recent branch (branch #0) is a RETURN from
0x40000858 in the function func1 () (found in branch_sb.c line 27) back to
0x40000b20 in brtrace_subroutine () (branch_sb.c line 68).
8063762 Rev 9
225/246
Profiler plugin
Appendix D
ST200
Profiler plugin
Profiling is a performance analysis technique that identifies the areas in an application
where the CPU spends most time. Having identified these areas, it is then possible to target
optimization efforts on the specific parts of the code that will yield the greatest benefit in
terms of improving performance.
When a connection is made to a target using an ST Micro Connect, commands may be
issued through GDB to instruct the ST Micro Connect to collect sampling information about
a running application. This data is stored in a file and can then be analyzed using a profiling
tool (such as STWorkbench or st200gprof).
The profiler plugin is provided for ST200 targets and facilitates two different types of
profiling.
trace
The profiler samples the PC over a given period, time stamping each
sample. This method provides a view of the application’s activities
over a period of time. See Section D.2: Trace profile output format
on page 229.
range
The profiler accumulates the number of times that a particular region
of the application’s code is executed (in the manner of gprof; see the
GNU gprof documentation for more details). See also Section D.2:
Trace profile output format on page 229.
Profiling operates in one of three modes:.
none
The profiler collects samples only when the target stops at a
breakpoint or an I/O request occurs.
dsu
The profiler provides non-intrusive sampling of the program counter.
It is performed through the core’s DSU interface to obtain the current
address on the instruction bus. This mode is only valid for ST240
targets.
interrupt
This mode stops the target to read the PC directly before continuing.
This mode has a significant impact on the real-time performance of
the target, although it has the advantage of being able to read the
PC directly.
The ST Micro Connect profiler features are accessible through the GDB profiler
command.
226/246
8063762 Rev 9
ST200
D.1
Profiler plugin
Profiler plugin reference
The profiler command is enabled automatically when the host connects to a ST200
target. It can also be enabled by issuing the command enable_profiler (defined in the
st200profiler.cmd GDB command script file.
(gdb) profiler subcommand [options]
This command controls the profiler function specified by subcommand and options.
The subcommands supported by the profiler command are listed in Table 59.
Table 59.
Profiler subcommands
Subcommand
help
Option
[subcommand]
Description
Display help for the profiler command. If a subcommand is
specified then more detailed help for the subcommand is
displayed.
enable
Start the profiler on the STMC the next time the target is restarted. Samples are only taken and stored by the STMC while
the target is running. When the target is stopped, no samples
are taken.
disable
Stop the profiler on the STMC. Stopping the profiler implies a
reset.
reset
Discard the stored profiler data on the STMC.
display
Display the profiler data stored on the STMC.
save|append file
Save or append the profiler data stored on the STMC to file.
gmonout
file
Save or append the range profiler data stored on the STMC to
file using the gprof compatible gmon.out file format.
none | dsu | interrupt
Set the profiler sampling mode:
– none records samples when the target stops at a breakpoint
or an I/O request (this is the default).
– dsu records samples using the non-intrusive method of
sampling the PC (only applies to ST240 targets). See
Section D.2: Trace profile output format on page 229.
– interrupt records samples by briefly stopping the target to
sample the PC. See Section D.2: Trace profile output format
on page 229.
delay
Set the minimum sampling period for the profiler. The delay
period can be specified in seconds (s), milliseconds (ms) or
microseconds (us) by using the appropriate suffix. If no suffix is
specified, microseconds are assumed.
If period is not specified, profiling is effectively disabled. It is
therefore mandatory to set the sampling period.
mode
period
8063762 Rev 9
227/246
Profiler plugin
Table 59.
ST200
Profiler subcommands (continued)
Subcommand
Option
Description
none|trace|range
Set the type of profiler to be used:
– none indicates that no profiler is to be used (this is the
default)
– trace enables the trace profiler where each sample is time
sampled (see Section D.2: Trace profile output format on
page 229)
– range enables the sampling profiler which increments a
counter for an address range each time a sample is taken
(see Section D.3: Range profile output format on page 230)
trace
size
Set the maximum number of samples to store on the STMC. If
insufficient space is available on the STMC to store the
specified number of samples, profiling is effectively disabled.
When the sample buffer is full, the oldest samples are
discarded; therefore only size most recent samples are
returned.
The trace subcommand is mandatory when the type of the
profiler is set to trace.
range
Set the size, in number of instructions, of the slice of the
application's address range to associate with a counter. If
insufficient space is available on the STMC to store the
counters required for the specified address range, profiling is
effectively disabled.
The default address range for an application is determined by
size [startaddr endaddr]
the __stext and __etext symbols (placed by the linker), but
this may be overridden by specifying the start and end
addresses explicitly. The start and end addresses can be
specified symbolically or with absolute addresses.
The range subcommand is mandatory when the type of the
profiler is set to range.
type
228/246
8063762 Rev 9
ST200
D.2
Profiler plugin
Trace profile output format
If the profiler type is set to trace (using the command profile type trace), the profiler
trace display consists of a header line followed by a time-stamped list of sampled program
counter (PC) values.
The header line has the following format:
Trace Profiler (saved = saved_records, total = total_records, time = end_time)
where:
●
saved_records is the number of records saved in the buffer
●
total_records is the number of records captured since the profiling session started
●
end_time is the time of the last record captured since the profiling session started and
the profiler was reset
Using the trace profiler between two breakpoints provides an simple way to get an
approximation of the elapsed time between two given points in an application. To do this,
start (or reset) the profiler at the first breakpoint, then display the profiler data at the second
breakpoint. The end_time value gives the time elapsed between the two breakpoints.
If the saved_records value is less than the total_records value, the sample buffer
has wrapped. The number of discarded records is calculated from:
total_records - saved_records
The remainder of the profiler output is a list of PC samples. The number of samples is equal
to saved_records. The list has the following format:
accumulated_delta address function [at location]
where:
●
accumulated_delta is the accumulation of the time delta between samples since
profiling started
●
address is the sampled PC address
●
function is the name of the function at the given address (?? indicates that the
function name is unknown)
●
location is the source location of the given address, if known
Figure 31 provides an example of the output displayed for profile type trace.
Figure 31. Example profile type trace output
Trace Profiler (saved = 232, total = 232, time = 53393)
0000000000 0x84016f70, fn_0_993 () at fn2_0.c:6956
0000000171 0x84016e68, fn_0_990 () at fn2_0.c:6935
...
0000053206 0x84001bd4, fn_0_5 () at fn2_0.c:42
0000053393 0x84001a24, fn_0_0 () at fn2_0.c:5
8063762 Rev 9
229/246
Profiler plugin
D.3
ST200
Range profile output format
If the profiler type is set to range (using the command profile type range), the profiler
trace display consists of a header line followed by a list of the sample counters, each
representing a range of program memory. For each sample taken, the profiler increments
the counter for the address range (slot) where the PC is currently located.
The header line has the following format:
Range Profiler (range = address..address, step = step, slots = slots, rate = µs µs
per sample)
where:
●
address..address is the start and end address of the memory range
●
step is the size of each slot in bytes (as set by the range subcommand)
●
slots is the total number of slots
●
µs is the rate of sampling, in microseconds per sample
The remainder of the profiler output has the following form:
count
address:address,
function
where:
Note:
●
count is the sample count obtained for the given address range
●
address:address is the start and end address of the slot
●
function is the name of the function in which the slot is located (?? indicates that the
function name is unknown)
The report displays only non-zero sample counters.
Figure 32 provides an example of the output displayed for profile type range.
Figure 32. Example profile type range output
Range Profiler (range = 0x88001000..0x880174f2, step = 16, slots = 5713, rate =
128µs per sample)
0000000001 0x88001790:0x880017a0, f1 ()
0000002911 0x880017a0:0x880017b0, f1 ()
0000004159 0x880017b0:0x880017c0, f1 ()
0000002182 0x880017c0:0x880017d0, f2 ()
0000001065 0x880017d0:0x880017e0, f2 ()
0000001382 0x880017e0:0x880017f0, f2 ()
0000002129 0x880017f0:0x88001800, f2 ()
0000000468 0x88001800:0x88001810, f3 ()
0000000889 0x88001810:0x88001820, f3 ()
0000001446 0x88001820:0x88001830, f3 ()
0000000433 0x88001830:0x88001840, f4 ()
0000000753 0x88001840:0x88001850, f4 ()
0000001063 0x88001850:0x88001860, f4 ()
230/246
8063762 Rev 9
ST200
D.4
Profiler plugin
ST Micro Connect configuration options
The profiling data is collected by the ST Micro Connect. The profiler can also be controlled
by issuing ST Micro Connect configuration options to st200gdb.
Table 60 lists the ST Micro Connect configuration options that are equivalent to the profiler
sub-commands listed in Table 59 on page 227.
Table 60.
ST Micro Connect configuration options
Configuration option
Equivalent to
stmcconfigure profiler=on
profiler enable
stmcconfigure profiler=off
profiler disable
stmcconfigure profiler=reset
profiler reset
stmcconfigure profiler.mode=mode
profiler mode mode
stmcconfigure profiler.period=delay
profiler period delay
stmcconfigure profiler.type=type
profiler type type
stmcconfigure profiler.type.trace=size
profiler trace size
stmcconfigure
profiler range size startaddr endaddr
profiler.type.range=startaddr:endaddr:bytes(1)
1. Unless overridden, startaddr is the address of the __stext symbol and endaddr is the address of the __etext symbol.
bytes is the size, in bytes, of the number of instructions specified by size. startaddr:endaddr:bytes must have the
hex form 0x<hexvalue>0x<hexvalue>:0x<hexvalue>.
8063762 Rev 9
231/246
Profiler plugin
D.5
ST200
Examples
The following GDB command script shows how to configure the ST Micro Connect to use
the trace profiler in non-intrusive mode, automatically appending the results to a file every
time the program stops and then resetting the profiler data:
profiler
profiler
profiler
profiler
profiler
mode dsu
period 1ms
type trace
trace 65536
enable
define hook-stop
profiler append "a.dat"
profiler reset
end
continue
profiler disable
The following script describes a similar example that uses the range profiler, except that the
results file and the gmon.out file are overwritten each time the target stops and the profiler
data continues to accumulate on the ST Micro Connect:
profiler
profiler
profiler
profiler
profiler
mode dsu
period 1ms
type range
range 8
enable
define hook-stop
profiler save "a.dat"
profiler gmonout "gmon.out"
end
continue
profiler disable
To produce a human readable profiling report using the st200gprof tool, use following
command line:
$> st200gprof --no-graph <appname.out> gmon.out
The --no-graph option is necessary in this case because the gmon.out file produced by
the profiler plugin does not contain call graph information.
232/246
8063762 Rev 9
ST200
ST TargetPack plugin
Appendix E
ST TargetPack plugin
The ST TargetPack plugin provides the following services to GDB.
●
It defines the memory mapped registers specified for an SoC by the ST TargetPack as
GDB convenience variables.
●
It defines GDB commands that can be used for displaying the contents of the memory
mapped registers in various formats.
The convenience variables and GDB commands are similar to those generated by the
--gdb-mmrs option of the sttpdebug tool provided in the ST Micro Connection Package.
See ST TargetPack user manual (8020851) for information about the sttpdebug tool.
These features are accessible through the GDB targetpack command.
E.1
The targetpack command
When a host connects to a target using an ST TargetPack, the targetpack command is
enabled automatically. It can also be enabled by issuing the GDB command
enable_target (as defined in the GDB command script file targetpack.cmd.)
The targetpack command has the following format:
targetpack subcommand options
This command controls the ST TargetPack function specified by subcommand and
options.
The subcommands supported by the targetpack command are listed in Table 61.
Table 61.
Targetpack subcommands
Subcommand
help
import
export
Options
Description
[subcommand]
Display help for the targetpack command. If
subcommand is specified, then more detailed
help for subcommand is displayed.
targetstring
Import the ST TargetPack register set associated
with the specified targetstring. If connecting
to a target using the st200tp (or related)
connection command, then the command
targetpack import is automatically invoked
after connecting to the target.
[file]
Export the register convenience variables and
commands into GDB. To export the convenience
variables and commands to a GDB command file
for later use, specify the name of the file with
file.
8063762 Rev 9
233/246
ST TargetPack plugin
ST200
For example, when connected to a target, the following command sets up the memory
mapped user commands and convenience variables:
targetpack export
This command also displays further information on how to list the available memory mapped
register names.
The following examples (for a STi5301 SoC) show how to use the memory mapped user
commands and convenience variables.
List all register groups user commands:
help mmrs_component
List all registers:
help mmrs_register
Decode and display register contents:
mmrs_SysServ_MODE_CONTROL -v
List all register convenience variables:
help mmrs_convenience
The targetpack command is available only when connected to a target. However, it is not
necessary to connect to a target using an ST TargetPack in order to to use the
targetpack command, nor is it necessary to import or export the same targetstring
used for the original target connection.
The following example illustrates this. After connecting to a simulated MB424 target, use the
targetpack command to export the ST TargetPack register set to a GDB script file called
mb424regs.cmd:
st200sp mb424sim
enable_targetpack
targetpack import stmc:mb424:st231
targetpack export mb424regs.cmd
234/246
8063762 Rev 9
ST200
GDB os21_time_logging user command
Appendix F
GDB os21_time_logging user command
OS21 records the elapsed time that a task has been run on the CPU. This value is available
to an application by using the OS21 task_status() API.
As a convenience, the GDB command os21_time_logging is provided to display the
task list with the elapsed time for each task. This command is defined in the GDB script file
os21timelog.cmd and displays the information with the following format:
task-number [task-name] = time-usus (time-ticks ticks) [*]
where:
task-number is the OS21 task number
task-name is the OS21 task name
time-us is the elapsed time in microseconds
time-ticks is the elapsed time in clock ticks
* indicates the current task
For example:
(gdb) source os21timelog.cmd
(gdb) os21_time_logging
1 [Root Task] = 14607us (22824 ticks) *
2 [Idle Task] = 9985us (15602 ticks)
3 [task0] = 19995us (31243 ticks)
4 [task1] = 39994us (62491 ticks)
5 [task2] = 59992us (93738 ticks)
6 [task3] = 79993us (124990 ticks)
Note:
As the CPU clock is still running when the target is under the control of GDB, this time will
be accumulated against the current task (indicated by a *) when the target is restarted.
Using the same example as above but having previously already hit a breakpoint in Root
Task:
1
2
3
4
5
6
[Root Task] = 204545us (319602 ticks) *
[Idle Task] = 9985us (15602 ticks)
[task0] = 19994us (31242 ticks)
[task1] = 39985us (62478 ticks)
[task2] = 59993us (93740 ticks)
[task3] = 79992us (124988 ticks)
The time in each task is comparable except for Root Task which now includes the time
accumulated while the target was under the control of GDB.
8063762 Rev 9
235/246
Revision history
ST200
Revision history
Table 62.
Date
10-Oct-2011
12-Oct-2010
09-Feb-2010
236/246
Document revision history
Revision
Changes
9
Supports the ST200 R7.2.
Updated Section 5.1: Loading and executing a target program on page 40.
Updated -o output-file in Section 11.5: Analyzing the results on page 109.
Added Section B.2.3: L2 cache on page 193.
Added RUNTIME_L2_CACHE_SYSTEM_ADDRESS to Table 56 on page 203.
H
Supports the ST200 R7.1.
Updated the list of supported hosts in Section 1.1: Toolset features on page 13 and
Section 3.1: Toolset overview on page 25.
Removed redundant reference to stm8010 files in Section 1.5: The examples directory
on page 20 and in Section 10: Booting OS21 from Flash ROM on page 96.
Update introduction to Chapter 4: Board target configuration on page 27.
Corrected Section 4.1.2: Generating code for a board target on page 28 default settings
for -mboard.
Updated Section 4.3.1: Overriding the memory layout of an existing board target on
page 34 to add alternative source of custom values.
Updated step 7. on page 36 in Section 4.3.3: Defining a custom board target and
compiling a program on page 35.
Updated the introduction to Chapter 11: OS21 Trace on page 98.
Updated the BNF description in Section 11.1.2: User definition file on page 100 and
introduced os21usertracegen.
Added Section 11.1.3: os21usertracegen host tool on page 103 and Section 11.1.4:
os21usertracegen example on page 106.
Removed Section 11.6.3: Tips for creating an os21usertrace definition file on page 115
which is redundant with the introduction of os21usertracegen.
G
Supports the ST200 R7.0.
Re-ordered the sections in 4: Board target configuration on page 27.
Updated Section 4.3: Customizing board targets on page 34 throughout.
Added 4.4: Customizing SoC targets on page 37.
Minor syntax correction to Section 11.1.2: User definition file on page 100.
8063762 Rev 9
ST200
Table 62.
Date
01-Dec-2009
15-Jun-2009
Revision history
Document revision history (continued)
Revision
Changes
F
Supports the ST200 R6.5.
Updated Section 1.1: Toolset features on page 13 to add ST TargetPacks.
Updated OS21 examples on page 21.
Updated -mboard in Section 4.1.2: Generating code for a board target on page 28.
Section 5.3.6: ST200 GDB commands:
– Table 11, updated enable_dsu command and removed dsu version command
– Table 12, updated enable_pmblock command
Updated Chapter 6: Using STWorkbench on page 58 throughout.
Added details of “OS21 Trace user record” throughout Chapter 11: OS21 Trace on
page 98.
Updated Section 11.4: Running the application on page 108.
Updated Section C.2: The branchtrace command on page 224, adding the reset
option to the display and save subcommands.
Added Appendix E: ST TargetPack plugin on page 233.
Added Appendix F: GDB os21_time_logging user command on page 235.
E
Supports the ST200 R6.4.
Throughout: removed all references to ST220, which is no longer supported.
Updated Section 1.5: The examples directory on page 20 and Chapter 10: Booting
OS21 from Flash ROM on page 96 to add os21/rombootrom.
Updated set args in Table 9: st200gdb command quick reference on page 49 and
removed the command target sim.
Updated -T timeout in Table 13: st200xrun command line options on page 55.
Updated Chapter 11: OS21 Trace on page 98.
Updated Section 11.9: GDB commands on page 117 throughout.
Updated Section 11.11: Trace library API on page 126, adding the functions:
os21_trace_initialize_activity_moditors, os21_trace_set_mode,
os21_task_trace_set_mode, os21_activity_set_class_enable,
os21_activity_set_enable, os21_set_task_trace_enable,
os21_api_set_class_enable, os21_api_set_enable.
Added new Chapter 13: Dynamic OS21 profiling on page 167.
Added Section B.9: Retrieving internal run-time data on page 203.
Updated Section B.10: BSP function definitions on page 204, adding the function
bsp_rtrecord_get.
8063762 Rev 9
237/246
Revision history
Table 62.
Date
20-Dec-2008
08-Jul-2008
238/246
ST200
Document revision history (continued)
Revision
Changes
D
Supports the ST200 R6.3.
Updated Section 1.3.4: The syscalls low-level I/O interface on page 18.
Added syscalls to Section 1.5: The examples directory on page 20 and os21/trace
to OS21 examples on page 21.
Corrected st200xrun command line in Chapter 2: Introducing OS21.
Corrected Note in Section 5.1: Loading and executing a target program on page 40.
Updated the examples in Section 5.3.3: Connecting to a running target on page 46.
Corrected gdb example in Section 8.1.1: Customized simulator targets on page 84.
Added Chapter 11: OS21 Trace on page 98.
Added Section A.11: Watchpoint support on page 190.
Removed bsp_timer_count_mode() from Table 47 in Section B.4.5: Timer header
file: machine/bsp/timer.h on page 197 and from Section B.10: BSP function definitions.
Removed bsp_pm_count_mode() from Table 49 in Section B.5.1: Hardware
abstraction layer for the PM module on page 198 and from Section B.10.
Corrected bsp_mmu_memory_map description in Section B.10: BSP function definitions
on page 204.
Updated Table 57 in Section C.1: Branch trace buffer modes on page 223.
Updated Table 58 in Section C.2: The branchtrace command on page 224.
Added Section C.3: Output format on page 225.
Updated Appendix D: Profiler plugin on page 226 to describe the profiler modes none,
dsu and interrupt. The profiler modes none and interrupt now apply to all ST200
cores. dsu mode applies to ST240 only.
Added Section D.2: Trace profile output format on page 229 and Section D.3: Range
profile output format on page 230.
Updated Section D.5: Examples on page 232.
C
Supports the ST200 R6.2.
Minor clarifications to Chapter 1: Toolset overview on page 13.
Removed host and info directories from Table 1: The release directories on page 19,
changed docs to doc.
Updated the list of supplied examples in Section 1.5 on page 20.
Added Linux 4.0 and removed Windows 2000 from the list of supported platforms in
Section 3.1 on page 25.
Updated Section 3.2: st200cc command line on page 26 and Section 4.1: Configuring
the run-time code for a target on page 27 to better differentiate configuration options for
st200cc and st200xrun.
Updated steps 6. and 8. in Section 4.3.3: Defining a custom board target and compiling
a program on page 35.
Added note to Chapter 5: Cross development tools on page 40 to direct users to the
STMC release notes for details of TargetPacks.
Corrected Section 5.3: The GNU debugger on page 43.
Added Section 5.3.3: Connecting to a running target on page 46.
Added the command disconnect to Table 9: st200gdb command quick reference in
Section 5.3.5 on page 49.
(Continued overpage)
8063762 Rev 9
ST200
Table 62.
Date
Revision history
Document revision history (continued)
Revision
Changes
08-Jul-2008
Added the command ondisconnect to Table 10: ST200 st200gdb non-specific
commands in Section 5.3.6 on page 51.
Updated Section 5.4.2: st200xrun command line reference on page 55 throughout and
added new options -u, -D and --.
Updated Section 5.4.3: st200xrun command line examples on page 56, adding new
examples.
Updated Section 6.1: Getting started with STWorkbench on page 58.
Re-written Section 6.2: STWorkbench tutorials on page 62, listing the latest tutorials.
Updated 6.3 ST Profiling and Coverage tutorials. (Section 6.3: ST200 System Analysis
tutorials and reference pages on page 63 in revision F of this manual).
C
(continued) Updated the instructions in Section 7.4: Changing the target on page 68.
Updated Figure 16, Figure 21 and Figure 22 in Chapter 7 to use current processors.
Added Section 7.17: Using the Debug Support Unit Window on page 82.
Corrected st200xrun command line in Section 8.1: Simulator pack on page 84.
Changed lx-elf32/src/os21/lib/ST200 to src/os21/lib/ in Chapter 9:
OS21 source guide on page 92.
Added Appendix C: Branch trace buffer on page 223.
Added Appendix D: Profiler plugin on page 226.
Changed “target string” to “TargetString” throughout.
Corrected other minor non-technical errors.
13-Feb-2008
B
The GDB extended commands appendix has been removed and the contents merged
with Section 5.3.6: ST200 GDB commands on page 51.
The Building open sources chapter has been removed.
Section 1.2.3: Configuration scripts updated.
Section 5.3.1: Using GDB updated.
Additional items added to Table 13: st200xrun command line options.
Chapter 3: Code development tools added.
Two OS21 commands removed from Chapter 9: OS21 source guide.
General update of the language used throughout the document.
13-Sep-2007
A
Initial release.
8063762 Rev 9
239/246
ST200
Index
Index
Symbols
__rambase . . . . . . . . . . . . . . . . . . . . . . . . . 34-35
__ramsize . . . . . . . . . . . . . . . . . . . . . . . . . . 34-35
__rombase . . . . . . . . . . . . . . . . . . . . . . . . . 34-35
__romsize . . . . . . . . . . . . . . . . . . . . . . . . . . 34-35
_pollkey . . . . . . . . . . . . . . . . . . . . . . . . . . . . .187
_stack . . . . . . . . . . . . . . . . . . . . . . . . . . . . . . . .34
A
address conversion . . . . . . . . . . . . . . . . . . . . .14
address space usage . . . . . . . . . . . . . . . . . . . .41
allocators
fixed block . . . . . . . . . . . . . . . . . . . . . . . . . . .24
simple . . . . . . . . . . . . . . . . . . . . . . . . . . . . . .24
user definable . . . . . . . . . . . . . . . . . . . . . . . .24
archive . . . . . . . . . . . . . . . . . . . . . . . . . . . . . . .14
generate index . . . . . . . . . . . . . . . . . . . . . . .15
archiver . . . . . . . . . . . . . . . . . . . . . . . . . . . . . .13
assembler . . . . . . . . . . . . . . . . . . . . . . . . . . . . .14
B
Backus-Naur Form . . . . . . . . . . . . . . . . . . . . . .12
binutils
GNU package . . . . . . . . . . . . . . . . . . . . . . . .14
BNF. See Backus-naur Form.
board
bring up . . . . . . . . . . . . . . . . . . . . . . . . . . . . .27
selection . . . . . . . . . . . . . . . . . . . . . . . . . . . .32
board support
libraries . . . . . . . . . . . . . . . . . . . . . . . . . .16, 94
package . . . . . . . . . . . . . . . . . . . . . . . . . . . . .24
board targets
building and debugging . . . . . . . . . . . . . . . . .37
configuration . . . . . . . . . . . . . . . . . . . . . . . . .27
custom . . . . . . . . . . . . . . . . . . . . . . . . . . . . . .34
generating code . . . . . . . . . . . . . . . . . . . . . .28
BOOT_FROM_RESET . . . . . . . . . . . . . . . . . .87
BOOT_ROM_BASE . . . . . . . . . . . . . . . . . . . . .87
BOOT_ROM_SIZE . . . . . . . . . . . . . . . . . . . . . .88
branch trace on ST240 . . . . . . . . . . . . . . 223-224
breakpoints . . . . . . . . . . . . . . 13, 49, 65, 69, 184
BSP . . . . . . . . . . . . . . . . . . . . . . . . . . . . . . . . .24
bsp_cache_invalidate_instruction . . . . . . . . .204
bsp_cache_invalidate_instruction_all . . . . . . .204
bsp_cache_purge_data . . . . . . . . . . . . . . . . .204
bsp_cache_purge_data_all . . . . . . . . . . . . . .205
bsp_core_interrupt_install . . . . . . . . . . . . . . .205
bsp_core_interrupt_lock . . . . . . . . . . . . . . . . 205
bsp_core_interrupt_unlock . . . . . . . . . . . . . . 206
bsp_ipu_region_get . . . . . . . . . . . . . . . . . . . . 206
bsp_itc_interrupt_clear . . . . . . . . . . . . . . . . . 206
bsp_itc_interrupt_disable . . . . . . . . . . . . . . . 206
bsp_itc_interrupt_enable . . . . . . . . . . . . . . . . 207
bsp_itc_interrupt_install . . . . . . . . . . . . . . . . . 208
bsp_itc_interrupt_poll . . . . . . . . . . . . . . . . . . 209
bsp_itc_interrupt_raise . . . . . . . . . . . . . . . . . 209
bsp_itc_interrupt_uninstall . . . . . . . . . . . . . . . 210
bsp_memory_map_s . . . . . . . . . . . . . . . . . . . . 38
bsp_mmu_dump_TLB_Settings . . . . . . . . . . 210
bsp_mmu_memory_map . . . . . . . . . . . . . . . . 211
bsp_mmu_memory_unmap . . . . . . . . . . . . . . 214
bsp_mmu_reset . . . . . . . . . . . . . . . . . . . . . . . 214
bsp_pm_clock_get . . . . . . . . . . . . . . . . . . . . 214
bsp_pm_clock_set . . . . . . . . . . . . . . . . . . . . . 215
bsp_pm_count_mode . . . . . . . . . . . . . . . . . . 215
bsp_pm_counter_get . . . . . . . . . . . . . . . . . . . 215
bsp_pm_counter_set . . . . . . . . . . . . . . . . . . . 215
bsp_pm_event_get . . . . . . . . . . . . . . . . . . . . 216
bsp_pm_event_set . . . . . . . . . . . . . . . . . . . . 216
bsp_pm_reset . . . . . . . . . . . . . . . . . . . . . . . . 216
bsp_pm_start . . . . . . . . . . . . . . . . . . . . . . . . . 216
bsp_pm_stop . . . . . . . . . . . . . . . . . . . . . . . . . 217
bsp_rtrecord_get . . . . . . . . . . . . . . . . . . . . . . 217
bsp_scu_disable . . . . . . . . . . . . . . . . . . . . . . 217
bsp_scu_dump_SCU_Settings . . . . . . . . . . . 217
bsp_scu_read . . . . . . . . . . . . . . . . . . . . . . . . 218
bsp_scu_write . . . . . . . . . . . . . . . . . . . . . . . . 218
bsp_timer_count_get . . . . . . . . . . . . . . . . . . . 218
bsp_timer_count_set . . . . . . . . . . . . . . . . . . . 219
bsp_timer_interrupt_clear . . . . . . . . . . . . . . . 219
bsp_timer_interrupt_enable . . . . . . . . . . . . . . 219
bsp_timer_now . . . . . . . . . . . . . . . . . . . . . . . 220
bsp_timer_reload_get . . . . . . . . . . . . . . . . . . 220
bsp_timer_reload_set . . . . . . . . . . . . . . . . . . 220
bsp_timer_start . . . . . . . . . . . . . . . . . . . . . . . 221
bsp_timer_stop . . . . . . . . . . . . . . . . . . . . . . . 221
bsp_timer_ticks_per_sec . . . . . . . . . . . . . . . . 221
bsp_timer_user . . . . . . . . . . . . . . . . . . . . . . . 222
bsp_user_end_handle . . . . . . . . . . . . . . . . . . 202
bsp_user_start_handle . . . . . . . . . . . . . . . . . 201
BUNDLE_CHECKING_ON . . . . . . . . . . . . . . . 88
BUNDLE_CHECKING_RE_ON . . . . . . . . . . . 88
BUS_BYTES_PER_CYCLE . . . . . . . . . . . . . . 87
BUS_BYTES_PER_TRANSACTION . . . . . . . 87
BUS_LATENCY . . . . . . . . . . . . . . . . . . . . . . . 87
BUS_MHZ . . . . . . . . . . . . . . . . . . . . . . . . . . . . 86
8063762 Rev 9
240/246
Index
ST200
BUS_TRAFFIC_OUTPUT_TRACE_FILE . . . .88
BUS_TRAFFIC_TRACE_END_CYCLE . . . . . .88
BUS_TRAFFIC_TRACE_START_CYCLE . . . .88
BUS_TRAFFIC_TRACING_ON . . . . . . . . . . . .88
critical sections . . . . . . . . . . . . . . . . . . . . . . . 178
custom board target . . . . . . . . . . . . . . . . . . . . 34
cyclic redundancy check . . . . . . . . . . . . . . . . . 94
Cygwin . . . . . . . . . . . . . . . . . . . . . . . . . . . . . . 189
C
D
C . . . . . . . . . . . . . . . . . . . . . . . . . . . . . . . . . . . .25
library . . . . . . . . . . . . . . . . . . . . . . . . . . . . . .17
library header files . . . . . . . . . . . . . . . . . . . . .19
run-time libraries . . . . . . . . . . . . . . . . 16-17, 22
C++ . . . . . . . . . . . . . . . . . . . . . . . . . . . . . . . . .25
library . . . . . . . . . . . . . . . . . . . . . . . . . . . . . .18
library header files . . . . . . . . . . . . . . . . . . . . .19
run-time libraries . . . . . . . . . . . . . . . . . . . 16-17
symbols . . . . . . . . . . . . . . . . . . . . . . . . . . . . .14
cache API . . . . . . . . . . . . . . . . . . . . . . . . . . . . .24
CLEAR_MEMORY . . . . . . . . . . . . . . . . . . . . . .89
clock frequencies . . . . . . . . . . . . . . . . . . . . . . .93
command line
GDB commands . . . . . . . . . . . . . 48-54, 56, 77
st200cc . . . . . . . . . . . . . . . . . . . . . . . . . . . . .26
st200xrun . . . . . . . . . . . . . . . . . . . . . . . . . . .55
compilation. See st200cc, st200c++ and STWorkbench
CONF_CALLBACK_SUPPORT . . . . . . . . . . . .93
CONF_DEBUG . . . . . . . . . . . . . . . . . . . . . . . .93
CONF_DEBUG_ALLOC . . . . . . . . . . . . . . . . .93
CONF_DEBUG_CHECK_EVT . . . . . . . . . . . . .93
CONF_DEBUG_CHECK_MTX . . . . . . . . . . . .93
CONF_DEBUG_CHECK_SEM . . . . . . . . . . . .93
CONF_DISPLAY_CLOCK_FREQS . . . . . . . . .93
CONF_INLINE_FUNCTIONS . . . . . . . . . . . . .93
CONFIG_FILE . . . . . . . . . . . . . . . . . . . . . . . . .86
configuration files . . . . . . . . . . . . . . . . . . . . . . .19
configuration matrix . . . . . . . . . . . . . . . . . . . . .33
configuration options
OS21 . . . . . . . . . . . . . . . . . . . . . . . . . . . . . . .92
st200cc compiler . . . . . . . . . . . . . . . . . . . 26-33
target system. See TargetPack and
simulator pack
configuration script . . . . . . . . . . . . . . . . . . .16, 20
connection to target . . . . . . . . . . . . . . 44, 56, 84
for Insight . . . . . . . . . . . . . . . . . . . . . . . . . . .68
that is running . . . . . . . . . . . . . . . . . . . . . . . .46
core
selection . . . . . . . . . . . . . . . . . . . . . . . . . . . .31
core registers . . . . . . . . . . . . . . . . . . . . . . . . . .42
initialization . . . . . . . . . . . . . . . . . . . . . . . . . .42
CORE_MHZ . . . . . . . . . . . . . . . . . . . . . . . . . . .86
counting semaphores . . . . . . . . . . . . . . . . . . . .24
CRC . . . . . . . . . . . . . . . . . . . . . . . . . . . . . . . . .94
DCACHE_MODEL . . . . . . . . . . . . . . . . . . . . . 86
debug kernel . . . . . . . . . . . . . . . . . . . . . . . . . . 93
debugger . . . . . . . . . . . . . . . . . . . . . . . 13, 15, 43
Insight . . . . . . . . . . . . . . . . . . . . . . . . . . . . . . 67
debugging . . . . . . . . . . . . . . . . . . . . . . . . . . . . 43
board targets . . . . . . . . . . . . . . . . . . . . . . . . 37
OS21 aware . . . . . . . . . . . . . . . . . . . . . . . . . 22
with Insight . . . . . . . . . . . . . . . . . . . . . . . . . . 67
with OS21 . . . . . . . . . . . . . . . . . . . . . . . . . . 183
defines.mkf . . . . . . . . . . . . . . . . . . . . . . . . 36, 39
device plug-ins . . . . . . . . . . . . . . . . . . . . . . . . 89
DEVICE_PLUGIN_MODULES . . . . . . . . . . . . 89
directory structure . . . . . . . . . . . . . . . . . . . . . . 19
disabling timeslicing . . . . . . . . . . . . . . . . . . . 181
disassembling code . . . . . . . . . . . . . . . . . . . . . 49
discard symbols . . . . . . . . . . . . . . . . . . . . . . . . 15
documentation set . . . . . . . . . . . . . . . . . . . . . . 19
DSU window . . . . . . . . . . . . . . . . . . . . . . . . . . 82
DSU_DEFAULT_MODULE_ENABLED . . . . . 89
DSU_ROM_IMAGE . . . . . . . . . . . . . . . . . . . . . 89
DUMP_CONFIG_FILE . . . . . . . . . . . . . . . . . . 86
241/246
E
Eclipse . . . . . . . . . . . . . . . . . . . . . . . . . . . . . . . 58
ELF format files . . . . . . . . . . . . . . . . . . . . . . . . 15
embedded applications
developing . . . . . . . . . . . . . . . . . . . . . . . . . . 13
environment setup . . . . . . . . . . . . . . . . . . . . . . 55
Ethernet . . . . . . . . . . . . . . . . . . . . . . . . . . . . . . 14
event flags . . . . . . . . . . . . . . . . . . . . . . . . . . . . 24
examples
applications . . . . . . . . . . . . . . . . . . . . . . . . . 16
debugging with Insight . . . . . . . . . . . . . . . . . 67
OS21 . . . . . . . . . . . . . . . . . . . . . . . . . . . . . . 21
st200xrun . . . . . . . . . . . . . . . . . . . . . . . . . . . 56
exception handlers . . . . . . . . . . . . . . . . . . . . . 24
exceptions . . . . . . . . . . . . . . . . . . . . . . . . . . . 184
execute program
memory location . . . . . . . . . . . . . . . . . . . . . . 41
exit paths . . . . . . . . . . . . . . . . . . . . . . . . . . . . 186
EXTERNAL_MEMORY_BASE . . . . . . . . . . . . 87
EXTERNAL_MEMORY_PATTERN . . . . . . . . 89
EXTERNAL_MEMORY_SIZE . . . . . . . . . . . . . 87
8063762 Rev 9
ST200
Index
F
FIFO message queues . . . . . . . . . . . . . . . . . . .24
FIFO scheduler . . . . . . . . . . . . . . . . . . . .24, 178
file management . . . . . . . . . . . . . . . . . . . . . . .161
file size . . . . . . . . . . . . . . . . . . . . . . . . . . . . . . .15
fixed block allocator . . . . . . . . . . . . . . . . .24, 177
Flash ROM
examples . . . . . . . . . . . . . . . . . . . . . . . . . . . .14
G
GCC
package . . . . . . . . . . . . . . . . . . . . . . . . . . . . .15
GDB . . . . . . . . . . . . . . . . . . . . . . . . . 13, 43, 184
branch trace . . . . . . . . . . . . . . . . . . . . . . . .224
command line interface . . . . . . . . . . . . . . . . .43
command line reference . . . . 48-49, 51-54, 77
command reference . . . . . . . . . . . . . . . . . .117
Insight . . . . . . . . . . . . . . . . . . . . . . . . . . . . . .64
OS21 aware debugging . . . . . . . . . . . . . . . .22
profiler . . . . . . . . . . . . . . . . . . . . . . . . . . . . .227
tips . . . . . . . . . . . . . . . . . . . . . . . . . . . . . . . .186
GDI
commands . . . . . . . . . . . . . . . . . . . . . . . . . . .80
GNU
assembler . . . . . . . . . . . . . . . . . . . . . . . . . . .14
binutils . . . . . . . . . . . . . . . . . . . . . . . . . . . . . .14
C compiler . . . . . . . . . . . . . . . . . . . . . . . . . . .13
C++ compiler . . . . . . . . . . . . . . . . . . . . . . . . .15
debugger. See GDB.
GCC . . . . . . . . . . . . . . . . . . . . . . . . . . . . . . .15
linker . . . . . . . . . . . . . . . . . . . . . . . . . . . . . . .14
make . . . . . . . . . . . . . . . . . . . . . . . . . . . . . . .15
profiler . . . . . . . . . . . . . . . . . . . . . . . . . .14, 226
target debugger . . . . . . . . . . . . . . . . . . . . . . .15
test coverage . . . . . . . . . . . . . . . . . . . . . . . . .15
toolchain . . . . . . . . . . . . . . . . . . . . . . . . . . . .24
GUI . . . . . . . . . . . . . . . . . . . . . . . . . . . . . . . . . .64
configuration files . . . . . . . . . . . . . . . . . . . . .19
ICACHE_MODEL . . . . . . . . . . . . . . . . . . . . . . 86
index to archive . . . . . . . . . . . . . . . . . . . . . . . . 15
initialization hook . . . . . . . . . . . . . . . . . . . . . . . 43
inlined list manipulation functions . . . . . . . . . . 93
Insight . . . . . . . . . . . . . . . . 15-16, 43, 46, 64-82
Breakpoint menu . . . . . . . . . . . . . . . . . . . . . 70
Breakpoints window . . . . . . . . . . . . . . . . . . . 70
Console Window . . . . . . . . . . . . . . . . . . 64, 77
Debug support unit window . . . . . . . . . . . . . 82
Function Browser window . . . . . . . . . . . . . . 78
Global menu . . . . . . . . . . . . . . . . . . . . . . . . . 70
Help menu . . . . . . . . . . . . . . . . . . . . . . . . . . 70
Local Variables window . . . . . . . . . . . . . . . . 76
Memory Preferences window . . . . . . . . . . . . 73
Memory window . . . . . . . . . . . . . . . . . . . . . . 73
Performance monitoring window . . . . . . . . . 81
Processes window . . . . . . . . . . . . . . . . . 79, 82
Registers window . . . . . . . . . . . . . . . . . . . . . 72
Source Window . . . . . . . . . . . . . . . . . . . . . . 65
toolbar . . . . . . . . . . . . . . . . . . . . . . . . . . . . 65
ST2x0 Statistics window . . . . . . . . . . . . . . . . 80
Stack window . . . . . . . . . . . . . . . . . . . . . . . . 71
Target Selection window . . . . . . . . . . . . . . . 68
Watch window . . . . . . . . . . . . . . . . . . . . . . . 75
instruction-set accurate mode . . . . . . . . . . . . . 83
integrity checks . . . . . . . . . . . . . . . . . . . . . . . . 93
internal C run-time initialization . . . . . . . . . . . . 42
interrupt handlers . . . . . . . . . . . . . . . . . . . . . . 24
interrupt_mask() . . . . . . . . . . . . . . . . . . . . . . 178
interrupt_mask_all() . . . . . . . . . . . . . . . . . . . . 178
interrupt_unmask() . . . . . . . . . . . . . . . . . . . . 178
inter-task communication . . . . . . . . . . . . . . . . 24
ISS mode . . . . . . . . . . . . . . . . . . . . . . . . . . . . . 83
K
kernel
real-time . . . . . . . . . . . . . . . . . . . . . . . . . . . . 13
real-time library . . . . . . . . . . . . . . . . . . . . . . . 16
KERNEL_STACK_SIZE . . . . . . . . . . . . . . . . . 87
keyboard input . . . . . . . . . . . . . . . . . . . . . . . . 187
H
HAZARD_CHECKING_ON . . . . . . . . . . . . . . .88
heap allocator . . . . . . . . . . . . . . . . . . . . . . . . .177
heaps . . . . . . . . . . . . . . . . . . . . . . . . . . . . . . . .24
help
Insight . . . . . . . . . . . . . . . . . . . . . . . . . . . . . .70
st200xrun . . . . . . . . . . . . . . . . . . . . . . . . . . .55
I
I/O streams . . . . . . . . . . . . . . . . . . . . . . . . . . . .16
L
L2 cache . . . . . . . . . . . . . . . . . . . . . . . . . . . . 193
libc . . . . . . . . . . . . . . . . . . . . . . . . . . . . . . . . . . 16
libdtf . . . . . . . . . . . . . . . . . . . . . . . . . . . . . . . . . 16
libgcc . . . . . . . . . . . . . . . . . . . . . . . . . . . . . . . . 16
libgcov . . . . . . . . . . . . . . . . . . . . . . . . . . . . . . . 16
libgprof . . . . . . . . . . . . . . . . . . . . . . . . . . . . . . . 16
libm . . . . . . . . . . . . . . . . . . . . . . . . . . . . . . . . . 16
librarian . . . . . . . . . . . . . . . . . . . . . . . . . . . . . . 13
library files . . . . . . . . . . . . . . . . . . . . . . . . . . . . 19
8063762 Rev 9
242/246
Index
ST200
libstdc++ . . . . . . . . . . . . . . . . . . . . . . . . . . .16, 18
linker . . . . . . . . . . . . . . . . . . . . . . . . . . . . . . 13-14
options . . . . . . . . . . . . . . . . . . . . . . . . . . . . .107
Linux . . . . . . . . . . . . . . . . . . . . . . . . . . . . . .13, 25
LIST_CONFIG variable . . . . . . . . . . . . . . .36, 39
LMI RAM memory . . . . . . . . . . . . . . . . . . . . . .41
load program
memory location . . . . . . . . . . . . . . . . . . . . . .41
See also st200xrun, STWorkbench and
st200insight
low-level I/O . . . . . . . . . . . . . . . . . . . . . . . . . . .16
lx-elf32 . . . . . . . . . . . . . 14, 16, 19-20, 46, 84-86
M
make . . . . . . . . . . . . . . . . . . . . . . . . . . . . . . . .15
malloc . . . . . . . . . . . . . . . . . . . . . . . . . . . . . . .177
man(1) . . . . . . . . . . . . . . . . . . . . . . . . . . . . . . .19
managing memory . . . . . . . . . . . . . . . . . . . . .175
manual pages . . . . . . . . . . . . . . . . . . . . . . . . . .19
memory
allocation . . . . . . . . . . . . . . . . . . . . . . . .22, 161
change location . . . . . . . . . . . . . . . . . . . . . . .41
LMI RAM . . . . . . . . . . . . . . . . . . . . . . . . . . . .41
management . . . . . . . . . . . . . . . . . . . . . .24, 93
memory managers . . . . . . . . . . . . . . . . . . .177
partitions . . . . . . . . . . . . . . . . . . . . . . . . . . .175
protection settings . . . . . . . . . . . . . . . . . . . . .35
MEMSYSTEM_LATENCY . . . . . . . . . . . . . . . .86
MODE . . . . . . . . . . . . . . . . . . . . . . . . . . . . . . .86
multi-tasking . . . . . . . . . . . . . . . . . . . . . . . .22, 24
mutexes . . . . . . . . . . . . . . . . . . . . . . . . . .24, 180
N
newlib . . . . . . . . . . . . . . . . . . . . . . . . 17, 24, 177
features . . . . . . . . . . . . . . . . . . . . . . . . . . . . .17
NONCACHEABLE_MEM_SIZE . . . . . . . . . . . .87
O
object files
copy . . . . . . . . . . . . . . . . . . . . . . . . . . . . . . . .15
information . . . . . . . . . . . . . . . . . . . . . . . . . .15
list symbols . . . . . . . . . . . . . . . . . . . . . . . . . .15
translate . . . . . . . . . . . . . . . . . . . . . . . . . . . .15
on-chip emulation . . . . . . . . . . . . . . . . . . . . . . .13
OS21 . . . . . . . . . . . . . . . . . . . . . . . . . . . . . . . .13
applications . . . . . . . . . . . . . . . . . . . . . . . . . .17
board support libraries . . . . . . . . . . . . . .16, 94
configurable options . . . . . . . . . . . . . . . . . . .92
critical sections . . . . . . . . . . . . . . . . . . . . . .178
debugging . . . . . . . . . . . . . . . . . . . . . . . . . .183
243/246
examples . . . . . . . . . . . . . . . . . . . . . . . . . . . 21
introduction . . . . . . . . . . . . . . . . . . . . . . . . . . 22
kernel . . . . . . . . . . . . . . . . . . . . . . . . . . . . . . 93
key features . . . . . . . . . . . . . . . . . . . . . . . . . 24
libraries . . . . . . . . . . . . . . . . . . . . . . . . . . . . . 93
memory allocation . . . . . . . . . . . . . . . . . . . . 22
OS21 aware debugging . . . . . . . . . . . . . . . . 22
profiler . . . . . . . . . . . . . . . . . . . . . . . . . . . . . 15
profiling . . . . . . . . . . . . . . . . . . . . . . . . . . . . 167
real-time kernel . . . . . . . . . . . . . . . . . . . . . . . 22
real-time kernel library . . . . . . . . . . . . . . . . . 16
scheduler . . . . . . . . . . . . . . . . . . . . . . . . . . 178
source code . . . . . . . . . . . . . . . . . . . . . . . . . 92
stack traces . . . . . . . . . . . . . . . . . . . . . . . . 183
tick duration . . . . . . . . . . . . . . . . . . . . . . . . 196
OS21 Trace . . . . . . . . . . . . . . . . . . . . . . . . . . . 98
binary files . . . . . . . . . . . . . . . . . . . . . . . . . 115
GDB commands . . . . . . . . . . . . . . . . . . . . . 117
GDB commands example . . . . . . . . . . . . . 122
GDB control commands . . . . . . . . . . . . . . . 123
user APIs . . . . . . . . . . . . . . . . . . . . . . . . . . . 98
user defined events . . . . . . . . . . . . . . . . . . . 98
OS21 Trace binary files
os21tasktrace.bin . . . . . . . . . . . . . . . . . . . . 117
os21trace.bin . . . . . . . . . . . . . . . . . . . . . . . 116
os21trace.bin.ticks . . . . . . . . . . . . . . . . . . . 116
os21_time_logging . . . . . . . . . . . . . . . . . . . . 235
os21decodetrace . . . . . . . . . . . . 98-99, 109, 111
control file . . . . . . . . . . . . . . . . . . . . . . . . . . 112
example . . . . . . . . . . . . . . . . . . . . . . . . . . . 114
os21usertrace . . . . . . . . . . . . . . . . . . . . . . 98-99
definition file . . . . . . . . . . . . . . . . . . . . . . . . 100
example . . . . . . . . . . . . . . . . . . . . . . . . . . . 113
os21usertracegen . . . . . . . . . . . . . . . . . . . . . . 98
OUTPUT_LOG_FILE . . . . . . . . . . . . . . . . . . . 88
OUTPUT_TRACE_FILE . . . . . . . . . . . . . . . . . 88
P
partition manager . . . . . . . . . . . . . . . . . . . . . 177
path names . . . . . . . . . . . . . . . . . . . . . . . . . . 186
peek . . . . . . . . . . . . . . . . . . . . . . . . . . . . . . . . . 13
PERIPHERAL_BASE . . . . . . . . . . . . . . . . . . . 88
PERIPHERAL_LATENCY . . . . . . . . . . . . . . . . 87
Perl . . . . . . . . . . . . . . . . . . . . . . . . . . . . . . 92, 95
platforms . . . . . . . . . . . . . . . . . . . . . . . . . . . . . 13
plugin
device . . . . . . . . . . . . . . . . . . . . . . . . . . . . . . 89
plugins
profiler . . . . . . . . . . . . . . . . . . . . . . . . . . . . 226
ST TargetPack . . . . . . . . . . . . . . . . . . . . . . 233
poke . . . . . . . . . . . . . . . . . . . . . . . . . . . . . . . . . 13
8063762 Rev 9
ST200
Index
polling keyboard input . . . . . . . . . . . . . . . . . .187
preprocessor
symbols . . . . . . . . . . . . . . . . . . . . . . . . . . . . .92
printable strings . . . . . . . . . . . . . . . . . . . . . . . .15
profiler . . . . . . . . . . . . . . . . . . . . . . . 14, 226-232
PROFILING . . . . . . . . . . . . . . . . . . . . . . . . . . .89
PROFILING_OUTPUT_FILE . . . . . . . . . . . . . .89
program execution startup . . . . . . . . . . . . . . . .20
program termination . . . . . . . . . . . . . . . . . . . .186
R
R_Absolute . . . . . . . . . . . . . . . . . . . . . . . . . . .145
R_PIC . . . . . . . . . . . . . . . . . . . . . . . . . . . . . . .145
R_Relocatable . . . . . . . . . . . . . . . . . . . . . . . .145
real-time kernel . . . . . . . . . . . . . . . . . 13, 16, 22
Red Hat . . . . . . . . . . . . . . . . . . . . . . . . . . . . . .13
reference mode . . . . . . . . . . . . . . . . . . . . . . . .83
release directories . . . . . . . . . . . . . . . . . . . . . .19
relocatable loader library . . . . . . . . . . . . .15, 145
file management . . . . . . . . . . . . . . . . . . . . .161
memory allocation . . . . . . . . . . . . . . . . . . . .161
relocatable run-time model . . . . . . . . . . . . . . .146
RESET_ADDRESS . . . . . . . . . . . . . . . . . . . . .87
RESET_DELAY_CYCLES . . . . . . . . . . . . . . . .87
rl_add_action_callback . . . . . . . . . . . . . . . . . .157
rl_delete_action_callback . . . . . . . . . . . . . . . .158
rl_errarg . . . . . . . . . . . . . . . . . . . . . . . . . . . . .160
rl_errno . . . . . . . . . . . . . . . . . . . . . . . . . . . . . .158
rl_errstr . . . . . . . . . . . . . . . . . . . . . . . . . . . . . .160
rl_file_name . . . . . . . . . . . . . . . . . . . . . . . . . .150
rl_foreach_segment . . . . . . . . . . . . . . . . . . . .156
rl_handle_delete . . . . . . . . . . . . . . . . . . . . . . .149
rl_handle_new . . . . . . . . . . . . . . . . . . . . . . . .149
rl_lib . . . . . . . . . . . . . . . . . . . . . . . . . . . . . . . .145
rl_load_addr . . . . . . . . . . . . . . . . . . . . . . . . . .150
rl_load_buffer . . . . . . . . . . . . . . . . . . . . . . . . .151
rl_load_file . . . . . . . . . . . . . . . . . . . . . . . . . . .152
rl_load_size . . . . . . . . . . . . . . . . . . . . . . . . . .150
rl_load_stream . . . . . . . . . . . . . . . . . . . . . . . .153
rl_parent . . . . . . . . . . . . . . . . . . . . . . . . . . . . .150
rl_set_file_name . . . . . . . . . . . . . . . . . . . . . . .151
rl_sym . . . . . . . . . . . . . . . . . . . . . . . . . . . . . . .155
rl_sym_rec . . . . . . . . . . . . . . . . . . . . . . . . . . .155
rl_this . . . . . . . . . . . . . . . . . . . . . . . . . . . . . . .149
rl_unload . . . . . . . . . . . . . . . . . . . . . . . . . . . .154
run-time libraries . . . . . . . . . . . . . . . . . 16-17, 19
run-time model . . . . . . . . . . . . . . . . . . . . . . . .145
S
scheduler . . . . . . . . . . . . . . . . . . . . . . . . . . . . .24
scheduler behavior . . . . . . . . . . . . . . . . . . . . .178
semaphores . . . . . . . . . . . . . . . . . . . . . . . 24, 181
shtdi . . . . . . . . . . . . . . . . . . . . . . . . . . . . . . . . . 94
data tables . . . . . . . . . . . . . . . . . . . . . . . . . . 95
simple allocator . . . . . . . . . . . . . . . . . . . . . . . 177
simulator . . . . . . . . . . . . . . . . . . . . . . . . . . 83-91
fast mode . . . . . . . . . . . . . . . . . . . . . . . . . . . 83
ISS mode . . . . . . . . . . . . . . . . . . . . . . . . . . . 83
reference mode . . . . . . . . . . . . . . . . . . . . . . 83
SuperH . . . . . . . . . . . . . . . . . . . . . . . . . . . . . 14
simulator pack . 16, 28, 37, 44, 55-57, 68, 84-90
SoC
custom . . . . . . . . . . . . . . . . . . . . . . . . . . . . . 37
selection . . . . . . . . . . . . . . . . . . . . . . . . . . . . 32
software
notation . . . . . . . . . . . . . . . . . . . . . . . . . . . . . 12
parameters . . . . . . . . . . . . . . . . . . . . . . . . . . 42
source files
OS21 . . . . . . . . . . . . . . . . . . . . . . . . . . . . . . 19
special purpose allocator . . . . . . . . . . . . . . . . 175
ST Micro Connect . . . . . . . . . . . . . 11, 14, 23, 40
connecting to a running target . . . . . . . . . . . 46
connecting to a target . . . . . . . . . . . . . . . 43-44
power up . . . . . . . . . . . . . . . . . . . . . . . . . . . 187
profiling . . . . . . . . . . . . . . . . . . . . . . . . 226-232
selecting target for Insight . . . . . . . . . . . . . . 68
ST Micro Connection Package . . . . . . 16, 37, 44
ST TargetPack. See TargetPack
st200addr2line . . . . . . . . . . . . . . . . . . . . . . . . 185
st200as . . . . . . . . . . . . . . . . . . . . . . . . . . . . . . 26
st200c++ . . . . . . . . . . . . . . . . . . . . . . . . . . 15, 25
st200cc . . . . . . . . . . . . . . . . . .15, 29, 37, 84, 94
building relocatable library . . . . . . . . . 161-163
command line . . . . . . . . . . . . . . . . . . . . . . . . 27
examples . . . . . . . . . . . . . . . . . . . . . 23, 26, 40
interfaces . . . . . . . . . . . . . . . . . . . . . . . . . . . 26
introduction . . . . . . . . . . . . . . . . . . . . . . . . . . 25
selecting OS . . . . . . . . . . . . . . . . . . . . . . . . . 93
st200gcov . . . . . . . . . . . . . . . . . . . . . . . . . . . . 16
st200gdb 15-16, 26, 42-43, 46, 49-50, 64, 84, 89,
. . . . . . . . . . . . . . . . . . . . . . . . . . . . . . . . 186, 231
command line . . . . . . . . . . . . . . . . . . . . . 48-54
connecting to target . . . . . . . . . . . . . . . . . . . 44
exit . . . . . . . . . . . . . . . . . . . . . . . . . . . . . . . . 45
st200gprof . . . . . . . . . . . . . . . . . . . . . . . . 16, 226
st200insight. See Insight
st200ld . . . . . . . . . . . . . . . . . . . . . . . . . . . . . . . 26
st200objdump . . . . . . . . . . . . . . . . . . . . . . . . 185
ST200TOOLS_DIR . . . . . . . . . . . . . . . . . . 35, 38
st200xrun . . . . . . . . 13, 15-16, 26, 28, 37, 42, 89
command line reference . . . . . . . . . . . . . . . . 55
examples . . . . . . . . . . . . . . . . . . . . . . . . 23, 56
loading target . . . . . . . . . . . . . . . . . . . . . . . . 40
8063762 Rev 9
244/246
Index
ST200
running simulator . . . . . . . . . . . . . . . . . . .84, 89
setup . . . . . . . . . . . . . . . . . . . . . . . . . . . . . . .55
ST2x0 Statistics window . . . . . . . . . . . . . . . . .80
stack traces . . . . . . . . . . . . . . . . . . . . . .183, 185
standard templates library . . . . . . . . . . . . . . . .16
start parameter initialization . . . . . . . . . . . . . . .42
statistics command . . . . . . . . . . . . . . . . . . . . . .80
stepping through source code . . . . . . . . . .50, 65
STIMULATION_FILE . . . . . . . . . . . . . . . . . . . .89
STL . . . . . . . . . . . . . . . . . . . . . . . . . . . . . . . . . .16
STWorkbench . . . . . . . . . . . . . . . . . . 58-63, 110
editor . . . . . . . . . . . . . . . . . . . . . . . . . . . . 59-61
perspective . . . . . . . . . . . . . . . . . . . . . . . 59-61
view . . . . . . . . . . . . . . . . . . . . . . . . . . . . . 59-61
SuperH simulator . . . . . . . . . . . . . . . . . . . . . . .14
support for new boards . . . . . . . . . . . . . . . . . .94
symbols
discard . . . . . . . . . . . . . . . . . . . . . . . . . . . . . .15
encoded . . . . . . . . . . . . . . . . . . . . . . . . . . . .14
list . . . . . . . . . . . . . . . . . . . . . . . . . . . . . . . . .15
synchronization . . . . . . . . . . . . . . . . . . . . . . . .24
sysconf code module . . . . . . . . . . . . . . . . . . . .28
system heap . . . . . . . . . . . . . . . . . . . . . . . . . . .24
TargetPack . . . . . . . . . . . 16, 20, 28, 31, 37, 40,
. . . . . . . . . . . . . . . . . . . . . . . 44, 55-56, 233-234
targetpack command . . . . . . . . . . . . . . . . . . . 233
TargetString . . . . . . . . . . . . . . . . . . 40, 44, 56, 84
task / interrupt critical sections . . . . . . . . . . . 178
task / task critical sections . . . . . . . . . . . . . . . 179
task aware debugging . . . . . . . . . . . . . . . . . . . 94
task_lock() . . . . . . . . . . . . . . . . . . . . . . . . . . . 179
task_unlock() . . . . . . . . . . . . . . . . . . . . . . . . . 179
timeslicing . . . . . . . . . . . . . . . . . . . . . . . . . . . . 24
disabling . . . . . . . . . . . . . . . . . . . . . . . . . . . 181
TLB . . . . . . 37-38, 191, 194-195, 199, 210, 214
tools directory . . . . . . . . . . . . . . . . . . . . . . . . . 19
toolset configuration . . . . . . . . . . . . . . . . . . . . 30
toolset introduction . . . . . . . . . . . . . . . . . . 13-14
trace on ST240 . . . . . . . . . . . . . . . . . . . 223-224
TRACE_END_CYCLE . . . . . . . . . . . . . . . . . . . 88
TRACE_START_CYCLE . . . . . . . . . . . . . . . . 88
tracing an application . . . . . . . . . . . . . . . . . . . 98
TRACING_ON . . . . . . . . . . . . . . . . . . . . . . . . . 88
TRANSACTION_SETUP_CYCLES . . . . . . . . 87
translate object files . . . . . . . . . . . . . . . . . . . . . 15
U
T
user debug interface . . . . . . . . . . . . . . . . . . . . 13
target
changing with Insight . . . . . . . . . . . . . . . . . . .68
configuration for compilation . . . . . . . . . .27, 30
connection . . . . . . . . . . . . . . . . . . . 44, 46, 186
debugger . . . . . . . . . . . . . . . . . . . . . . . . . . . .15
loader . . . . . . . . . . . . . . . . . . . . . . . . . . . . . .15
245/246
W
watch expressions . . . . . . . . . . . . . . . . . . . . . . 75
watchpoints . . . . . . . . . . . . . . . . . . . . 51, 66, 190
Windows . . . . . . . . . . . . . . . . . . . . . . . . . . . . . 25
platforms . . . . . . . . . . . . . . . . . . . . . . . . . . . . 13
-Wz . . . . . . . . . . . . . . . . . . . . . . . . . . . . . . . . . 34
8063762 Rev 9
ST200
Please Read Carefully:
Information in this document is provided solely in connection with ST products. STMicroelectronics NV and its subsidiaries (“ST”) reserve the
right to make changes, corrections, modifications or improvements, to this document, and the products and services described herein at any
time, without notice.
All ST products are sold pursuant to ST’s terms and conditions of sale.
Purchasers are solely responsible for the choice, selection and use of the ST products and services described herein, and ST assumes no
liability whatsoever relating to the choice, selection or use of the ST products and services described herein.
No license, express or implied, by estoppel or otherwise, to any intellectual property rights is granted under this document. If any part of this
document refers to any third party products or services it shall not be deemed a license grant by ST for the use of such third party products
or services, or any intellectual property contained therein or considered as a warranty covering the use in any manner whatsoever of such
third party products or services or any intellectual property contained therein.
UNLESS OTHERWISE SET FORTH IN ST’S TERMS AND CONDITIONS OF SALE ST DISCLAIMS ANY EXPRESS OR IMPLIED
WARRANTY WITH RESPECT TO THE USE AND/OR SALE OF ST PRODUCTS INCLUDING WITHOUT LIMITATION IMPLIED
WARRANTIES OF MERCHANTABILITY, FITNESS FOR A PARTICULAR PURPOSE (AND THEIR EQUIVALENTS UNDER THE LAWS
OF ANY JURISDICTION), OR INFRINGEMENT OF ANY PATENT, COPYRIGHT OR OTHER INTELLECTUAL PROPERTY RIGHT.
UNLESS EXPRESSLY APPROVED IN WRITING BY TWO AUTHORIZED ST REPRESENTATIVES, ST PRODUCTS ARE NOT
RECOMMENDED, AUTHORIZED OR WARRANTED FOR USE IN MILITARY, AIR CRAFT, SPACE, LIFE SAVING, OR LIFE SUSTAINING
APPLICATIONS, NOR IN PRODUCTS OR SYSTEMS WHERE FAILURE OR MALFUNCTION MAY RESULT IN PERSONAL INJURY,
DEATH, OR SEVERE PROPERTY OR ENVIRONMENTAL DAMAGE. ST PRODUCTS WHICH ARE NOT SPECIFIED AS "AUTOMOTIVE
GRADE" MAY ONLY BE USED IN AUTOMOTIVE APPLICATIONS AT USER’S OWN RISK.
Resale of ST products with provisions different from the statements and/or technical features set forth in this document shall immediately void
any warranty granted by ST for the ST product or service described herein and shall not create or extend in any manner whatsoever, any
liability of ST.
ST and the ST logo are trademarks or registered trademarks of ST in various countries.
Information in this document supersedes and replaces all information previously supplied.
The ST logo is a registered trademark of STMicroelectronics. All other names are the property of their respective owners.
© 2011 STMicroelectronics - All rights reserved
STMicroelectronics group of companies
Australia - Belgium - Brazil - Canada - China - Czech Republic - Finland - France - Germany - Hong Kong - India - Israel - Italy - Japan Malaysia - Malta - Morocco - Philippines - Singapore - Spain - Sweden - Switzerland - United Kingdom - United States of America
www.st.com
246/246
8063762 Rev 9