1
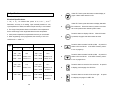
55
This unit passes the following tests
EN 61326-1:2006
(CISPR11,IEC/EN 61000-3-2:2006,
IEC/EN 61000-3-3: 1995+A1 :2001+A2:2005
IEC/EN 61000-4-2/-3/-5/-6/-11)
WARNING:
Do not use the thermometer/data
logger before you read the users
manual
and
the
following
instructions.
Do not turn the power off while data logging is in
progress. Always press the REC button to stop
data logging. Power interruption could cause loss
of all data stored in SD or SDHC card.
Do not open the top cover. If users open the top
cover, calibration may be invalid. Thermometer
needs to be returned for re-calibration.
54
VI. Maintenance & Cleaning
1. Servicing not covered in this manual should only be performed by
qualified personnel.
Repairs should only be performed by qualified
personnel.
2. Periodically wipe the case and cable with a damp cloth and
detergent; do not use abrasives or solvents.
3. Please remove all the batteries if users won’t use the thermometer
for a long time.
Address of Agent, Distributor, Importer, or Manufacturer
53
Table of Contents
I.
Features ......................................................................................3
II. Panel Description.......................................................................4
A.
Front Panel ................................................................................ 4
B.
Data and Curve in the LCD ........................................................ 8
C.
Alarm Status in the LCD............................................................. 9
D.
File List in the LCD................................................................... 10
E.
Setup Menu in the LCD.............................................................11
F.
Rear Panel ............................................................................... 12
G.
Top Panel................................................................................. 13
III. Operation ..................................................................................14
52
A.
Thermocouple Temperature Measurement .............................. 14
B.
Select Type of Thermocouple................................................... 16
C.
Select ℃ or ℉.......................................................................... 17
D.
Review Data and Curve of Overall Trend ................................. 17
E.
Setup of HI Limit and LO Limit ................................................. 18
F.
Alarm Function......................................................................... 19
G.
Reset LCD Display by Pressing SETUP or FILE Button........... 20
H.
Record Data............................................................................. 21
I.
Review Data and Curve of Overall Trend in a File.................... 22
J.
Zoom into Details of a Curve in a File ...................................... 24
K.
Delete Data File in the SD or SDHC card................................. 26
L.
Review Alarm Status in a File................................................... 27
M.
Hardcopy of the LCD content ................................................... 28
N.
Turn the Label of Y-axis On or Off ............................................ 29
1
O.
Turn the Backlight On or Off .....................................................30
P.
Program Engineering Unit.........................................................31
Q.
Calculate Coefficients for the Engineering Unit (E.U.)...............33
R.
Connect Analog Input with a Mini Connector (Optional)............35
S.
Lower the Analog Input to Less Than ±60mV (3 examples) ......36
T.
Connect the 4 to 20mA Signal (1 example)...............................41
U.
Remove the SD or SDHC Card ................................................43
V.
Format the SD or SDHC Card by the Thermometer..................44
W.
Format the SD or SDHC Card with a PC ..................................45
X.
On-line HELP Function .............................................................46
Y.
Internal Temperature Reference ...............................................47
V. Battery Replacement
Battery Power
IV. Specifications...........................................................................48
V. Battery Replacement ...............................................................51
1. When power is turned on, the % (percentage) of battery power is
VI. Maintenance & Cleaning .........................................................53
displayed at the right top corner of LCD.
If the % is less than or
equal to 1%, please replace the batteries with new ones.
2. Turn off the power and remove all the thermocouples connected.
3. Remove the screw of the battery cover.
4. Lift and remove the battery cover.
5. Remove the old batteries and insert eight new 1.5V SUM-3 alkaline
batteries.
6. Install the battery cover and secure the screw.
2
51
Cold Junction
±0.5
/ ±0.9
I. Features
Compensation Accuracy:
Temperature Coefficient:
0.01% of F.S. / ℃
Isolated Input Protection
350Vp-p
between any two inputs:
Dimension:
257(L) x 155(W) x 57(H) mm
■
8 input temperature measurement/data logging (℃/℉)
■
Graphic display of overall trend for each input
■
4.5” STN LCD (240 x 128) with backlight
■
Timers for the durations out of HI and LO limits
■
Selection of 11 types of thermocouple (K, J, E, T, R, S, N,…)
10.1" (L) x 6.1" (W) x 2.2" (H)
■
Easy socket for thermocouple mini connector
Weight:
1160g / 40.9oz (Batteries included)
■
Operation Environment:
0
Storage Environment:
-20
Accessories:
User manual x 1
~ 50 , 85% RH
~ 60 , 75% RH
1.5V AA alkaline batteries x 8
USB cable x 1
Software CD x 1
Software manual x 1
Option:
Basic accuracy 0.05% ± 1 ℃ (K type)
■ Programmable Hi-Lo alarm for each input.
■
Display of max and min values for each input
■
Sampling Rate 8 Inputs / 1 second
■
24 Hour Recording with Alkaline Batteries of 2400mAH
■
Standard 2G SD memory card (stores 3.8-year data)
■
Optional 8G SDHC memory card
■
SD card directly read by PC
■
Easy data file management (Read and Delete functions)
SD card (2GB) x 1
■
Built-in calendar clock
K-type thermocouples (-50~200℃ /
■
Independent Input Setup (type of thermocouple, Hi-Lo alarm
-58 ~392℉): 1-meterx7pcs.;
values, name of Engineering Unit)
3-meterx1pc.
■
Isolated Input Protection of 350Vp-p between any two inputs
Carrying bag x 1
■
Programmable Engineering Unit (E.U.) to integrate Analog
Thermal Printer
SDHC card (8GB, Maximum)
Mini connector for analog Input
Optical RS-232 to USB bridge
Output (-60 to 60 mV) from instruments (e.g. Sound level meter,
Humidity meter, Current adaptor)
■
Screen hardcopy into files
■
Paperless Recorder
■
Ready to use package (Thermocouples, Memory Card, and
Batteries etc.)
50
3
T
II. Panel Description
A. Front Panel
R/S
N
L
U
B
C
1
9
4
2
mV
-200 ~ -150
±3.0
-328 ~ -238
±5.4
-150 ~ -100
±0.1% ±1.5
-238 ~ -148
±0.1%±2.7
-100 ~ 400
±0.1% ±0.5
-148 ~ 752
±0.1% ±0.9
0 ~ 100
±5.0
32 ~ 212
±9.0
100 ~ 300
±3.0
212 ~ 572
±5.4
300 ~ 999.9
±0.05% ±2.0
572 ~ 999.9
±0.05% ±3.6
1000 ~ 1600
±0.1% ±2.0
1000 ~ 2912
±0.1% ±3.6
0 ~ 999.9
±0.1% ±1.0
32 ~ 999.9
±0.1% ±1.8
1000 ~ 1300
±0.2% ±1.0
1000 ~ 2372
±0.2% ±1.8
-200 ~ 900
±0.1% ±1.0
-328 ~ 999.9
±0.1 % ±1.8
1000 ~ 1652
±0.2 % ±1
32 ~ 999.9
±0.1% ±1.8
1000 ~ 1112
±0.2% ±1
0 ~ 600
±0.1% ±1.0
600 ~ 999.9
±0.05% ±2.0
1112 ~ 1831
±0.05% ±3.6
1000 ~ 1760
±0.1% ±2.0
1832 ~ 3200
±0.1% ±3.6
0 ~ 999.9
±0.1% ±1.5
32 ~ 999.9
±0.1% ±2.7
1000 ~ 1760
±0.2% ±1.5
1000 ~ 3200
±0.2% ±2.7
-60 ~ 60
±60 µV
-60 ~ 60
±60 µV
10
6
7
3
5
General Specifications
11
8
18
12
LCD
4.5” STN LCD (240 x 128)
Battery Type:
1.5V AA alkaline batteries x 8
AC Adaptor:
DC Regulated 12V / 300mA output
AC 110V or 220V Input
19
Power Consumption:
13
15 14 17 16
4
100mA (with backlight)
70mA (without backlight)
49
Under FILE mode, press this button to select display of
IV. Specifications
1.
graph or alarm status stored in a file.
Electrical Specifications:
1. 23℃ ± 5℃, 10 minutes after power is on, 0.1/1 ℃, 0.1/1℉
Under FILE mode, press this button to display data after
Resolution, Accuracy is of reading, input overload protection is 10V,
input impedance is 100KΩ, and thermocouple accuracy is not included.
2.
file is selected.
Press this button to redraw curve when
two cursor positions are marked by REC button.
2. The range of temperature does not include the room temperature.
So the actual range is the range listed less the room temperature.
Press this button to display a file list. When this button
3. Cold junction temperature compensation accuracy is not included.
4. When engineering unit is programmed, the accuracy of mV is for
3.
is pressed, the graph and alarm status are reset.
coefficient A = 1 and B = 0
Press this button to select from IN1 to IN8.
Type
Range
K
J
Range
Accuracy
-200 ~ -150
±3.0
-328 ~ -238
±5.4
-150 ~ -100
±2.0
-238 ~ -148
±3.6
-100 ~ 999.9
±0.05% ±1.0
-148 ~ 999.9
±0.05% ±1.8
1000 ~ 1370
±0.2% ±1.0
1000 ~ 2498
±0.2% ±1.8
-200 ~ -100
±2.5
-328 ~ -148
±4.5
-100 ~ 100
±1.5
-148 ~ 212
±2.7
±0.05% ±1.0
212 ~ 999.9
±0.05% ±1.8
1000 ~ 1832
±0.2% ±1
100 ~ 999.9
E
Accuracy
-150 ~ -100
±2.0
-238 ~ -148
±3.6
-100 ~ 760
±0.05% ±1.0
-148 ~ 999.9
±0.05% ±1.8
1000 ~ 1400
±0.2% ±1
48
4.
Or press it to
select a file in the file list. In the HELP function, press it
to turn 10 pages up.
Press this button to select from IN1 to IN8.
5.
Or press it to
select a file in the file list. In the HELP function, press it
to turn 10 pages down.
Press this button to move the line cursor left. Or press it
6.
to display previous page of a HELP file.
Press this button to move the line cursor right.
7.
it to display next page of a HELP file.
5
Or press
Y. Internal Temperature Reference
Press this button to display SETUP menu. Press again
8.
to show internal reference temperature.
Press and hold
this button for 2 seconds to turn the backlight on or off.
Press this button to increment value in the SETUP menu.
9.
Or press this button to increment the time stamp by 1
second in a file and the data are displayed below the time
stamp.
Press this button to decrement value in the SETUP
10.
menu. Or under FILE mode, press this button to
decrement the time stamp by 1 second in a file and the
data are displayed below time stamp.
Press SETUP button to toggle the display of setup menu and the
display the internal temperature for each input (when thermocouple is
Press this button to record data.
11.
press this button again.
To stop recording data,
connected).
In the zoom function, it is used
to mark cursor position.
These temperature readings are used for cold junction temperature
compensation for the thermometer itself.
12.
Delete button. Press this button to delete a selected file
in a file list.
Under GRAPH mode, press this button to hardcopy the
13.
content of LCD into a file. Graph and alarm status are
all stored.
14.
Press this button and select type of thermocouple or mV.
6
47
X. On-line HELP Function
1. Press SETUP button. A setup menu is displayed.
2. Press HELP button. A HELP file is displayed.
Under SETUP, press this button to display a help file.
15.
3. Press ►pg or ◄pg to page up or down.
In the real time mode, press it to turn the label of Y-axis
on or off.
4. Press ▲ or ▼ to turn 10 pages up or down.
16.
Alarm button: press this button to display alarm status in
real time.
Press this button to select ℃ or ℉ as temperature unit.
17.
5. Press the following buttons to turn to corresponding page directly.
18.
19.
Press this button to display curve of overall trend and
data in real time.
Press this button to turn the power on or off.
6. To exit HELP function, press the SETUP button.
46
7
B. Data and Curve in the LCD
W. Format the SD or SDHC Card with a PC
When the GRAPH button is pressed, the following figure is shown:
1
2
3
4
5
6
7
1. Insert the SD or SDHC card into the slot for SD card in a PC.
2. Select the device of SD card, and click on the right button of mouse.
3. The following table is shown, please enter parameters as shown.
8
9
10
11
12
1. Minimum and Maximum Temperature Values during the time interval
at the Current Cursor Position
2. Time Interval at the Current Cursor Position
3. Current Operating Status (FILE, REC, and NONE)
Warning: All data files are deleted after re-format. So before re-format
4. Label of Each Input (can be programmed). Label of Selected Input is
the SD or SDHC card, users should store needed files in a PC.
Reverse Video.
5. Minimum and Maximum Values of Selected Input
Note: To restore HELP files and DEMO files, copy the directory of
6. Current Date and Time
METER in the software CD-ROM to the SD card after re-format.
7. Type of Thermocouple, mV or Engineering Unit
8
45
V. Format the SD or SDHC Card by the Thermometer
8. Line Cursor
9. Time Interval of the Whole Graph
1. Hold the REC button, and turn the power on.
10. Label of Y-axis
2. Users will be asked to “RELEASE REC BUTTON”. Then release
11. Time per Horizontal Division
REC button as instructed.
12. Temperature per Vertical Division.
3. Users will be asked to confirm the format of SD card.
4. Select “YES” to format SD or SDHC card.
C. Alarm Status in the LCD
When the ALARM button is pressed, the alarm status is shown in LCD.
Warning: All data files are deleted after re-format. So before re-format
1
2
3
4
the SD or SDHC card, users should store needed files in a PC.
Note: To restore HELP files and DEMO files, copy the directory of
METER in the software CD-ROM to the SD card after re-format.
5
6
1. Minimum Value of Each Input
2. Duration under LO Limit
3. Maximum Value of Each Input
4. Duration over HI Limit
5. Beginning Date and Time of Recording Period
6. Ending Date and Time of Recording Period
44
9
D. File List in the LCD
U. Remove the SD or SDHC Card
When the FILE button is pressed, a file list is shown in LCD.
If users need to retrieve data stored in the SD or SDHC card, users
need to remove the SD or SDHC card from the unit.
1. Users turn the power off of the unit and, remove the screw of battery
cover.
2. Users will find the SD or SDHC card when the battery cover is
removed.
3. Push the SD or SDHC card with users finger nail, and the card will
eject from the socket.
4. Pull the SD or SDHC card with users finger nail.
Note: File name marked by “X” is a damaged file which is caused by
5. Plug the SD or SDHC card into the socket of a PC or a Note Book.
power interruption. Data of a damaged file can not be recovered.
The card is ready to be read by a PC or a Note Book.
6. Replace the screw and battery cover.
Note: If the message of “SD or SDHC CARD WRITE PROTECT” is
shown, move the sliding lever of SD or SDHC card in the opposite
direction. If the message is still shown, then replace with a new SD or
SDHC card.
Note: The maximum size of SD or SDHC card used by the
thermometer is 8 G bytes.
10
43
Example 1: Voltage transmitting 0 to 240V by a 4-20mA transmitter
E. Setup Menu in the LCD
1. First convert 4 to 20 mA to 4 to 20mV using the above circuitry.
When users press the SETUP button, a setup menu is shown in LCD.
2. Using Y = A * X + B, find the coefficients A and B.
1
0 V = A * 4 mV + B
2
3
4
240 V = A * 20 mV + B
3. Solve the equation, we have A = 15, B = -60,
4. Program A = 15, B = -60 and unit = V.
6
7
1. LO Limit
2. HI Limit
3. % of Available Battery Power
4. Temperature Unit in ℃ or ℉
5. Type of Thermocouple
6. SD-CARD or SDHC CARD
7. Used Bytes of SD or SDHC card
8. Free Bytes not Used of SD or SDHC card
42
11
8
5
F. Rear Panel
T. Connect the 4 to 20mA Signal (1 example)
1
3
2
4
5
6
If the input is a 4 to 20mA signal, users can convert the mA signal to
mV signal by placing a 1 ohm resistor between two terminals.
Then
4mA becomes 4mV and 20mA becomes 20mV.
1. AC to DC Adaptor Input
2. USB Interface for PC Communication
3. Optical RS-232 Interface for Thermal Printer (Optional)
Warning: Do not connect the 1 ohm resistor with the two posts directly.
4. Stand
Solder the 1 ohm resistor to the wire, and then connect the wire with
5. Battery Cover
posts without any solder.
6. Screw of Battery Cover
12
41
0.05
G. Top Panel
4. Full Scale becomes 50mV / 100 %RH = 0.5 mV / %RH
1
2
5. Convert 0.5 mV / %RH to 2 %RH / mV. So A = 2, B=0.
1.
Input for Thermocouple Mini Connector
2.
Plastic Screw of Top Cover (Do not open)
Warning: Do not open the top cover. If users open the top cover,
calibration may be invalid. Re-calibration is necessary.
40
13
0.05
4. Full Scale becomes 50mV / 100 DB = 0.5 mV / DB.
III. Operation
5. Convert 0.5 mV / DB to 2 DB / mV. So A = 2, B=0.
A. Thermocouple Temperature Measurement
Example 3: connect a humidity meter to the thermometer
1. Connect the thermocouples to the top panel of the thermometer.
1. The full scale output is 1000 mV per 100 %RH.
2. Turn the power on to show a SETUP menu..
2. To lower the voltage from 1000 mV to 50 mV, the scale factor is 1 /
3. Select proper type of thermocouple for each input.
20.
4. Press the GRAPH button to start temperature measurement.
3. Select R = 1.9K ohm. Scale Factor = 100 / (100 + 1900) = 1 / 20 =
14
39
Example 2: connect a sound level meter to the thermometer
5. The right hand side of LCD shows the temperature readings of all
inputs. The left hand side of LCD shows the curve of overall trend of
current selected input.
6. Press the ▲ button or ▼ button to select next temperature input.
Note: The label of selected input is reverse video.
Note: “00:05:20/H” means that each horizontal division is 5 minutes
and 20 seconds. It is shown at the right bottom corner of the LCD.
“2.0 ℃ / V” means that each vertical division is 2℃. It is shown at the
right bottom corner of the LCD.
Note: The maximum value and minimum value are shown at the top of
the right hand side of the LCD. The current date and time is shown in
the next line. If an input is not connected with any type of thermocouple
or input, the maximum value and minimum value are replaced by a
dash line (------).
Note: If an input is not connected with any type of thermocouple or
input, a dash line (------) will be shown. The alarm is set for both LO and
HI limits. A vertical line is shown in the graph at the location of the time
when it is not connected.
Note: When users press the SETUP or FILE button, the previous LCD
1. The full scale output is 1000 mV per 100 DB.
display is cleared. When users press the GRAPH button or ALARM
2. To lower the voltage from 1000 mV to 50 mV, the scale factor is 1 /
button, a new curve will be plotted and a new maximum value and
20.
minimum value are recorded.
3. Select R = 1.9K ohm. Scale Factor = 100 / (100 + 1900) = 1 / 20 =
38
15
B. Select Type of Thermocouple
Example 1: Connect a current adaptor to the thermometer
1. Press the SETUP button for a SETUP menu.
2. Press ▲ button or ▼ button to select individual temperature input
from IN1 to IN8.
3. Press the TYPE button to select type of thermocouple or mV input.
There are 11 types of thermocouples (K, J, E, T, R, S, N, L, U, B,
and C).
Warning: Whenever users press the SETUP button, the curve of
overall trend and alarm function will be reset. Previous curve and alarm
status are cleared. To save the curve or alarm status, record the data in
1. Set the rotary switch at 40A range. The full scale output is 400mV
a file.
per 40 A.
Note: To save new selection, press the SETUP button, GRAPH button,
2. To lower the voltage from 400 mV to 40 mV, the scale factor is 1/10.
or ALARM button.
3. Select R = 900 ohm. Scale Factor = 100 / (100 + 900) = 1 / 10 = 0.1
4. Full Scale becomes 40mV / 40A = 1mV / A.
5. Convert 1mV / A to 1 A / mV. So A = 1, B=0.
16
37
S. Lower the Analog Input to Less Than ±60mV (3
C. Select ℃ or ℉
examples)
Press the
button to change the unit directly.
D. Review Data and Curve of Overall Trend
1. When users press the GRAPH button, the current readings of all
inputs are shown in the right hand side of LCD. Curve of overall trend
will be shown in the left hand side of LCD.
2. Press ▲ button or ▼ button to select individual input from IN1 to
IN8.
3. Press ► button or ◄ button to move the line cursor.
1. If the analog input from an instrument is greater than +/- 60mV,
4. The minimum value and maximum value in the time interval at the
users can add two resistors to lower the voltage to less than +/- 60mV.
cursor position are shown at the top of the graph.
Scale Factor = 100 / (R +100)
5. The time interval at the cursor position is shown in the next line.
Input = Analog Input x Scale Factor
2. Properly select value of R so that input voltage is less than +/- 60mV.
Note: When users press SETUP button, the previous LCD display is
3. Program the coefficient A and B as instructed in previous sections.
cleared. When users press GRAPH button or ALARM button, a new
curve will be plotted and a new maximum value and minimum value are
Note: 100 ohm resistor is connected in parallel with two posts of mini
connector.
recorded.
R and 100 ohm resistor are connected at the posts of
positive input.
Note: The starting time and the ending time of the whole graph is
shown at the bottom of the graph. The ending time is not the current
time.
Note: If an input is not connected with any type of thermocouple or
input, a vertical line is drawn at the location of the time.
36
17
E. Setup of HI Limit and LO Limit
R. Connect Analog Input with a Mini Connector (Optional)
1. Press the SETUP button for menu.
2. Press ▲ button or ▼ button to select individual temperature input
from IN1 to IN8.
3. Press ► button or ◄ button to select LO limit or HI limit.
4. Press ↑ + or ↓ - button to increment or decrement value. To
increment or decrement value faster, press and hold the ↑+ or ↓-
Use the optional mini connector to connect analog input from an
button for over 2 seconds.
analog signal of any instrument.
Note: The range of LO and HI limits is from -1684 to 1684. The number
1. Loose the screws of the cover and open the cover.
will roll over from -1684℃ to 1684℃ (or 1684℃ to -1684℃). Or the
2. Loose the 2 screw posts and then connect the copper wires from the
number will roll over from -3000℉ to 3000℉ (or 3000℉ to -3000℉).
instrument to the posts. Fasten the 2 screw posts.
3. Close the cover and fasten the screws.
Warning: If LO limit > HI limit, a symbol of “X” will be shown to the next
of the value of LO limit. Alarm still functions as long as the reading is
Warning: Do not use any solder in the connection with the two posts in
less than the LO limit, or is higher than HI limit.
the mini connector.
Only copper wire is allowed. If any metal other
than copper is used in the connection, users must take the inaccuracy
Note: To save new limits, press the SETUP button, GRAPH button, or
caused by the thermal effect into consideration.
ALARM button.
18
35
F. Alarm Function
Example 4:
Timer
Program IN6 for a humidity meter with analog output of 0.02mV per
1%RH with a 20%RH offset at 0 mV.
1. Convert “0.02mV / 1DB” to “50 DB /mV”. Then, Coefficient A = 50. B
= 20.
2. If input is 1 mV, then the reading becomes 70 %RH.
Note: The reading of the thermometer is displayed with scientific
notation m (10-3), u (10-6), n(10-9), K(103), M(106), and G(109). Users
should avoid using those letters of scientific notation (m, u, n, K, M, and
G) as part of unit name.
The alarm function operates at all time. Press the
button to
see the minimum and maximum values of all inputs. Even if a reading
is greater than HI limit or smaller than LO limit, the status will be
recorded.
The
symbol is shown to right of the MIN or MAX value
and timers are used for each input to show the duration under LO limit
(UL-Duration) and over HI limit in the format of “hh:mm:ss” and timing.
Note: The starting time and ending time of recording period is shown at
the bottom of the alarm status.
Note: If an input is not connected with any type of thermocouple or
input, a dashed line (------) will be shown. The alarm is set for both LO
and HI limits.
The timer for OL-Duration is still timing for the disconnected condition.
But the UL-Duration (under limit duration) and OL-Duration (over
34
19
limit duration) are no longer valid.
Q. Calculate Coefficients for the Engineering Unit (E.U.)
Note: Maximum duration is 18:03:02 (65000 seconds). If timer exceeds
Coefficient A is the gain (E.U. / mV) of the analog output.
18:03:20 (65000 seconds), dash lines are shown (--------).
Coefficient B is the offset value.
E. U. = “Coefficient A” x “Input (in mV)” + “Coefficient B”
G. Reset LCD Display by Pressing SETUP or FILE Button
Equivalent mathematic equation:
When users press the SETUP button, a setup menu is displayed and
Y=A*X+B
the previous curve and parameters in the LCD display is cleared.
When users press the GRAPH or ALARM buttons again, a new curve
Example 1:
is plotted.
Program IN3 for a sound level meter with analog output of 1mV per
Previous minimum and maximum values are cleared.
Timers for the over limit duration (OL_DURATION) and under limit
1DB without any offset.
duration (UL_DURATION) are reset to 0. New minimum value and
1. Convert “1mV / 1DB” to “1 DB /mV”. Then, Coefficient A = 1. B = 0.
maximum value will be recorded.
2. If input is 1 mV, then the reading becomes 1DB.
When users press the FILE button, a file list is shown. Similarly, the
Example 2:
LCD display is reset at the same time.
Program IN4 for a sound level meter with analog output of 1mV per
1DB with a 10DB offset at 0mV.
1. Convert “1mV / 1DB” to “1 DB /mV”. Then, Coefficient A = 1. B =10.
2. If input is 1 mV, then the reading becomes 11DB.
Example 3:
Program IN5 for a humidity meter with analog output of 0.02mV per
1%RH without any offset.
1. Convert “0.02mV / 1DB” to “50 DB /mV”. Then, Coefficient A = 50. B
= 0.
2. If input is 1 mV, then the reading becomes 50 %RH.
20
33
H. Record Data
Recording
Record Counter
Note: The engineering unit with coefficient A and B are effective only
under the selection of mV as type of input.
1. Press the REC button to record data. A symbol of “REC” is shown at
Note: If the voltage range is out of -60mV and 60mV, users can adopt
the top center of LCD.
two resistors to lower the input voltage to the range of ±60mV. Please
2. Data of all inputs, alarm status and curve of overall trend are
refer to the section Lower the Analog Input to +/- 60mV.
recorded. A record counter shows the number of records at the right
top corner of LCD.
Note: 4 to 20mA signal can also be converted to mV input. Please refer
3. Press the REC button again to stop recording. The data is saved in a
to the section Connect the 4-20mA Signal.
file. The file is named automatically by the thermometer.
Note: For details of software, please refer to the separated software
Warning: Do not turn the power off while data logging is in progress.
user manual.
Always press the REC button to stop data logging. Power interruption
could cause loss of data stored in SD or SDHC card.
Note: Defaults are IN1 to IN8, A=0.001, B=0, and Unit=VCH1 to VCH8.
Note: The file is named sequentially with a leading T (T0000xxx). The
file name could be duplicated if the SD or SDHC card is used in
different thermometers.
32
21
I.
Review Data and Curve of Overall Trend in a File
P. Program Engineering Unit
Label
Coefficient A
Coefficient B
Unit
1. Press the FILE button to show a list of files.
2. Press ▲ button or ▼ button to select a file. The name of selected
file is reverse video.
As long as the voltage range is within ±60mV, Instruments with analog
3. Press ENTER button to review data in the file.
output can be connected to the input, and program the coefficients A
and B of a specific input.
File Mode
Through a PC application program, users can program the Label,
Coefficient A, Coefficient B, and Unit. Programmed labels are
displayed all the time. Units are displayed only when mV is selected as
type of input.
In the above table, contents of IN3 to IN6 are programmed. Labels are
programmed as RM1 to RM4. The values of coefficient A are
programmed from 0.001 to 1, 1, 50, and 50. The values of coefficient B
are programmed from 0 to 0, 10, 0, and 20. The units are programmed
as DB, DB, %RH, and %RH.
After completion of programming, turn the power off and turn the power
4. Curve of overall trend of all data is shown in the left hand side of
on. The following display will be shown.
LCD.
22
31
Note: There is no label of Y-axis if mV is selected as type of input.
5. Press ► button or ◄ button to move the line cursor.
6. The minimum value and maximum value in the time interval at the
Note: When input is not connected or out of range, there is also no
cursor position are shown at the top of the graph.
label of Y-axis.
7. The time interval at the cursor position is shown in the next line.
8. Press ↑+ or ↓-
button to list each temperature reading in the
time interval at the current cursor position.
O. Turn the Backlight On or Off
Note: A file name marked by “X” is a damaged file. It is caused by
Press and hold the SETUP button for 2 seconds to turn the backlight
power interruption during data logging. Data in a damaged file can not
on or off.
be recovered.
30
23
J. Zoom into Details of a Curve in a File
N. Turn the Label of Y-axis On or Off
In the display of data and graph, users can turn the label of Y-axis on or
off by pressing the HELP button. This also control the label on or off in
the FILE mode.
First Cursor Position
Second Cursor Position
Users can always review a specific portion of a curve by marking two
cursor positions.
1. Press ► button or ◄ button to move the line cursor.
Label is on
2. Press the REC button to mark the first cursor position. The time
stamp above the 8 input readings is used as the first one.
3. Press ► button or ◄ button to move the line cursor again.
4. Press the REC button to mark the second cursor position. The time
stamp above the 8 input readings is used as the second one.
5. Press the ENTER to plot curve between the two time stamps.
6. Press ↑+ or ↓-
button to list each temperature reading in the
time interval at the current cursor position.
7. Press the
button to display the alarm status in that period of
time.
Label is off
8. Users can iterate the process for the current curve plotted.
24
29
M. Hardcopy of the LCD content
Note: When the unit is processing data between two time stamps,
Press the HARDCOPY button to copy the content of LCD into a file.
message of “Processing Data” will be shown. Bytes of data processed
The graph and alarm status are both stored.
and total Kbytes of data to be processed will follow the message.
It takes about 1 second to process 3K bytes of data.
Users can review the hardcopy file, and press the
button to
toggle between graph and alarm status.
Note: Users can always zoom in, but can not zoom out. To zoom out,
users can press the FILE button and re-plot the whole curve again.
Note: The size of a hardcopy file is 4096B, and only the hardcopy file is
of this size. So, if users see a file of size 4096B in the file list, then
Note: The unit always zooms into the curve of the last two marked
they can be sure this is a hardcopy file. The file is named by the
cursor position.
thermometer automatically.
Note: If no cursor position is marked by REC button, a curve of 119
data from the current cursor position is plotted.
28
25
K. Delete Data File in the SD or SDHC card
L. Review Alarm Status in a File
1. Press the FILE button, and the above file list will be shown.
2. Press ▲ button or ▼ button to select a file. The name of selected
file is reverse video.
3. Press the “X” button to delete a selected file. Users will be asked for
1. Press the FILE button to show a list of files.
confirmation.
2. Press ▲ button or ▼ button to select a file. The name of selected
file is reverse video.
Note: Users can also place the SD or SDHC card in a PC and delete
3. Press ENTER button, then press the “GRAPH /
the files.
minimum and maximum values of all inputs will be shown in the left
” button. The
hand side of LCD.
4. If a reading is ever greater than HI limit or smaller than LO limit, the
status will be recorded. A symbol of
is shown to right of the MIN
or MAX value and a timer is shown for that input and timing.
Note: The date and time interval of recording period is shown at the
bottom of the data.
26
27