1
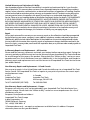
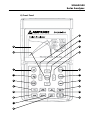
SOLAR-500
Solar Analyzer
Users Manual
•
•
•
•
Mode d’emploi
Bedienungshandbuch
Manual d’Uso
Manual de uso
SOLAR-500
Solar Analyzer
English
Users Manual
July 2009, Rev.1
©2009 Amprobe Test Tools.
All rights reserved. Printed in Taiwan
Limited Warranty and Limitation of Liability
Your Amprobe product will be free from defects in material and workmanship for 1 year from the
date of purchase. This warranty does not cover fuses, disposable batteries or damage from accident,
neglect, misuse, alteration, contamination, or abnormal conditions of operation or handling. Resellers
are not authorized to extend any other warranty on Amprobe’s behalf. To obtain service during the
warranty period, return the product with proof of purchase to an authorized Amprobe Test Tools
Service Center or to an Amprobe dealer or distributor. See Repair Section for details. THIS WARRANTY
IS YOUR ONLY REMEDY. ALL OTHER WARRANTIES - WHETHER EXPRESS, IMPLIED OR STAUTORY INCLUDING IMPLIED WARRANTIES OF FITNESS FOR A PARTICULAR PURPOSE OR MERCHANTABILITY,
ARE HEREBY DISCLAIMED. MANUFACTURER SHALL NOT BE LIABLE FOR ANY SPECIAL, INDIRECT,
INCIDENTAL OR CONSEQUENTIAL DAMAGES OR LOSSES, ARISING FROM ANY CAUSE OR THEORY.
Since some states or countries do not allow the exclusion or limitation of an implied warranty or of
incidental or consequential damages, this limitation of liability may not apply to you.
Repair
All test tools returned for warranty or non-warranty repair or for calibration should be accompanied
by the following: your name, company’s name, address, telephone number, and proof of purchase.
Additionally, please include a brief description of the problem or the service requested and include
the test leads with the meter. Non-warranty repair or replacement charges should be remitted in the
form of a check, a money order, credit card with expiration date, or a purchase order made payable to
Amprobe® Test Tools.
In-Warranty Repairs and Replacement – All Countries
Please read the warranty statement and check your battery before requesting repair. During the
warranty period any defective test tool can be returned to your Amprobe® Test Tools distributor
for an exchange for the same or like product. Please check the “Where to Buy” section on www.
amprobe.com for a list of distributors near you. Additionally, in the United States and Canada InWarranty repair and replacement units can also be sent to a Amprobe® Test Tools Service Center
(see address below).
Non-Warranty Repairs and Replacement – US and Canada
Non-warranty repairs in the United States and Canada should be sent to a Amprobe® Test Tools
Service Center. Call Amprobe® Test Tools or inquire at your point of purchase for current repair
and replacement rates.
In USA In Canada
Amprobe Test Tools Amprobe Test Tools
Everett, WA 98203 Mississauga, ON L4Z 1X9
Tel: 877-AMPROBE (267-7623) Tel: 905-890-7600
Non-Warranty Repairs and Replacement – Europe
European non-warranty units can be replaced by your Amprobe® Test Tools distributor for a
nominalv charge. Please check the “Where to Buy” section on www.amprobe.com for a list of
distributors near you.
European Correspondence Address*
Amprobe® Test Tools Europe
In den Engematten 14
79286 Glottertal, Germany
Tel.: +49 (0) 7684 8009 - 0
*(Correspondence only – no repair or replacement available from this address. European
customers please contact your distributor.)
SOLAR-500
Solar Analyzer
A) Front Panel
11
12
9
13
10
14
1
15
2
16
3
17
4
18
5
19
6
20
7
8
SOLAR-500
Solar Analyzer
1)
F1Button: (Reserved)
2)
F2 Button: (Reserved)
3)
Battery Charge Button
When Solar Module Analyzer is turned
on, press BATTERY CHARGE button to
recharge batteries (please do not use
regular batteries for recharging)
4)
12)
13)
14)
I/V/P Select Button
6)
Test Button
Single point I-V test based up specified
value
7)
15)
16)
17)
18)
Graph Grid Button
Display/Cancel graph grid
9) LCD
LCD displays measurement data and
curves
Setup Button
Enter/Exit SETUP menu
11)
Rec Button
(1) Record the present measurement data
(2) How to clear recorded data: keep
pressing REC button and turn on the
analyzer, then all the data recorded in
the analyzer will be deleted
Auto Scan Button
10)
End Button
Stop scanning point (current) setting
Scan Button
Auto scan I-V curve test
Begin Button
Start scanning point (current) setting
Manual scan I-V curve test based upon
specified value
8)
Button
(1) In a curve, press it to move the cursor
right
(2) In SETUP menu, press it to increment
value by 1
(Buzzer) Button
Select display of I-V/ V-I curve, P-V/P-I
curve, or both curves
Button
In the SETUP menu, press q button to
select next item
Press this button to turn on/off the
beeper (low Power) alarm function
5)
Button
In the SETUP menu, press p button to
select previous item
Button
(1) In a curve, press it to move the
cursor left
(2) In SETUP menu, press it to
decrement value by 1
19)
I/V Curve Button
Select I or V as horizontal coordinate
20)
Power Button
Turn on/off the power of Solar Analyzer
SOLAR-500
Solar Analyzer
B) Rear Panel
1) Communication Window
To connect Solar Analyzer
with PC via USB cable
2) Stand
1
3) Battery Cover
4) Screw of Battery Cover
2
3
4
C) TOP Panel (Connectors)
3
1
2
4
5
7
8
6
1) T+ Terminal (Kelvin Clips)
5) I+ Terminal (Alligator Clips)
2 ) T- Terminal (Kelvin Clips)
6) I- Terminal (Alligator Clips)
3) Terminal Reserved for Factory Test
7) V+ Terminal (Alligator Clips)
4) ±DC 12V
8) V- Terminal (Alligator Clips)
SOLAR-500 Solar Analyzer
CONTENTS
SYMBOLS, WARNINGS AND PREPARATION......................................................... 2
UNPACKING AND INSPECTION............................................................................. 2
INTRODUCTION..................................................................................................... 3
OPERATION............................................................................................................ 7
Preparation........................................................................................................ 7
Precaution......................................................................................................... 8
Connecting Diagram......................................................................................... 9
Selected Condition of Auto Scan, Manual Scan, or Test Auto Scan............... 10
Auto Scan.......................................................................................................... 12
Manual Scan...................................................................................................... 13
Single Point Test................................................................................................ 14
Save Testing Results.......................................................................................... 15
Clear recorded testing data.............................................................................. 16
Setup Menu....................................................................................................... 17
SPECIFICATION ..................................................................................................... 18
Electrical Specifications..................................................................................... 18
General Specifications...................................................................................... 19
MAINTENANCE AND REPAIR................................................................................ 20
Battery Replacement / Recharging.................................................................. 21
Fuse Replacement............................................................................................. 22
PC CONNECTION, SOFTWARE INSTALLATION AND OPERATION........................ 24
INTRODUCTION..................................................................................................... 24
Operating Environment................................................................................... 24
Hardware.......................................................................................................... 24
Connecting Procedures.................................................................................... 24
SOFTWARE INSTALLATION................................................................................... 25
Install Application Program............................................................................. 25
Install USB Driver.............................................................................................. 25
SOFTWARE OPERATION........................................................................................ 26
Start Executing Program.................................................................................. 26
Parameter Setting............................................................................................ 27
Save/Print LCD................................................................................................... 28
Download......................................................................................................... 29
Auto Scan Solar Module................................................................................... 31
1
SYMBOLS
�
Caution ! Refer to the explanation in this Manual
�
Caution, Risk of Electric Shock
�
This equipment is not for measurements performed for CAT II, III, and IV
�
Please remove all the test leads before performing maintenance,
cleaning, battery replacement, fuse replacement, etc
�
Earth (Ground)
�
DC--Direct Current
�
Conforms to relevant Australian standards
�
Complies with European Directives
=
Do not dispose of this instrument as unsorted municipal waste.
Contact a qualified recycler for disposal.
�WARNING!
Do not operate this instrument in the presence of gasoline, natural gas,
propane, or in other combustible atmospheres.
Unpacking and Inspection
Your shipping carton should include:
1
SOLAR-500 Solar Analyzer
1
Carrying Bag
1
Users Manual
1
AC Adaptor
1
RS232C (to USB Bridge) Cable
8
Rechargeable Batteries
1
Software CD
1
Software Manual
1
Kelvin Clips (6A max, 1 pair)
If any of the items are damaged or missing, return the complete package to
the place of purchase for an exchange.
2
INTRODUCTION
The SOLAR-500 can be used in Quality Control for Production Line, Warehouse
or Site of Installation.
Manufacturers of solar panels can test the characteristics for quality control
purpose in the production line. Due to the advantage of portability of the
unit, quality inspectors can randomly pick samples of solar panels and test
them in the warehouse to assure quality before shipment.
Installation engineer can randomly test samples of solar panels at site to verify
the quality of solar panels used at site of installation.
Example A: Identify the Solar Power System Requirement
Measure the actual maximum power (Pmax), voltage (Vmaxp), and current
(Imaxp) at maximum power. Instead of using the rated maximum power, the
system designer needs to be aware of the actual solar power from the solar
panel under actual operating condition. So designer can actual know how
many pieces of solar panels are required to generate specific power.
The voltage and current under actual operating condition (in the morning, at
noon, and in the afternoon) are required for system designer to design the
optimal charging system, so most of the solar power can be absorbed and
stored in the battery.
Users can test the characteristics of solar panel at different time of day
and store the data. Then design can know if the solar system can generate
appropriate power at any time.
3
Example B: Maintenance of Solar Panels
Abnormal I-V Curve (Cells at the corner of solar panel are defected)
4
Abnormal I-V Curve (defected cells scattered over the solar panel)
The technicians or maintenance engineers can store the characteristics data
of solar panels in the beginning. And compare the characteristics data in the
weekly, monthly or yearly maintenance. If the characteristics of any solar
panels are different from the previous data, technicians or maintenance
engineers can further identify the problems of solar panels.
For example, if any cells of solar panels are damaged, the I-V curve would
be very different from a typical curve. If the solar panels are covers by a lot
of dust, the I-V curve or the maximum power would be much lower than
previously stored data. Once defected panels are found, technicians or
maintenance engineers can replace them with new panels
Example C: Verify the Best Installation Angle of Solar Panels
Engineers can collect data of installation angle at different date and time
by using the unit at site of installation. The data can be used as reference to
design automated angle adjustment system. Or the data can be used to select
an optimal angle for a fixed angle installation.
5
Feature
• I-V Curve Test for Solar Cell.
• Single Point I-V Test.
• Maximum Solar Power (Pmax) search by auto-scan.
• Maximum Voltage (Vmaxp) at Pmax.
• Maximum Current (Imaxp) at Pmax.
• Voltage at open circuit (Vopen).
• Current at short circuit (Ishort).
• I-V curve with cursor.
• Efficiency (%) calculation of solar panel.
• Scan delay setting. (0 ~ 9999 mS)
• Solar panel area setting. (0.001 m2 ~ 9999 m2)
• Standard light source setting. (10 W/m2 ~ 1000 W/m2)
• Min. power setting for alarm function.
• Built-in Calendar Clock.
• Rechargeable batteries with built-in charging circuit.
• RS232C (to USB Bridge) cable for PC.
• Option: portable thermal printer (model: 300XP) to print (hardcopy) the
LCD displays of Solar Module Analyzer.
6
OPERATION
Preparation
This Solar Module Analyzer uses rechargeable batteries. Before using new
rechargeable batteries, please charge them first for 10~12 hours continuously
for better battery life. The charging steps are:
1. Unscrew and remove the battery cover.
2. Put in new recharging batteries (pay attention to the correct polarities).
3. Replace and screw the battery cover.
4. Connect the provided AC Adaptor.
5. Turn on Solar Module Analyzer and press BATTERY CHARGE button to
start battery charging.
6. During recharging, LCD displays “Power: Charge”.
7. It takes at least 10~12 hours to charge batteries. Please do not interrupt
the charging process during this period.
7
Precaution
�WARNING!
when users see “Overheated” warning shown in LCD
1. Users must wait during this “Overheated: cooling” period before they
start next simulation.
2. And if users would like to turn the unit off, they must wait for another 3
min. (at least) for the cooling fan to cool off the internal components.
8
Connecting Diagram
Kelvin Clip Connecting Diagram
Alligator Clip Connecting Diagram
9
Selected Condition of Auto Scan, Manual Scan, or Test
Users should first select AUTO SCAN (
characteristics of a solar panel.
) to obtain a general idea of
button to turn on the Analyzer. Properly connect the pair of
1. Press
Kelvin clips to the solar panel and the Analyzer. The red Kelvin clip is for
positive pole and the black Kelvin clip for negative pole.
button to start AUTO SCAN. After the scanning is finished,
2. Press
the result will come out like below.
Afterward, if users are interested in a specific operating range, they can enter
the beginning and ending values of scan in the setup menu.
Press SCAN (
) button to test the specific range.
1. Press
button to turn on the Analyzer. Properly connect the pair of
Kelvin clips to the solar panel and the Analyzer. The red Kelvin clip is for
positive pole and the black Kelvin clip for negative pole.
2. Press
button to enter the SETUP menu: (Type in the current range
for scanning)
Current Range of Scan begin: 200mA
Current Range of Scan end: 548mA
After setting up the current range, press
SETUP menu.
button again to exit the
Note: If the “Current Range of Scan begin” is over “Ishort”, then the
scanning will not be performed and no result will come out.
10
3. Press
button to start MANUAL SCAN. After the scanning is
finished, the result will come out like below.
If users are interested in a specific point of test current, users can enter
) to test the
the current value for a Single Test Point. Press TEST (
characteristics at the current.
button to turn on the Analyzer. Properly connect the pair of
1. Press
Kelvin clips to the solar panel and the Analyzer. The red Kelvin clip is for
positive pole and the black Kelvin clip for negative pole.
2. Press
button to enter the SETUP menu: (Type in the testing current)
Single Test Point: 609mA
After setting up the current range, press
SETUP menu.
button again to exit the
3. Press
button to start Testing a Single Test. After the testing is
finished, theresult will come out like below. The result (P, V, I) is shown in
reverse video as below.
11
Auto Scan
1. Press
button to turn on the Analyzer.
2. Properly connect the pair of Kelvin clips to the solar panel and the
Analyzer. The red Kelvin clip is for positive pole and the black Kelvin clip
for negative pole. (refer to above Connecting Diagram).
3. Turn on standard light source and let it illuminates solar panel uniformly.
(AUTO SCAN) button to perform Auto-scan. After the
4. Press
scanning is finished, the result will come out like below.
5. The unit automatically measures the followings parameters: Vopen,
Ishort, Pmax, Vmaxp, and Imaxp. Based upon those parameters, the unit
run simulation and draw I-V / V-I curve and P-V / P-I curves in LCD.
6. Users can move the cursor to review each individual values along the
curve.
�WARNING!
There is a time delay before the unit performs the “Auto Scan”. This time
delay allows the light source to be turned on before “Auto Scan” starts.
Time delay can be set in the SETUP menu.
Note: If the short circuit current (Ishort) exceeds 6A, Auto Scan will not be
performed. Please select Manual Scan and limit the ending value of Scan
to be less than 6A.
12
Manual Scan
1. Press
button to turn on the Analyzer.
2. Properly connect the pair of Kelvin clips to the solar panel and the
Analyzer. The red Kelvin clip is for positive pole and the black Kelvin clip
for negative pole.
button to enter the SETUP menu: (Type in the current range
3. Press
for scanning)
Current Range of Scan begin: 200mA
Current Range of Scan end: 548mA
After setting up the current range, press
SETUP menu.
button again to exit the
Note: If the “Current Range of Scan begin” is over “Ishort”, then the
scanning will not be performed and no result will come out.
4. Press
(SCAN) button to start MANUAL SCAN. The analyzer run
simulation from the BEGIN value to END value, and draw I-V / V-I curve
and P-V / P-I curve in LCD. Users can move the cursor to review each
individual values along the curve.
After the scanning is finished, the result will come out like below.
�WARNING!
There is a time delay before the unit performs the “Manual Scan”. This
time delay allows the light source to be turned on before “Manual Scan”
starts. Time delay can be set in the SETUP menu.
13
Single Point Test
1. Press
button to turn on the Analyzer.
2. Properly connect the pair of Kelvin clips to the solar panel and the
Analyzer. The red Kelvin clip is for positive pole and the black Kelvin clip
for negative pole.
button to enter the SETUP menu: (Type in the current range
3. Press
for scanning)
Single Test Point: 609mA
After setting up the current range, press
SETUP menu.
button again to exit the
4. Press
button to start Testing a Single Test. After the testing is
finished, the result will come out like below. The result (P, V, I) is shown
in reverse video as below.
�WARNING!
Time delay in the “Single Point Test” allows the current simulation to last
longer. Though the max. value is 9.999 sec., the time delay is changed to
10 msec. if power is over 100 W. The time delay is extended to 3 seconds
if power is less than 100 mW.
14
Save Testing Results
When users finish a test (by taking one of the above-mentioned methods; Auto-scan, Manual-scan or Single Point Test), the testing result can be saved in
the memory of the analyzer.
The procedures of saving testing results:
1. Perform a test by Auto-scan, Manual-scan or Single point test.
(REC) button to save the (present)
2. After the test is finished, press
testing result on display. On the top right display it shows
REC:1 (in reverse video) which means the first record was saved.
�WARNING!
Please use the application software provided with the Analyzer to read
the saved testing results. (refer to the Software Manual)
15
Clear recorded testing data
Users can clear the recorded testing data in the Analyzer.
The procedures of deleting saved data:
1. Keep pressing
(REC) button and turn on the Analyzer (i.e. press
button ) at the same time.
2. After turning on the Analyzer, all the data recorded in the Analyzer
(memory) will be deleted. When the buzzer beeps twice, it means the
record data is already cleared.
�WARNING!
After performing this CLEAR function, all the recorded data in Analyzer
(memory) will be deleted completely and can not be restored. If it is
necessary to keep the testing data, please use the Application Software
to download and save them before deleting them from the Analyzer.
(refer to the Software Manual)
16
Setup Menu
1. Press
(SETUP) button to enter the Parameter Setting screen.
2. Press
or
buttons to select the setting items.
(1) Time delay before scan
(2) Current Range of Scan begin
(3) Current Range of Scan end
(4) Area of Solar Cell or Panel
(5) Irradiance
(6) Single Test Point
(7) Alarm of Low Power
3. Press
Press
or
or
buttons to select the setting items.
buttons to change the setting values, or press them for
few seconds to promptly change setting values.
4. After setting Parameters, press
button to exit SETUP menu.
17
SPECIFICATION
General Specifications
Battery Type : Rechargeable, 2500mAh (1.2V) x 8
AC Adaptor : AC 110V or 220V input
DC 12V / 1 ~ 3 A output
Dimension : 257(L) x 155(W) x 57(H) mm (10.1 (L) x 6.1 (W) x 2.2 (H) in)
Weight : 1160g / 40.0oz (Batteries included)
Operation Environment : 0°C ~ 50°C (32°F ~ 122°F), 85% RH
Temperature Coefficient : 0.1% of full scale / °C ( <18°C or >28°C )
Storage Environment : -20°C ~ 60°C (-4°F ~ 140°F), 75% RH
� - EMC: EN 61326-1: 2006
- LVD: EN 61010-1: 2001
This product complies with requirements of the flowing European Community
Directive: 2004/108/EC (Electromagnetic Compatibility) and 2006/95/EC (Low
Voltage). However, electrical noise or intense electromagnetic fields in the
vicinity of the equipment may disturb the measurement circuit. Measuring
instruments will also respond to unwanted signals that may be present within
the measurement circuit. Users should exercise care and take appropriate
precautions to avoid misleading results when making measurements in the
presence of electronic interference.
18
Electrical Specifications (23°C ±5°C, Four-wire Measurement)
DC Voltage Measurement
Range (60V / 6A)
Resolution
Accuracy
0~6V
0.001 V
± 1 % ± (1 % of Vopen ± 9 mV)
6 ~ 10 V
0.001 V
± 1 % ± (1 % of Vopen ± 0.09 V)
10 ~ 60 V
0.01 V
± 1 % ± (1 % of Vopen ± 0.09 V)
Vopen: open circuit voltage of solar cell or module.
If users use alligator clips to measure voltage only (I+ clip is not connected),
clips (V- and I-) must be shorted together. Thus, 4-wire measurement is
converted to 2-wire measurement.
DC Current Measurement
Range (60V / 6A)
Resolution
Accuracy
0 ~ 0.6 A
0.1 mA
± 1 % ± (1 % of Ishort ± 0.9 mA)
0.6 ~ 1 A
0.1 mA
± 1 % ± (1 % of Ishort ± 9 mA)
1~6A
1 mA
± 1 % ± (1 % of Ishort ± 9 mA)
Ishort: short circuit current of solar cell or module.
Internal Resistance at Ishort: 0.05 Ohm.
Ishort is measured with internal resistance, circuit resistance, and test lead
resistance.
DC Current Simulation
Range (60V / 6A)
Resolution
Accuracy
0~1A
0.1 mA
± 1 % ± 0.9 mA
1~6A
1 mA
± 1 % ± 9 mA
If Current is greater than 6A, test (Auto-Scan, Scan, or Test) can not be
Performed.
Maximum duration of simulation is 9.999 seconds if power is less than 100 W.
Duration of simulation is 10m seconds if power is greater than 100 W.
19
MAINTENANCE AND REPAIR
If there appears to be a malfunction during the operation of the meter, the
following steps should be performed in order to isolate the cause of the
problem.
1. Check the battery. Replace the battery immediately when LCD displays
the Power is ≦2%.
2. Review the operating instructions for possible mistakes in operating
procedure.
Except for the replacement of the battery, repair of the meter should
be performed only by a Factory Authorized Service Center or by other
qualified instrument service personnel. The front panel and case can be
cleaned with a mild solution of detergent and water. Apply sparingly
with a soft cloth and allow to dry completely before using. Do not use
aromatic hydrocarbons, Gasoline or chlorinated solvents for cleaning.
Please remove all the batteries if users won’t use the Solar Module
Analyzer for a long time.
Battery Replacement / Recharging
When Rechargeable Batteries are used, please follow below steps to charge
the batteries
1. Connect the AC Adaptor with the Solar Module Analyzer.
2. Turn on the Solar Module Analyzer.
3. Press the BATTERY CHARGE button to start recharging.
4. During recharging (takes 10 hours), LCD displays “Power: Charge”.
5. After recharging, LCD displays “Power: 100%”.
6. Remove the AC Adaptor.
�WARNING!
1. Do not use non-rechargeable batteries to perform charging.
2. Users are suggested to do recharging only when LCD displays the
Power is ≦2%.
3. Do not stop recharging when it is not finished so that the battery life
can be maintained.
20
When regular batteries are used and LCD displays the Power is ≦2%, please
replace the batteries:
1. Turn off the Solar Model Analyzer.
2. Remove the screw of the battery cover.
3. Lift and remove the battery cover.
4. Remove the old batteries and insert eight new 1.5V SUM-3 batteries.
5. Install the battery cover and secure the screw.
21
Fuse Replacement
When the voltage can not be measured (Vnow = 0V) after properly connecting
the Analyzer and the solar panel, please check the fuse.
If the fuse is damaged (burned), please replace a new fuse by following the
procedures:
1. Turn off the Analyzer and remove all the connecting wires and power
sources.
2. Unscrew the battery cover. Remove the battery cover. Remove the two
batteries on the furthest east and west.
3. Unscrew the (4pcs.) screws of the back cover. Remove the back cover.
Remove the power connector connecting the back cover and the circuit
board (J2).
4. Remove the damaged (burned) fuse.
5. Put in a new fuse of the same specifications (5A / 250V).
6. Connect the power connector. Replace and screw the back cover.
7. Replace the two batteries on the furthest east and west. Replace and
screw the battery cover.
�WARNING!
After removing the battery cover, please do not touch the parts on the
circuit board, especially the communication LED. Or the communication
function will be damaged.
22
Unscrew and remove the battery
cover and the back cover.
Location of Fuse
23
PC Connection, Software Installation And Operation
INTROODUCTION
Operating Environment
• Application program should be installed in the operation system of
Microsoft Windows Vista/ XP / 2000 (SP3).
• NI-VISA Runtime Engine should be installed (Application program will
install it automatically).
• USB driver program should be installed (Application program will install
it automatically).
Hardware
• Personal Computer (PC): we recommend the processor of Pentium III
Celeron 600MHz or above.
• RAM: min. 256MB, but we recommend 512MB of RAM or more.
• Screen resolution: requires 1,024 x 768 pixels.
• Solar Analyzer.
• USB cable.
Connecting Procedures
Step 1: Turn on PC and Solar Analyzer.
Step 2: Connect USB Cable.
Step 3: Start Application Program of Solar Analyzer.
Step 4: Select correct “Serial Port Number”.
24
SOFTWARE INSTALLATION
Install Application Program
Execute Install.bat (which is in installation disc) to enter the procedures
of installing Application Program. Please follow the instructions to install
Application Program. When performing the installation of Application
Program, the USB driver program and NI-VISA Runtime Engine will be installed
automatically.
Remark:
1.If users have ever installed our Programs (NI-VISA) of other versions in his
PC, first please (go to Control Panel to) remove them.
2.After putting the installation disc into CD-ROM drive, the application
program will automatically execute the installation.
3.If the installation is not automatically executed, please choose the Install.
bat program in the installation disc to perform the installation.
4.After Application Program has been installed, please Restart the system.
Install USB Driver
When performing the installation of Application Program, the USB driver
program will be installed automatically.
However, if users need to manually install the USB driver program, please
choose USBDriver Directory in the installation disc, click CP210xVCPInstaller.
exe program (for Windows Vista / XP / 2000) to execute the installation of USB
Driver.
Remark:
1. If the driver can’t detect the hardware, please remove the hardware and
then plug it in properly.
25
SOFTWARE OPERATION
Start Executing Program
Step 1: n Start -> All Programs, choose “Solar Analyzer” or click the
shortcut to start executing program.
Step 2: Select the Serial Port connected to Solar Analyzer.
Remark:
1.Click
to select the Serial Port connected to Solar Analyzer.
2.After selecting the correct Serial Port, press
to confirm it.
3. Before entering the Application Program of Solar Analyzer, please turn
on PC, Solar Analyzer and properly connect the USB cable so that the
Application Program can automatically set up the correct Serial Port.
4. It is necessary to perform this function only when the Application
Program can’t automatically set up the correct Serial Port.
26
Parameter Setting
Set up the parameters of Solar Analyzer.
1
2
3
4
Remark:
1.Tool bar includes: Languages (Mandarin, English) and Exit.
2.Functions includes: Parameter Setting, Print LCD, Download, Scan.
3.Press the OK button on the right side of “Read ALL Parameter” to read
all the present parameters of Solar Analyzer.
4.Press the OK buttons of each parameter to set up the parameters. (refer
to the Manual for the description of all the parameters.)
27
Save/Print LCD
Save or print the present LCD data of Solar Analyzer.
1
2
3
Remark:
1. Press “Read” button to read the present LCD data of Solar Analyzer.。
2.Press “Save as Bitmap” to save the present LCD data as a (single-color)
bitmap.
3.Or Press “Print” button to print out the present LCD data.
28
Download
Download the logged data in the memory of Solar Analyzer.
3
2
9
8
7
6
5
4
1
Remark:
1.Press “Download” to download the logged data in the memory of Solar
Analyzer.
2.The red block in the center shows the Downloading status.
3.Press “Present Sample” to change the present sample (location) to last
or next logged data. The information of the present sample will be
showed on the LCD: Logged Date & Time, Pmax, Vmaxp, Imaxp, P, V, I
(Power, Voltage and Current of the cursor position).
4.Save: to save the present downloaded data into PC. (file name: *.200
Data)。
5.Open: to read the downloaded data saved in PC.
29
6.Export: to save/export the data (i.e. the Voltage/Current curve data) of
Present Sample as/in a .CSV file for users to read in Excel.
7.I/V CURVE: to select the X-axis of the present curves based on I or V.
8.Print: to print out the present LCD data.
9.Redraw: users can move the cursor in the diagram to change the cursor
position.When users move the cursor and make the whole diagram
disordered, they can press “Redraw” button to make the present
diagram returned to the initial status.
Note:
1.After exporting logged data, they can’t be read (imported) anymore.
Please read them in the Excel software.
2.If it is necessary to read the logged data in the future, please be sure to
perform the Save/Open (logged data) functions.
30
Auto Scan Solar Analyzer
Auto Scan the Solar panel to obtain measurement results
3
2
9
8
7
6
5
4
1
Remark:
1.Press “Auto Scan” to auto scan the solar pane.
2.The red block in the center shows the Auto Scan status.
3.Press “Present Sample” to change the present sample (location) to last
or next logged data. The information of the present sample will be
showed on the LCD: Logged Date & Time, Vopen, Ishort, Pmax, Vmaxp,
Imaxp, P, V, I (Power, Voltage and Current of the cursor position).
4.Save: to save the present scanned data into PC. (file name: *.200 Record)
5.Open: to read the scanned data saved in PC.
31
6.Export: to save/export the data (i.e. the Voltage/Current curve data) of
Present Sample as/in a .CSV file for users to read in Excel.
7.I/V CURVE: to select the X-axis of the present curves based on I or V.
8.Print: to print out the present LCD data.
9.Redraw: users can move the cursor in the diagram to change the cursor
position.When users move the cursor and make the whole diagram
disordered, they can press “Redraw” button to make the present
diagram returned to the initial status.
Note:
1.After exporting scanned data, they can’t be read (imported) anymore.
Please read them in the Excel software.
2.If it is necessary to read the scanned data in the future, please be sure to
perform the Save/Open (scanned data) functions.
32