1
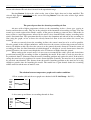
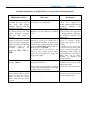
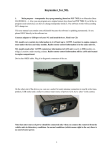
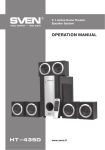
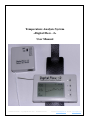
Temperature Analysis System
«Digital Flow - 2»
User Manual
Manual V1.4 ENG
Copyright © 2008-2009 Vladimir Afanasiev
E-mail: [email protected] WWW: www.digflow.ru
Manual V1.4 ENG
Copyright © 2008-2009 Vladimir Afanasiev E-mail: [email protected] WWW: www.digflow.ru
Page 1
General usage and key construction principles
The temperature analysis system «Digital Flow-2» is designed to measure and monitor air temperature
fluctuations. «Digital Flow-2» system was specifically designed to locate ascending air flows in
aeromodelling sports.
The temperature analysis system «Digital Flow-2» consists of a fast-acting and high-sensitivity
temperature sensor and portable receiver device. The sensor should be positioned on a mast in a remote
location away from the place where an airplane model is being launched, and the receiver device can be
placed in any location convenient for the user.
Measured data is transferred from the sensor to receiver using a digital radiochannel of a fixed frequency.
Each sensor is assigned a unique code for its radiochannel, which allows several sensors to work
simultaneously. The data transfer process implements a noise cancelling algorithm for error detection and
correction1. The three button interface on the receiving device allows users to change the settings and
work-mode of the device.
Transferred data is first processed by the microprocessor in the receiver, and then results are displayed
on its graphical LCD display as a numbers and temperature graph. Ascending air flows can be then
determined by the visual analysis of temperature fluctuations on this graph.
Sensor - technical specifications
Temperature sensor sensitivity
Temperature range
The response time on temperature fluctuations
Number of reads per second
Output power of transmission device
Transmission frequency
Voltage
Current
Size
- 0.01 ºC
- 0 – 61.44 ºC
- t 0.5 – 0.6 Sec 2, t 0.9 – 7 Sec 3
-4
- 6.0 mW
- 433.92 MHz
- 1.6 – 3.3 V (2x ААА – Uptime: 2-3 days)
- 18-40 mA
- 57 x 49 x 24 mm (2.24'' x 1.92'' x 0.94'')
Receiver - technical specifications
LCD graphical display
Temperature unit values on Y axis
Displacement velocity of graph on X axis
Period of time for complete refresh of graph
Maximum operational length
Voltage
Current
Size
1
- dimension 133 x 64 Pixels, monochrome
- 0.16, 0.32 4, 0.64, 1.28, 2.56, 5.12, 10.24 ºC
- 0.2 – 4 Pixels/Sec; step 0.1
- 19.2 – 384 Sec.
- 300 met (328 yd).
- 0.9 – 1.5 V (1x ААА – Uptime: 3-4 days)
- 20-35 mA
- 88 x 57 x 17 mm (3.46'' x 2.24'' x 0.67'')
Implemented in versions of «Digital Flow -2» 2.16 ECC and higher. Warning! Receivers and sensors of version 2.15 (and
lower) are not compatible with receivers and sensors of version 2.16 ECC and higher.
2
Period of time it takes sensor to change its readings by 50% from the difference in current and applied temperature.
3
Period of time it takes sensor to change its readings by 90% from the difference in current and applied temperature.
4
When using the values of 0.16 and 0.32, if T changes by 0.01 ºC, graph size changes by 4 and 2 pixels, respectively.
Manual V1.4 ENG
Copyright © 2008-2009 Vladimir Afanasiev E-mail: [email protected] WWW: www.digflow.ru
Page 2
The interface of receiver device
Tavg
24.98
∆T
0.02
S
Tsens
25.00
R
4x
Yc
48.0
Button 1
Button 2
Button 3
R
S
Power
On/Off
Icon description
Power source:
- Battery low - Receiver
- Battery low - Sensor
Graph smoothing:
2x, 4x – 2x or 4x graph smoothing is turned on
Signal transmission:
Y – No errors in transferred data.
YE – Fatal errors (could not recover).
YID – Sensor with a different ID is in close distance.
YC – Errors were corrected.
Interface functionality and data display
Button 1 — Allows users to sequentially view and select programmable settings and then return to the
graph display mode. Button 2 — Allows changing settings. In the graph display mode, it allows changing
the degree of graph smoothing (2x or 4x). Button 3 — Allows changing settings. In the graph display
mode, this button sequentially turns on/off display of the following values: period of time for a complete
graph refresh, scale for values on Y axis. Numerical values that are displayed on the screen: Tsens —
Current air temperature in ºC. Tavg – average temperature, which is calculated as an arithmetic average
of all values over the period of time for a complete graph refresh. ∆T – the difference between Tsens and
Tavg.
Setting up the device
To install batteries in the sensor or receiver, it is necessary to unscrew the fixing bolts located on
end faces of their frames and separate each frame into two halves. AAA size batteries, or rechargeable
batteries, should be used in these devices. Batteries have to be installed in accordance to their polarity,
and then the device frame has to be assembled back. Both the sensor and receiver can be turned on/off in
any order.
When the sensor is turned on, the electric engine for blowing air should start working. To extend
the battery life, sensor's microprocessor initiates data transfer only when an alteration in temperature was
detected. After receiver-register is turned on, it starts displaying air temperature, measured by the sensor,
and building the temperature graph. Signal quality can be monitored and controlled using the «Y» icon on
the display. When it doesn't change or blink, it indicates that data is being continuously transferred. If the
sensor code doesn't match the code of the receiver, or if the receiver is close to a sensor with a different
ID, the «YID» icon is displayed. The «YE» icon is displayed in case of fatal errors that could not be
corrected. «YС» icon is displayed if errors were successfully corrected. The receiver can be placed on
ones wrist using the wristlet on this device. «Digital Flow -2» allows monitoring battery charges. If the
sensor's or receiver's battery is discharged, there will be an icon in the form of battery displayed on the
screen. It may have a «R» and/or «S» index for receiver or sensor, respectively.
In order to locate ascending air flow using «Digital Flow -2» it is necessary to have a mast
(tower), with the length of at least 5 m (5.46 yd). Sensor has to be mounted on the top of this mast. A
plastic fishing line of a matching size can be used as a mast. However, installing sensor on a fishing line
made of carbon fiber, or metal, is not recommended because these types of materials can screen the
signal. As a result, the signal transfer distance and operational length can decrease. As an option, the top
part of the carbon fiber fishing line can be replaced with a wooden or fiber-glass rod. Sensor has to be
mounted to this rod using rubber hoops attached to the back of the device. The inlet of temperature sensor
has to be pointing downwards.
Manual V1.4 ENG
Copyright © 2008-2009 Vladimir Afanasiev E-mail: [email protected] WWW: www.digflow.ru
Page 3
Receiver settings
Settings can be changed after pressing Button 1. They are then listed sequentially by pressing this
button. Warning: power can be turned off only when device is in graph display mode. Power button is
blocked when viewing or changing settings, and it is necessary to return to the graph display mode to turn
off the device.
Programmable parameters:
1. «Y Axis Range» – Selection of the temperature scale for
Y axis. The scale should be selected based on weather conditions. If
Configuration
temperature fluctuations are significant and temperature graph is not
Y Axis Range – 0.64 °C
fully displayed on the screen, then the scale value needs to be
modified and increased. In the opposite case, if the amplitude of
temperature fluctuations is insignificant, then a more sensitive scale
needs to be selected. The following scale values are supported: 0.16,
0.32, 0.64, 1.28, 2.56, 5.12, and 10.24 °С, where each value is the maximum height of the graph on Y
axis. Therefore, if scale value is set to 0.64 °С, the Y axis is going to be 0.32 °С in its positive direction
and -0.32 °С in its negative direction from 0 °С scale mark. Pressing Button 2 selects the previous value,
and pressing Button 3 selects the next value for the scale range. Pressing Button 1 saves the selected
value into battery-independent memory and switches to the next configuration parameter. When device is
in graph display mode, the value of Y Axis Range is displayed in the top right corner, and it can be
turned on or off using Button 3.
2. «Update Speed» — The refresh rate, or the speed at which
Configuration
the graph is being shifted on X axis. «Update Speed» is a period of
Update Speed – 0.5 sec
time at which the graph is shifted on one Pixel to the right and a new
X Axis Range – 48.0 sec
value is calculated. Values can range from 0.2 to 4.0 Sec with an
increment of 0.1 Sec. Pressing Button 2 allows selection of a higher
value, and pressing Button 3 allows selection of a lower value.
The value for «Update Speed» parameter has to be determined based on wind's speed and distance from
sensor's mast to the location of the airplane model start, or based on personal preference. In the case of
strong winds, it is recommended to set a high value for the «Update Speed» parameter. If the «Update
Speed» is slow, it might be necessary to activate graph smoothing. Smoothing is performed based on two
(2x) or four (4x) consequential readings of temperature by calculating their arithmetic average. Note that
after smoothing option is enabled, it would apply to all points on the graph only after its complete refresh.
«X Axis Range» — The period of time it takes to completely refresh the graph. This value is autocomputed by microprocessor based on the «Update Speed» parameter. The average temperature (Tavg) is
calculated over “X Axis Range” time period, and the microprocessor recalculates Tavg every time there
is an incoming value from the temperature sensor. Tavg is then set as a zero point on Y-axis. As a result,
when temperature increases, the graph line goes up, but the whole graph is shifted downwards. This is
rather convenient because there is no need to manually adjust the zero point on the graph with
temperature fluctuations. When device is in graph display mode, the value of “X Axis Range” is
displayed in the top right corner and it can be turned on/off using Button 3.
3. Contrast – The contrast of LCD display. Pressing Button 2 increases the contrast, and
pressing Button 3 decreases it.
4. Sensor ID – Individual code of a transmitting sensor,
Configuration
which can range from 0001-9999. This property allows the selection
Sensor ID – 0001
of a sensor, which then will be used for measuring temperatures.
Each sensor has its unique ID code, which is assigned during
manufacturing and can't be further changed. All register-receiver
devices are identical. They can be setup to received signal from any
Manual V1.4 ENG
Copyright © 2008-2009 Vladimir Afanasiev E-mail: [email protected] WWW: www.digflow.ru
Page 4
sensor with a known ID code that is located in the operational range.
Pressing Button 2 selects the value's order (one of four digits) that can be then modified. The
selected digit appears underlined on the screen. Pressing Button 3 sets the value of this digit, which
ranges from 0-9.
The general procedure for detecting ascending air flow
Air mass with a higher temperature relative to the surrounding air has a lower spec. gravity or
density and therefore ascends. This lies in the principle of the formation of ascending air flows. The Sun
warms up a certain region of the Earth's surface, in the process forming a warm air mass. When this air
mass reaches a certain temperature, affected by the wind, it rises from the Earth's surface ascending in the
wind's directional flow. The sportsman then has to locate the formation and take-off of the ascending air
flow using the graph, or has to locate the already formed air flow in the area where the sensor was
installed.
In order to correctly detect the ascending air flow, the sensor's mast has to be as tall as possible.
Near the ground air has a higher turbulence, which decreases the accuracy of detecting warm and cold air
masses. In addition to this, the closer the sensor is to the ground, the more distant it is from the center of
ascending air flow; the final formation of which happens at a height of several dozen meters from the
ground. Therefore, the sensor's mast height has to be 8-10 meters or higher from the ground.
When setting up the sensor's mast, it is necessary to account for the wind's speed and desired time
period from locating the ascending air flow to launching the model. If the wind is weak, the mast has to
be positioned about 5-10 meters from the model's launching position and against the wind. If the wind is
strong, the mast has to be positioned in a more distant location. Generally, the mast has to be positioned
by practical considerations. The distance from the model's launching position to the mast has to be big
enough to provide time for launching the model. The model has to gain altitude before the ascending
airflow would reach the zone of model's start.
The relation between temperature graphs and weather conditions
1. Even weather (this and the next graph were obtained with Y Axis Range – 0.64°С):
Tsens
25.00
48.0
Tavg
24.97
∆T
0.03
2. Air warms up and forms an ascending thermal air flow:
Tsens
25.45
Tavg
25.07
∆T
0.38
48.0
Manual V1.4 ENG
Copyright © 2008-2009 Vladimir Afanasiev E-mail: [email protected] WWW: www.digflow.ru
Page 5
3. The air mass took-off or was blown away by the wind. This type of graph gives the most
indicative signal for launching an airplane model:
Tsens
25.35
48.0
Tavg
25.17
∆T
0.18
4. Descending air flow:
Tsens
24.86
48.0
Tavg
25.17
∆T
-0.31
The figures above show general temperature graphs obtained using the «Digital Flow-2» system.
These type of graphs were recognized by many well known people in aeromodelling sports as the most
common indicators for the discussed weather conditions. The «Digital Flow-2» allows you to design
better methods for locating ascending thermal airflows. In any case, locating ascending air flows has
never been so easy, simple, and convenient as with the «Digital Flow-2» system. We wish you good luck
and the best results!
Manual V1.4 ENG
Copyright © 2008-2009 Vladimir Afanasiev E-mail: [email protected] WWW: www.digflow.ru
Page 6
Possible malfunctions of «Digital Flow -2» system and resolution methods
Malfunction / Error
The cause
A graph on receiver device is
not within the range of the Y
Axis scale. The battery
discharge indicator with the
«S» index is showing.
The contrast of LCD display
on receiver device is low. The
battery discharge indicator
with the «R» index is
showing.
The working range of the
system at one place is smaller
than in the other. Temperature
graphs are displayed with high
discrepancy. One of the
following
indicators
are
illuminated: «YE», «YС», or
«YID».
The receiver device
showing «Error».
is
The image on the LCD display
doesn't change, device doesn't
respond to pressing buttons.
When pressing the power
button, receiver device doesn't
respond.
Resolution
Strong battery discharge. Batteries were Replace batteries inside the
not replaced on a timely basis.
sensor. It is suggested to
change batteries right after the
discharge
indicator
was
illuminated.
Strong battery discharge inside receiver. Replace batteries inside the
Batteries were not replaced on a timely receiver device. It is suggested
basis.
to change batteries right after
the discharge indicator was
illuminated.
1. Strong radio emission on the system's 1. Change the distance from
frequency, or close to it. In the past, it sensor to receiver device.
was determined that the working range Change the position of the
could decrease when using the system system.
close to CDMA-2000 stations that use 2. Position your sensor and
the frequency of 450 MHz.
receiver device far from other
2. Several sensors are located in the sensors. Control the quality of
range of you receiver device. Other transmitted signal using the
sensors are closer than your sensor and signal indicator on the device.
suppress the signal.
When there are no letters
showing, it indicates the
strongest signal.
1. The measured temperature is out of 1. To prevent system damage
it must be used in its work
range from 0- 61.44°С.
temperature range.
2. The sensor was damaged by a foreign 2. Sensor needs to be replaced.
object, which penetrated the box through
the temperature inlet opening.
Error in the program of receiver device. Take batteries out of receiver
device for several seconds, and
then insert them back.