1
9.3
Unit operation through the Touch Screen.
9.3.1 Home page.
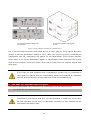
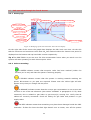
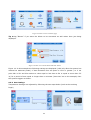
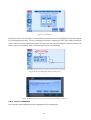
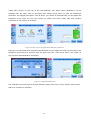
CO2% set-point
Current CO2% value
Touch here to know generic
info about CO2 Controller and
running time
Max CO2% reached within the time-period
Min CO2% reached within the time-period
Touch here at any time to
come back to the Main page
Touch here to access system
options and settings
Touch here to go to
the OVERVIEW page
Chart history lenght set at 1h
Figure 13. Homepage of the CO2 Controller Touch Screen Display.
On the right side of the screen the graph chart displays the CO2 level over time. On the CO2
tab the minimum and maximum value that CO2 has reached within the chosen time period is
displayed on the bottom and top hand side corners respectively.
Tip ►The OKO-TOUCH is pre-set at a 5% CO2 concentration hence when you witch it on the
system will start operating to reach this set-point value.
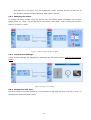
9.3.2 Colours meaning.
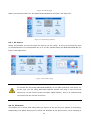
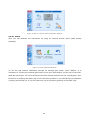
A GREEN indicator means that set-point value has been reached (within the
tolerance you’ve set) and that the system is working properly.
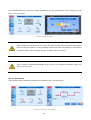
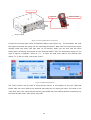
A YELLOW indicator means that the system is working towards reaching set
points. NO actions on you part are required. Please note the Yellow light will also
appear every time you change CO2 set point.
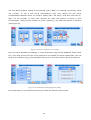
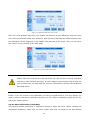
An ORANGE indicator means that the current gas concentration is not correct and
its value is out of the set tolerance (see section “ALARMS” in paragraph 9.3.5.2). Most
commonly this is related to gas leaks or gas source(s) running low. Verify that all
cables are correctly connected. Check all tubing for gas leaks and pressure in gas
supply tanks.
The RED indicator means that something may have been damaged inside the CO2
Controller. If after few hours the Red light doesn’t turn to Green, turn off the system
20