1
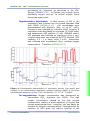
O2k-Protocols Mitochondrial Physiology Network 14.05: 1-15 (2011) 2009-2011 OROBOROS Version 3: 2011-12-11 Determination of Membrane Potential with TPP+ and an Ion Selective Electrode System Kathrin Renner-Sattler, Mario Fasching, Erich Gnaiger OROBOROS INSTRUMENTS Corp high-resolution respirometry Schöpfstr 18, A-6020 Innsbruck, Austria E-Mail: [email protected] www.oroboros.at Section 1. 2. 2.1. 2.2. 2.3. 3. 3.1. 3.2. 3.3. 3.4. 4. 4.1. 4.2. 4.3. 4.4. 5. 5.1. 5.2. 6. Introduction 2 Page Experimental Procedures ...................................... 2 The Experiment with Biological Material ................. 2 Instrumental Oxygen Background ......................... 4 Chemical TPP+ Background Experiments ............... 4 Some Important Considerations ............................ 5 Inhibition of Respiration by TPP+ ........................... 5 Correction for “Unspecific Binding” ........................ 6 Mitochondrial Volume........................................... 8 Intact and Permeabilized Cells .............................. 8 Experimental Design ............................................ 8 Amount of Sample ............................................... 8 Optimum TPP+ concentration ............................... 9 Hydrophobic Inhibitors ......................................... 9 Non Aqueous Solvents ......................................... 9 Calculation of the Membrane Potential ................. 10 The Chemical Background Run ............................ 10 The Biological Experiment .................................. 11 References ....................................................... 13 [email protected] www.oroboros.at MiPNet14.05 TPP+ and Membrane Potential 2 1. Introduction Kamo (1979) was the first to describe the measurement of mitochondrial membrane potential using tetraphenylphosphonium (TPP+) as a molecular probe in conjunction with an ion selective electrode (ISE) to read out the probe concentration in the bulk phase. A detailed description of the method, including preparation of a TPP+ selective electrode (or ISE for triphenylmethylphos-phonium, TPMP+) can be found in Brand (1995). Various TPP+ selective electrodes are described by Labajova et al (2006) or Satake et al (1991). 2. Experimental Procedures 2.1. The Experiment with Mitochondrial Preparations General: Perform a calibration run in the experimental range of TPP+ concentrations immediately before adding the sample into the chamber, without disturbing the set-up of the TPP+ electrode and reference electrode. It is essential to know exactly the total amount of + TPP in the chamber. Therefore, the suspended biological sample is introduced with an injection needle after the final TPP+ calibration step, without preconditioning of the sample with TPP+. The volume of liquid injected with the sample is determined exactly, and should be as small as possible for correction of the initial TPP+ concentration. Very rapid injections yield an instantaneous replacement of the volume in the chamber, for calculating the dilution of TPP+. To avoid introduction of air bubbles, frequently observed at the top of the suspension in the syringe, it may be advisable to inject an aliquot of the volume in the syringe (e.g. fill the syringe with 220 µl for the addition of 200 µl into the chamber). The plasma membrane of intact cells needs to be permeabilized, to guarantee free access of TPP+ to the mitochondria. During experiments with the ISE system, take special care to remove any extruded medium from the receptacle on the top of the stopper. Accumulating liquid on top of the stopper allows convection of liquid across the capillaries of the stopper, constituting a temporary distortion of oxygen (instrumental background oxygen flux) and a permanent distortion of the TPP+ concentration. Therefore, follow the OROBOROS INSTRUMENTS O2k-Protocols MiPNet14.05 TPP+ and Membrane Potential 3 procedures for injections as described in the ISEManual [MiPNet15.03]. In DatLab, use a graph layout displaying oxygen and pX, to control oxygen levels during the experiment. Representative Experiment: A total volume of 200 µl cell suspension was injected into the closed chamber filled with MiR06 [MiPNet14.13]. Cell membranes were permeabilized with digitonin (Dig; 10 µg∙10-6 cells). Complex I was inhibited by rotenone (Rot), Complex II respiration was stimulated by succinate (S; LEAK state) and subsequent ADP addition (2 mM; OXPHOS state). ATP synthase was inhibited by oligomycin (Omy), noncoupled respiration was obtained by FCCP titration (ETS capacity; 0.5 - 1 µl steps, stock 1 mM). Respiration was inhibited with myxothiazol (Myx; residual oxygen consumption). Titrations: [MiPNet09.12]. Figure 1: Simultaneous determination of respiratory activity (top graph) and changes in the mitochondrial membrane potential (bottom graph) in the acute lymphoblastic leukemia cell line C7H2. Cell density: 5.7∙106∙ml-1 in MiR06. Re-oxygenations: Oxygen concentration was maintained by intermittent H2O2 injections into MiR06. The high oxygen consumption caused by the high sample concentration leads to a quick depletion of oxygen and limited experimental time. However, this can easily be avoided by frequent reoxygenations. Reoxygenation by injection of H2O2 does not require opening of the OROBOROS INSTRUMENTS O2k-Protocols MiPNet14.05 TPP+ and Membrane Potential 4 chamber, therefore the distortion of the experiment is limited to a short injection peak. Oxygen concentrations may be maintained in a narrow range by frequent H2O2 injections, performed manually or automatically in the feedback mode of the TIP2k. Even an automatic OxyStat mode may be used [MiPNet12.10]. 2.2. Instrumental Background The instrumental background oxygen flux for the O2kbasic respiratory chamber with standard stopper [MiPNet14.06] is different from that with the TPP+ setup, and needs to be determined [MiPNet15.03]. 2.3. Chemical TPP+ Blank Experiment For correct calculation of membrane potential, the influence of the different chemicals on the TPP+ signal needs to be determined. Each injection during the experiment exerts an influence on the TPP+ signal by two fundamentally different mechanisms. General dilution effects: The injection of a solution not containing any TPP+ dilutes the TPP+ concentration and the total amount of TPP+ in the chamber. The free TPP+ concentration is a measured quantity and need not be corrected. The total amount of TPP+ in the chamber (including the TPP+ taken up by the mitochondria) however needs to be corrected after each injection to always use the correct value for calculation of the mitochondrial membrane potential. The necessary correction can be calculated directly from the injected volume. No chemical background test is necessary for this correction. Specific substance effects: Many substances, especially the organic solvents used as carrier, exert a specific influence on the TPP+ signal without actually changing the TPP+ concentration. Therefore, the signal has to be corrected for these specific effects, which are without influence on the total amount of TPP+ in the chamber. The basis for correction of the signal is a chemical blank experiment. Experimental results include significant artefacts without such a correction. Blank experiment: Follow the experimental sequence of chemical injections using the ISE setup. Some injections induce a rather strong distortion, particularly when ethanol is used as the solvent. ADP causes a OROBOROS INSTRUMENTS O2k-Protocols MiPNet14.05 TPP+ and Membrane Potential 5 signal disturbance in the opposite direction observed in the biological experiment. It is not necessary to maintain the time course of the experiment. Injections can be performed in a rapid sequence after stabilization of the TPP+ signal. Run a TPP+ calibration identical to the biological experiment, and perform all injections with the following exceptions: The injection introducing the biological sample is replaced by an injection of pre-thermostated medium. In the absence of biological materiel, H2O2 injections would lead to excessive oxygen levels and should be omitted. No specific H2O2 effect on the TPP+ signal was found, the dilution effect itself can be calculated and corrected for. Figure 2: Blank experiment, both dilution effects and substance specific effects are visible. Sequence of injections is identical to the experimental run (Fig. 1). 3. Methodological Considerations 3.1. Inhibition of Respiration by TPP+ A major first task in establishing a system for measurement of membrane potential using probe molecules is the evaluation of inhibitory concentrations of the probe molecule on the activity of respiration. This important 'side effect' of TPP+ and TPMP+ (and various dyes) is frequently ignored. Accurate knowledge of a threshold concentration is required to evaluate the necessary limit of detection of TPP+, and for restriction of experimental TPP+ concentrations below the inhibitory range. Brand (1995) reported an onset of inhibition of respiration for TPMP+ or TPP+ concentrations >5-10 µM. Several groups used considerably higher concentrations (Kamo et al 1979; Mootha et al 1996). On the other hand, the critical concentration might be considerable lower depending on the substrate applied (Mildaziene et al 1997). OROBOROS INSTRUMENTS O2k-Protocols MiPNet14.05 TPP+ and Membrane Potential 6 Figure 3: Inhibitory effect of TPP+ on respiration in 32D cells. a: Comparison of cell respiration in various states without TPP+ (Controls) and with added TPP+ (15 µM). Ce, ROUTINE respiration of intact cells with endogenous substrate; Dig, digotonin, inducing a LEAK state after permeabilization with pyruvate and malate; D, ADP, activating OXPHOS; D*, control versus TPP+ inhibition; G, glutamate; c, cytochrome c; S, succinate; Rot, rotenone. b: Comparison of normalized flux (OXPHOS) in controls without TPP+ (Cont.) and with various TPP+ concentrations. No inhibition was detectable up to 5 µM TPP+. The inhibitory threshold level should be determined for each system to be studied in the range of experimental conditions (substrates, coupling states). The probe concentration that actually inhibits respiratory function can easily be determined using HRR (Fig. 3). 3.2. Correction for “Unspecific Binding” The hydrophobic cations TPP+ and TPMP+ are not only translocated into the mitochondria, but also “bind unspecifically” to membrane materials. Various methods to determine appropriate correction factors are described in the literature (Rottenberg 1984, Aiuchi et al 1989, Brand 1995, Kamo et a 1979, Labajova et al 2006). The most important considerations in respect to this “unspecific binding” are: Internal unspecific binding (unspecific binding of probe molecules taken up into the mitochondrial matrix) is important for calculating the absolute value of the membrane potential, but it does not influence changes in the resulting membrane potential at all. It is a property of the equations that a difference of e.g. 30 mV in membrane potential between two states will always remain constant, independent on assumptions about internal binding of TPP+. OROBOROS INSTRUMENTS O2k-Protocols MiPNet14.05 TPP+ and Membrane Potential 7 External unspecific binding (TPP+ bound outside of the inner mitochondrial membrane or to the outside of the inner membrane) does affect a change of membrane potential mathematically, but external binding is of no significance at reasonably high membrane potential. This is because then the concentration of TPP+ inside the mitochondria is much higher than outside. For isolated mitochondria the fraction of unspecifically bound probe molecules of the total amount of probe molecules taken up by the mitochondria has been estimated to be negligible (Kamo et al 1979), but also to be significant and high in the range of 60-80% for TPMP+ (Brand 1995; calculated form Rottenberg 1984) and about 90% for TPP+ (calculated from Rottenberg 1984). Some of the cited references mention ways to measure the binding correction without the need for radioactive labeling. The easiest way would be to + measure TPP uptake when there is no membrane potential (dead cells like in the original Kamo paper, or uncoupling). However, it appears that the extremely high accuracy needed theoretically will be difficult to obtain experimentally. We suggest to consult a the various references for critical assessment of the different assumptions made in the corrections for unspecific binding, particularly Rottenberg (1984), Brand (1995) and Labajova et al (2006). Although the equations for applications of a TPP+ electrode (Labajova et al 2006) are different from those for radioactive labeling (Rottenberg 1984), the same general approach is used. An error is perhaps included in the final equation of Rottenberg (1984; possibly omitting the multiplication of the apparent partition coefficient with the protein mass). It seems, however, to be possible to convert the Rottenberg (1984) factors to the Brand (1995) factors for a given mitochondrial volume. Critically speaking, absolute values of the mitochondrial membrane potential cannot be obtained from this method, considering the huge problems and lots of assumptions when dealing with unspecific binding of TPP+, although this view is hardly shared in the literature. The voltage [mV] changes in membrane potential are obtained quantitativele with the ISE approach. This is a huge advantage over fluorescence dye methods where merely semiquantitative trends are visualized for changes in membrane potentials - at the best. OROBOROS INSTRUMENTS O2k-Protocols MiPNet14.05 TPP+ and Membrane Potential 8 3.3. Mitochondrial Volume Without radiolabeling, the mitochondrial volume will have to be taken from the literature, where it is frequentyl stated per mitochondrial protein [µl/mg Pmt]. Fortunately, changes in membrane potential are again not influenced by assumptions on mitochondrial volume. The mathematical influence of the mitochondrial volume on the absolute value depends on the unspecific binding - but in a „favorable‟ way: With increasing unspecific binding, the total amount of "free" probe inside the mitochondria declines. Therefore, errors in mitochodrial volume will be less significant for a probe showing higher unspecific binding (e.g. TPP+ as compared to TPMP+). As Rottenberg (1984) pointed out, this could mean that when the mitochondrial volume is changing during the experiment, the values obtained with a binding probe molecule like TPP+ could actually be more precise than those with the "nonbinding" Rb+ probe, despite all the problems introduced by unspecific binding. 3.4. Intact and Permeabilized Cells Most experience in measuring mitochondrial membrane potential derives from work with isolated mitochondria. For the measurement of membrane potential in intact cells two membrane potentials have to be considered. This problem may be addressed by several approaches: One membrane potential (mitochondrial or plasma membrane) may be assumed to be known, the other is then calculated (Aiuchi 1989; Brand 1995). Or one membrane potential is collapsed (Aiuchi 1989; Labajova et al 2006; Brand 1995; Yasuda et al 2003). In addition, unspecific binding of the probe molecule by the cell material outside the mitochondria has to be taken into account (Aiuchi 1989; Brand 1995). 4. Experimental Design 4.1. Amount of Sample To achieve analyzable concentration changes in the reporter ion (TPP+), larger amounts of sample are necessary than typically used in high resolution respirometry. We suggest to choose a sample concentration resulting at least in a 50% decline of the OROBOROS INSTRUMENTS O2k-Protocols MiPNet14.05 TPP+ and Membrane Potential 9 TPP+ concentration during the course of the experiment. Reasonable TPP+ concentration changes were achieved by applying 6.106 cells/ml (CEM CCRF C7H2, an acute lymphoblastic leukemia cell line; Renner et al 2003), resulting in a maximum Complex II activated coupled respiration of about 320 pmol∙s-1∙ml-1 (Figure 1). The respiratory activity of this cell line is comparable to a variety of other cultured cell lines, like human umbilical vein endothelial cells, cultured colon carcinoma and hepatoma cell lines and mesothelial cells. Primary isolated cells might be different, e.g. primary isolated hepatocytes are much larger, packed with mitochondria and therefore the necessary sample concentration might be much lower. 4.2. Optimum TPP+ concentration As described in Section 3.1, determination of the accurate TPP+ threshold concentration is required. The inhibitory concentration needs to be defined for each biological system. The experimental TPP+ concentration has be above the limit of detection and restricted below the inhibitory concentration. 4.3. Hydrophobic Inhibitors The carry-over of hydrophobic inhibitors between experiments may be a problem even in standard experiments. For experiments using ISEs the problem is aggravated by the hydrophobic nature of the PVC membrane of the ISE that may accumulate such substances. Washing procedures for the ISE are discussed in the ISE manual [MiPNet15.03]. Additionally, the concentrations of inhibitors used should be addressed. When saturating (“limiting”) concentrations of a specific inhibitor are required, existing protocols may in fact use far higher concentrations than really necessary for a specific type of experiment. This can be checked by titration experiments. 4.4. Non Aqueous Solvents ISEs based on a PVC membrane are inherently suitable only for measurements in aqueous media. Addition of non-aqueous solvents (EtOH, DMSO) not only damage the membrane (at high concentrations) but also distort OROBOROS INSTRUMENTS O2k-Protocols MiPNet14.05 TPP+ and Membrane Potential 10 the signal and may induce signal drift. Since the signal distortions are cumulative, the effects are most severe if such substances are introduced early in the experiment. The quantity of non-aqueous solvents introduced into the chamber should be minimized as far as possible. One way to achieve this is e.g. using stock solutions of higher concentrations, thereby requiring less solvent volume. If a certain amount of digitonin has to be introduced into the chamber using DMSO as carrier, the possibility to use a higher digitonin concentration (requiring a lower volume of DMSO) should be explored. 5. Calculation of the Membrane Potential This is a general outline of the approach used in the OROBOROS templates. Other approaches may be equivalent or better; see [MiPNet14.05] for Excel Templates and DatLabDemo Files. 5.1. The Chemical Blank Run Regions of stable signal after each calibration injection (and before the first calibration injection) are marked. To calculate the signal changes imposed by the tested substances, regions of stable signal before and after each injection should be marked, e.g. “pre-D” and “D”. This will eliminate drift effects. The marks are exported to a spreadsheet. A calibration raw signal / log10 [TPP+] is done. Each step change (before /after) injection is considered separately. The observed step change is a mixture of dilution effects and substance specific artifacts to the TPP+ signal. To separate the substance-specific artifacts from the dilution effect (see above) the following steps are taken: 1. Mark the signal before and after an injection and calculate the difference. 2. Calculate the TPP+ concentration directly before the injection (using the marked signal in DatLab) and the lower concentration after the injection, according to the dilution by the injected volume. OROBOROS INSTRUMENTS O2k-Protocols MiPNet14.05 TPP+ and Membrane Potential 3. 4. 5. 6. 7. 11 The TPP+ concentration directly before an injection is calculated by marking the signal in DatLab just before the injection and putting the value in the calibration curve. Knowing the injected volume, the dilution and therefore the new concentration can be calculated. This calculated TPP+ concentration corresponds to an expected signal, again obtained by the calibration data. Calculate the signal difference between the two concentrations. Determine if there is a difference between the theoretically expected signal difference and the signal difference obtained experimentally. If we have a change in the TPP+ signal caused by dilution only, the difference should be zero. If there is a difference, positive or negative, this value gives us the substrate specific effect, which is important for correct data evaluation. 5.2. The Biological Experiment Marks are set in the usual way on the sections of interest and on the calibration sections. A calibration is performed: raw signal / log10 [TPP+]. Raw data for the experiment are extracted. At this stage a drift correction on the raw signal may be done, although to establish a reliable estimation of signal drift during the biological part of the experiment is difficult. However, a correction for drift between the last calibration point and time immediately before the introduction of the biological experiment can be done more confidently, see below. To allow for correction of substance-specific effects the data obtained from the blank run are used. The correction voltage determined for each injection in the chemical background experiment is added to the correction term from the previous region (the effects are cumulative), i.e. the correction term is modified for each region and contains the “history” of the experiment up to the current region. For each region the current correction term is subtracted from the raw voltage to give a corrected voltage. The corrected voltage is used with the calibration data (slope, intercept) to calculate the true concentration of free TPP+ in solution. The same mechanism is also used for the correction of signal drift between calibration and OROBOROS INSTRUMENTS O2k-Protocols MiPNet14.05 TPP+ and Membrane Potential 12 introduction of sample: The difference in the raw signal between the last calibration region and the region immediately before introduction of the sample is calculated and used as the first correction term to be subtracted from all subsequent voltages. At the same time the volumes of all the injections are used to calculate the total amount of TPP+ in the chamber (including TPP+ taken up by the sample) for any given time. From the free TPP+ concentration and the total amount of TPP+ present in the chamber, the membrane potential is calculated using a 4 compartment model (Rottenberg 1984; Labajova 2006). As discussed above the absolute results depend inter alia on unspecific binding correction factors, while delta delta psi values (differences of potential) are independent of the unspecific binding parameters. Based on the four-compartment model (Rottenberg 1984) the following equation was used to calculate mitochondrial membrane potential for permeabilized cells: nadd Vext K O' PC RT cext,free ΔΨ = ln ' zF V spec Pmt + K i Pmt mt cext,free Ki' Ko' nadd Pmt PC Vmt(spec) Vext free concentration of probe ion outside mitochondria apparent partition coefficient describing internal binding apparent partition coefficient describing external binding total amount of probe ions added to the system total mitochondrial protein content (as a marker for mitochondrial membrane content) total cellular protein content (as a marker for cellular membrane and other material content); Vmt(spec)mass specific mitochondrial volume (per mass of mitochondrial protein) mass-specific mitochondrial volume (per mass of mitochondrial protein) external volume: total solution volume outside mitos Acknowledgements We thank Dra. Francesca Scandurra and Dr. Patrick Subarsky for collaboration in the initial tests of TPP+ inhibition of respiration and application with permeabilized cells, and Dipl.Biol. Anita Wiethüchter for editorial assistance. OROBOROS INSTRUMENTS O2k-Protocols MiPNet14.05 TPP+ and Membrane Potential 13 6. References Aiuchi T, Matsunaga M, Nakaya K, Nakamura Y (1989), Calculation of membrane potential in synaptosomes with use of a lipophilic cation (tetraphenylphosphonium). Chem Pharm Bull 37: 3333-3337. Brand MD (1995) Measurement of mitochondrial protonmotive force. In: Bioenergetics. A practical approach (Brown GC, Cooper CE, eds) pp 39-62. Oxford University Press, Oxford. Demura M, Kamo N, Kobatake Y (1985) Determination of membrane potential with lipophilic cations: correction of probe binding. Biochim Biophys Acta 820: 207-215. Demura M, Kamo N, Kobatake Y (1987) Binding of lipophilic cations to the liposomal membrane: thermodynamic analysis. Biochim Biophys Acta 903: 303-308. Kamo N, Muratsugu M, Hongoh R, Kobatake Y (1979) Membrane potential of mitochondria measured with an electrode sensitive to tetraphenylphosphonium and relationship between proton electrochemical potential and phosphorylation potential in steady state. J Membr Biol 49:105-121. Labajova A, Vojtiskova A, Krivakova P, Kofranek J, Drahota Z, Houstek J. (2006) Evaluation of mitochondrial membrane potential using a computerized device with a tetraphenylphosphonium-selective electrode. Analyt Biochem 353: 37-42. Mildaziene V, Marcinkeviciute A, Nauciene Z, Kalvenas A, Zimkus A. (1997) Tetraphenylphosphonium inhibits oxidation of physiological substrates in heart mitochondria. Mol Cell Biochem 174: 67-70. Mootha VK, French S, Balaban RS (1996) Neutral carrier-based "Ca2+-sensitive" microelectrodes for the measurement of tetraphenylphosphonium. Analyt Biochem 236: 327-330. Renner K, Amberger A, Konwalinka G, Gnaiger E (2003) Changes of mitochondrial respiration, mitochondrial content and cell size after induction of apoptosis in leukemia cells. Biochim Biophys Acta 1642: 115-123. Rottenberg H (1984) Membrane potential and surface potential in mitochondria: uptake and binding of lipophilic cations. J Membr Biol 81: 127-138. Satake H, Hori H, Kaneshina S (1991) A coated wire electrode sensitive to tetraphenylphosphonium ion for measurement of the mitochondrial membrane potential. Analyt Lett 24: 295-304. Yasuda K, Ohmizo C, Katsu T (2003) Potassium and tetraphenylphosphonium ion-selective electrodes for monitoring changes in the permeability of bacterial outer and cytoplasmic membranes. J Microbiolog Meth 54: 111115. O2k-Manual MiPNet15.03 MiPNet12.07 Protocols MiPNet09.12 MiPNet12.10 MiPNet14.13 O2k-MultiSensor system with ion selective electrodes (ISE). DatLab 4 Guide through the menus. Oxygraph-2k titrations: Mitochondria, permeabilized cells and biopsies. Titration-Injection microPump TIP2k. User manual. Mitochondrial respiration medium - MiR06. OROBOROS INSTRUMENTS O2k-Protocols MiPNet14.05 TPP+ and Membrane Potential 14 Instructions for Using the Templates „Membrane_Potential_Template_...“ The described templates help to calculate mitochondrial membrane potentials for isolated mitochondria and permeabilized cells. For and permeabilized fibres modifications are necessary. Note: Due to the linear relationship between the observed raw pX signal and the logarithm of the TPP+ concentration all steps described here can use either the “pX Raw Signal” or “pX Calibrated” Data (obtained after a 2 point calibration [MiPNet15.03]) as input. In the latter case the 5 point calibration in the template described here will be a refinement of the initial 2 point calibration. It is however important to consequently use one dataset only, e.g. when pTPP+ values are used as input for calibration and calculation the correction values for chemical TPP+ background correction also have to be expressed in pTPP+ - which is easily achieved by using pTPP+ values as input into the “Chemical TPP Background” template. A. Chemical TPP Background I.) In DatLab: Preparations: Open the DatLab file for the chemical TPP+ background experiment. Reset the pX Calibrated” signal to “pX raw Signal” [MiPNet15.03]. Select a layout displaying “pX Raw Signal” or display such a plot by using the “Select Plots” window [MiPNet12.07]. Select “pX Raw signal” as the active plot. Marking regions: The experiment consists of a calibration part and a chemical background part. In the calibration part, mark regions of stable flux for all 5 concentrations to be included in the calibration. Name the regions by using a name template or manually. For the proper chemical TPP+ background part of the experiment, place a mark before and after each injection and name them, e.g. “pre-ADP” and “ADP”. Exporting the data: Use “Marks” / “Statistics” to display the data for the marked regions. Check that the correct signal (pX Raw Voltage”) was selected. Export the data with “Copy to Clipboard” II.) In a Spreadsheet Program (MS Excel®, …) Importing the Data into a Spreadsheet Program: Open the template for the correct chamber (left or right) e.g. “Membrane_potential_right_empty” and save it under a new name. Select the sheet “1-chemical TPP background”. Place the curser on cell B8, marked in red (left chamber) or green (right chamber) and insert the copied data (Ctrl + v). Calibration: Fill in the fields marked yellow in row 1 to 5 describing your system. Fill in / check the fields marked yellow in rows 30 and 31. Typically these values will remain the same for a series of experiments, so you may want to save a modified template. “V added” denotes the volumes in µM added in the calibration steps and all subsequent injections. “c added” is the TPP+ concentration used in the calibration solution (the solution in the TIP syringes) for the calibration steps. For injections after the calibration c added is usually 0, unless a solution containing TPP+ was used. “V total” (field D32) is the chamber volume in µl (usually 2000). “c” in cell D33 is the initial TPP+ concentration in mol/l, before ANY injection covered by this spreadsheet was done. If the chambers were filled with a medium already containing a low TPP+ concentration, this concentration should be entered here. In many cases this concentration will be zero. The template is set up for 5 regions in the calibration range. If a different number of calibration points are used, the template has to be modified. Evaluatuation of the Calibration (Quality control): After the data has been inserted and all yellow fields been filled, the calibration results are visible in the spreadsheet. The slope and intercept are displayed in fields F3 to F4.. Below the calculations a “statistics” region is displayed. Slope and intercept are calculated in this region using an arrayed formula in B47:C51. Please refer to the OROBOROS INSTRUMENTS O2k-Protocols MiPNet14.05 TPP+ and Membrane Potential 15 help function of your spreadsheet program for more information about arrayed formulas. Usually the key combination (Crtl+ Shift+ division sign) will mark an arrayed formula and (Ctrl + Shift+ Enter) will confirm changes (The marking before edit may not be necessary with new software versions). If the TPP+ concentration during a biological experiment does only cover part of the calibration range, only the relevant calibration concentrations should be used by editing the arrayed formula. One output of the arrayed formula is the RSQ value that may be used as a quality control for the linearity obtained in the calibration. Below the statistics fields are two plots: The semi-logarithmic plot to the left should show a linear relationship between the raw signal and the logarithm of the TPP+ concentration. The plot on the right displays the relative residues of the calibration: Concentrations for the calibration points calculated from the obtained slope and intercept themselves are compared with the known true concentrations and the difference is expressed as a fraction. Note that this plot is only a measure for the linearity of the calibration, not for its accuracy. Results: The results from the calibration phase are only used internaly for the calculation of substance specific correctionvalues, see below. Chemical TPP Background: Still using “1-Chemical TPP background”, fill in the volumes for all injections done to determine the chemical TPP background in row 30, starting with columns J/K (after the calibration). The volumes for the pre-injection marks will be zero. The TPP+ concentrations in row 31 will usually be zero for all background injections. The results from the background experiment can be found in row 42, starting with column K and from there to the right. These cells are marked in blue. Row 42 has no significance for the calibration part of the experiment (left of column K). Each value in row 42 denotes a correction value calculated from its own column and the column to the left. If you have a column “pre-ADP” to the left and to the right a column “ADP” the value in row 42 of the column “ADP” will be the correction voltage for ADP injection. Numbers in the “pre-ADP” and similar columns have no significance. Note down the correction values (post-injections) from row 42 for all injections. We suggest collecting them from several blank experiments in a spreadsheet. These values will be used in the “biol exp-calculation sheet”. Over time this data will show which injections do need a correction at all. If the necessary corrections are reproducible for identical experimental conditions, it may no longer be necessary to run a separate chemical TPP background experiment for each biological experiment. B. Biological Experiment I.) In DatLab: Preparations: Open the DatLab file containing the data from the biological experiment. If using “pX raw voltage” as input, reset the “pX Calibrated” signal to “pX Raw Signal” [MiPNet15.03]. Select a layout displaying “pX Raw Signal” or “pX calibrated” or display such a plot by using the “Select Plots” window [MiPNet12.07]. Select the pX Signal as the active plot. Marking regions: The experiment consists of a calibration part and the biological experiment. Mark regions for the calibration part as described for the blank experiment and name the regions using a name template or manually. Place one marks just before and one mark just after the biological sample was injected to the chamber. Place further marks according to your protocol. For the biological experiment it usually will not be necessary to place marks before and after each injection. Instead, stable regions for each state should be selected, as usually don for the O2 flux. Exporting the data: Use “Marks” / “Statistics” to display the data for the marked regions. Check that the correct signal (pX Raw Voltage”) was selected. Export the data with “Copy to Clipboard” II.) In a Spreadsheet Program (MS Excel®, Libre(Open) Office, …) Importing the Data into a Spreadsheet Program: Select the sheet “2-biol exp-calibration”. Place the curser on cell B8, marked in red (left chamber) or green (right chamber) and insert the copied data (Ctrl + v). Select the sheet “3-biol calculation”. Place the curser on cell A52, marked in red (left chamber) or green (right chamber) and insert the SAME block of copied data (Ctrl + v) there. OROBOROS INSTRUMENTS O2k-Protocols MiPNet14.05 TPP+ and Membrane Potential 16 Calibration: The procedure is very similar to the one described above for the calibration of the TPP chemical background experiment. Select the sheet “2-biol exp-calibration”. Fill in the fields marked yellow on top of the page (row 1-5) describing your system. Fill in / check the fields marked yellow in rows 30 and 31. Typically these values will remain the same for a series of experiments, so you may want to save a modified template. Please see “TPP chemical background”/ Calibration above for a description of the individual input fields. Evaluatation of the Calibration (Quality control): See “TPP chemical background” and Calibration above Results: The slope and intercept are displayed in fields F3 to F4. The true TPP+ concentration after the last calibration step is displayed in cell I33. These cells are marked blue. These values will later be copied from the “2-biol exp-calibration” sheet and inserted (values only!) into the “3-biol exp-calculation” sheet. Calculation of Membrane Potential: When copying and pasting values from other sheets, make sure to paste as a ‘value’, not as a formula! Select the sheet “3-biol exp-calculation”. Copy “slope” and “intercept” from cells F3 and F4 in „2-biol exp-calibration‟ to cells C5 and C6. Copy the TPP concentration after the last calibration step from cell I33in „2-biol exp-calibration‟ to cell C14. Fill in cells C8 to C15, describing your system. Some values like the binding parameters and mitochondrial volume might have to be estimated from literature. It is important to understand the underlying concepts (see the cited literature) and decide on the best values for your sample. For isolated mitochondria set Pc = Pmt. In row 22 (starting with column L) the correction voltages for the chemical TPP background have to be entered. These values have been extracted and noted down before using “1-chemical TPP background”. For each injection done during the experiment search for the corresponding injection (same substance, same carrier, and same volume) in your list of results from “1-chemical TPP background”. Because the sequence of marks will be different in both experiments it is not suggested to try to automatic this process by using some kind of overall copy/paste procedure. Instead each value required should be copied and checked carefully. Note that the first value in this row (I22) is calculated automatically to correct for the drift between the end of the calibration and the start of the experiment. To enable this feature the two first data columns have to be the last point of calibration and a region immediately before the sample was introduced. This is ensured by the guidelines for marking and exporting data described above. Fill in the yellow fields in row 26 with the injected volumes in µl. These data are used for the dilution correction. The placing of marks exactly as described is crucial for this process. The dilution correction for TPP starts with the first injection (usually the sample) done, i.e. in row J. The dilution correction for the sample however can only start for the first injection AFTER the sample was introduced, i.e. in row K. If an experimental sequence does not fit the template (e.g. an additional injection before the introduction of the sample is required) the template may have to be slightly modified. If an inhomogeneous sample is used that is not diluted/ replaced by injections (e.g. permeabilized fibers) the values for Pmt, Pc, and Vmt(abs) in rows 27 to 29 have to be set constant to their starting values given in cells in C10, C11, and H12, respectively. Results: The yellow marked cell E75 may be used to enter an assumed drift (in mV/s or mp[TPP]) thereby performing a drift correction on the pX signal. The drift may be obtained by placing a mark on a suitable region of the pX Slope signal. Delta Psi values are given in row 45, differences (delta delta Psi) to a reference region defined in E50 are given in row 48. OROBOROS INSTRUMENTS O2k-Protocols