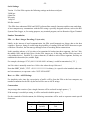
1
Real time BIA manual
A Truly Portable Body
Composition Analyzer
Complete Real Time Standalone BIA
kit for body composition analysis and
advanced scientific applications
-2RJL Systems presents the newest
member of advanced body analyzers
− Real Time BIA −
The past and present
The demand for accurate body composition
assessments has increased steadily throughout
the world. From outreach clinics in Guatemala,
Africa and Asia to modern university teaching
hospitals in the USA.
The common problem with virtually all body
composition analyzers is that they require a
PC or laptop computer to analyze BIA values
and they can not save important patient
records for future comparison. Printing a
fast, detailed report in the field or office has
also been a major problem.
Physiological Event Analyzer (PEA)
The advanced PEA can incorporate up to four
sensory modules that include BIA, ECG, IPG
and GSR[1]. The PEA can store over 900
patient records for later export into Cyprus or
any spreadsheet. In addition, the user can select
Cryprus or Weight Manager body composition
equations.
Application Paging
The PEA can have many different applications
reside in its internal flash memory. Each
application is selected with the front panel
paging buttons or the keyboard page keys.
Page 0: Series (Res, Xc, Z and Phase angle)
Page 1: Parallel (Res, Xc, Cap and Z index)
Page 2: Real time BIA data logging (PC interactive)
RJL Systems has the answer
Page 3: Body composition analysis (keyboard − printer)
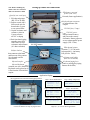
The Real Time BIA Body Composition kit
has all the components necessary to answer
these problems.
Infrared wireless keyboard
Fast thermal printer (4 inch paper)
The advanced PEA analyzer
Accessories (electrodes, cables, etc.)
Rechargeable batteries
Rigid carrying case
Pages 4,5,6,7 future applications, pages 8,9 system info
Real time data logging
The PEA is also designed for the scientist who
wants to capture physiological events in real
time. These events originate from the sensory
modules and are transferred back to a PC
for analysis (sampling rate: 1 msec to days).
Cyprus body composition software
Body composition patient records can be
transferred back to a Cyprus database for
historical graphical/numerical comparisons.
[1] ECG, IPG and GSR will be available by fall 2003
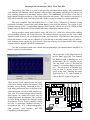
Glossary:
Resistor Capacitor
Capacitor
Xc
cell
membrane
Biological
Model of
a parallel
circuit
Res
Parallel resistor
extracellular fluid
Capacitor
Resistor
Series Model
Xc
Capacitor
Parallel capacitor
intracellular fluid
Parallel Model
BIA − Bioelectrical Impedance Analysis
ECG − Electrocardiography
IPG − Impedance Plethysmography
GSR − Galvanic Skin Response
Series Res − Measured BIA resistance (ohms)
Series Xc − Measured BIA reactance (ohms)
Z − Impedance − Vector sum of series Res & Xc (ohms)
Phase Angle − ArcTan of series Xc / series Res (dgrs)
Biological Model − The parallel model of Res and Xc
Parallel Res − The biological model of Res (ohms)
Parallel Xc − The biological model of Xc (ohms)
Cap − The capacitance of biological Xc (pico farads)
Features:
BIA range: 0 to 1000 ohms resistance and reactance
BIA resolution: 0.1 ohms resistance and reactance
Power: The PEA batteries operate as a true UPS
with 2.5 hours of continuous life after power is off.
Communications: Serial − 38.4 kbps (RS−232)
Clock: Self powered internal clock and calendar
Expansion: New sensory modules and features
can be added by a field technician or at RJL Systems
Equations: Includes Cyprus and Weight Manager
body composition algorithms
Includes: Cyprus and data logger on CD ROM
Diagnostics: Internal monitoring, displayed on page 9
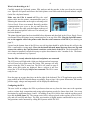
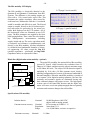
-3Note: Before installing any
cables to the rear connectors
make sure the PEA is OFF
Setting up cables and connections
PEA battery powered
printer (rear view)
Quad (4) use serial port
1. PEA thermal printer
(RS−232 at 38.4Kb)
2. Subject record (info)
900 records max for
download to Cyprus
or any spread sheet.
3. Capture resistance and
reactance values in
Cyprus software
on a PC or laptop
4. Real time data logging
sampling rates from
from 2 msec to days
resistance and reactance
(0.1 ohm resolution)
Not used (future applications)
Keyboard input connector
to infrared mouse like
coupler.
120 VAC fuse (.5 amp)
120 VAC power
charges internal battery
and powers the sensory
electronics. Battery operates
as true uninterruptible power
supply (UPS 2.5 hrs).
ON OFF buttons
PEA thermal printer
(contains 7.2 V 1100 mAh
rechargeable Li−ion battery
RJL part No. 70690)
Subject lead set
that connects to the hand
and foot area of the patient.
See electrode card for
more details.
Printer serial cable
(RS−232 at 38.4 Kb)
Keyboard paging keys
(same as pressing the paging
buttons on the PEA)
Infrared coupler
Infrared keyboard
(contains two AAA batteries)
Keyboard can be placed up to
8 feet from the PEA infrared
coupler.
Application Paging
PEA applications are selected with the paging buttons
Page 0: Series measurement
Resistance:
Reactance :
Impedance :
Phase DG :
500.7
56.8
503.9
6.47
Page 1: Parallel measurement
Par
Par
Cap
Imp
Use the ON buttons for setup on pages 8 and 9
Res
Reac
(pF)
Index
:
:
:
:
507.1
4471
712.3
1273
Page 3: Body composition
First Name:
____________________
Last Name:
____________________
Page 8: Set time/date
10:38:40 AM
08/14/2003
Press ’ON’ to
change date / time
Page 2: Real time logging
Page 9: System info and setup
Real Time Data
Logger Messages
DIAGS
TEMP 85 F
DG +5V AN +5V An −5V
5.00
5.08
5.07
Press ’ON’ for SETUP
Pages 4, 5, 6, 7 are for future applications
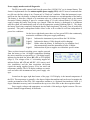
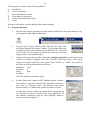
-4What is the first thing to do ?
Carefully unpack the keyboard, printer, PEA analyzer and the pouches in the cover from the carrying
case. Open the left pouch and remove the black printer serial cable and the keyboard infrared coupler
(looks like a keyboard mouse).
Make sure the PEA is turned off Plug the serial
printer cable into the printer communications port by
following the instructions on the right or referring to the
Citizen Handy Printer user manual. Basically, push the
communications port cover to the top and insert the
cable. To release the cable, push the button on the top of
the cable down and pull the cable out. The infrared port
has been disabled.
Inseting the printer serial cable
1. Push the communication port latch up
2. This will expose the serial port connector
3. Push the serial cable into the com port
4. To release the cable push the button
on the top of the connector down and
pull the cable out of the printer
5. See the Citizen Handy Printer manual
supplied with the instrument
The printer thermal paper has been installed before shipment and described in the Citizen Handy Printer
user manual. Place the printer in any convenient place or on top of the PEA. Plug the 9 pin DB connector on the opposite end of the printer cable into the serial connector of the PEA (see drawing on
page 3).
Located on the bottom front of the PEA are two tilt legs that should be pulled down, this will give the
PEA a comfortable viewing angle. Place the keyboard infrared mouse between these two legs and
connect the cable to the 9 pin keyboard connector on the back of the PEA. The keyboard has two
AAA batteries installed. It maybe necessary to replace these batteries after 3 months of use. The batteries are only used when a key is pressed.
Turn the PEA on only when the keyboard and printer are connected
The LCD screen will light with a light gray background and a message
will roll from left to right across the screen. This message will only
appear when the PEA is turned on. The PEA will return to page 0
where series BIA results are displayed. Since a subject is not connected the LCD will display Subject not connected. The PEA is now
ready for use.
RJL Systems
Real Time
Physiological
Event Analyzer
Press the page up or page down keys on the far right of the keyboard. The LCD application page and the
page number on the PEA should change accordingly. Page to page 9 for system information, the internal
powder supply voltages and temperature will be displayed continuously.
Configuring the PEA
The user is able to configure the PEA to preferences that can vary from the time zone to the equations
used to evaluate body composition and saving subject/patient records for future down load. See set-up
description for application pages 8 and 9. All editing of any PEA field is done with the up/down arrow
keys and the Back Space key. The current active field is always placed on the top line of the LCD display and will scroll up and down. The PEA user interface is highly intuitive and should be easy to use.
Any questions can be answered by calling RJL Systems at 800 528-4513.
-5Application pages
Page 0: Series resistance and reactance
Resistance:
Reactance :
Impedance :
Phase DG :
500.7
56.8
503.9
6.47
The series model of resistance and reactance as measured directly for the BIA module with 0.1 ohms of
resolution. Impedance and phase angle are calculated by the following equations.
reactance
Impedance or Z = √
resistance2 + reactance2
Phase angle = arc-tan or atan
resistance
Page 1: Parallel resistance and reactance
Par
Par
Cap
Imp
Res
Reac
(pF)
Index
:
:
:
:
507.1
4471
712.3
1273
The parallel model of resistance and reactance is a more accurate match to the true physiological or biological network of circuits. Res and Reac are the series values.
Reac2
Res2
Parallel Res = Res +
Parallel Reac = Reac +
Res
Reac
Impedance Index (Imp Index) is proprietary to RJL Systems
1 X 10¹²
Cap (pf) =
2 • Π • 50K • Par Reac
Real Time Data
Logger Messages
Page 2: Real time data logging
Real time data logging is PC interactive and will display various messages relevant to the starting and
ending of data logging. See the RJL Systems PEA Data Logger manual for further information.
Page 3: Body composition analysis
First Name:
____________________
Last Name:
____________________
The body composition applications is a fully implemented analytical tool for assessing body composition. It makes use of the keyboard and printer including saving patient records for future download to
Cyprus or any spreadsheet. Height and weight units can be metric or English and first/last name can be
as long as 19 characters. In addition, each subject record is date and time stamped in military or English
time/date standards (refer to page 9 set-up instructions).
Once a character is entered in the first or last name fields the paging feature of the PEA is disabled. All
the subject/patient data must be entered to complete the record. Each field (name, height, weight, etc)
will appear on the top line. Lines can be edited and scrolled with the arrow keys. The Back Space key is
used to delete any character when editing a specific field. All numerical information is checked for validity and will not allow the user to move to the next field until the information is within an acceptable
range. The resistance and reactance fields can be manually entered or be automatically read by the PEA
by pressing the F1 function key on the top of the keyboard.
Once all the subject/patient information has been entered, the body composition results can be displayed
on the LCD screen or printed. A subject record can only be saved when all information is successfully
entered and the body composition option screen (display results, print results, etc) is entered. When
printing a report make sure the printer is turned on (green light on top of the printer). It has an automatic
shut-off feature to save battery power and can sometime turn off when not used in time. See page 9 setup to set the equations (Cyprus or Weight Manager), units (English - metric) and the time/date format
(English - international)
-6-
Page 4, 5, 6, 7: Future applications
These pages are intentionally left blank. Future applications will include special functions from users
who want to expand the PEA beyond its current specifications and design. Accordingly, RJL Systems is
willing to work with any customer who wants additional usefulness from the PEA on an instrumentation
(hardware) and software basis.
10:38:40 AM
08/14/2003
Press ’ON’ to
change date / time
Page 8: Set time and date
Display the current time and date or change the time and date. Press the ON button (front panel) to
change the time and date. Use the up/down arrow keys on the keyboard to select the time/date field (i.e.
day, minutes, seconds, etc) then use the Back Space key to delete character from field. When complete
press the ON key to exit (front panel). The time/date format (English - international) is selected on page
9 (set-up).
Page 9: System information and configure preferences
DIAGS
TEMP 85 F
DG +5V AN +5V An −5V
5.00
5.08
5.07
Press ’ON’ for SETUP
Displayed on page 9 are internal parameters that include the operating temperature and the three main
power supply voltages. These measurements are monitored continuously and reflect the real state of the
PEA. Each PEA is temperature tested from -5 to 140 degrees Fahrenheit with less than 3 percent variation in power supply voltage and less than 1 percent variation in resistance and reactance.
The following preferences can be configured on page 9 when the ON button (front panel) is pressed.
Page 9 Set-up
•
•
•
•
•
•
parameter
Height
Weight
Date Format
Time Format
Equation set
Save patient records
English - preference
inch
pounds
MM/DD/YYYY
AM/PM
Cyprus / FNA
Yes
press ON (front panel) to exit the set-up mode.
metric - preference
centimeter
kilogram
YYYY/MM/DD
24-hr
Weight Manager
No
-7Power supply, monitor and self diagnostics
The PEA can safely operate both from the power line (120/240 VAC) or its internal battery. This
feature is implemented as a true uninterruptible power supply (UPS) with 2.5 hours of continuous battery life once the line voltage is in a "brown out" or "black out" condition. When the instrument is operated from the line, the battery is charged and the internal electronics are run independent of the battery.
The battery is, therefore, charged at its maximum safe rate, without any leakage back to the internal
electronics. Battery charging is part of a constant voltage (13.8 volts) current limited (170 Ma) power
supply, keeping the battery from being over charged. When the battery is discharged to its minimum
state the system will automatically turn off with an appropriate warning (blinking light C). This keeps
the battery from being completely discharged thereby improving battery life (many years of trouble free
operation). This power management feature allows events to be recorded in real time independent of
power line conditions.
On the lower right hand corner there are four green LED’s that continuously
monitor the conditions of the power supply and battery.
Light A
Light B
Light C
Light D
Indicates the instrument is powered from the 120/240 line.
Indicates the battery if fully charged (trickle charging).
Blinks when the battery is discharged to its minimum level,
then automatically turns the instrument off after 16 blinks.
Indicates that all power supplies are within their specifications.
There are three internal switching power supplies powered
from the battery or line. All digital components including
the micro-controller are operated by a 5 volt digital supply,
indicated on the third line below DG +5V on LCD display
(Page 9). The voltages of the ± 5 volt analog supplies are
indicated below AN +5V and AN -5V. ALL sensory modules (modalities) and the data acquisition sub-system
require the analog supplies because of its low noise and
temperature stability. The LCD display readings are continuous and reflect the instantaneous true power supply voltages.
DIAGS
TEMP 85 F
DG +5V AN +5V An −5V
5.00
5.08
5.07
Press ’ON’ for SETUP
Located on the upper right hand corner of the page 9 LCD display is the internal temperature of
the PEA. The temperature is generally a few degrees higher than ambient and can be used to monitor the
outside environment of the PEA. The temperature transducer is a National Semiconductor LM34 (± 1
degree Fahrenheit accuracy) and is located near the top cover of the PEA on the data acquisition board.
Power supply voltages and temperature are read with a 8 bit analog to digital converter. The resolution is limited to approximately 40 millivolts.
-8-
Bioelectrical Impedance Analysis (BIA)
Certificate of Electrode Placement
Recommended Electrode Placement
Detecting electrode
must be adjacent to
an imaginary line
bisecting the ulner
head of the wrist.
ulner head
RJL Systems
Detecting electrode
must be adjacent to
an imaginary line
bisecting the inside
ankle (medial
mallealus).
Red clip
Red clip
Right hand
Red leads
Black leads
Right foot
Black clip
Black clip
Signal introduction
electrodes are more distal
No
Yes Has the patient consumed large amounts of alcohol in the last 24 hours.
No
Yes Does patient have an implantable defibrillator, if yes stop BIA test.
No
Yes Have the electrodes passed their expiration date, if yes discard.
No
Yes Have you placed the four electrodes according to the above illustration.
No
Yes Is the resistance value between 250 and 900 ohms.
No
Yes Is the reactance value between 10 and 120 ohms.
No
Yes Are resistance and reactance values stable.
Date:
Health Care Provider:
Comments:
Technician:
-9-
Real time BIA manual
Real Time event logger user manual
Capturing (recording) resistance and reactance
values with 0.1 ohm resolution from
2. 0 milliseconds to 45 days per sample (16 bits)
The applications described in this section of the manual are for
investigational (research) purposes and have not been approved
by the FDA for commercial use.
advanced scientific applications
-10-
1.
Minimum System Requirements The RJL Systems Data Logger has the following minimum system requirements:
a.
Windows NT 4.0, 2000, or XP (Windows 3.11, 95, 98, and Millennium Edition are not supported)
b.
64 MB of memory or greater
c.
Display resolution of 800 x 600 pixels or greater 1024 X 768 recommended
d.
Pentium-II 300 Mhz or greater (This is the minimum speed that will allow the graph to be
updated every 2 ms)
If the computer does not meet or exceed these requirements, the setup program will not allow the
Data Logger to be installed.
II.
Installation of the RJL Systems Data Logger software.
The installation from the CD ROM is generally automatic by just
inserting the disc. If the setup program does not automatically begin
when the CD rom disk is inserted, select Run from the "Start
Menu". In the box which opens, type "D:setup" to begin the setup
process. (Substitute the letter of the appropriate CD- ROM drive for
D, if necessary.) A box will appear with three buttons. Click the
"Install DataLogger" button to begin the setup process.
-11The setup process consists of the following windows:
A.
B.
C.
D.
E.
F.
Introduction
License Agreement
Select Destination Location
Select Entry for Start Menu
Verification of Installation Tasks
Finish
Most users will simply accept the default options when installing.
III.
Program Operation
a.
Start the Data Logger application by either double-clicking the icon on the desktop, or by
selecting the shortcut from the Start menu.
b.
To open a log file, select "Open Log File" from the "File" menu. This
will open a standard "file chooser" window. Type the name for the log
file and select the folder in which to save it and click "Ok." The name
of the log file will now appear in the title bar at the top of the Data
Logger window. (see image on page 1)
c.
Configure the serial port by either clicking the Configure Serial Port at the bottom of the
window, or selecting "Configure Serial Port" from the "Serial Port" menu. Select which
serial port to connect to the PEA with. (Usually either "COM1" or "COM2") For your PEA
unit, the rest of the settings should be as follows:
Baud Rate:
Data Bits:
Parity:
Stop Bits:
38.4k
8
None
1
All of the checkboxes should be empty.
d.
Set how often to take a sample in the "Sampling Options" window.
This window is opened by selecting "Set Sample Rate and Duration" from the "Logging" menu. The minimum time period
between samples is 1 millisecond, and the maximum is 45 days.
To take only a specific number of samples before closing the log
file, specify the number of samples in the Log Length field. To
take samples continuously until the "Stop Sampling" button is
pressed, set the log length to ’-1’
-12e.
Clicking the "Advanced" button in the "Sampling Options" window opens the "Advanced Graphing Options" window. This window contains the following settings:
1.
2.
Pixels per sample. To spread the graph out a bit, and make
details somewhat easier to read, raise this value. Its default
value is 1.
Sample skipping. Computers with slower processors may not be able to keep up with
faster sample rates. As a result, it may be desirable to log samples at a fast rate (for
later processing) and only graph every other sample. The default is to plot every sample logged on the graph.
f.
Graph Ranges. The DataLogger defaults to a range of 0-1000 for
Resistance, and 0-100 for Reactance. These ranges can be overridden by selecting "Graphing Options" from the "Logging"
menu. Changing the range while logging is in progress will cause
the graph to clear, but will not affect the readings going into the
log file.
g.
Taking Samples. Before logging can begin, the PEA must be
turned on and connected to the serial port. Click the "Open /
Close Port" button to initiate the conversation between the PEA
and the Data Logger application. Once the data logger has successfully connected to the PEA, the "Sample and Graph" and
"Batch Log" buttons will become active.
If the Data Logger can not open communications with the PEA, a warning message will
appear. If this happens, make sure that the PEA is turned on, and that it is connected to your
computer’s serial port. Also, make sure that no other programs (like Palm Desktop’s HotSync Manager*) are attempting to use that same serial port. If the Data Logger still can not
communicate with the PEA, go back to step "C" and verify that the port settings are correct.
If all of the settings appear to be correct, it may be necessary to select a different COM Port.
Begin taking samples by clicking either the "Sample and Graph" or "Batch Log" button.
When either of these buttons is clicked and no log file is presently open, a window will
appear asking if the data is to be saved to a log file or not. Logging will begin immediately
after this window is closed.
The "Sample and Graph" button retrieves (and graphs) data in real time. Therefore, the sample period must be greater than the amount of time required to transmit a sample. If the
sample period is too small to accommodate data transmission, a window will appear with the
minimum allowable sample rate for real-time data retrieval. If, while graphing, one of the
channels should exceed the PEA’s sensor range, (± 16384) that channel will disappear from
the graph until it comes back into range. If the value is still within the sensor range, but outside the range on the graph, you may adjust the graph’s range to bring it into view. (see
above)
The "Batch Log" button, on the other hand, will store the log on the PEA itself, and retrieve
the data only when logging is finished. By using the "Batch Log" button, sample rates of 1
ms. can be achieved, regardless of the time required to transmit a sample. When logging
begins, the "Sample and Graph" and "Batch Log" buttons are disabled, and the "Stop
-13Sampling" button becomes active.
Logging will continue until one of three things happens:
1.
2.
3.
The "Stop Sampling" button has been pressed.
The desired number of samples have been
taken and saved to the log file (see part D.)
The application is closed.
In all cases, when logging has finished, the log file will be closed and marked with the date
and time at which logging has finished.
IV.
Log File Format
The log files generated by the data logger application are standard comma-separated files. (*.csv) The first line in the file contains the timestamp of when the first sample was taken. The second line specifies what the sample period is. The last line contains the timestamp when the log file was closed. The remaining
lines have the following format:
Column A:
Column B:
Column C:
Sample ID #
Resistance Value
Reactance Value
Any values which the PEA has reported as being out of range ( > 16384 or < -16384) will be listed as
"N/A" in the log.
When logging has finished and the log file has been closed, it may be viewed with any text editor, (such
as Microsoft Notepad*) spreadsheet, (such as Microsoft Excel* or Corel’s Quattro Pro*) or any dataanalysis software package (gnuplot - free, Matlab - $$, etc.).
V.
Exiting From the Application
To exit from the data logger application, either click on the "X" button in the upper-right corner, or select
"Exit" from the "File" menu. *
Notepad, Excel, and Quattro Pro are not RJL Systems products. They are each Copyrighted by their
respective companies.
Palm Desktop and the Hot-Sync Manager are not products of RJL Systems. They are products of Palm,
Inc. and Copyrighted by Palm Inc.
-14-
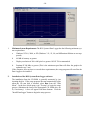
Transforming the PEA printer into a multichannel analog strip chart recorder
PEA Printer pixelizing 16 bit analog real time data
Calibrated amplitude
Applications include:
Time
Calibrated timing lines
1. Electrocardiography (ECG)
2. Plethysmography (IPG).
3. Reflective infrared pulse
timing with ECG.
4. Any event from milliseconds
to minutes as over lapping
multi−channel events.
4.0 inches
This image is an actual 4 channel recording from the PEA. The image is somewhat reduced
in quality because it had to be scanned in by an image scanner then reduced in size (some touch up).
There can be any number of channels with an arbitrary starting position and amplitude (signals can over lap).
-15-
Real time BIA manual
Technical description and applications
Electrical Cardiography (ECG)
Galvanic Skin Response (GSR)
Impedance Plethysmography (IPG)
The applications described in this section of the manual are for
investigational (research) purposes and have not been approved
by the FDA for commercial use.
advanced scientific applications
-16Physiological Event Analyzer (PEA) - Real Time BIA
The purpose of the PEA is to create a safe operating environment that displays and communicates
with different self contained sensory modules which measure and monitor physiological events in real
time including bioelectrical impedance analysis (BIA). The fundamental specification of the PEA is
multi-channel fast high resolution (16 bits) data acquisition sub-systems. This coupled to a powerful 16
MHz micro-controller with a real time clock and calendar, creates an extremely versatile instrument.
The micro-controller unit (MC68HC812A4) is a 16-bit device composed of standard on-chip
peripherals including external flash and Lithium battery powered RAM memory. The system is programmed entirely in the C programming language where run time objects are saved in 128KB of flash
memory and user data is saved in non-volatile ram (body composition patient records).
Sensory modules return analog signals with a full scale of ± 2.000 volts with excellent stability
and repeatability allowing full 16 bit conversion. The analog to digital conversion rate can exceed 100K
samples/second. However, the serial communications rate is limited to 38.4 KBaud/sec that reduces the
actual data transfer. At this rate two channels of 16 bit data has a maximum transfer rate of 2 milliseconds including saving samples to a local disc on a desk-top or lap-top. See manual on PEA Data Logger
software which is shipped with all PEA instruments.
The data acquisition module also contains dual programmable gain instrumentation amplifiers to
improve sensitivity and resolution.
The screen shot is the actual monitor of
the Pea Data Logger API. Two channels
are displayed with a sampling rate of 2
milliseconds (38.4 K baud/sec serial).
The "saw tooth" wave is 5 Hz signal on
channel 0. A constant voltage is on channel 1. The processor is a 700 MHz Pentium III with 33 percent of the CPU
speed being used. Running the same
application on a 2.5 GHz Pentium IV
reduces the CPU usage to 10 percent.
SPI Serial Peripheral Interface (4 Mhz)
128 K RAM memory
battery backup
SPI
interface
Micro Controller
MC68HC812A4
16 MHz
4K internal EEPROM
Port J (8 bit)
Port T (8 bit)
2 wire
2 wire
2 wire
2 wire
2 wire
SPI
SPI
SPI
SPI
SPI
16 bit
8 differential analog channels
16 bit analog to digital converter
200K samples/sec
1K internal RAM
8 channel
8 bit A to D
128 K Flash memory
512 K Flash memory
8 bit
Hardware
page
counter
Communications
RS232 − RS485
2500 VCD
RS232 isolation
Programmable
gain data
acquisition
sub−system
Four 50 pin modality connectors
Toroidal
transformer
12 VDC 800 MAHrs
+5 VDC
Digital
power sup
+
+5 VDC
−5 VDC
Analog
power sup
−
Serial port
38.4 K baud
Physiological Event Analyzer (PEA) Architecture
RJL
SYSTEMS
Battery
charger
White LED backlit
LCD display
4 lines by 20 characters
Real time clock
and calendar
blue characters on light
gray background
There are four 50 pin connector slots for expansion of new sensory modules (modalities). Each
modality slot is directly connected to any of
eight analog differential lines of the data acquisition sub-system (16 bits at 100K samples/sec).
Also, two 8 bit bi-directional micro-controller
data registers are connected to these slots for
further application development. This combination of a analog and digital bus structure makes
development of new sensory modules simple
and easy to implement. Modules currently in
development are ECG (electrocardiography),
GSR galvanic skin response and IPG
(impedance plethysmography).
120
240
VAC
4 Oct 2002
Date _____________
Dwg No. _________
PEA
Project ___________
PEA Architecuture
Title: ________________________________
R. J. Liedtke
Engineer: ____________________________
-17Instrument design - safety and resolution
Isolation - safety:
A safe electrical isolation barrier between the subject/patient and earth ground must exist, eliminating the possibility of electrical shock. A leakage current across this barrier from a possible 120 VAC
source should ideally be below 10 micro-amps, as defined by The Association for the Advancement of
Medical Instrumentation (AAMI). Without this isolation, a medical device can not be connected to computers or a recording device that are connected to a 120 VAC source (plug). Safety (electrical isolation)
of the PEA has been built into the entire instrument with 2500 volt isolation from the subject input to
external computers and the actual 120/240 volt line connection. This exceeds UL-544 and most CE
requirements. The main power supply operates from a step-down toroidal transformer with greater than
2500 volts of isolation.
In addition, the BIA sensory module is transformer-coupled at the subject interface and is tested
with a high-resistance Hi-Pot instrument (Hewlett Packard 4329A). An applied voltage of 1000 VDC is
placed between the subject and the analog ground for 2 minutes. The resistance recorded exceeds 10,000
Megohms at 1000 VDC, resulting in a leakage current of 0.1 micro-amps.
Resolution
The fundamental BIA specification is a direct linear measurement of resistance and reactance originating from zero at 50 KHz. In addition, the BIA modality has a high common mode rejection ratio at
the operating frequency where background noise is rejected or attenuated to virtually zero (a true reading of living biological substances). A direct analog output of simultaneous resistance and reactance
that can measure from 0 to 1000 ohms (± 1%) is available on channels 6 (resistance) and 7 (reactance).
The analog output signal must have an extremely high signal to noise ratio (SNR), or resolution,
because of the small signal changes that are due to the series/parallel effect of the physiological event.
The baseline resistance and reactance values may be 10,000 times larger than their respective changes.
Designing the instrument as a pure analog device will achieve the highest possible resolution. The BIA
modality is an analog circuit which can achieve a SNR of 10,000 to 1. With modest filtering, this ratio
can be improved to 100,000 to 1 and maintain excellent frequency response of the event (segmental
blood flow).
LCD display
The display is back-lit with four ultra bright white light emitting diodes (LEDS). This creates a
white-gray background that is contrasted with bright blue characters. Readability is excellent at any
viewing angle or ambient light level. The display is updated at a viewing rate that is comfortable to read
without any LCD flicker. The display can be reversed with a dark blue background and white characters,
as an option.
LCD display - paging
The LCD display can be paged by pressing the page up or page down buttons. There
are 10 LCD pages ranging from 0 to 9. Each page triggers a different response from
the micro-controller (unique information). Since the LCD display is limited to 4 lines,
paging allows the equivalent of 40 lines information to be displayed. See BIA modality LCD display. Paging also takes place with the keyboard scroll up and scroll down
keys (optional).
-18The BIA modality LCD display
LCD page 0 (series model)
The BIA modality is electrically identical to the
Quantum II and Quantum X instruments from RJL
Systems. The difference is the analog outputs are
filter with a 1 Hz second order active filter. This
eliminates the cardiac circulatory effect caused by
each heart beat. Without this filter the 0.1 resolution
would be unstable and difficult to read. The filtered
output is coupled directly to the 16 bit data acquisition sub-system for processing by the micro-controller then displayed on the LCD readout. All of
the bioelectrical values are illustrated on two LCD
pages. The BIA parameters are toggled by the front
panel paging buttons. These values are not related to
any anthropometric measurements including
weight, height and age The series equivalent model
of resistance and reactance is simultaneously read
directly by the BIA modality, all other information
is calculated from fundamental formulas of electrical engineering. All values except the Cap (Pf)
(parallel capacitance - picofarads) and Imp Indx
(impedance index) are expressed in Ohms.
Resistance :
Reactance :
Impedance :
Phase DG :
500.0
50.0
502.5
5.7
LCD page 1 (parallel model)
Par
Par
Cap
Imp
Res
Ract
(pF)
Indx
: 505.0
: 5050
: 630.6
: 1152
Blood flow (Digital subtraction modality - optional)
analog out
16 bit digital to analog converter
Copy right RJL Systems
2002
16 lines
(bits)
16 bit binary up−down counter
direction
gain X 100
analog comparators
−
unfiltered
−
+
BIA signal
+
synchronization
control
logic
hold
value
zero reference
4 Mhz clock
Digital subtracter X 2
simultaneous resistance and reactance
Delta resistance
and reactance
(blood flow)
The main BIA modality has optional blood flow modality
(second PC board) which increases the resolution from 0.1
Ohms to 0.01 Ohms, and decreases the subject maximum range
to 200 Ohms full scale. The subject 50 Khz detection signal is
multiplied by 10.0 with a 50 Khz resonant circuit, thereby,
reducing background noise because of the narrow bandwidth of
the tuned amplifier. When the tuned BIA modality is interfaced
to a separate 16-bit digital-to-analog subtracter, the base line
resistance and reactance signals are eliminated leaving only
their calibrated changes with respect to time. The high signalto-noise ratio of the tuned BIA detector and the digital subtracter will create a real time plethysmograph that can quantify
resistance and reactance changes due to blood flow.
Specifications: BIA modality
Isolation barrier
Nominal:
Constant current accuracy
Nominal:
Regulation:
Range:
Resistance accuracy
Nominal:
10,000 Megohm at 1000 VDC
subject leads to analog ground
425 microamp at 50 Khz ± 1 %
better than 0.1 %
0 to 10,000 Ohms, resistive or capacitive
1.0 Ohm
Reactance accuracy
-190 to 1000 Ohms
0.1 Ohm
1.0 Ohm
0 to 1000 Ohms
0.1 Ohm
Range:
Resolution:
Nominal:
Range:
Resolution:
(Blood flow 200 Ohms)
(Blood flow 0.01 Ohm)
(Blood flow 200 Ohms)
(Blood flow 0.01 Ohm)
Rear connector
Located on the back panel of the PEA is a 50 pin male SCSI connector. This connecter has all 8
differential analog channels and various digital registers available (optional). Therefore, the signals generated from the PEA modalities can be read by external data acquisition systems (pin compatible to the
National Instruments PCMCIA data acquisition system). In addition external instruments which have
analog outputs can be connected to any unused analog channels of the PEA. This creates a highly integrated instrumentation environment inclusive of PEA modalities. The micro controller digital I/O registers can be used for BIA electrode switching and scanning for impedance (resistance and reactance)
tomography and multiple segmental observations when specially configured by an application request.
Note: Pins not specified are open and can
be connected to digital signals upon request.
49 47 45 43 41 39 37 35 33 31 29 27 25 23 21 19 17 15 13 11
9
7
5
3
1
50 48 46 44 42 40 38 36 34 32 30 28 26 24 22 20 18 16 14 12 10
8
6
4
2
1.000 volts = 1000.0 ohms
Analog common
Analog channel 0 −
Analog channel 1 −
Analog channel 2 −
Analog channel 3 −
Analog channel 4 −
Analog channel 5 −
Analog channel 6 −
Analog channel 7 −
Channel 6 BIA Resistance
Channel 7 BIA Reactance
National instruments compatible
Digital
common
Analog common
Analog channel 0 +
Analog channel 1 +
Analog channel 2 +
Analog channel 3 +
Analog channel 4 +
Analog channel 5 +
Analog channel 6 +
Analog channel 7 +
100 ohms
Differential analog channels
on modality buss
Bus expansion − Monitor rear SCSI connector
Serial communications
Located on the rear panel is a 9 pin RS-232 compatible serial connection to a local PC or workstation. Communication rates are at 38,400 bits/sec or higher. Programmed within the memory of the
micro-controller is a "serial command interpreter" where specific simple requests are sent to the PEA for
analysis. Once a request is sent, the PEA will immediately send the appropriate information back to the
caller (PC or workstation). All internal PEA data are stored as signed 16 bit words. The data word is
delivered back to the caller in a communication wrapper requiring three (3) bytes to complete the transfer of the 16 bit word. There are no control or escape characters transferred to the caller, therefore, most
-20software communication protocols (XON, XOFF) will work reliably. Considering a baud rate of 38.4
KBaud, a 16 bit word requires 781 micro seconds for a complete transfer. Real time data that requires
faster sampling can be saved in the micro-controllers 128K (512K optional) battery backed RAM for
later transfer to the caller as a special request.
Cyprus is fully compatible with this protocol allowing resistance and reactance values to be read
directly into the Cyprus program to 0.1 ohms. In addition, data logging software is also available that
can set sampling rates from milliseconds to days. The PEA is insensitive to its ambient temperature
allowing it to be used in outdoor winter and summer outdoor conditions. Each PEA is tested (run) in an
environment chamber with temperature extremes of -20 to 60 Celsius before shipment.
PEA modalities under development
The following list is just a sample of the information which can be collected by the PEA with the
proper modality boards installed:
•
Real time bioelectrical impedance analysis (Impedance Plethysmography). Quantitative blood flow
on virtually any segment of the human or animal body.
•
Electrical Impedance Tomography (resistance and reactance)
•
Electro-cardiograph (ECG)
•
Galvanic Skin response (GSR)
•
Infrared peripheral blood flow (skin and wound blood flow)
•
Blood pressure and volume monitoring from inflated cuffs
Regulatory
The applications described in this manuscript are for investigational (research) purposes and have
not been approved by the FDA for commercial use. The RJL Systems Quantum series of instruments
have been approved for use as body composition analyzers only. However, they may be used for other
applications as investigational devices. RJL Systems welcomes the mutual collaboration of commercial
and/or academic organizations to further the advancement of BIA sciences that may lead to patents and
FDA approval of new specific applications using real-time BIA. The Quantum and PEA series of instruments have been submitted to US and world patent offices.
-21PEA Communication Protocol
Implementation 1.1
Page Assignments (applications)
The PEA has ten screen pages, which can be selected via the "page up" and "page down" buttons on the
front panel. At present, the pages are arranged as follows:
Page
0
1
2
3
4-7
8
9
Purpose
Serial Resistance, Serial Reactance, Impedance, and Phase Angle
Parallel Resistance, Parallel Reactance, Capacitance, and Impedance Index
Real time data logger message display
Body Composition Analysis
Currently Unused
Display and set current time and Date.
Unit Health. This page displays the voltages of the three main power supplies
and the internal temperature (F). Also, modify configuration options.
Analog Channels
8 - bit
(Unsigned. Values range from 0 - 255)
Channel
0
1
2
3
4
5-7
Value
Voltage on the -5V
Analog Power supply
Voltage on the +5V
Digital Power supply
Voltage on the +5V
Analog Power supply
Temperature (Fahrenheit)
Subject Connected detection
Currently unused
Scale
approx 0.0385 V / Division
approx 0.0385 V / Division
approx 0.0385 V / Division
approx 0.65 Degrees / Division
Subject connected if value > 50
16 - bit
(Signed. Values range from -32768 to 32767)
Channel
0-5
6
7
Value
Currently Unused
Resistance
Reactance
Scale
0.1 Ohm / Division
0.1 Ohm / Division
-22Serial Settings
Version 1.1 of the PEA requires the following settings on the host serial port:
38400 bps
8 data bits
NO parity
1 stop bit
NO flow control *
*The PEA does understand XON and XOFF (software flow control) characters and does not send them.
A host computer may communicate with the PEA using a specially designed software, such as the RJL
Systems Data Logger, or, for testing purposes, any terminal program, such as Kermit or Hyper Terminal.
Number Transmission
PEA - to - Host : Integer Encoding ( 3-byte code )
Ideally, in the interest of rapid communication, the PEA would transmit raw, binary data to the host
computer. However, doing so would bring the possibility of sending XON and XOFF characters as part
of the data. Therefore, the data must go through a form of encoding before transmission.
In this encoding scheme, a 16 bit value to be transmitted is broken into three segments - the low 5 bits,
the middle 6 bits, and the high 5 bits. (On the PEA, integers are 16 bits long, and the PEA’s processor is
a big-endian device.) Decimal 32 (a space character) is added to each of these segments, and they are
transmitted in that order (low, middle, high)
For example, the integer 15763 ( 00111 101100 10011 in binary ) would be transmitted as [ 3L’ ]
An 8 bit value is normally treated as a 16 bit value where the top 8 bits are 0.
Note that SHRT_MAX ( 32767 - 01111 111111 11111 in binary ) is a special value intended, under normal circumstances, to represent a value "OUT OF RANGE"
Host - to - PEA : ASCII Strings
For simplicity sake, since the vast majority of traffic will be from the PEA to the host computer, any
numbers transmitted to the PEA by the host will be sent as ASCII strings.
Conversation
Any message that consists of just a single character will be enclosed in single quotes. (’ ’)
If the message is a multi-byte string, it will be enclosed in double quotes. (" ")
For the remainder of this document, the following conventions will be used to represent certain special
characters:
Escaped
\t
\r
Character
decimal (hex)
9 (0x09)
13 (0x0D)
Character Code
Name
Tab
Carriage Return
-23Protocol Detection
Message
"V\r"
"v\r"
Meaning
Protocol version detection.
When the PEA receives either of these strings, it responds with a string identifying the version of the protocol implemented. For version 1.1 of the PEA protocol,
this response string will be "PEA11\r".
Front Panel Management
Message
">0\r" ... ">9\r"
"<text\r"
’{’
’}’
Meaning
Go to the specified page. The LED page indicator is updated, and the
information associated with that page number is displayed on the LCD.
No data is returned to the host.
Go to page 2 and display the message text (everything between ’<’ and
’\r’) on the LCD. For easy formatting, it is recommended that the message
text be 40 characters or less. No data is returned to the host.
Lock the front panel. This command changes to page 2, displays a
"Please Wait" message, and locks the page up and page down buttons.
This is especially useful in higher data rate logging applications, to prevent updating the LCD from taking valuable time away from data logging
and processing. No data is returned to the host.
Unlock the front panel. This command changes to page 2, displays a
"Logging Finished" message, and unlocks the page up and page down buttons. If the PEA is still in the process of taking samples, this command
also stops logging. No data is returned to the host.
Instantaneous Value Detection
These commands return the current value detected on the specified Analog channel. No storing or logging of the data is performed. Upon receiving one of these commands, the PEA will return a 3-byte
encoded integer. (See above.) To determine the actual value, decode the integer, and multiply by the
appropriate scale factor. (See Analog Channels tables.)
Message
’a’
’b’
’c’
’d’
’e’
’f ’
’g’
’h’
Meaning
Get value from 8-bit channel 0
Get value from 8-bit channel 1
Get value from 8-bit channel 2
Get value from 8-bit channel 3
Get value from 8-bit channel 4
Get value from 8-bit channel 5
Get value from 8-bit channel 6
Get value from 8-bit channel 7
Message
’A’
’B’
’C’
’D’
’E’
’F’
’G’
’H’
Meaning
Get value from 16-bit channel 0
Get value from 16-bit channel 1
Get value from 16-bit channel 2
Get value from 16-bit channel 3
Get value from 16-bit channel 4
Get value from 16-bit channel 5
Get value from 16-bit channel 6
Get value from 16-bit channel 7
-24Log Management
The PEA uses an 8-bit mask to determine which channels are to be logged when it comes time to take a
sample. The default log mask is 192, (binary 00000000 11000000) which instructs the PEA to log Resistance and Reactance values only.
To Select
Set bit #
Default mask
Bytes trans
7
15
0
2
6
14
0
2
8-bit channel
5
4
3
13 12 11
0
0
0
2
2
2
2
10
0
2
1
9
0
2
0
8
0
2
7
7
1
3
16-bit channel
6
5
4
3
6
5
4
3
1
0
0
0
3
3
3
3
2
2
0
3
1
1
0
3
0
0
0
3
To determine the total number of bytes required to transmit a complete sample, add the number of bytes
required to transmit each individual channel selected, plus one. The one extra byte is to accommodate
the delimiting ’\r’, which begins each sample.
When a logged sample is transmitted to the host computer, the delimiter ’\r’ is sent first, then each
selected channel in ascending order. For example, a total of seven bytes, one for the beginning delimiter,
then three for Resistance, and finally, three for Reactance, are required to transmit the default sample.
Notice the difference in the number of bytes required to transmit an 8-bit channel versus a 16-bit one.
Because log samples are most commonly transmitted while the logging is in progress so they can be
plotted on a graph in real time, the high byte (which will always be ’ ’) is eliminated in the interest of
reducing transmission time.
-25Message
"ˆnumber\r"
’&’
’#’
"˜number\r"
"!number\r"
"!0\r"
".number\r"
’@’
’$’
’%’
Meaning
Set the log mask on the PEA to the specified number. No data is returned to
the host.
Retrieve the current log mask. The value is returned to the host in 3-byte code.
Clear the log from memory. Before beginning to take samples, send this command to clear the old log from the PEA and start a new one.
Set the logging interval to number x 1.024 milliseconds. The PEA will then
calculate the amount of time required to transmit a complete sample. If the logging interval is greater than the amount of time required to transmit the coded
sample, the string "number\r" is returned to the host. If, on the other hand, the
interval is shorter than the amount of time required to transmit, the minimum
value to support real-time transmission of values is returned instead of the actual
logging interval. Note that since the PEA does not measure time in exact milliseconds, you may wish to divide your desired sample interval by 1.024 before
sending it to the PEA (round to the nearest integer) Valid values for number range
from 1 to 4294967295. ( 50.9 days )
Begin logging, and "batch" the samples. Samples are stored on the PEA for
later retrieval by the host. By "batching" the log in this manner, it is possible to
take samples faster than they can be transmitted. Once number samples have been
taken or the PEA’s storage memory has been filled, the PEA stops logging data,
and transmits the string "\t\t\t" to the host as a signal that it is done. Setting number to -1 indicates that the PEA is to take samples forever, or until the PEA’s
memory is full, or logging has been ended by the host. Valid values for number
range from -1 to 2147783647.
Stop logging. This is actually a special case of the above command, and can be
interpreted as "Take zero more samples, and then stop." The PEA sends the string
"\t\t\t" to the host in acknowledgment.
Begin logging, and "stream" the samples. Take number samples, and transmit
them to the host as they are taken. The data is not stored locally on the PEA.
When the PEA receives this command, the specified logging interval is compared
against the amount of time required to transmit a sample at the current communications rate. If the logging interval is less than the amount of time required to
transmit a sample, it is automatically increased to the minimum value required to
accommodate real-time transmission of the data. Samples are then transmitted to
the host as they are taken. Stop logging by sending the string "!0\r" to the PEA.
Valid values for number range from -1 to 2147783647.
Go to the beginning of the log. If a log has been "batched" on the PEA, when
you are ready to begin reading the sampled data from the unit, send this character.
No data is returned to the host.
Get next sample. The next sample in the log is transmitted to the host. If there
are no more samples left in the log (at the end) the string "\t\t\t" is sent to the host.
Retransmit previous sample. In the event of a communications error or a serial
timeout, send this command to retransmit the previous sample.
-26Time Management
The PEA contains an RTC (Real Time Clock and calendar) chip. This section details the commands for
setting and retrieving values from the RTC. A command to retrieve a value will begin with a lowercase
’t’. A command to set a value will begin with an uppercase ’T’. Values are identified as follows:
Identifier
h
m
s
M
D
Y
Value
Hour
Minute
Second
Month
Day
Year
Range
0-23
0-59
0-59
1-12
1-31
0-9999
Command to Retrieve
"th"
"tm"
"ts"
"tM"
"tD"
"tY"
Command to Set
"Thnumber\r"
"Tmnumber\r"
"Tsnumber\r"
"TMnumber\r"
"TDnumber\r"
"TYnumber\r"
To retrieve a value, the entire command message will be two (2) characters long - the command ’t’, and
the identifier to retrieve. ("tm" will retrieve the present Minute)
The command to set a value must be terminated by a carriage return. (’\r’) The message will begin with
the command ’T’, next will be the identifier to set, followed by the value in plain ASCII, and the carriage return. ("Tm53\r" will set the value for Minute to 53)
Patient Record Manipulation
In addition to serving as a data-logging device, the PEA can also be used as a stand-alone body-composition analyzer. Entered patient records are stored in battery-backed RAM for output to a host computer
at a later date. Because they are retained after shutdown, patient records take precedence over batched
data samples. However, since data samples are stored at the beginning of the RAM, while Patient records
go at the end, this situation should arise only if large numbers of batched samples are stored AND a
large number of patient records are stored.
Message
’Z’
Meaning
Transmit current (most recent) patient record. This causes
the most recent record to be transmitted in plain ASCII,
with carriage returns (’\r’) separating the individual fields.
Fields will be ordered as in the adjacent table.
’X’
Record Information
First Name
Last Name
Subject ID
Flags (Bitfield)
bit 0 - 0 = in 1 = cm
In the event that this command is received when there are bit 1 - 0 = lb 1 = kg
no remaining stored records in memory, an empty record is
Gender (0 = Male / 1 = Female)
transmitted. (11 consecutive carriage-returns)
Age
Resistance
Reactance
Height
Weight
Desired Weight
Remove current (most recent) record from memory. The
most recent record is deleted from memory, making the
previous record the most recent.
-27-