1
US008219975B2
(12) Unlted States Patent
(10) Patent No.:
Goossen et al.
US 8,219,975 B2
(45) Date of Patent:
(54)
REAL-TIME
DATA OF A VIDEO
ANALYSIS
GAME
OF PERFORMANCE
(75)
Inventors: Andrew Goossen, lssaquah, WA (US);
Parham Mohadjer, Redmond, WA
.
-
Jul. 10, 2012
7,506,305
,
,
B2 *
3/2009 JAIIhiTeWS
Cornelius
0 s et aitet
. a1~
......
al. ~~~~~~~~~~~~
..
~~ 717/113
7,533,371 B1*
5/2009
7,950,004 132*
50011 Vieim et a1‘
717/125
2003/0046663 A1 *
3/2003 Rogers et al. ..
717/125
2004/0034847 A1*
2/2004
Johns et al. ...... ..
Joffrain et al.
(5?)’ 242ml}?
K113153111’
8.62mi}6‘(YA
(
0 ‘1 "War
a evlc ’
ma’
2004/0107415 A1 * 6/2004
Melamed et al. ..
2005/0071818 A1
3/2005 Reissman et al. ..
WA (US); Juan Carlos Arevalo BaeZa,
2005/0081104
Bellevues
2006/0253739 A1
11/2006 Godefroid et al. .
2006/0281535
12/2006
Jason Matthew
'
'
.
souls’ yoodglmggllz’ WSA_(I§IS.)’hM2l'ttheW
A1*
A1
2007/0038977 A1 *
“a 6 mom a
(U )’
1° “6
Burrows, sammamlsh, WA (Us); Karen
2007/0040939 A1
2007/0082741 A1
Elaine Stevens, Woodinville, WA (US);
David Aronson, Austin, TX (US)
4/2005
717/130
Nikolik . . . . . . . . . . . . . .
Bogan
. . . . . . . . . . . . . . . .
2/2007 Savage ......... ..
717/113
..
717/124
717/127
. . . ..
714/38
. . . ..
463/23
714/38
717/106
2/2007 Anderson et al.
348/500
4/2007 Xu ................................ .. 463/43
OTHER PUBLICATIONS
_
J C Yan et al.,AnalyZing parallel program performance using normal
(73)
Asslgnee: Microsoft Corporation, Redmond, WA
(US)
(*)
Notice:
iZed performance indices and trace transformation techniques; Par
allel Computing, 1996iElsevier; pp. 1215-1237.*
JK Hollingsworth et al., Dynamic program instrumentation for scal
Subject to any disclaimer, the term of this
patent is extended Or adjusted under 35
U S C 154(1)) b 1151 da S
'
'
'
y
able performance {0018; l994*ieeeXp10reieeQ0fg; PP~ 1-l0~*
Bowdidge, R.W., “Refactoring gcc Using Structure Field Access
Traces and Concept Analysis”, Workshop on Dynamic Analysis,
y '
2005, 1-7, http://delivery.acm.org.
_
Nimmer, J .W. et al., “Automatic Generation of Program Speci?ca
(21) Appl. No.. 11/925,226
(22) Filed:
Hons», ACM, 2002, 229239‘
Oct. 26, 2007
(65)
(Continued)
Prior Publication Data
Primary Examiner * Wei Zhen
US
ASS/Sid”! Examiner i $811511 Rampuria
(74) Attorney, Agent, or Firm * Woodcock Washburn LLP
(51)
(52)
(58)
Int. Cl.
G06F 9/44
(2006.01)
(57)
ABSTRACT
US. Cl. ......... .. 717/122; 717/127; 717/131; 714/46
Field of Classi?cation Search ........ .. 717/ 1244135;
Amethod foranalyzing theperformance ofa video game uses
a diagnostic tool that is associated With application code of
345/506, 639
See application ?le for complete search history.
the video game. The diagnostic tool is activated When the
video game is in operation, and real-time performance data is
captured and displayed. A Warning is generated When a per
(56)
References Cited
formance metric violates a pre-set condition. The Warning
may be displayed on a display screen that is used to provide
U.S. PATENT DOCUMENTS
5,522,036 A
6,381,604 B1*
information for rectifying the violation.
5/1996 Shapiro .................. .. 395/18314
4/2002 Caughran et al. ................... .. 1/1
12 Claims, 12 Drawing Sheets
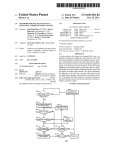
associate a diagnostics tool with
application code of a video game
V
activate the diagnostic tool when
the video game is in operation
V
9.1.5
capture and display real-time performance data
associated with executio n ofthe application code
generate a warning when a performance
metric violates a pre-set condition
US 8,219,975 B2
Page 2
OTHER PUBLICATIONS
Industry Training, Simulation, and Education Conference, 2005, 10
,h
://amm..
Verdesca, M. et al., “Using Graphics Processor Units to Accelerate
pages
ttp g
OneSAF: A Case Study in Technology Transition”, Interservice/
* Cited by examiner
.d.
a CS unc e u
US. Patent
Jul. 10, 2012
Sheet 1 0f 12
100
US 8,219,975 B2
Count
Frame sequence
E
System Monitor
102
91
_ _ _ _ _ ___\
80
120
f‘
I____________
\121
70
59
110
48
<1
37
26
16
_5
5
.
.
.
.
. . . . . . .
.
.
.
. . . . . .
.
.
.
.
. . . . .I
. . . . . .
.
Counter
Frames
.
.
. . .
P
W
.
.
.
.
.
.
.
.
.
.
.
.
.
.
.
.
.
.
.
.
.
.
Seal
Min.
1
.
2
1
.
24.
1
.
1
r second
F
.
t
e
.
.
.
.
.
.
..
Max.
Dr. PIX Monitor
115
Warning
Priority
Count
Last Frame 4’
Too many D3D locks
1
8
326
Too many debug prints
2
200
433
Too long a frame
2
6
248
Frame Range IE
to
\1 17
\El
\116
FIGURE 1
US. Patent
Jul. 10, 2012
Sheet 2 0f 12
100\
US 8,219,975 B2
Count
L) Frame sequence
E
System Monitor
102
_
_
_
_
f‘ 120
_
_
_
91
_
_
_
_
_
_
_
_
_
_
_
“i i
80
70
59
110
48
e
26
37
16
_5
"
....................................................................... ..
Counter
Scal
Min.
1
.
Max.
r
P
W
e
24.
1
Dr. PIX Monitor
115
Warning
Too many D3D locks
Too many debug prints
Too long a frame
Frame Range |
245
Priority
1
2
2
|
to
\117
|
Count
8
200
6
442
Last Frame 4’
326
433
248
|
\116
FIGURE 2
US. Patent
Jul. 10, 2012
Sheet 3 0f 12
US 8,219,975 B2
31,31
Dr. PIX Monitor
55/
Warning
4/
Pri
Too many D3D locks
Too many debug prints
Too long a frame
Frame Range |
245
Save
‘I
Last Frame 4/
1 Time Mode
2uu
2
6
|
to
|
442
115
326
433
248
|
410
425
430
/
Warnings
/
\
l
Visible
415
x
Invisible
A
A
Too many D3D locks
GPU starved for data
Too many debug prints '-
Warning
-
Too long a frame
Warning
V
IE
420
\435
v
/III
I
FIGURE 4A
44°
US. Patent
Jul. 10, 2012
Sheet 4 0f 12
.
brae
US 8,219,975 B2
.
ut of memory
‘ : CPL! frame time too long
“ha-Ma: aL'
: CPLl'frame way tad long
: M are than half at the secondary ring butler w
:
I The GF'LI starved ldr data
7
I The GF'U starvedwhile waiting tar the CPU tdj Zf
: The primary ring buffer became lull
3 ‘3
: The secondary ring buffer became lull
I Y‘
I Tiling was used witheutenaljling [33D CHEAT
.
' ‘ : Tee many callback interrupts
: Tap many [33D physical allocations
:‘ Tea many L’llErW r’-‘-.F'l calls
: Tea many GF'U kick-Ulla
'
: Tad many ahader patches
' T
'
.
b 5
n‘srumed in B3B resource
The data transfer buffer was filled faster than it could be flushed resulting in ldstdata. If the applicatidns-t'ramerata is
gher than BlIIHz it will help to lack it to BDHz.
Pridrity '3- ' ‘$551512
FIGURE 4B
US. Patent
Jul. 10, 2012
Sheet 5 0f 12
US 8,219,975 B2
D3D: Too many draw API calls
Priority 1 Condition
D3D.DrawApiCalls > 10000
Priority 2 Condition
D3D.DrawApiCalls > 6000
Priority 3 Condition
D3D.DrawApiCalls > 3000
Test
Output
Priority 1 Condition
Compile Complete — 0 errors
Priority 2 Condition
Compile Complete — 0 errors
Priority 3 Condition
Compile Complete — 0 errors
OK
FIGURE 4C
Cancel
US. Patent
Jul. 10, 2012
Sheet 6 0f 12
Dr. PIX Monitor
US 8,219,975 B2
Warnings
Warning
Pri
Save
115
Last Frame /
Too many D3D locks
Too many debug prints
1 %5§gf
2
LWA
326
433
Too long a frame
2
248
Frame Range @
6
to
@
FIGURE 5
Dr. PIX Monitor
I
Warning
Too many D3D locks
|—.
Warnmgs
Prl
1
Too many debug prints
2;?
Too long a frame
2
Time Range
1.03
FIGURE 6
Save
gig?
Last Frame
326
2%
433
6
to
248
20$
615
4-/
US. Patent
Jul. 10, 2012
Sheet 7 0f 12
US 8,219,975 B2
100
1_5
System Monitor
102
91
—
_
_
_
_
_
_
_\
[-
_
_
_
_
_
_
_
_
_
_
_
80
70
59
110
48
V
26
37
16
_5
: " '.
. . . . . . . . . . . . . . . . . . . . . . . . . . . . .Z
: ';
I . . . . . . . . . .J
710 —>
z . . . . . . . . . . . . . . . . . . . . . . . . . . . . ..
<— 715
Scal
Min.
Max.
Dr. PIX Monitor
115
Warning
Priority
Count
Last Frame
1
8
326
Too many debug prints
2
200
433
Too long a frame
2
6
248
to
442
Frame Range
245—
FIGURE 7A
*
US. Patent
Jul. 10, 2012
Sheet 9 0f 12
US 8,219,975 B2
810
Too many D3D locks
Description
The game has too many D3D
locks happening for this frame
A
825
-
You should not do so many on
4/
this frame
_
v
(I
l I)
Condition
A
D3DLocks > 100
830
I 4/
V
(I
\ 820
l |>
\ 815
\\ 835
FIGURE 8
\\ 840
US. Patent
Jul. 10, 2012
Sheet 10 0f 12
US 8,219,975 B2
%
associate a diagnostics tool with
application code of a video game
m
activate the diagnostic tool when
the video game is in operation
%
capture and display real-time performance data
associated with execution of the application code
920
generate a warning when a performance
metric violates a pre-set condition
FIGURE 9
US. Patent
Jul. 10, 2012
Sheet 12 0f 12
US 8,219,975 B2
26305
mm“
MI‘ED-GE
EoSQwEnO
w1892%
US 8,219,975 B2
1
2
REAL-TIME ANALYSIS OF PERFORMANCE
DATA OF A VIDEO GAME
hoWever, real-time analysis of performance data of a video
game is not limited to the speci?c methods and instrumen
talities disclosed.
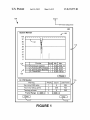
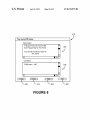
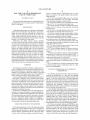
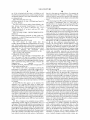
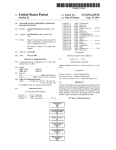
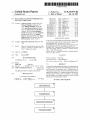
FIG. 1 shoWs an exemplary display screen of a system for
TECHNICAL FIELD
analyZing the performance of a video game, the display
screen including a diagnostics display WindoW.
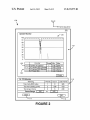
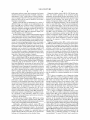
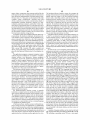
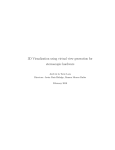
FIG. 2 shoWs an exemplary vieW of the diagnostics display
WindoW of FIG. 1, in one operational display mode.
The technical ?eldrelates generally to gaming applications
and speci?cally relates to real-time analysis of performance
data of a video game.
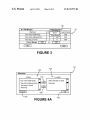
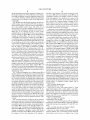
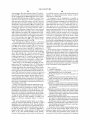
FIG. 3 shoWs a drop-doWn menu on the diagnostics display
BACKGROUND
WindoW of FIG. 2 With one of the menu items shoWing an
activation status.
Analyzing the performance of a video game is traditionally
carried out by collecting data When the game is in operation,
halting the game, and then analyZing the collected data
FIG. 4A shoWs a Wamings display WindoW that is a result
of the activation on the drop-doWn menu of FIG. 3.
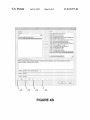
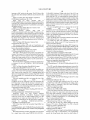
FIG. 4B shoWs another example Warning display WindoW.
FIG. 4C shoWs another example Warning display WindoW
o?lline. As can be appreciated, this procedure is often a hit
or-miss affair because the captured data may or may not
contain information pertaining to an intermittently-occurring
Wherein a user can generate a tailored Warning.
FIG. 5 shoWs an activation status on a second menu item of
problem or to a problem of a subtle nature.
the drop-doWn menu of the diagnostics display WindoW.
Furthermore, the of?ine analysis process generally
involves a collective effort from a team of softWare develop
ers each having an individual area of expertise. For example,
in such a team, a ?rst developer may be an expert on system
libraries, a second on databases, and a third on the correct
sequence of coding events that need to occur for successful
operation of a particular video game. This type of team com
20
menu item as shoWn in FIG. 5.
FIG. 7A shoWs a selection status carried out upon one of
the items in the diagnostics display WindoW.
FIG. 7B shoWs another example of a selection status car
25
position is necessary because traditional analysis and debug
ging tools often generate cues (such as esoteric and cryptic
Warning/ failure messages) that only an expert can under
stand. Consequently, this environment does not readily
accommodate debugging efforts being carried out by a one
person team When this person has a generaliZed knowledge of
30
game.
FIG. 11 is a depiction of a suitable computing environment
35
in Which real-time analysis of performance data of a video
game can be implemented.
DETAILED DESCRIPTION OF ILLUSTRATIVE
EMBODIMENTS
40
The folloWing description provides details pertaining to
features of the claimed subject matter, nor is it intended to be
used to limit the scope of the claimed subject matter.
analyZing the performance of a video game by capturing
real-time performance data and generating, during this data
In one exemplary method for analyZing the performance of
a video game, a diagnostic tool is associated With at least
some portion of an application code that is used to execute the
analyZing the performance of a video game.
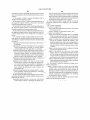
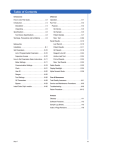
FIG. 10 is a diagram of an exemplary processor for imple
menting real-time analysis of performance data of a video
This Summary is provided to introduce a selection of con
cepts in a simpli?ed form that are further described beloW in
the Detailed Description of Illustrative Embodiments. This
Summary is not intended to identify key features or essential
ried out upon one of the items in the diagnostics display
WindoW.
FIG. 8 shoWs a description WindoW containing information
pertaining to the item that Was selected as shoWn in FIG. 7.
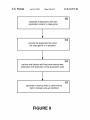
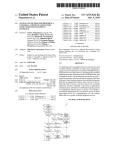
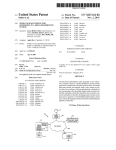
FIG. 9 shoWs a How chart of an exemplary method for
gaming and/or softWare, or even When this person is an expert
in just one particular area of gaming and/or softWare.
SUMMARY
FIG. 6 shoWs a vieW of the Warnings display WindoW With
a time range indicator display in response to activation of the
45
capture, a real -time warning when a monitored parameter
falls outside a pre-determined threshold. Consequently, per
video game. The diagnostic tool is activated When the video
game is in operation, and real-time performance data is cap
formance issues that may be of an intermittent nature or not
detectable in a non-real-time analysis process are uncovered.
tured and displayed. A Warning is generated When a perfor
Furthermore, upon obtaining a Warning, a developer can
obtain further particulars of the Warning and a recommenda
tion for carrying out remedial action.
mance metric violates a pre-set condition. The Warning may
be displayed on a display screen that is used to provide infor
50
mation for rectifying the violation.
Furthermore, an exemplary system for analyzing the per
In one exemplary embodiment, the Warning is provided in
the form of a diagnostics display WindoW containing Warning
formance of a video game includes a computer-readable stor
labels. Each of the Warning labels is con?gured as a soft-key
that may be activated to display a pointer icon that points to a
particular frame in a sequence of frames that is displayed in a
graphical format in a system monitor WindoW. When the
age medium on Which is stored a diagnostic tool for capturing
real-time performance data When the video game is in opera
tion. The system further includes a display unit con?gured to
55
provide a diagnostics display WindoW for displaying a
description and data statistics of a performance metric viola
tion associated With the real-time performance data.
60
BRIEF DESCRIPTION OF THE DRAWINGS
Warning label is further activated, by double-clicking on it for
example, a description WindoW appears. The description Win
doW provides details of the Warning and also provides a
recommended course of action for rectifying the problem.
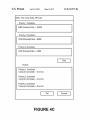
FIG. 1 shoWs an exemplary display screen 105 that is a part
of a performance analyZer system 100 for analyZing the per
The foregoing summary, as Well as the folloWing detailed
description, is better understood When read in conjunction
With the appended draWings. For the purpose of illustrating
65
formance of a video game. Performance analyZer system 100
has been branded as “Dr. PIX” by Microsoft® and it Will be
understood that any use of the term Dr. PIX, herein in this
real-time analysis of performance data of a video game, there
document, is being merely being done for purposes of con
is shoWn in the draWings exemplary constructions thereof;
venience. Other trade names may be altematively applied to a
US 8,2l9,975 B2
4
3
performance analyzer system that incorporates the features
Diagnostics display WindoW 115 (Dr. PIX Monitor) pro
described herein in this document. Similarly, reference is
vides data statistics pertaining to the monitored gaming
made herein to “D3D,” Which refers to a Microsoft develop
ment tool named “Direct3D.” This tool is generally knoWn to
persons of skill in this art, and Will, therefore, not be elabo
rated upon in much detail.
Display screen 105 may be implemented in a variety of
different formats. For example, in one implementation, dis
parameters, and speci?cally provides data related to one or
more monitored parameters that fall outside a pre-determined
threshold. In the exemplary vieW shoWn in FIG. 1, a ?rst
column of diagnostics display WindoW 115 lists Warnings
related to the monitored parameters. The ?rst Warning indi
cates “too many D3D locks,” While the second Warning indi
cates “too many debug prints.” The second column of diag
nostics display WindoW 115 lists the priority level of each of
the Warnings of column 1. The priority levels may be pre
determined by a manufacturer of performance analyZer sys
play screen 105 uses a WindoWs format in accordance With
Microsoft WindoWs®. HoWever, in other implementations,
other types of displays and display formats may be used. The
exemplary display screen 105 of FIG. 1 shoWs a system
monitor display WindoW 110 and a diagnostics display Win
doW 115 (labeled as Dr. PIX Monitor).
System monitor display WindoW 110, hereinafter referred
to as system monitor 110, provides a graphical display 120 of
gaming performance in terms of data statistics captured over
a sequence of video gaming frames. In one example, the data
statistics is a count value pertaining to the number of occur
rences of a monitored gaming parameter such as, for example,
D3D locks. Consequently, the number of D3D locks occur
tem 100, or may be selectably set by a game developer or
other user of performance analyZer system 100. The third
column of diagnostics display WindoW 115 lists the count
value for each of the Warnings of column 1, While the fourth
column provides frame information of Where the Warning
occurred in the sequence of frames displayed in graphical
display 120.
20
Diagnostics display WindoW 115, as Well as system moni
tor 110 may include soft-keys for carrying out various opera
ring on a real-time frame-by-frame basis can be seen in sys
tions such as, for example, Pause, Stop, Print, Store, Ignore,
tem monitor 110. It Will be understood that various gaming
parameters can be selected for monitoring, together With
Hide, Edit, and Clear. While the functionality of some of these
soft-keys is self-evident, it may be pertinent to point out
certain features in some others. The Save key (not shoWn) is
used to save the Warnings in a database or ?le; the Ignore key
selectable priority levels and other performance metrics. A
feW non-exhaustive examples of gaming parameters include:
redundant states, number of thread sWitches in a kernel, sleep
time, ratio of bytes read to number of requests.
BeloW the graphics display 120 of monitor display WindoW
110, is a tabular display 125 that provides numerical infor
25
(not shoWn) is used to selectively ignore certain Warnings; the
Hide key (not shoWn) is used to hide diagnostics display
WindoW 115; the Edit key (not shoWn) to edit the Warning
30
conditions so as to make them visible or invisible; and the
mation pertaining to the various graphs displayed in graphical
display 120. The ?rst column of tabular display 125 identi?es
Clear key (soft-key 117) is used to clear the contents of
a particular graph. In the illustration of FIG. 1, the graphs
have been identi?ed by various types of lines such as solid,
dashed and dotted lines. HoWever, this format has been uti
liZed merely for ease of description. In a practical set-up, each
of the graphs may be identi?ed by a unique color and each of
the colors is identi?ed in the ?rst column of tabular display
125. For example, graph 121 (Which is identi?ed in FIG. 1
using a solid line), may be identi?ed by a red color and cell
126 of the ?rst column of tabular display 125 Wouldbe shaded
Will be described beloW in further detail.
diagnostics display Window 115. The Stop key (soft-key 116)
35
Ways. For example, a cell may be con?gured as a soft-key,
Which When activated, leads to a further operation such as
providing an additional display. A cell may be further con?g
ured to be editable, Whereby for example, the text content
40
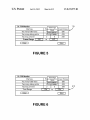
FIG. 2 shoWs an exemplary vieW of diagnostics display
WindoW 115 When a soft-key of diagnostics display WindoW
115 has been activated. In this particular example, soft-key
larly used for identifying the individual graphs.
45
display WindoW 115 are froZen so that a developer can exam
ine and analyZe the displayed values. After having done so,
used to analyZe the performance of the video game. The
50
FIG. 3 shoWs an exemplary embodiment Where a drop
performance analyZer system 100 may be con?gured to per
mit a developer or other individual to de?ne one or more
55
factors for each of the graphs of graphics display 120, While
the fourth and ?fth columns provide minimum and maximum
values of the corresponding monitored parameters.
60
Additionally, performance analyZer system 100 may
include a data store (not shoWn), Which is used for storing a
running log of timing parameters related to the monitored
gaming parameters. Consequently, When a developer notices
an abnormal spike, for example, in a particular frame on
graphical display 120, the stored data may be accessed for
carrying out a timing analysis on the abnormal frame.
the developer can noW activate the “Start” key to resume
display activities in diagnostics display WindoW 115.
facturer of performance analyZer system 100. Alternatively,
counters for various performance metrics that are of particu
lar interest to the developer.
The third column of tabular display 125 lists the scaling
116, Which Was labeled “Stop” in FIG. 1, Was activated
thereby causing the soft-key to be re-labeled as “Start.” Upon
activation of the “Stop” function, the contents of diagnostics
second column correspond to various counters that are used to
obtain count values of certain performance metrics that are
counters may be provided to correspond to a set of pre
determined performance metrics that are selected by a manu
may be modi?ed or a numerical parameter set to a desired
value.
red correspondingly. Other identi?cation means may be simi
The second column of tabular display 125 provides list of
performance metrics associated With various monitored
parameters. In this exemplary embodiment, the entries in the
Furthermore, each of the cells in tabular display 125 and/or
diagnostics display WindoW 115 may be con?gured in various
65
doWn menu 301 is provided in conjunction With diagnostics
display WindoW 115. As can be understood, the functionality
of drop-doWn menu 301 may be implemented in other alter
native Ways, such as, for example, by using selection icons or
soft-keys. In this example, drop-doWn menu 301 contains
three options: Warnings, Save, and Time Mode. The hatched
format of the Warnings option is intended to indicate that this
option has been selected. When thus selected, the Warnings
WindoW 410 of FIG. 4A is displayed. Warnings WindoW 410
provides a list ofVisible Warnings in display box 425 and a list
of Invisible Warnings in display box 430. Action soft-keys
415 and 420 permit transfer of Warnings betWeen display box
425 and display box 430 thereby permitting selection of the
visibility status of individual Warnings. For example, the
Warning labeled “Too many D3D locks” may be made invis
US 8,219,975 B2
5
6
ible by selecting this Warning (for example, by clicking on it),
followed by activation of soft-key 420. Each of the display
provided. Certain portions of the entries in either the condi
tion section 830 and/or the description section 825 may be
boxes 425 and 430 may incorporate additional features such
as a scroll-bar. Warnings WindoW 410 provides additional
of the admonishment “You should not do so many on this
con?gured as soft-keys. For example, a portion (or entirety)
soft-keys such as, for example, Cancel soft-key 435 and OK
frame” may include a soft-key. In one embodiment, the soft
soft-key 440.
key is provided in a Hypertext Markup Language (HTML)
FIG. 4B illustrates other example appropriate invisible and
visible Warnings. Also, as depicted in FIG. 4B, Warning con
format Which can be activated to jump to a solution source.
Such a solution source may be a private document, such as a
user’s manual, or a public document such as a Web page that
ditions are fully editable. A user can create a Warning based on
any of the supplied counter values. This alloWs for an
advanced user to go outside of prede?ned settings and evalu
ate tailored data combinations. Warnings can be tested in a
dialog prior to use, alloWing the user to ensure correct
expected behavior. As depicted in FIG. 4B, a user can gener
is accessed via the Internet, for example.
Furthermore, in one exemplary embodiment, clicking on a
soft-key located in any portion of description WindoW 81 0, for
example, in description section 825, provides access to source
code Wherein the problem can be recti?ed. The source code is
ate a neW Warning via soft-key 445, a user can edit an existing
a part of the gaming application code of the video game.
In an example embodiment, description WindoW 810 fur
ther contains a number of dedicated soft-keys, such as, for
Warning via soft-key 450, a user can reset a Warning via
soft-key 460, a user can delete a Warning via soft-key 465, or
a combination thereof. Warnings can be added and removed
example, the soft-keys Close 820, Graph 815, Hide 835 and
by moving them betWeen the invisible and visible list. A user
can set conditions and test if the conditions are technically
20
810. Clicking on Hide 835 removes the Warning from a Wam
correct before saving the Warnings. If the conditions are not
correct, an error Will be generated. For example, referring to
FIG. 4C, suppose a user forgets to include the “>10000”
portion shoWn in the Priority 1 Condition WindoW of FIG. 4C.
Instead, suppose the user enters “D3D.DraWApiCalls” in the
Priority 1 Condition WindoW. When testing the condition, an
error Will be generated. The generated error Will be “Priority
1 Condition4error CS0029: Cannot implicitly convert type
‘?oat’ to ‘bool”’ (Error not shoWn in FIG. 4C). The conditions
and errors are based on C++/ C # conditional logic.
25
30
When activated. For example, upon clicking on the Graph 815
key, the soft-key transforms to an “Ungraph” key, Which
permits the Warning graphical display to be closed.
A non-exhaustive list of exemplary Warnings, together
drop-down menu 301, indicative of selection of this option.
When thus selected, as depicted in FIG. 6, the frame range
changes to time range. In an example embodiment, the time
seconds to 2.0 seconds in this example) provides a time Win
doW Within Which Warnings can be ob served. Thus, the ability
is provided to shoW Warnings that Were generated Within a
selected range of time.
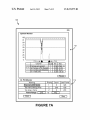
FIG. 7A shoWs an exemplary vieW of display screen 105 to
describe operation of a soft-key process associated With each
ing WindoW, such as Warnings WindoW 410 described above.
Clicking on Graph 815 causes a Warning graphical display
(not shoWn) of the Warning to appear. Clicking on the Edit 840
alloWs the user to edit the Warning condition (See FIG. 4C).
This Warning graphical display may utiliZe a format similar to
that of graphical display 120 described above. Each of the
soft-keys may be also con?gured to change functionality
FIG. 5 shoWs a hatched format of the Time mode option in
range displayed in Time Range display segment 615 (1.0
Edit 840. Clicking on Close 820 closes description WindoW
35
With some information pertaining to each of these Warnings
and some recommended solutions, is provided beloW. Several
Warnings listed beloW, use a certain format for setting Wam
ing thresholds and priorities. This exemplary format Will be
describedusing the Warning labeled: D3DShaderPatches>{2,
10, 50}. The numbers located Within { } provide priority
40
of the Warning messages in diagnostics display WindoW 115.
In this particular example, the hatched portion indicates that
the “Too many D3D locks” Warning has been activated using
threshold Warning values. In this particular example, the
numbers located Within { } indicate a priority level 1 Warning
setting When D3DShaderPatches>50; a priority level 2 Wam
ing setting When D3DShaderPatches>1 0; and a priority level
3 Warning setting When D3DShaderPatches>2. It may also be
pertinent to point out that these priority levels are shoWn in the
second column of diagnostics display WindoW 115 as
described above.
D3D: Too Many Shader Patches
a ?rst mode of activation (by single-clicking on the Warning,
for example). When thus activated, one or more pointer icons
are displayed pointing to certain frames on graphical display
120. In this exemplary illustration, tWo pointer icons 710 and
715 are displayed. The pointer icons are used to identify the
45
one or more frames Where the Warning Was generated. In
50
There Were too many vertex shader patches. A vertex
shader patch happens When a vertex shader is used With a
different vertex declaration or SetStreamSource stride than it
Was previously used With, or When it’s used With a pixel
55
Patches cause D3D to incur signi?cant CPU overhead and
Waste GPU command space.
D3DShaderPatches>{2, 10, 50}
another example embodiment, as depicted in FIG. 7B, the
actual time duration that a Warning Was active is shoWn in an
event band at the top of the display. This is depicted as track
that has a solid bar, as depicted by bars 720 and 725, for the
period the Warning Was evaluated to be true. In an example
shader Whose inputs don’t match the vertex shader’s outputs.
embodiment, the color of the bar signi?es the priority of the
Warning.
The “Too many D3D locks” Warning may be also activated
using a second mode of activation (by double-clicking on it,
for example). This form of activation results in the display of
D3D: Too Many GPU Interrupts
D3DInterrupts>{40, 100, 200}
There Were too many GPU interrupts. GPU interrupts are
a description WindoW for the Warning. An exemplary descrip
generated by calls to InsertCallback or EndTiling, EndZPass
or XpsEnd. Interrupts incur signi?cant CPU and GPU over
tion WindoW 810 is shoWn in FIG. 8 for the Warning “Too
head.
many D3D Locks.” Description WindoW 810 includes a con
dition section 830 Where one or more conditions that led to the
D3D: Too Much Time Spent in Interrupt Callbacks
D3DCallbackTime>{0.5 ms, 1 ms, 2 ms}
Warning are displayed. Description WindoW 810 further
includes a description section 825 in Which a description of
the Warning as Well as other particulars of the Warning is
60
65
There Was too much cumulative time spent processing
interrupt callbacks. This is most likely because InsertCall
back routines took too long, or it might be due to other
US 8,219,975 B2
7
8
interrupt or DPC activity in the system. The GPU has to idle
the entire time that interrupt callbacks are processed by the
2_FRAMES. Predicated Tiling Works best if the GPU can
make multiple passes over the command data to render one
CPU.
frame While the CPU is constructing the command data for
D3DX: Too Many Run-Time Shader Compilations
the next frame, and doing so requires enough secondary ring
D3DXShaderCompilations>{0, 5, 10}
There
Were
too
many
run-time
calls
buffer room to hold 2 complete frames of command data. If a
single frame consumes more than half of the entire secondary
to
D3 DXCompileShader or its variants. Shader compilation has
very high CPU overhead and requires signi?cant amounts of
dynamically allocated memory. It’s preferable to precompile
ring buffer (but less than the entire secondary ring buffer), the
frame Will still be rendered ?ne but signi?cant CPU and GPU
stalls may result.
The most straightforWard ?x is to increase the siZe of the
all shaders on the PC.
D3DX: Too Many D3DX Resource Creation Calls
secondary
ring
buffer
via
D3DRING_BUFFER_PARAMETERS, but eliminating the
D3DXCreationCalls>{0, 5, l0}
D3DX
resource
creation
APIs
such
as
stalls may not be Worth the increase in memory used. Much
D3DXCreateTextureFromFile have high CPU and disc over
more is to reduce the amount of commands sent to the GPU
head. It’s preferable to convert resources on the PC to the 360
(such as by eliminating redundantly set state, or by consoli
format (using functions such as XGCopySurface), pack mul
dating multiple draW calls).
tiple resources into a single ?le (so that a ?le doesn’t have to
D3D: Too Much Time Consumed in D3D Resource Blocks
be opened and closed for every resource), and then load
e?iciently onto the 360 (using functions such as XGSetTex
D3DLockTime>{0.5 ms, 1 ms, 2 ms}
Too much CPU time Was consumed in blocking D3D
tureHeader).
D3D: Too Many D3D Resource Creation Calls
20
spins for the entire duration.
Blocks can be tracked doWn by doing a PIX Timing Cap
D3DCreationCalls>{0, 5, l0}
D3D resource creation APIs such as CreateTexture and
CreateVertexBuffer have high CPU overhead because they
have to allocate physical memory.
D3D: The Primary Ring Buffer Was Overrun
ture, or by using the SetBlockCallback method. Blocks can be
25
D3DPrimaryRingBufferOverruns>{0, 0, 0}
(D3DIsGuideV1sible && D3DSystemGpuTime>0333 ms)||
(!D3DIsGuideVisible && D3DSystemGpuTime>l ms)
overrun. This Wastes CPU time for the duration of the block.
This overrun can occur for reasons such as using Predicated
30
The system consumed more GPU time than its reserved
amount. Please contact the manufacturer so that the manu
quently calling InsertFence).
facturer can reproduce the problem and ?x it.
Because the primary ring buffer is small, the simplest ?x is
D3D: The GPU Starved for Data
(D3DPresentInterval !:0) && (D3DIdlesAtKickoff>{0, 0,
to increase its siZe via D3DRING_ BUFFER_PARAM
ETERS.
35
D3D: Too Many Secondary Ring Buffer Overruns
command buffer data from the CPU. Ideally the GPU is never
D3D had to block because the secondary ring buffer Was
overrun. This Wastes CPU time for the duration of the block.
This overrun occurs When the GPU is running behind and
0})
The GPU Went idle during rendering because it starved for
D3DSecondaryRingBufferOverruns>{ l, 2, 3}
40
there is not enough room in the secondary ring buffer to hold
all of the pending GPU commands that have been enqueued
idle, and is alWays either rendering or Waiting for the vertical
blank. Use the PIX “Record Timing” ability to determine Why
the GPU is starving. (Note that you may Want to capture 2
frames at once because the idle may occur While transitioning
from one frame to the next.)
by the CPU.
D3D: The GPU Starved While Waiting for the CPU to End
The most straightforward ?x is to increase the siZe of the
secondary
ring
buffer
via
D3DRING_BUFFER_PARAMETERS, but eliminating the
a Bracket
45
D3DIdlesAtEndBracket>{0, 0, 0}
50
The GPU Went idle While Waiting for the CPU to call an
End API. None of the GPU command data in a tiling, Z-pass
or XPS bracket is submitted to the GPU until EndTiling,
EndZPass or XpsEnd is called.
D3D: Too Many DraW Calls
CPU block may not be Worth the increase in memory used.
More dif?cult is to reduce the amount of commands sent to
the GPU (such as by eliminating redundantly set state, or by
consolidating multiple draW calls).
D3DDraWCalls>{3000, 6000, 10000}
D3D: Tiling Was Used Without Enabling D3D CREATE_
BUFFERi2_FRAMES
There Were many more draW calls than are done by most
games in a frame. Too many draW calls result in excessive
D3DTilingEnabled && lD3DBuffer2FramesEnabled
Predicated Tiling Was used Without enabling
D3DCREATE_BUFFERi2_FRAMES. Predicated Tiling
CPU usage While rendering. Consider cutting doWn on the
55
Works best if the GPU can make multiple passes over the
command data to render one frame While the CPU is con
by
specifying
D3DCREATE_BUFFERi
2_FRAMES at CreateDevice time.
D3D: More than Half of the Secondary Ring Buffer Was
Consumed
number of calls (such as by potentially doing better frustum
culling or visibility determination), or consolidating draW
calls, or using command buffers.
D3D: CPU Frame Time Too Long
structing the command data for the next frame. Enable that
scenario
eliminated by methods such as double buffering (or triple or
n-buffering) dynamic resources, using methods such as Beg
inVertices, or other mechanisms.
D3D: The System Consumed too Much GPU
D3D had to block because the primary ring buffer Was
Tiling With a large number of tiles, or When many ‘kick-offs’
of the GPU are being done (such as can be caused by fre
resource locks. Blocks Waste CPU time because the CPU
D3DCpuFrameTime>{50 ms, 75 ms, 100 ms}
60
The CPU took too long for a frame (de?ned as the time
betWeen CPU calls to SWap/Present). Use PIX to Record
Timing for a frame to determine Why.
(D3DSecondaryRingBufferUsed>D3DSecondaryRingBuffer
65
Size/2)
D3DGpuFrameTime>200 ms
The CPU took Way too long for a frame (de?ned as the time
More than half of the secondary ring buffer Was consumed
betWeen CPU calls to SWap/Present). Cert requirements
specify that SWap/Present must alWays be called Within 67
D3DTilingEnabled && D3DBuffer2FramesEnabled &&
by a single frame While using D3DCREATE_BUFFERi
D3D: CPU Frame Way Too Long
US 8,2l9,975 B2
10
ms. If this is during level load When it is di?icult to call
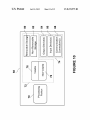
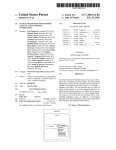
data of a video game as described above. For example, the
SWap/Present at the required rate, consider using the Suspend
input/output portion 74 is capable of accepting a softWare
and Resume methods to have D3D automatically sWap for
media on Which is stored at least a portion of the diagnostic
you during the load.
D3D: GPU Frame Time Too Long
tool and for displaying the various display screens described
above.
The processing portion 70 is capable of implementing real
(D3DIdlesAtKickoff::0) && (D3DGpuFrameTime>{50
time analysis of performance data of a video game as
ms, 75 ms, 100 ms})
described above. For example, the processing portion 70 is
The GPU took too long to render a frame (de?ned as the
capable of generating performance data and the display
time betWeen processing SWaps/Presents). Use PIX to
screens described above.
The processor 68 can be implemented as a client processor
and/or a server processor. In a basic con?guration, the pro
“Record GPU” for a frame to determine Why. <<Use
‘D3DIdlesAtKickoff::0’ so that it rules out GPU stalls
caused by the CPU>>
D3D: Not using D3DRS_ PRESENTIMMEDIATETH
cessor 68 can include at least one processing portion 70 and
memory portion 72. The memory portion 72 can store any
RESHOLD
information utiliZed in conjunction With real-time analysis of
(D3D PresentImmediate Threshold::0) && (((D3D Pre
sentInterval::l) && (D3DGpuFrameTime>0.0l 6667 ms))||
(D3DPresentInterval::2)
&&
performance data of a video game. Depending upon the exact
con?guration and type of processor, the memory portion 72
can be volatile (such as RAM) 76, non-volatile (such as ROM,
(D3DGpuFrameTime>0.033333 ms)))
The
GPU
missed
its
target
render
time
but
20
D3DRS_PRESENTIMMEDIATETHRESHOLD isn’t being
(removable storage 80 and/or non-removable storage 82)
including, but not limited to, magnetic or optical disks, tape,
used. Use this render state to alloW frames to be presented
immediately When the frame took longer to complete than the
target frame rate. This Will increase tearing but that’s much
better than stuttering. We recommend setting
?ash, smart cards or a combination thereof. Computer storage
25
D3DRS_PRESENTIMMEDIATETHRESHOLD to 100.
D3D: Too Many GPU Kick-Offs
D3DKickOffs>{100, 200, 500}
There Were too many kick-offs of command data to the
GPU. This Wastes CPU and GPU overhead. Note that the
30
GPU overhead is not reproduced While analyZing a PIX GPU
capture. Too many kick-offs might happenbecause of reasons
SegmentCount
speci?ed
via
netic storage devices, universal serial bus (U SB) compatible
memory, smart cards, or any other medium Which can be used
to store the desired information and Which can be accessed by
the processor 68. Any such computer storage media can be
part of the processor 68.
40
nection(s) 88 that alloW the processor 68 to communicate
With other devices, such as other devices, for example. Com
munications connection(s) 88 is an example of communica
tion media. Communication media typically embody com
FIG. 9 shoWs a ?oW chart of a method for analyZing the
performance of a video game. In block 905, a diagnostic tool
(not shoWn) of performance analyZer system 100 is associ
The processor 68 can also contain communications con
tool is loaded and installed on a computer that houses and runs
the application code of the video game. The loading may be
carried out in a manner similar to that done for installing any
commercial softWare, say one that is provided in a CD-ROM
puter readable instructions, data structures, program modules
45
for example.
signal that has one or more of its characteristics set or changed
in such a manner as to encode information in the signal. By
50
Way of example, and not limitation, communication media
includes Wired media such as a Wired netWork or direct-Wired
can be appreciated that the data capture aspect shoWn in block
915 typically Would not interfere With normal operation of the
connection, and Wireless media such as acoustic, RF, infrared
and other Wireless media. The term computer readable media
video game. In block 920, one or more Warnings are gener
ated When a performance metric violates a pre-set condition.
or other data in a modulated data signal such as a carrier Wave
or other transport mechanism and includes any information
delivery media. The term “modulated data signal” means a
In block 910, the video game is set in operation. The
diagnostic tool is activated, either before or during game
operation. In block 915, real-time performance data associ
ated With the execution of the application code, is captured
and displayed using display screen 105 described above. It
of information such as computer readable instructions, data
structures, program modules, or other data. Computer storage
media include, but are not limited to, RAM, ROM, EEPROM,
?ash memory or other memory technology, CD-ROM, digital
35
the secondary ring buffer siZe.
ated With application code of the video game. As one among
several Ways of doing so, an executable code of the diagnostic
media, such as memory portion 72, 76, 78, 80, and 82, include
volatile and nonvolatile, removable and non-removable
media implemented in any method or technology for storage
versatile disks (DVD) or other optical storage, magnetic cas
settes, magnetic tape, magnetic disk storage or other mag
such as InsertFence being called too often, or because the
D3DRING_BUFFER_PARAMETERS is too high relative to
?ash memory, etc.) 78, or a combination thereof. The proces
sor 68 can have additional features/functionality. For
example, the processor 68 can include additional storage
55
as used herein includes both storage media and communica
tion media. The processor 68 also can have input device(s) 86
The Warnings and performance metrics associated With inter
preting and using display screen 105 have been described
such as keyboard, mouse, pen, voice input device, touch input
device, etc. Output device(s) 84 such as a display, speakers,
above.
FIG. 10 is a diagram of an exemplary processor 68 for
printer, etc. also can be included.
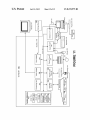
FIG. 11 and the folloWing discussion provide a brief gen
implementing real-time analysis of performance data of a
video game. The processor 68 comprises a processing portion
70, a memory portion 72, and an input/output portion 74. The
60
processing portion 70, memory portion 72, and input/ output
portion 74 are coupled together (coupling not shoWn in FIG.
10) to alloW communications therebetWeen. The input/ output
portion 74 is capable of providing and/or receiving compo
nents utiliZed to perform real-time analysis of performance
65
eral description of a suitable computing environment in
Which s real-time analysis of performance data of a video
game can be implemented. Although not required, various
aspects of real-time analysis of performance data of a video
game can be described in the general context of computer
executable instructions, such as program modules, being
executed by a computer, such as a client Workstation or a
server. Generally, program modules include routines, pro
US 8,2l9,975 B2
11
12
grams, obj ects, components, data structures and the like that
The hardWare/softWare interface system also manages the
perform particular tasks or implement particular abstract data
types. Moreover, implementation of real -time analysis of per
sharing of internal memory among multiple applications, and
computer system con?gurations, including hand held
handles input and output to and from attached hardWare
devices such as hard disks, printers, and dial-up ports. The
hardWare/softWare interface system also sends messages to
devices, multi processor systems, microprocessor based or
programmable consumer electronics, netWork PCs, mini
computers, mainframe computers, and the like. Further, real
ing the status of operations and any errors that may have
occurred. The hardWare/softWare interface system can also
formance data of a video game can be practiced With other
each application (and, in certain case, to the end-user) regard
o?lload the management of batch jobs (e.g., printing) so that
the initiating application is freed from this Work and can
resume other processing and/or operations. On computers
that can provide parallel processing, a hardware/software
time analysis of performance data of a video game also can be
practiced in distributed computing environments Where tasks
are performed by remote processing devices that are linked
through a communications netWork. In a distributed comput
ing environment, program modules can be located in both
local and remote memory storage devices.
A computer system can be roughly divided into three com
ponent groups: the hardWare component, the hardWare/soft
Ware interface system component, and the applications pro
grams component (also referred to as the “user component”
interface system also manages dividing a program so that it
runs on more than one processor at a time.
A hardWare/softWare interface system shell (referred to as
a “shell”) is an interactive end-user interface to a hardWare/
softWare interface system. (A shell may also be referred to as
a “command interpreter” or, in an operating system, as an
or “softWare component”). In various embodiments of a com
puter system the hardWare component may comprise the cen
20
tral processing unit (CPU) 721, the memory (both ROM 764
and RAM 725), the basic input/output system (BIOS) 766,
by application programs and/or end-users. In contrast to a
shell, a kernel is a hardware/software interface system’s
innermost layer that interacts directly With the hardWare com
and various input/output (I/O) devices such as a keyboard
740, a mouse 742, a monitor 747, and/or a printer (not
shoWn), among other things. The hardWare component com
prises the basic physical infrastructure for the computer sys
ponents.
30
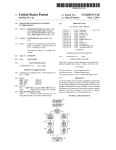
As shoWn in FIG. 11, an exemplary general purpose com
puting system includes a conventional computing device 760
or the like, including a processing unit 721, a system memory
762, and a system bus 723 that couples various system com
ponents including the system memory to the processing unit
721. The system bus 723 may be any of several types of bus
35
peripheral bus, and a local bus using any of a variety of bus
architectures. The system memory includes read only
memory (ROM) 764 and random access memory (RAM)
725. A basic input/output system 766 (BIOS), containing
25
tem.
The applications programs component comprises various
softWare programs including but not limited to compilers,
database systems, Word processors, business programs,
videogames, and so forth. Application programs provide the
structures including a memory bus or memory controller, a
means by Which computer resources are utilized to solve
problems, provide solutions, and process data for various
users (machines, other computer systems, and/or end-users).
In an example embodiment, application programs perform
the functions associated With real-time analysis of perfor
mance data of a video game as described above.
The hardware/software interface system component com
prises (and, in some embodiments, may solely consist of) an
operating system that itself comprises, in most cases, a shell
and a kernel. An “operating system” (OS) is a special program
that acts as an intermediary betWeen application programs
and computer hardWare. The hardWare/softWare interface
system component may also comprise a virtual machine man
ager (VMM), a Common Language Runtime (CLR) or its
functional equivalent, a Java Virtual Machine (JVM) or its
functional equivalent, or other such softWare components in
the place of or in addition to the operating system in a com
puter system. A purpose of a hardWare/softWare interface
40
to a removable optical disk 731 such as a CD ROM or other
45
system is to provide an environment in Which a user can 50
for the computing device 760. Although the exemplary envi
55
magnetic disk 729, and a removable optical disk 731, it
should be appreciated by those skilled in the art that other
types of computer readable media Which can store data that is
accessible by a computer, such as magnetic cassettes, ?ash
enable end-users to interact With the hardWare/softWare inter
60
A hardware/software interface system traditionally per
forms a variety of services for applications. In a multitasking
hardWare/softWare interface system Where multiple programs
may be running at the same time, the hardWare/softWare
interface system determines Which applications should run in
What order and hoW much time should be alloWed for each
application before sWitching to another application for a turn.
optical media. The hard disk drive 727, magnetic disk drive
728, and optical disk drive 730 are connected to the system
bus 723 by a hard disk drive interface 732, a magnetic disk
drive interface 733, and an optical drive interface 734, respec
tively. The drives and their associated computer readable
media provide non volatile storage of computer readable
instructions, data structures, program modules and other data
ronment described herein employs a hard disk, a removable
loaded into a computer system at startup and thereafter man
face system via a user interface such as a command language
or a graphical user interface (GUI).
basic routines that help to transfer information betWeen ele
ments Within the computing device 760, such as during start
up, is stored in ROM 764. The computing device 760 may
further include a hard disk drive 727 for reading from and
Writing to a hard disk (hard disk not shoWn), a magnetic disk
drive 728 (e.g., ?oppy drive) for reading from or Writing to a
removable magnetic disk 729 (e. g., ?oppy disk, removal stor
age), and an optical disk drive 730 for reading from or Writing
execute application programs.
The hardWare/softWare interface system is generally
ages all of the application programs in the computer system.
The application programs interact With the hardWare/soft
Ware interface system by requesting services via an applica
tion program interface (API). Some application programs
“operating system shell”). A shell is the outer layer of a
hardWare/softWare interface system that is directly accessible
65
memory cards, digital video disks, Bernoulli cartridges, ran
dom access memories (RAMs), read only memories (ROMs),
and the like may also be used in the exemplary operating
environment. LikeWise, the exemplary environment may also
include many types of monitoring devices such as heat sen
sors and security or ?re alarm systems, and other sources of
information.
A number of program modules can be stored on the hard
disk, magnetic disk 729, optical disk 731, ROM 764, or RAM
725, including an operating system 735, one or more appli