1
User’s Manual
High-performance Embedded Workshop V.4.08
User’s Manual
All information contained in these materials, including products and product specifications,
represents information on the product at the time of publication and is subject to change by
Renesas Electronics Corporation without notice. Please review the latest information published
by Renesas Electronics Corporation through various means, including the Renesas Electronics
Corporation website (http://www.renesas.com).
www.renesas.com
Rev.1.00 Jul 2010
Notice
1.
2.
3.
4.
5.
6.
7.
All information included in this document is current as of the date this document is issued. Such information, however, is
subject to change without any prior notice. Before purchasing or using any Renesas Electronics products listed herein, please
confirm the latest product information with a Renesas Electronics sales office. Also, please pay regular and careful attention to
additional and different information to be disclosed by Renesas Electronics such as that disclosed through our website.
Renesas Electronics does not assume any liability for infringement of patents, copyrights, or other intellectual property rights
of third parties by or arising from the use of Renesas Electronics products or technical information described in this document.
No license, express, implied or otherwise, is granted hereby under any patents, copyrights or other intellectual property rights
of Renesas Electronics or others.
You should not alter, modify, copy, or otherwise misappropriate any Renesas Electronics product, whether in whole or in part.
Descriptions of circuits, software and other related information in this document are provided only to illustrate the operation of
semiconductor products and application examples. You are fully responsible for the incorporation of these circuits, software,
and information in the design of your equipment. Renesas Electronics assumes no responsibility for any losses incurred by
you or third parties arising from the use of these circuits, software, or information.
When exporting the products or technology described in this document, you should comply with the applicable export control
laws and regulations and follow the procedures required by such laws and regulations. You should not use Renesas
Electronics products or the technology described in this document for any purpose relating to military applications or use by
the military, including but not limited to the development of weapons of mass destruction. Renesas Electronics products and
technology may not be used for or incorporated into any products or systems whose manufacture, use, or sale is prohibited
under any applicable domestic or foreign laws or regulations.
Renesas Electronics has used reasonable care in preparing the information included in this document, but Renesas Electronics
does not warrant that such information is error free. Renesas Electronics assumes no liability whatsoever for any damages
incurred by you resulting from errors in or omissions from the information included herein.
Renesas Electronics products are classified according to the following three quality grades: “Standard”, “High Quality”, and
“Specific”. The recommended applications for each Renesas Electronics product depends on the product’s quality grade, as
indicated below. You must check the quality grade of each Renesas Electronics product before using it in a particular
application. You may not use any Renesas Electronics product for any application categorized as “Specific” without the prior
written consent of Renesas Electronics. Further, you may not use any Renesas Electronics product for any application for
which it is not intended without the prior written consent of Renesas Electronics. Renesas Electronics shall not be in any way
liable for any damages or losses incurred by you or third parties arising from the use of any Renesas Electronics product for an
application categorized as “Specific” or for which the product is not intended where you have failed to obtain the prior written
consent of Renesas Electronics. The quality grade of each Renesas Electronics product is “Standard” unless otherwise
expressly specified in a Renesas Electronics data sheets or data books, etc.
“Standard”:
8.
9.
10.
11.
12.
Computers; office equipment; communications equipment; test and measurement equipment; audio and visual
equipment; home electronic appliances; machine tools; personal electronic equipment; and industrial robots.
“High Quality”: Transportation equipment (automobiles, trains, ships, etc.); traffic control systems; anti-disaster systems; anticrime systems; safety equipment; and medical equipment not specifically designed for life support.
“Specific”:
Aircraft; aerospace equipment; submersible repeaters; nuclear reactor control systems; medical equipment or
systems for life support (e.g. artificial life support devices or systems), surgical implantations, or healthcare
intervention (e.g. excision, etc.), and any other applications or purposes that pose a direct threat to human life.
You should use the Renesas Electronics products described in this document within the range specified by Renesas Electronics,
especially with respect to the maximum rating, operating supply voltage range, movement power voltage range, heat radiation
characteristics, installation and other product characteristics. Renesas Electronics shall have no liability for malfunctions or
damages arising out of the use of Renesas Electronics products beyond such specified ranges.
Although Renesas Electronics endeavors to improve the quality and reliability of its products, semiconductor products have
specific characteristics such as the occurrence of failure at a certain rate and malfunctions under certain use conditions. Further,
Renesas Electronics products are not subject to radiation resistance design. Please be sure to implement safety measures to
guard them against the possibility of physical injury, and injury or damage caused by fire in the event of the failure of a
Renesas Electronics product, such as safety design for hardware and software including but not limited to redundancy, fire
control and malfunction prevention, appropriate treatment for aging degradation or any other appropriate measures. Because
the evaluation of microcomputer software alone is very difficult, please evaluate the safety of the final products or system
manufactured by you.
Please contact a Renesas Electronics sales office for details as to environmental matters such as the environmental
compatibility of each Renesas Electronics product. Please use Renesas Electronics products in compliance with all applicable
laws and regulations that regulate the inclusion or use of controlled substances, including without limitation, the EU RoHS
Directive. Renesas Electronics assumes no liability for damages or losses occurring as a result of your noncompliance with
applicable laws and regulations.
This document may not be reproduced or duplicated, in any form, in whole or in part, without prior written consent of Renesas
Electronics.
Please contact a Renesas Electronics sales office if you have any questions regarding the information contained in this
document or Renesas Electronics products, or if you have any other inquiries.
(Note 1) “Renesas Electronics” as used in this document means Renesas Electronics Corporation and also includes its majorityowned subsidiaries.
(Note 2) “Renesas Electronics product(s)” means any product developed or manufactured by or for Renesas Electronics.
High-performance Embedded Workshop V.4.08
Introduction
Introduction
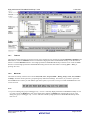
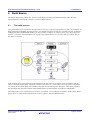
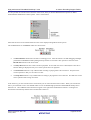
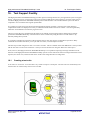
The High-performance Embedded Workshop is a powerful development environment for embedded applications targeted
at Renesas micro-controllers. The main features are:
•
•
•
•
•
A configurable build engine that allows you to set-up compiler, assembler and linker options by using GUI.
An integrated text editor with user customizable syntax coloring to improve code readability.
A configurable environment, which allows you to run your own tools.
An integrated debugger, which allows you to build and debug in the same application.
Version control support.
Operating Environment for the High-performance Embedded Workshop
This user's manual, online help, and release notes do not indicate that the correct operation of the High-performance
Embedded Workshop is guaranteed for any types of host computers or peripheral devices.
Note on the Sample Source Files Generated by the High-performance Embedded Workshop
When a new workspace is created, sample source files for the microcomputer in use are automatically generated. These
files contain sample code and this does not indicate that the operations of all programs based on that code are guaranteed.
Please read the hardware manual for the microcomputer to check if the generated source code is applicable and modify
the code as required.
REJ10J2169-0100 Rev.1.00
Jul 01, 2010
High-performance Embedded Workshop V.4.08
Introduction
About This User’s Manual
This user's manual describes the High-performance Embedded Workshop system. This user's manual describes
information on the basic “look and feel” of the High-performance Embedded Workshop and customizing the Highperformance Embedded Workshop environment and detail the build and the debugging functions common to the Highperformance Embedded Workshop products. The figures in this document show the High-performance Embedded
Workshop operating with a debugger for the SuperH family. For details on the debugger, refer to the user’s manual or
help information for the emulator or simulator included in the package.
This user's manual does not intend to explain how to write C/C++ or assembly language programs, how to use any
particular operating system or how best to tailor code for the individual devices. These issues are left to the respective
user's manuals.
The High-performance Embedded Workshop is customized in various languages. This user’s manual gives descriptions
on the English version of the High-performance Embedded Workshop application.
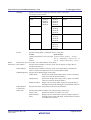
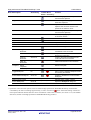
Document Conventions
This user’s manual uses the following typographic conventions:
Convention
Meaning
[Menu -> Menu Option]
‘->’ is used to indicate menu options (for example, [File -> Save As]).
FILENAME.C
Uppercase names are used to indicate filenames.
Key + Key
Used to indicate required key presses.
For example, CTRL+N means press the CTRL key and then, whilst holding the CTRL key
down, press the N key.
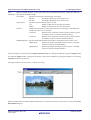
Figures
Some figures in this user’s manual may differ from the objects they represent.
Trademarks
Microsoft, MS-DOS, Visual SourceSafe, Windows and Windows Vista are either registered trademarks or trademarks of
Microsoft Corporation in the United States and/or other countries.
All other company and product names are registered trademarks or trademarks of their respective companies.
Website and Support
Renesas Electronics Tools Website
http://www.renesas.com/tools
Inquiries
http://www.renesas.com/inquiry
REJ10J2169-0100 Rev.1.00
Jul 01, 2010
High-performance Embedded Workshop V.4.08
Contents
Contents
1. Overview............................................................................................................................................ 1
1.1
1.2
Workspace and project(s).......................................................................................................................................... 1
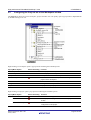
Main window ............................................................................................................................................................ 1
1.2.1
Title bar .......................................................................................................................................................... 2
1.2.2
Menu bar ........................................................................................................................................................ 2
1.2.3
Toolbars.......................................................................................................................................................... 3
1.2.4
Workspace window ........................................................................................................................................ 6
1.2.5
Editor window ................................................................................................................................................ 8
1.2.6
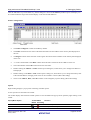
Output window............................................................................................................................................... 9
1.2.7
Status bar...................................................................................................................................................... 13
1.3
Help system............................................................................................................................................................. 14
1.4
Launching the High-performance Embedded Workshop........................................................................................ 15
1.5
Creating a new workspace ...................................................................................................................................... 16
1.6
Opening a workspace .............................................................................................................................................. 16
1.7
Using old workspaces ............................................................................................................................................. 17
1.8
Saving a workspace................................................................................................................................................. 17
1.9
Closing a workspace ............................................................................................................................................... 19
1.10 Exiting the High-performance Embedded Workshop ............................................................................................. 19
1.11 Component system overview .................................................................................................................................. 19
1.12 Management information files of High-performance Embedded Workshop .......................................................... 19
1.13 Overview of Configurations and Sessions .............................................................................................................. 20
1.14 Overview of Macro-Recording Support facility and Test Support facility ............................................................. 24
1.14.1
Example of test procedures .......................................................................................................................... 28
1.14.2
Step 1: Recording a macro ........................................................................................................................... 30
1.14.3
Step 2: Editing a macro (viewing records) ................................................................................................... 32
1.14.4
Step 3: Playing a macro................................................................................................................................ 33
1.14.5
Step 4: Creating a test suite .......................................................................................................................... 33
1.14.6
Step 5: Editing a test suite ............................................................................................................................ 34
1.14.7
Step 6: Creating a test image file.................................................................................................................. 36
1.14.8
Step 7: Modifying the program before the test............................................................................................. 38
1.14.9
Step 8: Viewing the test result (unmatched)................................................................................................. 39
1.14.10 Step 9: Modifying the program back and executing the test again............................................................... 40
1.14.11 Step 10: Viewing the test result (matched)................................................................................................... 40
2. Build Basics ..................................................................................................................................... 41
2.1
2.2
2.3
The build process .................................................................................................................................................... 41
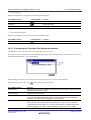
Configuring the Projects tab of the Workspace window......................................................................................... 42
Project files ............................................................................................................................................................. 45
2.3.1
Adding files to a project ............................................................................................................................... 46
2.3.2
Drag and drop of files and folders................................................................................................................ 47
2.3.3
Removing files from a project...................................................................................................................... 49
2.3.4
Excluding a project file from build .............................................................................................................. 50
2.3.5
Including a project file in build .................................................................................................................... 51
2.4
User folders in the workspace ................................................................................................................................. 51
2.5
File extensions and file groups................................................................................................................................ 53
2.5.1
Associating an application with a file group ................................................................................................ 54
2.5.2
Creating a new file extension and file group................................................................................................ 55
2.5.3
Creating a new file extension ....................................................................................................................... 57
2.6
Setting build options ............................................................................................................................................... 58
REJ10J2169-0100 Rev.1.00
Jul 01, 2010
Page i
High-performance Embedded Workshop V.4.08
Contents
2.7
Build configurations................................................................................................................................................ 58
2.7.1
Selecting a build configuration..................................................................................................................... 59
2.7.2
Adding a new build configuration................................................................................................................ 59
2.7.3
Removing a build configuration................................................................................................................... 60
2.8
Building a project.................................................................................................................................................... 60
2.8.1
Building individual files............................................................................................................................... 60
2.8.2
Building a project ......................................................................................................................................... 60
2.8.3
Building multiple projects ............................................................................................................................ 61
2.8.4
Stopping tool execution................................................................................................................................ 62
2.8.5
Deleting intermediate and output files produced in building ....................................................................... 63
2.8.6
Configuring the Build tab of the Output window......................................................................................... 65
2.8.7
Controlling the content of the Build tab of the Output window ................................................................... 67
2.8.8
Displaying out of date files in the Workspace window................................................................................ 68
2.9
File dependencies.................................................................................................................................................... 69
2.10 Configuring the Workspace window ...................................................................................................................... 72
2.11 Inserting a project into the workspace .................................................................................................................... 74
2.12 Setting the current project ....................................................................................................................................... 75
2.13 Specifying dependencies between projects ............................................................................................................. 76
2.14 Removing a project from the workspace................................................................................................................. 77
2.15 Relative projects paths in the workspace ................................................................................................................ 77
3. Advanced Build Features................................................................................................................. 78
3.1
The build process revisited ..................................................................................................................................... 78
3.1.1
What is a build?............................................................................................................................................ 78
3.2
Creating a custom build phase ................................................................................................................................ 79
3.3
Ordering build phases ............................................................................................................................................. 83
3.3.1
Build Order tab............................................................................................................................................. 84
3.3.2
Build File Order tab...................................................................................................................................... 88
3.3.3
File Mappings tab......................................................................................................................................... 88
3.4
Setting custom build phase options......................................................................................................................... 90
3.4.1
Options tab ................................................................................................................................................... 90
3.4.2
Output Files tab ............................................................................................................................................ 91
3.4.3
Dependent Files tab...................................................................................................................................... 92
3.5
Controlling the build ............................................................................................................................................... 93
3.6
Logging build output............................................................................................................................................... 94
3.7
Changing toolchain version .................................................................................................................................... 95
3.8
Generating a makefile ............................................................................................................................................. 95
3.9
Using a makefile inside the High-performance Embedded Workshop system ....................................................... 98
3.10 Customizing the High-performance Embedded Workshop linkage order ............................................................ 100
4. Editor.............................................................................................................................................. 104
4.1
4.2
4.3
Editor window....................................................................................................................................................... 104
Working with multiple files .................................................................................................................................. 105
Standard file operations ........................................................................................................................................ 106
4.3.1
Creating a new file ..................................................................................................................................... 106
4.3.2
Editing a file............................................................................................................................................... 106
4.3.3
Saving a file................................................................................................................................................ 107
4.3.4
Opening a file ............................................................................................................................................. 108
4.3.5
Closing files ............................................................................................................................................... 109
4.3.6
Pop-up menu to close the window.............................................................................................................. 110
4.4
Searching and navigating through files................................................................................................................. 111
REJ10J2169-0100 Rev.1.00
Jul 01, 2010
Page ii
High-performance Embedded Workshop V.4.08
Contents
4.4.1
Finding text ................................................................................................................................................ 111
4.4.2
Finding text in multiple files ...................................................................................................................... 112
4.4.3
Replacing text............................................................................................................................................. 113
4.4.4
Jumping to a specified line......................................................................................................................... 114
4.5
Bookmarks ............................................................................................................................................................ 115
4.6
Printing a file......................................................................................................................................................... 116
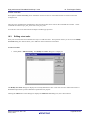
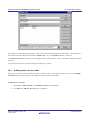
4.7
Configuring text layout ......................................................................................................................................... 117
4.7.1
Page set-up ................................................................................................................................................. 117
4.7.2
Changing tabs............................................................................................................................................. 118
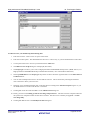
4.7.3
Auto indentation......................................................................................................................................... 118
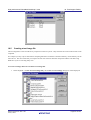
4.8
Splitting a window ................................................................................................................................................ 119
4.9
Changing the editor font ....................................................................................................................................... 120
4.10 Syntax coloring ..................................................................................................................................................... 120
4.10.1
Changing text colors................................................................................................................................... 121
4.10.2
Creating new keywords .............................................................................................................................. 121
4.10.3
Enabling/disabling syntax coloring ............................................................................................................ 123
4.11 Templates.............................................................................................................................................................. 123
4.11.1
Defining a template .................................................................................................................................... 124
4.11.2
Deleting a template..................................................................................................................................... 125
4.11.3
Inserting a template .................................................................................................................................... 126
4.12 Brace matching ..................................................................................................................................................... 126
4.13 Setting the read-only attribute for a file ................................................................................................................ 127
4.14 Preventing modification of files while debugging ................................................................................................ 127
4.15 Managing the editor columns................................................................................................................................ 128
4.16 Showing/hiding the column header....................................................................................................................... 129
4.17 Opening a file within the editor ............................................................................................................................ 129
4.18 Tooltip watch ........................................................................................................................................................ 129
4.19 Evaluate an expression.......................................................................................................................................... 130
5. Tools Administration ..................................................................................................................... 132
5.1
5.2
5.3
5.4
5.5
5.6
5.7
5.8
Tool locations........................................................................................................................................................ 133
High-performance Embedded Workshop registration files................................................................................... 133
Registering a component....................................................................................................................................... 134
Unregistering a component ................................................................................................................................... 135
Viewing and editing component properties .......................................................................................................... 136
Technical support.................................................................................................................................................. 138
Using On-Demand components ............................................................................................................................ 139
Custom project types............................................................................................................................................. 140
6. Customizing the Environment ....................................................................................................... 142
6.1
6.2
6.3
6.4
6.5
6.6
6.7
Customizing the toolbars ...................................................................................................................................... 142
Customizing the Tools menu ................................................................................................................................ 144
Using custom placeholders ................................................................................................................................... 146
Using the workspace and project log facilities...................................................................................................... 148
Configuring the help system ................................................................................................................................. 148
Keyboard shortcut customization.......................................................................................................................... 150
Scope of a control in the setup .............................................................................................................................. 152
6.7.1
Scope of a control in the Customize dialog box......................................................................................... 152
6.7.2
Scope of a control in the Options dialog box ............................................................................................. 152
6.8
Specifying workspace options .............................................................................................................................. 152
6.8.1
Opening the last workspace at start-up....................................................................................................... 152
REJ10J2169-0100 Rev.1.00
Jul 01, 2010
Page iii
High-performance Embedded Workshop V.4.08
Contents
6.8.2
Restoring files on opening a workspace ..................................................................................................... 153
6.8.3
Displaying workspace information on opening a workspace ..................................................................... 153
6.8.4
Saving the workspace before executing any tools...................................................................................... 154
6.8.5
Prompting before saving a workspace........................................................................................................ 154
6.8.6
Prompting before saving a session ............................................................................................................. 155
6.8.7
Enabling auto-backup facilities .................................................................................................................. 155
6.8.8
Setting the projects to load on workspace open ......................................................................................... 156
6.8.9
Specifying a default directory for new workspaces.................................................................................... 157
6.9
Using an external editor ........................................................................................................................................ 157
6.10 Customizing the font in your views ...................................................................................................................... 159
6.11 Using the virtual desktop ...................................................................................................................................... 161
7. Version Control.............................................................................................................................. 163
7.1
7.2
Selecting a Version Control System ..................................................................................................................... 165
Importing and exporting a set-up .......................................................................................................................... 166
8. Custom Version Control System ................................................................................................... 167
8.1
Defining Version Control menu options ............................................................................................................... 167
8.1.1
System-defined menu options .................................................................................................................... 168
8.1.2
User-defined menu options ........................................................................................................................ 169
8.2
Defining Version Control commands ................................................................................................................... 170
8.3
Specifying arguments............................................................................................................................................ 172
8.4
Specifying comments............................................................................................................................................ 172
8.5
Executable return code.......................................................................................................................................... 172
8.6
Specifying file locations........................................................................................................................................ 173
8.7
Specifying file locations example ......................................................................................................................... 175
8.8
Specifying environment ........................................................................................................................................ 176
8.9
Controlling execution of a Version Control System ............................................................................................. 176
8.10 Specifying a user name and password .................................................................................................................. 177
8.11 Usage example of the Custom Version Control System ....................................................................................... 178
8.11.1
Connecting the High-performance Embedded Workshop with RCS ......................................................... 178
8.11.2
Connecting the High-performance Embedded Workshop with CVS ......................................................... 185
9. Visual SourceSafe Version Control System .................................................................................. 194
9.1
9.2
Attaching Visual SourceSafe to a workspace ....................................................................................................... 194
Visual SourceSafe commands............................................................................................................................... 197
9.2.1
Adding files to Visual SourceSafe ............................................................................................................. 197
9.2.2
Removing files from Visual SourceSafe .................................................................................................... 199
9.2.3
Getting read-only copy of files from Visual SourceSafe............................................................................ 199
9.2.4
Checking out writable copy of files from Visual SourceSafe .................................................................... 200
9.2.5
Checking in writable copy of files into Visual SourceSafe ........................................................................ 202
9.2.6
Viewing the status of files in Visual SourceSafe ....................................................................................... 203
9.2.7
Undoing a check out command in Visual SourceSafe................................................................................ 203
9.2.8
Viewing the history of files in Visual SourceSafe ..................................................................................... 204
9.3
Visual SourceSafe command options.................................................................................................................... 205
9.4
Version Control setup ........................................................................................................................................... 205
9.5
Specifying file locations........................................................................................................................................ 206
9.6
Adding Visual SourceSafe commands.................................................................................................................. 207
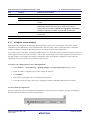
10. Sharing Projects by Network Facilities........................................................................................ 210
10.1
Sharing projects by network facilities in a PC with Windows® XP Service Pack 2 or later................................ 211
REJ10J2169-0100 Rev.1.00
Jul 01, 2010
Page iv
High-performance Embedded Workshop V.4.08
10.2
10.3
10.4
10.5
10.6
Contents
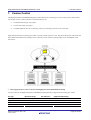
Enabling network facilities to share projects ........................................................................................................ 213
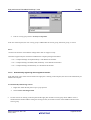
Setting the administrator user's password ............................................................................................................. 214
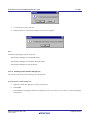
Adding new users to the system............................................................................................................................ 215
Changing your password....................................................................................................................................... 216
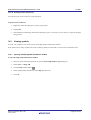
Note on using the network facilities to share projects........................................................................................... 216
11. Comparing Files........................................................................................................................... 218
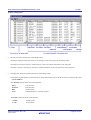
11.1
Opening the Difference window ........................................................................................................................... 218
12. Navigation Facilities .................................................................................................................... 222
12.1
12.2
12.3
12.4
12.5
C function and #define navigation component ..................................................................................................... 224
C++ navigation component................................................................................................................................... 225
Jump to a definition from the editor...................................................................................................................... 227
Drag and drop navigation items ............................................................................................................................ 228
Smart edit capability ............................................................................................................................................. 229
13. Map .............................................................................................................................................. 231
13.1 Managing section settings..................................................................................................................................... 233
13.1.1
Opening the Map Section Information window ......................................................................................... 233
13.1.2
Entering/exiting the edit mode ................................................................................................................... 236
13.1.3
Adding a section group .............................................................................................................................. 237
13.1.4
Adding a section......................................................................................................................................... 238
13.1.5
Adding an overlay group............................................................................................................................ 238
13.1.6
Automatically registering the unregistered section .................................................................................... 239
13.1.7
Editing a selected item ............................................................................................................................... 240
13.1.8
Setting the primary section......................................................................................................................... 240
13.1.9
Setting a memory map................................................................................................................................ 241
13.1.10 Automatically allocating the memory resource.......................................................................................... 241
13.1.11 Printing out the section settings tree........................................................................................................... 242
13.1.12 Viewing unallocated areas.......................................................................................................................... 243
13.1.13 Viewing sections of size 0.......................................................................................................................... 243
13.1.14 Viewing the source code for the address .................................................................................................... 243
13.1.15 Printing out the section list......................................................................................................................... 244
13.2 Viewing symbols .................................................................................................................................................. 244
13.2.1
Opening the Map Symbol Information window......................................................................................... 244
13.2.2
Printing out the map list ............................................................................................................................. 246
13.2.3
Finding symbols ......................................................................................................................................... 247
13.2.4
Filtering the symbol information................................................................................................................ 247
13.2.5
Viewing the source code for the address .................................................................................................... 249
13.2.6
Printing out the symbol information........................................................................................................... 249
14. Command Line............................................................................................................................. 250
14.1
14.2
14.3
14.4
14.5
14.6
14.7
14.8
14.9
Opening the Command Line window ................................................................................................................... 250
Specifying a batch file........................................................................................................................................... 254
Executing a batch file............................................................................................................................................ 256
Stopping command execution ............................................................................................................................... 256
Specifying a log file .............................................................................................................................................. 256
Starting or stopping logging.................................................................................................................................. 257
Entering a full path to the file ............................................................................................................................... 257
Pasting a placeholder ............................................................................................................................................ 257
Selecting all the window contents......................................................................................................................... 257
REJ10J2169-0100 Rev.1.00
Jul 01, 2010
Page v
High-performance Embedded Workshop V.4.08
14.10
14.11
14.12
14.13
14.14
14.15
14.16
14.17
14.18
Contents
Copying the selection onto the clipboard.............................................................................................................. 257
Cutting out the selection to the clipboard.............................................................................................................. 257
Pasting the contents of the clipboard .................................................................................................................... 258
Clearing the contents of the Command Line window........................................................................................... 258
Undoing the last operation .................................................................................................................................... 258
Checking brace matching...................................................................................................................................... 258
Resetting the status of a batch file......................................................................................................................... 259
Single-stepping in a batch file............................................................................................................................... 259
Setting a breakpoint in a batch file........................................................................................................................ 261
15. Macro-Recording Support Facility .............................................................................................. 262
15.1 Macro menu and toolbar ....................................................................................................................................... 262
15.2 Using the Macro dialog box.................................................................................................................................. 264
15.3 Importing a macro file with existing macros ........................................................................................................ 266
15.4 Recording a macro ................................................................................................................................................ 266
15.5 Functions that can be recorded into macro files.................................................................................................... 267
15.5.1
Recordable functions (common to all High-performance Embedded Workshop products)....................... 267
15.5.2
Recordable functions (dependent on the debugger) ................................................................................... 272
15.6 Playing a macro..................................................................................................................................................... 282
15.7 Editing a macro ..................................................................................................................................................... 283
15.8 Assigning a macro................................................................................................................................................. 283
15.9 Configuring the Macro tab of the Output window ................................................................................................ 284
16. Test Support Facility.................................................................................................................... 286
16.1 Creating a test suite ............................................................................................................................................... 286
16.2 Opening and closing test suites ............................................................................................................................. 287
16.3 Editing a test suite................................................................................................................................................. 288
16.4 Adding tests to the test suite ................................................................................................................................. 289
16.5 Creating a test image file ...................................................................................................................................... 291
16.6 Functions that can be saved as test-image data into test-image files..................................................................... 292
16.6.1
Functions that can be saved into test-image files (common to all High-performance Embedded Workshop
products) 293
16.6.2
Functions that can be saved into test-image files (dependent on the debugger)......................................... 300
16.7 Comparing a test image file .................................................................................................................................. 315
16.8 Running tests......................................................................................................................................................... 315
16.9 Using the test browser........................................................................................................................................... 317
16.10 Configuring the Test tab of the Workspace window............................................................................................. 318
16.11 Configuring the Test tab of the Output window ................................................................................................... 319
17. Debugging Facility....................................................................................................................... 321
17.1 Preparations for debugging ................................................................................................................................... 321
17.1.1
Compiling for debug .................................................................................................................................. 321
17.1.2
Selecting a debugger .................................................................................................................................. 321
17.1.3
Editing project configuration...................................................................................................................... 333
17.1.4
Configuring the debugger........................................................................................................................... 334
17.1.5
Downloading modules................................................................................................................................ 341
17.1.6
Debugger sessions ...................................................................................................................................... 356
17.2 Viewing a program ............................................................................................................................................... 362
17.2.1
Opening the Editor window ....................................................................................................................... 363
17.2.2
Opening the Disassembly window ............................................................................................................. 371
17.2.3
Looking at the current PC position............................................................................................................. 379
REJ10J2169-0100 Rev.1.00
Jul 01, 2010
Page vi
High-performance Embedded Workshop V.4.08
Contents
17.2.4
Highlighting the line at the PC ................................................................................................................... 379
17.3 Operating memory ................................................................................................................................................ 380
17.3.1
Opening the Memory window.................................................................................................................... 380
17.3.2
Setting data at a desired address in the Memory window .......................................................................... 383
17.3.3
Selecting a memory range .......................................................................................................................... 384
17.3.4
Filling an area of memory with constant data ............................................................................................ 385
17.3.5
Copying an area of memory ....................................................................................................................... 386
17.3.6
Comparing the memory contents................................................................................................................ 386
17.3.7
Testing an area of memory......................................................................................................................... 387
17.3.8
Saving memory contents in a text file ........................................................................................................ 387
17.3.9
Finding a value in memory......................................................................................................................... 388
17.3.10 Changing the display address ..................................................................................................................... 389
17.3.11 Changing the scroll area ............................................................................................................................. 389
17.3.12 Starting address to value of the register ..................................................................................................... 390
17.3.13 Tracking the stack pointer position ............................................................................................................ 390
17.3.14 Changing the program display position immediately after downloading................................................... 390
17.3.15 Refreshing the Memory window ................................................................................................................ 391
17.3.16 Disabling refresh of the Memory window.................................................................................................. 391
17.3.17 Regularly refreshing the Memory window................................................................................................. 391
17.3.18 Specifying the refresh interval ................................................................................................................... 391
17.3.19 Changing the data length............................................................................................................................ 392
17.3.20 Changing the radix ..................................................................................................................................... 392
17.3.21 Changing the code...................................................................................................................................... 393
17.3.22 Setting the layout........................................................................................................................................ 393
17.3.23 Changing the number of digits displayed ................................................................................................... 394
17.3.24 Switching display or non-display of measurement result........................................................................... 394
17.3.25 Saving an area of memory.......................................................................................................................... 394
17.3.26 Loading a memory area from a file ............................................................................................................ 395
17.3.27 Splitting up the window display ................................................................................................................. 396
17.3.28 Verifying a memory area............................................................................................................................ 396
17.3.29 Changing text colors................................................................................................................................... 396
17.4 Displaying memory contents as an Image............................................................................................................. 397
17.4.1
Opening the Image window ....................................................................................................................... 397
17.4.2
Regularly refreshing the Image window .................................................................................................... 401
17.4.3
Refreshing the Image window.................................................................................................................... 402
17.4.4
Specifying the refresh interval ................................................................................................................... 402
17.4.5
Viewing Images as Consecutive Frames .................................................................................................... 402
17.4.6
Displaying the pixel information................................................................................................................ 406
17.5 Displaying memory contents as Waveforms......................................................................................................... 406
17.5.1
Opening the Waveform window ................................................................................................................ 406
17.5.2
Regularly refreshing the Waveform window ............................................................................................. 408
17.5.3
Refreshing the Waveform window............................................................................................................. 408
17.5.4
Specifying the refresh interval ................................................................................................................... 409
17.5.5
Zoom-in display ......................................................................................................................................... 409
17.5.6
Zoom-out display ....................................................................................................................................... 409
17.5.7
Resetting the zoom display......................................................................................................................... 409
17.5.8
Setting the zoom magnification.................................................................................................................. 410
17.5.9
Setting the horizontal scale......................................................................................................................... 410
17.5.10 Non-display of cursor................................................................................................................................. 410
17.5.11 Displaying the sampling information ......................................................................................................... 410
17.6 Looking at I/O memory......................................................................................................................................... 411
REJ10J2169-0100 Rev.1.00
Jul 01, 2010
Page vii
High-performance Embedded Workshop V.4.08
Contents
17.6.1
Opening the IO window ............................................................................................................................. 411
17.6.2
Expanding an I/O register display .............................................................................................................. 412
17.6.3
Modifying the values of I/O registers......................................................................................................... 413
17.6.4
Refreshing the IO window ......................................................................................................................... 413
17.6.5
Disabling refresh of the IO window ........................................................................................................... 413
17.6.6
Selecting the I/O register(s) to view........................................................................................................... 414
17.6.7
Loading an I/O file ..................................................................................................................................... 415
17.6.8
Printing the currently displayed contents ................................................................................................... 416
17.6.9
Saving the currently displayed contents ..................................................................................................... 416
17.6.10 Finding an I/O register ............................................................................................................................... 416
17.6.11 Finding the next.......................................................................................................................................... 417
17.7 Looking at registers............................................................................................................................................... 417
17.7.1
Opening the Register window .................................................................................................................... 417
17.7.2
Changing the register display radix............................................................................................................ 418
17.7.3
Switching Register Bank ............................................................................................................................ 419
17.7.4
Setting the layout........................................................................................................................................ 419
17.7.5
Choosing a register to be displayed............................................................................................................ 420
17.7.6
Modifying register contents........................................................................................................................ 421
17.7.7
Setting the flag value.................................................................................................................................. 421
17.7.8
Splitting up the window display ................................................................................................................. 422
17.7.9
Saving register contents.............................................................................................................................. 422
17.7.10 Refreshing the Register window ................................................................................................................ 422
17.7.11 Disabling refresh of the Register window .................................................................................................. 422
17.7.12 Using register contents ............................................................................................................................... 423
17.7.13 Changing text colors................................................................................................................................... 423
17.8 Specifying the radix .............................................................................................................................................. 423
17.9 Resetting the target MCU ..................................................................................................................................... 424
17.10 Setting PC to the address at cursor........................................................................................................................ 424
17.11 Initializing the debugger ....................................................................................................................................... 424
17.12 Connecting/disconnecting the debugger ............................................................................................................... 424
17.13 Executing your program........................................................................................................................................ 425
17.13.1 Continuing run ........................................................................................................................................... 425
17.13.2 Running from reset..................................................................................................................................... 425
17.13.3 Running program, ignoring any breakpoints.............................................................................................. 426
17.13.4 Running to cursor ....................................................................................................................................... 426
17.13.5 Running from a specified address .............................................................................................................. 427
17.13.6 Continuing execution to a main function at a reset .................................................................................... 427
17.13.7 Single step .................................................................................................................................................. 428
17.13.8 Multiple steps ............................................................................................................................................. 429
17.14 Stopping your program ......................................................................................................................................... 430
17.14.1 Stopping the program by the Halt toolbar button ....................................................................................... 430
17.14.2 Standard breakpoints (PC breakpoints) ...................................................................................................... 430
17.15 Viewing the current status..................................................................................................................................... 432
17.16 Viewing the function call history.......................................................................................................................... 433
17.16.1 Opening the Stack Trace window............................................................................................................... 433
17.16.2 Viewing the source program ...................................................................................................................... 434
17.16.3 Specifying the view.................................................................................................................................... 434
17.16.4 Selecting an encoding format ..................................................................................................................... 435
17.17 Using an external debugger................................................................................................................................... 435
17.17.1 Configuring the Hitachi Debugging Interface to integrate with High-performance Embedded Workshop 435
17.17.2 Configuring the PD debugger to integrate with High-performance Embedded Workshop........................ 436
REJ10J2169-0100 Rev.1.00
Jul 01, 2010
Page viii
High-performance Embedded Workshop V.4.08
Contents
17.17.3 Configuring an external debugger to integrate with High-performance Embedded Workshop ................. 437
17.18 Debugging functions dependent on the debugger ................................................................................................. 438
17.18.1 Looking at labels ........................................................................................................................................ 438
17.18.2 Elf/Dwarf2 support..................................................................................................................................... 442
17.18.3 Looking at variables ................................................................................................................................... 446
18. Synchronized Debugging............................................................................................................. 466
18.1 The Synchronized Debug dialog box.................................................................................................................... 466
18.1.1
Managing configurations............................................................................................................................ 467
18.1.2
Defining the synchronized Debuggers ....................................................................................................... 469
18.1.3
Setting the synchronization options............................................................................................................ 472
18.1.4
Setting the memory update option.............................................................................................................. 474
18.1.5
Synchronized debugging mode .................................................................................................................. 474
18.1.6
Start synchronized debugging .................................................................................................................... 475
18.1.7
Update synchronized debugging ................................................................................................................ 475
18.1.8
Stop synchronized debugging .................................................................................................................... 475
18.2 Using High-performance Embedded Workshop while synchronized ................................................................... 475
18.2.1
Common functionality................................................................................................................................ 476
18.2.2
Parallel mode functionality ........................................................................................................................ 479
18.2.3
Internal mode functionality ........................................................................................................................ 480
18.3 Using the command line window when synchronized.......................................................................................... 482
18.4 Glossary of terms .................................................................................................................................................. 483
19. Technical Support ........................................................................................................................ 484
19.1
19.2
19.3
Viewing the version information .......................................................................................................................... 484
Check for updates ................................................................................................................................................. 484
Creating a bug report ............................................................................................................................................ 485
Reference ........................................................................................................................................... 486
1. Main Menus ................................................................................................................................... 487
1.1
1.2
1.3
1.4
1.5
1.6
1.7
1.8
1.9
1.10
1.11
File Menu Options ................................................................................................................................................ 487
Edit Menu Options................................................................................................................................................ 487
View Menu Options .............................................................................................................................................. 489
Project Menu Options ........................................................................................................................................... 490
Build Menu Options.............................................................................................................................................. 490
Debug Menu Options ............................................................................................................................................ 491
Setup Menu Options ............................................................................................................................................. 492
Tools Menu Options ............................................................................................................................................. 493
Test Menu Options................................................................................................................................................ 493
Window Menu Options......................................................................................................................................... 494
Help Menu Options............................................................................................................................................... 494
2. Windows ........................................................................................................................................ 495
3. Commands ..................................................................................................................................... 496
3.1
3.2
Command List (Alphabetic Order) ....................................................................................................................... 496
Command List (Listed by Function) ..................................................................................................................... 498
4. Regular Expressions....................................................................................................................... 501
REJ10J2169-0100 Rev.1.00
Jul 01, 2010
Page ix
High-performance Embedded Workshop V.4.08
Contents
5. Placeholders ................................................................................................................................... 502
5.1
5.2
5.3
5.4
What is a placeholder? .......................................................................................................................................... 502
Inserting a placeholder .......................................................................................................................................... 502
Available placeholders.......................................................................................................................................... 504
Placeholder tips..................................................................................................................................................... 505
6. I/O File Format .............................................................................................................................. 506
7. Symbol File Format ....................................................................................................................... 508
8. Keyboard Shortcuts........................................................................................................................ 509
9. Drag and Drop in the Debugger..................................................................................................... 512
10. Using Labels to View Your Code................................................................................................ 513
11. Integrated Toolbars in a Components View ................................................................................ 515
12. To Build in Toolchain for High-performance Embedded Workshop V.1.x ................................ 518
13. HMAKE User Guide.................................................................................................................... 519
13.1
13.2
13.3
13.4
13.5
Command line....................................................................................................................................................... 519
File syntax............................................................................................................................................................. 519
Description blocks ................................................................................................................................................ 520
Comments ............................................................................................................................................................. 523
Message commands .............................................................................................................................................. 523
REJ10J2169-0100 Rev.1.00
Jul 01, 2010
Page x
High-performance Embedded Workshop V.4.08
1. Overview
1. Overview
The functions for High-performance Embedded Workshop are explained in this manual.
This chapter describes the fundamental concepts of the High-performance Embedded Workshop.
1.1
Workspace and project(s)
High-performance Embedded Workshop has a concept of “Workspace” and “Project”.
•
Workspace
Workspace is a largest unit when you make the program with High-performance Embedded Workshop. Workspace can
have several projects. When you create a workspace, more than one project is needed, and one project is automatically
made when you create the workspace.
•
Project(s)
When you make the program, sometimes you make a certain function as a library and make hierarchical levels between
several modules. In such cases, you can also create the library project and insert it to a workspace.
1.2
Main window
There are three main windows: the workspace window, the editor window and the output window. The workspace
window shows the projects and files that are currently in the workspace; the editor window provides file viewing and
editing facilities; and the output window shows the results of a various processes (e.g. build, version control commands
and so on).
REJ10J2169-0100 Rev.1.00
Jul 01, 2010
Page 1 of 523
High-performance Embedded Workshop V.4.08
1.2.1
1. Overview
Title bar
The title bar displays the name of current activate project and file. It also contains the standard Minimize, Maximize and
Close buttons. Click the Minimize button to minimize the High-performance Embedded Workshop on the Windows®
task bar. Click the Maximize button to force High-performance Embedded Workshop to fill the screen. Click the Close
button to close the High-performance Embedded Workshop (this has the same effect as selecting [File -> Exit], or
pressing ALT+F4).
1.2.2
Menu bar
The menu bar initially contains eleven menus: File, Edit, View, Project, Build *, Debug, Setup, Tools, Test, Window
and Help. All of the menu options are grouped logically under these headings. For instance, if you want to open a file
then the File menu is where you will find the right menu option; if you want to set-up a tool then the Tools menu is the
correct selection.
Note:
*. If you use a debug-only project "Debugger only - xxxxxx" created by High-performance Embedded Workshop V.4.01
or a later version, the Build menu will not be displayed by default. The Build menu is displayed, however, if the
debug-only project "Debugger only - xxxxxx" has been created by High-performance Embedded Workshop earlier
than V.4.01.
REJ10J2169-0100 Rev.1.00
Jul 01, 2010
Page 2 of 523
High-performance Embedded Workshop V.4.08
1.2.3
1. Overview
Toolbars
The toolbars provide a shortcut to the options that you will use the most often. There are twelve default toolbars: Editor,
Search, Templates, Bookmarks, Default Window, Standard, Version Control, Map, Macros, Debug, Debug Run,
and System Tools (as shown in the figures below).
With the default session, the High-performance Embedded Workshop does not initially display buttons of Version
Control and peripheral functions on the toolbar.
If you use a debug-only project “Debugger only - xxxxxx” created by High-performance Embedded Workshop V.4.01 or
a later version, Editor, Search, Templates, Bookmarks, Default Window, and Standard will not be displayed by
default.
Toolbars can be created, modified and removed via [Tools -> Customize] (see section 6.1, Customizing the toolbars, for
further information).
Editor toolbar
Search toolbar
Templates toolbar
Bookmarks toolbar
Default Window toolbar
REJ10J2169-0100 Rev.1.00
Jul 01, 2010
Page 3 of 523
High-performance Embedded Workshop V.4.08
1. Overview
Standard toolbar
Version Control toolbar
This toolbar is only available when a version control tool is being used in the current project.
Map toolbar
Macros toolbar
You can add a customized button, to which a created macro has been assigned, on the right to the standard macro buttons
on the toolbar as shown below.
Debug toolbar
This toolbar is only available when a session is being used which has a target attached.
Debug Run toolbar
This toolbar is only available when a session is being used which has a target attached.
REJ10J2169-0100 Rev.1.00
Jul 01, 2010
Page 4 of 523
High-performance Embedded Workshop V.4.08
1. Overview
System Tools toolbar
You can add an external tool button, to which an external tool menu has been assigned, on the right to the system tool
button on the toolbar as shown below.
When the Standard toolbar is docked, it has a Control bar as shown in the figure below. If you want to move the docked
Standard toolbar, click and drag its Control bar to the new location.
The figure below shows the Standard toolbar when it is docked and also when it is floating.
To dock a toolbar
Select one of the following operations:
•
Double-click on the title bar of a floating toolbar, OR
•
Drag the title bar of a floating toolbar and draw it toward an edge of a docked window, menu bar, toolbar or the
High-performance Embedded Workshop main frame, on whose edge you would like to dock the window, until
the shape of the floating bar changes.
To float a toolbar
Select one of the following operations:
•
Double-click on the control bar of a docked toolbar, OR
•
Drag the control bar of a docked toolbar and draw it away from the edge of the High-performance Embedded
Workshop main frame and from an edge of the other docked windows, menu bar or toolbars.
REJ10J2169-0100 Rev.1.00
Jul 01, 2010
Page 5 of 523
High-performance Embedded Workshop V.4.08
1.2.4
1. Overview
Workspace window
The Workspace window has four tabs (Projects, Templates, Navigation, and Test).
•
Projects tab
Allows you to show the current workspace, projects and files. You can quickly open any project file or dependent file by
double-clicking on its icon. See section 2.2, Configuring the Projects tab of the Workspace window, for more information
on the Projects tab.
If you hover the mouse pointer over a file in the Projects tab then the file’s full path will be displayed in a tool tip.
•
Templates tab
Allows you to display template settings. See section 4.11, Templates, for more information about a template.
•
Navigation tab
REJ10J2169-0100 Rev.1.00
Jul 01, 2010
Page 6 of 523
High-performance Embedded Workshop V.4.08
1. Overview
Allows you to provide jumps to various textual constructs within your project’s files. What is actually displayed within
the Navigation tab depends upon what components are currently installed. The figure above shows C macro definitions
(C Defines) and C functions (C Functions) conforming to the ANSI standard. See Chapter 12, Navigation Facilities, for
more information about navigation.
•
Test tab
Allows you to setup or view test suites as part of the test-support facility. See Chapter 16, Test Support Facility, for more
information about the test-support facility.
To allow the Workspace window or the Output window docking
Right-click anywhere inside the Workspace window or the Output window. Then a pop-up menu will be displayed.
If the Allow Docking option is checked, docking is allowed. Otherwise, docking is not allowed. Select the Allow
Docking option to check or un-check it.
When the Allow Docking option is checked, you can dock a window, toolbar or menu bar to the edge of the Highperformance Embedded Workshop main window or to the edge of another docked window. You can also float them
‘above’ the other High-performance Embedded Workshop windows or outside the High-performance Embedded
Workshop main window. Figure (i) below shows a docked “Workspace” window, and figure (ii) below shows a floating
“Workspace” window.
When the Workspace window or the Output window is docked, it has a control bar as shown below.
If you want to move a docked window, click and drag its control bar to the new location.
REJ10J2169-0100 Rev.1.00
Jul 01, 2010
Page 7 of 523
High-performance Embedded Workshop V.4.08
1. Overview
To dock the Workspace window or the Output window
1.
Ensure that the Allow Docking option is checked on the window’s pop-up menu.
2.
Select one of the following operations:
•
Double-click on the title bar of a floating window, OR
•
Drag the title bar of a floating window and draw it toward an edge of a docked window, menu bar or toolbar,
or the High-performance Embedded Workshop main frame, on whose edge you would like to dock the
windows.
To float the Workspace window or the Output window
1.
Ensure that the Allow Docking option is checked on the window’s pop-up menu.
2.
Select one of the following operations:
•
Double-click on the control bar of a docked window, OR
•
Drag the control bar of a docked window and draw it away from the edge of the High-performance
Embedded Workshop main frame and from an edge of the other docked windows, menu bar or toolbar.
•
Drag the control bar of a docked window while pressing the "CTRL" key.
To hide the Workspace window or the Output window
Select one of the following operations:
•
Click on the close button, which is located in the top right corner of the window, OR
•
Right-click anywhere inside a floating window and select the Hide option on the pop-up menu.
To show the Workspace window or the Output window
Select [View -> Workspace] or [View -> Output] respectively.
1.2.5
Editor window
The editor window is where you will work with the files of your project. The High-performance Embedded Workshop
allows you to have many files open at one time, to switch between them, to arrange them and to edit them in whichever
order you want to. By default, the editor window is displayed in a notebook style. This means that each file has a separate
tab associated with it to aid in navigating between files (see the figure below).
REJ10J2169-0100 Rev.1.00
Jul 01, 2010
Page 8 of 523
High-performance Embedded Workshop V.4.08
1. Overview
The editor contains a gutter (column) on the left-hand side of the window. The standard column allows the user to
configure the position of bookmarks and software breakpoints (*) quickly and easily. If you are unsure what purpose a
column has or what the information it is displaying is if you place the mouse pointer over the column a tool tip (pop-up
window) is displayed showing its identity.
The editor window can be customized via the Format Views dialog box, which can be invoked via [Setup -> Format
Views]. This dialog box allows you to configure fonts, colors, tabs and so on for the editor window. It also allows the
user to change the look of other views, which have been installed by High-performance Embedded Workshop. If you
would prefer to use your favorite editor rather than the High-performance Embedded Workshop internal editor then
specify your alternative in the Options dialog box, which can be invoked via [Setup -> Options]. For further details on
how to use the editor, see Chapter 4 Editor.
Note:
*. Allows you to set software breakpoints only when the debugger is connected.
1.2.6
Output window
The Output window, by default, has seven tabs (Build, Debug, Find in Files 1, Find in Files 2, Macro, Test, and
Version Control) on display.
REJ10J2169-0100 Rev.1.00
Jul 01, 2010
Page 9 of 523
High-performance Embedded Workshop V.4.08
1. Overview
Build tab
The Build tab shows the output from any build process (e.g. compiler, assembler and so on). If an error is encountered in
a source file, an icon and the error message will be displayed in the Build tab, along with the source file name and line
number.
If you click on a toolbar button or pop-up menu option associated with display of error messages, the line of the error
message will be highlighted and the editor will show the source code of that line (if the line has any source code).
Double-clicking the line of an error message will also show the source code in the editor.
When you attempt an operation to display an error or warning, the status bar shows this error or warning message.
Right-clicking displays a pop-up menu containing available options.
A basic operation is allocated to the toolbar.
The functions of Toolbar display and Customize toolbar are also included in the pop-up menu displayed by rightclicking the toolbar area.
Pop-up Menu Option
Toolbar Button Function
-
Highlights the next occurrence of error and shows the source
code in the editor.
-
Highlights the previous occurrence of error and shows the source
code in the editor.
-
Highlights the next occurrence of warning and shows the source
code in the editor.
-
Highlights the previous occurrence of warning and shows the
source code in the editor.
Display next Error/Warning/Info
Displays the editor that generated the next build error or warning.
Display previous Error/Warning/Info
Displays the editor that generated the previous build error or
warning.
Help
Shows the help information about the line.
Go to Error/Warning/Info
-
Goes to the associated source line.
Clear Window
Clears the contents of the window.
Save
Saves the contents of the window into a text file.
Copy
Copies the selected contents onto the Windows® clipboard.
Toolbar display
-
Shows or hides the toolbar.
Customize toolbar
-
Customizes toolbar buttons.
The Build tab also shows an icon corresponding to the error message output by build execution.
Icon Name
Icon
Error Message Level
Build Error
Error
Build Warning
Warning
Information
Information
REJ10J2169-0100 Rev.1.00
Jul 01, 2010
Page 10 of 523
High-performance Embedded Workshop V.4.08
1. Overview
Debug tab
Shows the output from any debugger process. Any debug component that needs to display information will send its
output to this window.
Right-clicking displays a pop-up menu containing available options.
A basic operation is allocated to the toolbar.
The functions of Toolbar display and Customize toolbar are also included in the pop-up menu displayed by rightclicking the toolbar area.
Pop-up Menu Option
Toolbar Button
Function
Clear Window
Clears the contents of the window.
Save
Saves the contents of the window into a text file.
Copy
Copies the selected contents onto the Windows® clipboard.
Toolbar display
-
Shows or hides the toolbar.
Customize toolbar
-
Customizes toolbar buttons.
Find in Files 1 and Find in Files 2 tab
Shows the results of the last Find in Files action. To activate find in files, select [Edit -> Find In Files], or click the
Find In Files toolbar button. For further details on using Find in Files, see section 4.4.2, Finding text in multiple files.
Right-clicking displays a pop-up menu containing available options.
A basic operation is allocated to the toolbar.
The functions of Toolbar display and Customize toolbar are also included in the pop-up menu displayed by rightclicking the toolbar area.
Pop-up Menu Option
Toolbar Button
Function
Go to Occurrence
-
Go to the associated source line.
Clear Window
Clears the contents of the window.
Save
Saves the contents of the window into a text file.
Copy
Copies the selected contents onto the Windows® clipboard.
Toolbar display
-
Shows or hides the toolbar.
Customize toolbar
-
Customizes toolbar buttons.
Macro tab
Shows the current records of macros (macro-recording support facility). You can view information such as Highperformance Embedded Workshop command-line commands recorded into a High-performance Embedded Workshop
macro file from execution of [Tools -> Macro Recording] to [Tools -> Stop Macro]. It is also possible to view this
information while recording. For details on the macro-recording support facility, see Chapter 15, Macro-Recording
Support Facility.
REJ10J2169-0100 Rev.1.00
Jul 01, 2010
Page 11 of 523
High-performance Embedded Workshop V.4.08
1. Overview
Right-clicking displays a pop-up menu containing available options.
A basic operation is allocated to the toolbar.
The functions of Toolbar display and Customize toolbar are also included in the pop-up menu displayed by rightclicking the toolbar area.
Pop-up Menu Option
Toolbar Button
Function
Clear Window
Clears the contents of the window.
Save
Saves the contents of the window into a text file.
Copy
Copies the selected contents onto the Windows® clipboard.
Toolbar display
-
Shows or hides the toolbar.
Customize toolbar
-
Customizes toolbar buttons.
Test tab
Shows the results and progress of the current test execution (test support facility). The test execution progress shows the
current test being executed and the number of tests remaining. If errors occur then these are displayed in this window.
For details on the test-support facility, see Chapter 16, Test Support Facility.
Right-clicking displays a pop-up menu containing available options.
A basic operation is allocated to the toolbar.
The functions of Toolbar display and Customize toolbar are also included in the pop-up menu displayed by rightclicking the toolbar area.
Pop-up Menu Option
Toolbar Button
Function
Clear Window
Clears the contents of the window.
Save
Saves the contents of the window into a text file.
Copy
Copies the selected contents onto the Windows® clipboard.
Toolbar display
-
Shows or hides the toolbar.
Customize toolbar
-
Customizes toolbar buttons.
Version Control tab
Shows the results of version control actions. The tab is only displayed if a version control system is in use. For further
details on version control, see Chapter 7, Version Control.
Right-clicking displays a pop-up menu containing available options.
A basic operation is allocated to the toolbar.
REJ10J2169-0100 Rev.1.00
Jul 01, 2010
Page 12 of 523
High-performance Embedded Workshop V.4.08
1. Overview
The functions of Toolbar display and Customize toolbar are also included in the pop-up menu displayed by rightclicking the toolbar area.
Pop-up Menu Option
Toolbar Button
Function
Clear Window
Clears the contents of the window.
Save
Saves the contents of the window into a text file.
Copy
Copies the selected contents onto the Windows® clipboard.
Toolbar display
-
Shows or hides the toolbar.
Customize toolbar
-
Customizes toolbar buttons.
Press the "SHIFT+ESC" key, and the Output window closes.
The color of text or background and font shown in the Output window can be customized in the same manner as in other
windows. You can also customize the Build tab of the Output window so that the texts in the lines of error messages will
be highlighted in a color different from that of the texts in other lines.
To customize the current colors
1.
Select [Setup -> Format Views] to open the Format Views dialog box.
2.
Select the Output item from the tree in the left-hand section of the dialog box and expand it.
3.
Select the category for which you wish to change the color from the table below.
Category
Foreground Color of the
Color Tab (Default)
Background Color of the Tab(s) to be
Color Tab (Default)
Applied
Type of Output
to be Applied
Text
SYSTEM
SYSTEM
All tabs
All
Build Error Text
Black
White
Build
Error
Build Warning Text
Black
White
Build
Warning
Information Text
Black
White
Build
Information
4.
Change the selection in the Foreground and Background lists of the Color tab.
5.
Click the OK button.
1.2.7
Status bar
The status bar displays various information about the current state of the High-performance Embedded Workshop. The
figure below shows the status bar.
REJ10J2169-0100 Rev.1.00
Jul 01, 2010
Page 13 of 523
High-performance Embedded Workshop V.4.08
1. Overview
The customizable status bar feature allows the user to customize the display of the status bar area and its contents. The
status bar will also now show target-related information where required by the specific target being used.
The bottom section of the status bar area shows the standard application-based information as in previous version of
High-performance Embedded Workshop. Above this is the target-related information. The information displayed here is
completely target dependant, and in some cases there may not be any target-related information to display.
The status bar can be switched on and off via [View -> Status Bar]. When any part of the status bar area is visible, this
main menu option will completely switch off the status bar area. When the status bar is completely hidden, this main
menu option will switch on the application-based section of the status bar.
The status bar can also be switched off via the status bar pop-up menu. The pop-up menu allows individual status bar
items to be toggled on and off; including both application and target related areas as well as individual items on each.
The pop-up menu can be displayed by selecting the right-mouse button over the status bar area.
Note:
*. The entire target related area of the status bar is hidden depending on the target being used.
All target related status bar items are switched off, the entire target related area of the status bar will be hidden by default.
This can be re-shown by switching on one or more target related individual status bar items.
1.3
Help system
The Help menu is the rightmost menu on the High-performance Embedded Workshop menu bar. It contains the Help
Topics menu option, which, when selected, takes you to the main High-performance Embedded Workshop help window.
To obtain help on specific dialogs click the context-sensitive help button, which is located in the top right-hand corner of
each dialog (as shown in the figure below).
REJ10J2169-0100 Rev.1.00
Jul 01, 2010
Page 14 of 523
High-performance Embedded Workshop V.4.08
1. Overview
When this is clicked, the mouse pointer will change to a pointer with a question mark above it. Whilst the mouse pointer
is in this state, click on the part of the dialog that you require assistance on. Alternatively, select the control for which
you require help, and press the F1 key.
1.4
Launching the High-performance Embedded Workshop
To initiate the High-performance Embedded Workshop, open the Start menu of Windows®, select Programs, select
Renesas, select High-performance Embedded Workshop, and then select the shortcut of the High-performance
Embedded Workshop. The Welcome! dialog box will be displayed after the start-up screen.
If you have recently used a workspace, Open a recent project workspace is selected by default. Otherwise Create a
new project workspace is selected.
To create a new workspace select the Create a new project workspace button and click the OK button.
To open one of the recent project workspaces select the Open a recent project workspace button, select a workspace
from the drop-down list, and click the OK button. The Recent Workspace list displays the same content as that seen in
the workspace most recently used File list. This list also appears on the File menu.
To open a workspace by specifying a workspace file (".HWS" file), select the Browse to another project workspace
button, and click the OK button.
To open the Synchronized Debug dialog box select the Start synchronized session button and select a configuration
from the drop-down list and click the OK button. This item is only available when a synchronized debugging facility has
been used.
To register or un-register a tool from the High-performance Embedded Workshop, click the Administration button.
Click the Cancel button to use the High-performance Embedded Workshop without opening a workspace.
REJ10J2169-0100 Rev.1.00
Jul 01, 2010
Page 15 of 523
High-performance Embedded Workshop V.4.08
1. Overview
If you do not wish to open the Welcome! dialog box next time you launch the High-performance Embedded Workshop,
select [Setup -> Options]. The Options dialog box opens. Remove a tick mark from the Display Welcome Dialog
checkbox in the Confirmation tab.
If you do not wish to view the start-up screen when launching the High-performance Embedded Workshop, remove a tick
mark from the Display Splash Screen checkbox in the Confirmation tab of the Options dialog box.
1.5
Creating a new workspace
To create a new workspace
1.
Select the Create a new project workspace option from the Welcome! dialog box and click the OK button or
select [File -> New Workspace]. The New Project Workspace dialog box will be displayed.
2.
Enter the name of the new workspace into the Workspace Name field. This can be up to 32 characters in
length and contain letters, numbers, and the underscore character. Especially, do not use a minus sign, or a
space. As you enter the workspace name, the High-performance Embedded Workshop will add a sub-directory
and Project Name for you automatically. This can be changed if desired. This allows the workspace and
project name to be different. To select the directory in which you would like to create the workspace, use the
Browse button or type the directory into the Directory field manually.
3.
Select the CPU family and Tool chain upon which you would like to base the workspace.
4.
When a new workspace is created, the High-performance Embedded Workshop will also automatically create a
project with the name specified in the Project Name field and place it inside the new workspace. The project
types list displays all of the available project types (e.g. Application, Library etc.). Select the type of project that
you want to create from this list. The project types displayed will be all valid types for the current pair of CPU
family and Tool chain. The project types are classified in three classes: toolchain-only, debug-only (Debugger
only - xxxxxx), and full project generator that configures both the debugger and toolchain aspect of the Highperformance Embedded Workshop.
5.
Click the OK button to create the new workspace and project. This then launches the wizard you have selected
to guide you through the creation process.
Note:
It is not possible to create a workspace if one already exists in the same directory.
1.6
Opening a workspace
To open a workspace
1.
Select Browse to another project workspace option from the Welcome! dialog box and click the OK button or
select [File -> Open Workspace]. The Open Workspace dialog box will be displayed.
2.
Select the workspace file (".HWS" file) that you want to open.
REJ10J2169-0100 Rev.1.00
Jul 01, 2010
Page 16 of 523
High-performance Embedded Workshop V.4.08
3.
1. Overview
Click the Select button to open the workspace. If the High-performance Embedded Workshop is set up to
display information when a workspace is opened, the Workspace Properties dialog box will be displayed.
Otherwise, the workspace will be opened.
Note that whether the Workspace Properties dialog box is shown depends on the setting of either the Show
workspace information on workspace open check box in the Workspace Properties dialog box or the Display
workspace information dialog on opening workspace check box on the Workspace tab of the Options dialog
box. The Options dialog box can be invoked via [Setup -> Options]. Click the OK button in the Workspace
Properties dialog box to open the workspace. Click the Cancel button to stop opening the workspace.
The High-performance Embedded Workshop keeps track of the last workspaces that you have opened and adds them to
the File menu under the Recent Workspaces submenu. This gives you a shortcut to opening workspaces, which you
have used recently.
To open a recently used workspace
Select Open a recent project workspace in the Welcome! dialog box, select the name of the workspace from the dropdown list, and then click the OK button.
Another way is to select [File -> Recent Workspaces], and then from this submenu select the name of the workspace.
Note:
The High-performance Embedded Workshop only permits one workspace to be open at a time. Consequently, if you
attempt to open a second workspace, the first will be closed before the new one is opened.
1.7
Using old workspaces
The High-performance Embedded Workshop can open any workspace that was created on a previous version of the
High-performance Embedded Workshop. This should be automatically upgraded when the workspace is opened. A
back-up version of the initial workspace or project file must be saved in the current directory of the file that has been
upgraded.
1.8
Saving a workspace
The amount of information on workspaces (and projects) to be saved increases as the High-performance Embedded
Workshop is upgraded. Thus the format in which workspaces can be saved is slightly different depending on the version
of the High-performance Embedded Workshop.
REJ10J2169-0100 Rev.1.00
Jul 01, 2010
Page 17 of 523
High-performance Embedded Workshop V.4.08
1. Overview
To save a High-performance Embedded Workshop workspace in the current version's format, select [File -> Save
Workspace].
To save the workspace in a previous version's format, select [File -> Save Workspace As]. If the current workspace has
changed since it was last changed, you will be prompted to save it (to the current file and version). The Save Workspace
As dialog box will then be launched:
This contains a list of all the files currently associated with the workspace, a drop-list control containing a list of
available versions (the current version is selected by default) and an edit control where you can enter a short prefix that
will be used to change the name of all the associated files. When the prefix is changed, the File list is updated to display
the new names.
For example, to save the workspace in a format that can be loaded from High-performance Embedded Workshop
V.4.02.00
1.
Set the Format drop-down list: HEW 4.02.00 Format
2.
Enter Prefix: 402_
3.
Click OK.
REJ10J2169-0100 Rev.1.00
Jul 01, 2010
Page 18 of 523
High-performance Embedded Workshop V.4.08
1. Overview
A copy of the workspace will be saved into the current directory (so all the source files, etc. will remain in use) but with
the entered prefix, e.g.:
C:\Workspace\Workspace_Name\402_Workspace_Name.hws
C:\Workspace\Workspace_Name\Projet_Name\402_Projet_Name.hwp
C:\Workspace\Workspace_Name\Projet_Name\402_DefaultSession.hsf
C:\Workspace\Workspace_Name\Projet_Name\402_SimSessionSH-1.hsf
Note that the current workspace remains loaded as the working copy.
1.9
Closing a workspace
To close a High-performance Embedded Workshop workspace, select the [File -> Close Workspace] menu option. If
there are any outstanding changes to the workspace or any of its projects you will be requested whether or not you wish
to save them.
1.10
Exiting the High-performance Embedded Workshop
The High-performance Embedded Workshop can be exited by selecting [File -> Exit], pressing ALT+F4, or by selecting
the close option from the system menu (which is opened by clicking the icon at the upper-left corner of the Highperformance Embedded Workshop title bar).
1.11
Component system overview
The High-performance Embedded Workshop allows the user to extend the High-performance Embedded Workshop
functionality by adding additional components to the system. This is achieved by registering the component in the Tools
Administration dialog box. These components can add windows, menus and toolbars to the High-performance
Embedded Workshop system. Examples of the components are the debugger and builder components of Highperformance Embedded Workshop. The debugger component adds all of the menus and toolbars associated with the
debugger and the builder component does the same for the build functionality. The components you have registered in
the system will modify the look and feel of High-performance Embedded Workshop. In some cases you may not have
some of the menus which you can see in this manual. For instance if the builder component is not installed you will not
have the toolchain menu option in the Build menu.
1.12
Management information files of High-performance Embedded Workshop
The High-performance Embedded Workshop has the following files containing management information necessary for
its correct operation.
REJ10J2169-0100 Rev.1.00
Jul 01, 2010
Page 19 of 523
High-performance Embedded Workshop V.4.08
•
A file in which application-level setting is stored
•
A file in which the default positions of windows are recorded
•
High-performance Embedded Workshop database files
•
Component's data files *
•
Keyboard shortcut layout files
•
Macro information file and newly added macro files
•
Custom project-type wizard files
•
Syntax highlighting files
•
Templates files
•
Synchronized debug option configuration files *
1. Overview
Note:
*. Support for this function depends on the debugger.
These files are specific to each user account on the host computer. When multiple versions of the High-performance
Embedded Workshop are installed, the files specific to each High-performance Embedded Workshop are saved for each
user account.
1.13
Overview of Configurations and Sessions
The drop-down list box on the Standard toolbar shows the current configuration and session.
This example shows the configuration and session in which the Renesas SuperH Standard toolchain was selected at
creation of a project and "SH-4 Simulator" was selected as the target debugger.
You can switch between different configurations and sessions by selecting one in the drop-down list box.
It is also possible to add or delete configurations or sessions as necessary.
REJ10J2169-0100 Rev.1.00
Jul 01, 2010
Page 20 of 523
High-performance Embedded Workshop V.4.08
•
1. Overview
Configuration
What is configuration?
Configurations are the build option settings (e.g., output of debug information or optimization) having their own names.
The term "configuration" can also be referred to as "build configuration".
In the figure of the Standard toolbar shown as an example, configurations "SimDebug_SH-4", "Debug", and "Release"
are available.
Configurations created by the High-performance Embedded Workshop
When a project is created after selection of the toolchain, the High-performance Embedded Workshop automatically
creates configurations "Debug" and "Release".
If you have selected a target debugger at creation of the project, the High-performance Embedded Workshop creates a
configuration suitable for the debugger. If you have selected "SH-4 Simulator" in Targets at creation of the project,
configuration "SimDebug_SH-4" is created.
REJ10J2169-0100 Rev.1.00
Jul 01, 2010
Page 21 of 523
High-performance Embedded Workshop V.4.08
1. Overview
Configuration names can be changed when creating a project. Directories corresponding to each of the configurations are
created under the project directory *. These directories have the names of the configurations.
Note:
*. The project directory having the project name is created under the workspace directory used for creation of a new
workspace.
How to set up build options
To set up build options kept with a configuration, select the configuration from the drop-down list box in the dialog box
for set up build option opened from the Build menu. Options such as the compiler, assembler, and optimizing linkage
editor can be set up. The figure below shows the dialog box used for setup of build options for the Renesas SuperH
Standard toolchain.
REJ10J2169-0100 Rev.1.00
Jul 01, 2010
Page 22 of 523
High-performance Embedded Workshop V.4.08
1. Overview
See section 2.7, Build configurations, for more information about a configuration.
•
Session
What is session?
Sessions, which have their own names, are the units to manage various settings such as High-performance Embedded
Workshop debugger options * used for debugging with connection to the debugger and options specific to the debugger,
and information on the Memory and Register windows and their positions. The term "session" can also be referred to as
"debugger session".
In the figure of the Standard toolbar shown as an example, sessions "SimSessionSH-4" and "DefaultSession" are
available. Information on each session is saved in an individual file in the High-performance Embedded Workshop
project.
Note:
*. There are various option settings such as the debugger to be connected with the High-performance Embedded
Workshop, the object format for debugging, download modules, and the timing of connecting the High-performance
Embedded Workshop with the debugger or executing a command batch by the High-performance Embedded
Workshop.
REJ10J2169-0100 Rev.1.00
Jul 01, 2010
Page 23 of 523
High-performance Embedded Workshop V.4.08
1. Overview
Sessions created by the High-performance Embedded Workshop
When a project is created after selection of the toolchain, the High-performance Embedded Workshop automatically
creates session "DefaultSession". If you have selected a target debugger at creation of the project, a session is
automatically created for connecting the High-performance Embedded Workshop with the selected debugger. For
example, if you have selected "SH-4 Simulator" in "Target" at creation of a project, session "SimSessionSH-4" is
automatically created.
How to set up High-performance Embedded Workshop debugger options
To set up High-performance Embedded Workshop debugger options kept with a session, select the session from the
drop-down list box in the Debug Settings dialog box opened from the Build menu. Options can be set up in the Target
and Options tabs.
See section 17.1.6, Debugger sessions, for more information about a Debugger sessions.
1.14
Overview of Macro-Recording Support facility and Test Support facility
When coding is finished, the program must be tested. If a problem is found in testing, you will need to correct the
problem and re-test the program. Testing takes a significant number of steps in development of programs.
To ease the process of testing, the High-performance Embedded Workshop provides the macro-recording support and
test support facilities.
REJ10J2169-0100 Rev.1.00
Jul 01, 2010
Page 24 of 523
High-performance Embedded Workshop V.4.08
•
1. Overview
Macro-recording support facility
The macro-recording support facility allows you to record operations, which are associated with the High-performance
Embedded Workshop system applications *1, build *2, and debugging *3, as High-performance Embedded Workshop
command-line commands or to execute these recorded commands.
Files to record the operations (High-performance Embedded Workshop macro files) are command line batch files that
have “hdc” as the extension and can be modified. These files are stored in the “Macros” folder within the Highperformance Embedded Workshop management information folder under the application data folder for each user
profile. By default, the file Default.hdc is created.
Note, however, that High-performance Embedded Workshop is not capable of recording all operations in the Highperformance Embedded Workshop system corresponding to the High-performance Embedded Workshop command-line
commands. For the operations that can be recorded, a macro record icon ( ) is shown in the "Macro Recording" column
of the menu list. This indicates that this operation can be recorded into a High-performance Embedded Workshop macro
file.
Notes:
*1. Changing a project, session, or configuration
*2. Compilation and build
*3. Downloading a module, changing a memory value or register value, setting/deleting a software breakpoint, and
running a program
The macro-recording support facility is available in the Tools menu and on the Macros toolbar.
If the Macros toolbar is hidden, select [Setup -> Customize] to open the Customize dialog box. Select the Macros
checkbox on the Toolbars tab of the Customize dialog box.
Tools Menu
Macros Toolbar Function
Macros
-
Macro Recording
REJ10J2169-0100 Rev.1.00
Jul 01, 2010
Opens the Macro dialog box. This dialog box has the following features and lists
the macro names recorded in each of the selected High-performance Embedded
Workshop macro files.
- Creating a new blank macro file
- Importing an existing macro file
- Starting a macro record operation
- Starting a macro play function
- Editing a current macro file
- Assigning the selected macro
- Removing the selected macro
Starts a macro record operation.
Page 25 of 523
High-performance Embedded Workshop V.4.08
Tools Menu
1. Overview
Macros Toolbar Function
Play Macro
The Select Macro Function dialog box opens. Choose which macro you wish to
execute.
-
Pauses the current macro operation.
Stop Macro
Stops the current macro operation.
The procedure from selection of Record Macro ( ) to that of Stop Macro ( ) consists one macro and one Highperformance Embedded Workshop macro file can record multiple macros (a set of High-performance Embedded
Workshop command-line commands). A macro includes multiple High-performance Embedded Workshop commandline commands.
The figure below shows the High-performance Embedded Workshop macro file and macros.
The current records of macros are shown in the Macro tab of the Output window. The "Build" macro in the figure
above is outputted as follows.
See section 1.14.1, Example of test procedures, for an operation procedure.
•
Test support facility
The test support facility allows you to create a test image file of the selected test items (test image data), execute a macro
created by the macro-recording support facility or an existing High-performance Embedded Workshop command batch
file, and compare a test image file with the current High-performance Embedded Workshop system. Test image data can
be saved into a test image file (.HIF).
REJ10J2169-0100 Rev.1.00
Jul 01, 2010
Page 26 of 523
High-performance Embedded Workshop V.4.08
1. Overview
Note, however, that High-performance Embedded Workshop is not capable of acquiring test-image information of all
functions in the High-performance Embedded Workshop system. For the items from which test-image information can be
acquired, see section 16.6, Functions that can be saved as test-image data into test-image files.
The typical test procedure is outlined in the figure below. See section 1.14.1, Example of test procedures, for a test
procedure.
The test support facility is available in the Test menu and in the pop-up menu of the Test tab of the workspace window.
The first step towards using the test support facility is to create a test suite (a set of tests). This is available on the Test
menu. Once a test suite is created, following operations can also be done in the Test tab of the workspace window.
Modify the test suite and specify macros to be executed during the test and the test image file for comparison.
Then select some test items to be saved a test image file. Acquire and save test image of the selected test items, which
you wish to use for comparison.
After completion of the test (macros) the selected test items are compared. The result is displayed in the test browser
window.
If there is any difference between the test result and the saved the test image file, the result of the test item is shown as
“FAIL”. You can view the details of the error by double-clicking the line of this test item.
REJ10J2169-0100 Rev.1.00
Jul 01, 2010
Page 27 of 523
High-performance Embedded Workshop V.4.08
1.14.1
1. Overview
Example of test procedures
This page introduces an example of test procedures, which is a sequence through build and debugging using the macrorecording support facility and test support facility.
This example uses a program that sorts ten random data items written in C language, which are typically included in the
Tutorial project in an emulator debugger or in a project for which "Demonstration" has been selected as the project type
in the SuperH family simulator debugger, in ascending/descending order. This example lets you see a difference in data
stored in an array.
Before starting the test in this example, array “a” in the program code must be changed from a local to global variable.
•
Before test
First, open a workspace and connect the High-performance Embedded Workshop to the debugger.
1.
Create a new project workspace or open an existing project workspace. For creation of a project workspace, see
section 17.1.2, Selecting a debugger.
2.
Select a session, which you wish to use for connection with the debugger, from the session list on the Standard
toolbar. For selection of a session, see section 17.1.6 (1), Selecting a session.
After some operations, a Confirmation Request dialog box may appear. If you have executed build all on the entire
program, a Confirmation Request dialog box appears by default asking if you wish to download the program. To
download the program, click the Yes button.
Since the action of clicking on the buttons in this confirmation dialog box cannot be recorded into macros, this dialog box
will open next time you execute a macro. To continue the macro execution, you should click one of the buttons. The
execution must be continued if you are using the test-support facility, which is used to test a sequence of operations. For
this reason, make the following setting so that the confirmation dialog box will not appear.
In this example, select the Don't ask this question again check box in Confirmation Request dialog box.
REJ10J2169-0100 Rev.1.00
Jul 01, 2010
Page 28 of 523
High-performance Embedded Workshop V.4.08
1. Overview
Save the High-performance Embedded Workshop environment setting that you wish to use for tests so that the
environment for the tests will always be the same.
1.
Select [File -> Save Workspace].
2.
Select [File -> Save Session].
You can always use the same environment to start a test by loading the High-performance Embedded Workshop
environment setting that has been saved.
•
Preparing a test script to be used in the example of test procedures
In this example, use the macro-recording support facility to record the following combination of operations as Highperformance Embedded Workshop command-line commands into a macro. This macro should be used as a test script at
execution of a test.
Classification
Operation
Preparation before the running the program
- Initialize values
- Prepare a program
Reload the session.
(See "Step 1 (2)".)
Initialize register values *.
(See "Step 1 (3)".)
Build the program for demonstration *.
(See "Step 1 (4)".)
Download the program
Download the program for demonstration.
(See "Step 1 (5)".)
Add variables, run the program, and check
the result
Use the memory fill function to set the memory value of array “a” to 0.
(See "Step 1 (6)".
Reset the CPU.
(See "Step 1 (7)".)
Run the program until a selected line within a main function is reached.
(See "Step 1 (9)".)
Add the array, which stores random data, to the Watch window *.
(See "Step 1 (10)".)
Note:
*. Support for this function depends on the debugger.
REJ10J2169-0100 Rev.1.00
Jul 01, 2010
Page 29 of 523
High-performance Embedded Workshop V.4.08
•
1. Overview
Example of test procedures
Invoke the test support facility and select the data in an array (memory content at the address of an array) as the target of
the test. Save test-image information to the test image file that you wish to use for comparison and modify the program
so that the number of times to store data into the array will be reduced. Execute the test and see that the data stored in the
array has changed. Then modify the program again to restore the number of times to store data and execute the test. Make
sure that data in the array is the same that in the saved test image file.
Step 1: Recording a macro
Step 2: Editing a macro (viewing records)
Step 3: Playing a macro
Step 4: Creating a test suite
Step 5: Editing a test suite
Step 6: Creating a test image file
Step 7: Modifying the program before the test
Step 8: Viewing the test result (unmatched)
Step 9: Modifying the program back and executing the test again
Step 10: Viewing the test result (matched)
1.14.2
Step 1: Recording a macro
In this example, use the macro-recording support facility to record the following combination of operations as Highperformance Embedded Workshop command-line commands.
Recorded High-performance Embedded Workshop command-line commands are output to the Macro tab of the Output
window. However, some operations open another tab.
1.
Click the Record Macro button ( ) on the Macros toolbar. The mouse pointer is modified to include the
record icon ( ). The message “Recording...” is shown in the Macro tab of the Output window.
2.
Select [File -> Refresh Session].
This records the refresh_session command.
3.
Click the Registers button ( ) on the CPU toolbar to open the Register window. Double-click the register, of
which you wish to change the value, to invoke the Set Value dialog box. Enter 0 in Value.
This records the register_set command.
4.
Click the Build button ( ) on the Standard toolbar to build the program for demonstration.
This records the build command.
5.
Double-click to download the program for demonstration within the Download modules folder in the Projects
tab of the workspace window.
This records the file_load command.
REJ10J2169-0100 Rev.1.00
Jul 01, 2010
Page 30 of 523
High-performance Embedded Workshop V.4.08
1. Overview
6.
Click the Memory button ( ) on the CPU toolbar to invoke the Display Address dialog box. Enter the
address of the data field in Display Address. Then select Fill from the pop-up menu. Enter 0 as the data in the
Fill dialog box.
This records the memory_fill command.
7.
Click the Reset CPU button ( ) on the Debug Run toolbar to reset the CPU.
This records the reset command.
8.
Open a source file including a main function in the editor window.
9.
Right-click on the last line of the main function and select Go To Cursor from the pop-up menu.
This records the go_till command.
10. Add the array element "a[6]" storing random data to the Watch window.
This records the watch_add command.
11. Click the Stop Macro button ( ) on the Macros toolbar. The mouse pointer returns to be an arrow.
12. The Add New Macro Function dialog box opens. Enter a macro name (e.g., Demo). The message “Finished
recording 'Demo'.” is shown in the Macro tab of the Output window.
To view the recorded High-performance Embedded Workshop command-line commands, be sure to select the Macro tab
of the Output window.
REJ10J2169-0100 Rev.1.00
Jul 01, 2010
Page 31 of 523
High-performance Embedded Workshop V.4.08
1.14.3
1. Overview
Step 2: Editing a macro (viewing records)
1.
Select [Tools -> Macros] to invoke the Macro dialog box. The High-performance Embedded Workshop macro
file “Default”, in which a macro has been recorded, is listed in Current macro file.
2.
Select the macro “Demo” in Macro functions and click the Edit button. The editor window shows the Highperformance Embedded Workshop macro file “Default.hdc”, in which a macro has been recorded.
Within a High-performance Embedded Workshop macro file, the High-performance Embedded Workshop command-line
commands of the operations listed below are included between the lines showing information to identify macros.
When a macro includes operations such as running a program, the Debug tab of the Output window shows information
including the cause of a stop. This may cause difference in comparison of test results. To clear the contents of the tabs in
the Output window, the High-performance Embedded Workshop command-line command clear_output_window is
available. It is possible to add the line at the next line of “#Macro Demo-Start” to clear the information in the Debug tab
of the Output window.
clear_output_window debug
REJ10J2169-0100 Rev.1.00
Jul 01, 2010
Page 32 of 523
High-performance Embedded Workshop V.4.08
Modify the description as required and click the Save File button (
performance Embedded Workshop macro file “Default.hdc”.
1.14.4
1. Overview
) on the Editor toolbar. Close the High-
Step 3: Playing a macro
1.
Click the Play Macro button ( ) on the Macros toolbar. The Select Macro Function dialog box opens.
2.
Selecting the macro “Demo” starts playing the recorded commands. The mouse pointer is modified to include
the play icon (
).
3.
When the playback of a macro is completed, the mouse cursor returns to be an arrow.
1.14.5
Step 4: Creating a test suite
1.
Select [Test -> Create New Test Suite] to invoke the Create New Test Suite dialog box.
2.
Enter “Test_Suite_Demo” in Test suite name.
3.
Initially the workspace directory is shown in Directory for test suite. This can be modified as required.
4.
Click the OK button.
5.
Displays the Test tab of the workspace window. Shows the “Test_Suite_Demo” test-suite icon.
REJ10J2169-0100 Rev.1.00
Jul 01, 2010
Page 33 of 523
High-performance Embedded Workshop V.4.08
1.14.6
1. Overview
Step 5: Editing a test suite
Select the macro recorded at step 1 for running a test.
1.
Right-click on the “Test_Suite_Demo” test-suite icon to display a pop-up menu.
2.
Select Edit Test Suite to open the Modify Test Suite dialog box.
3.
Click the Add button. The Add New Test dialog box opens.
4.
Enter “Test_Demo” in Test name.
5.
Enter “Demonstration” in Test description.
6.
Click the Add button. The Add Test Script dialog box opens.
7.
Select the “Demo” checkbox in Select macros to add to test.
8.
Click the OK button.
REJ10J2169-0100 Rev.1.00
Jul 01, 2010
Page 34 of 523
High-performance Embedded Workshop V.4.08
9.
1. Overview
Test image file shows the test suite name entered at step 4, '_', and test name “Test_Demo” entered in Test
name (test suite name_test name). This can be modified as required.
10. Click the OK button. The test “Test_Demo” is added to the Test cases list.
11. Click the OK button. The “Test_Demo” test icon appears under the “Test_Suite_Demo” test-suite icon.
REJ10J2169-0100 Rev.1.00
Jul 01, 2010
Page 35 of 523
High-performance Embedded Workshop V.4.08
1.14.7
1. Overview
Step 6: Creating a test image file
To compare the Memory content at the address of an array or the contents of the Watch window, the range of data
acquisition must be selected.
The test image of a test item is saved to the test image file "Test_Suite_Demo_Test_Demo.hif" specified at step 5.
1.
Right-click on the “Test_Demo” test icon to display a pop-up menu.
2.
Select Edit Test Image File to invoke the Edit Test Image File dialog box. The title of the dialog box includes
the test name “Test_Demo” and test-image file name “Test_Suite_Demo_Test_Demo.hif”.
3.
Select the checkboxes Memory-xxxxxx (under CPU in Available components) and Watch-xxxxxx (under
Symbol).
4.
The Memory content at the address of an array is saved into the test-image file. Double-click Memory-xxxxxx
under CPU in Available components. The Edit Test Memory Ranges dialog box opens.
5.
Click the Add button to display the Add Memory Range dialog box.
REJ10J2169-0100 Rev.1.00
Jul 01, 2010
Page 36 of 523
High-performance Embedded Workshop V.4.08
1. Overview
6.
Enter the start address of an array in Start address and end address in End address and select the size in
Access size.
7.
Click the OK button.
8.
Click the OK button in the Edit Test Memory Ranges dialog box.
9.
The content of array element "a[6]" in the "Watch1" sheet is saved into the test-image file. Double-click Watchxxxxxx under Symbol in Available components of the Edit Comparison Settings dialog box. The Edit Test
Watch dialog box opens.
10. Select the checkbox of "a[6]" in Symbols.
11. Click the OK button.
12. Click the OK button in the Edit Test Image File dialog box.
REJ10J2169-0100 Rev.1.00
Jul 01, 2010
Page 37 of 523
High-performance Embedded Workshop V.4.08
1. Overview
In the state of current High-performance Embedded Workshop system, the test image specified in test item is acquired,
and the test image is saved to the test image file created at step 5.
1.14.8
Step 7: Modifying the program before the test
In this example, the target of the test is a selected range of memory data in arrays. Then modify the program to reduce the
number of times to store data into the array, so that the saved test-image information and the actual memory data will not
match.
1.
Open a source file including a main function in the editor window and modify the program to reduce the number
of times to store data into the array.
2.
Click the Save File button (
3.
Right-click on the “Test_Demo” test icon to display a pop-up menu.
4.
Select Run Test Case to start the test. The progress and result of the test are shown in the Test tab of the
Output window.
REJ10J2169-0100 Rev.1.00
Jul 01, 2010
) on the Editor toolbar.
Page 38 of 523
High-performance Embedded Workshop V.4.08
5.
1.14.9
1. Overview
When the test is completed, the Test Browser window opens.
Step 8: Viewing the test result (unmatched)
You can view the test result in the Test Browser window.
1.
To view the details of unmatched data, double-click a test item with a red icon in the bottom tab.
2.
When Symbol - Watch-xxxxxx is double-clicked, for example, the Test Comparison Details dialog box
appears as shown below. This dialog box shows the values of both the saved test-image information
(Src=xxxxxx) and the result of this test (Dest=xxxxxx) regarding elements in arrays.
REJ10J2169-0100 Rev.1.00
Jul 01, 2010
Page 39 of 523
High-performance Embedded Workshop V.4.08
3.
Clicking the Export button saves the test result into a text file.
4.
Click the OK button.
1. Overview
1.14.10 Step 9: Modifying the program back and executing the test again
Modify the program to restore the number of times to store data in the array and then execute the test.
1.
Return the number from 8 to 10 and build the program.
2.
Click the Save File button (
3.
Right-click on the “Test_Demo” test icon to display a pop-up menu.
4.
Select Run Test Case to start the test.
5.
When the test is completed, the Test Browser window opens.
) on the Editor toolbar.
1.14.11 Step 10: Viewing the test result (matched)
You can view the test result in the Test Browser window. Make sure that the test result now matches the saved test-image
information.
REJ10J2169-0100 Rev.1.00
Jul 01, 2010
Page 40 of 523
High-performance Embedded Workshop V.4.08
2. Build Basics
2. Build Basics
This chapter explains the general basic functions of the High-performance Embedded Workshop whilst the more
advanced features can be found in chapter 3, Advanced Build Features.
2.1
The build process
The typical build process is outlined in the figure below. This may not be the exact build process that your installation of
High-performance Embedded Workshop will use, as it depends upon the tools that were provided with your installation
of High-performance Embedded Workshop (you may not have a compiler, for instance). In any case, the principles are
the same - each phase of the build takes a set of project files and builds them; if every file builds successfully then the
next phase is executed.
In the example shown in the figure above, the Compiler is the first phase, the Assembler is the second phase and the
Linker is the third and final phase. During the Compiler phase, the C/C++ source files from the project are compiled in
turn. During the Assembler phase, the assembler source files are assembled in turn. During the Linker phase, all library
files and output files from the Compiler and Assembler phases are linked together to produce the load module.
The build process can be customized in several ways. For instance, you can add your own phases, disable phases, delete
phases and so on. These advanced build issues are left to chapter 3, Advanced Build Features.
REJ10J2169-0100 Rev.1.00
Jul 01, 2010
Page 41 of 523
High-performance Embedded Workshop V.4.08
2.2
2. Build Basics
Configuring the Projects tab of the Workspace window
The Projects tab shows the current workspace, projects and files. You can quickly open any project file or dependent file
by double-clicking on its icon.
Right-clicking on a workspace opens a pop-up menu containing the available options.
Pop-up Menu Option
Macro Recording
Function
Insert Project
-
Adds a project to workspace.
Load All Projects
-
Loads all projects to workspace.
Collapse
-
Collapses the tree below a workspace icon.
Clean All Projects
Deletes intermediate and output files from configurations in all
projects in this workspace.
Version Control
-
Executes a version control system.
Configure View
-
Configures the workspace view.
Properties
-
Displays workspace properties.
Right-clicking on a project opens a pop-up menu containing the available options.
Pop-up Menu Option
Build
Macro Recording
Function
Build
Builds out of date project files
Build All
Builds project files, regardless of whether the project files are out
of date.
Clean Current Project
Deletes intermediate and output files from the current
configuration in this project.
REJ10J2169-0100 Rev.1.00
Jul 01, 2010
Page 42 of 523
High-performance Embedded Workshop V.4.08
Pop-up Menu Option
Update All
Dependencies
2. Build Basics
Macro Recording
Function
-
Updates all dependencies.
Set as Current Project
Sets this project as the current project.
Remove Project
-
Removes a project from workspace.
Unload Project
OR
Load Project
-
Unloads a project
OR
Loads a project.
Add Files
-
Adds files to a project.
Remove Files
-
Removes files from project.
Add Folder
-
Add folder to a project.
Expand/Collapse
-
Expands or collapses the tree below a project icon.
Version Control
-
Executes a version control system.
Configure View
-
Configures the workspace view.
Properties
-
Displays project properties.
Right-clicking on a folder (other than Download module and Dependencies) opens a pop-up menu containing the
available options.
Pop-up Menu Option
Macro Recording
Function
Add Folder
-
Add a custom folder.
Rename Folder
-
Rename a folder.
Remove Folder
-
Remove a folder.
Configure View
-
Configures the workspace view.
Right-clicking on a project file opens a pop-up menu containing the available options.
Pop-up Menu Option
Macro Recording
Function
Open <file name>
-
Opens a file in the High-performance Embedded Workshop
editor.
Open <file name> in external
editor *
-
Opens a file in the external editor.
Build <file name>
Builds a file.
Build Options
-
Sets build options.
Add File
-
Adds files to a project.
Remove File
-
Removes files from project.
Exclude Build
OR
Include Build
-
Excludes a project file from build
OR
Includes a project file in build.
Version Control
-
Executes a version control system.
Configure View
-
Configures the workspace view.
Show Differences
-
Compares files.
Properties
-
Displays file properties.
REJ10J2169-0100 Rev.1.00
Jul 01, 2010
Page 43 of 523
High-performance Embedded Workshop V.4.08
2. Build Basics
Note:
*. This option is available only when the Use external editor checkbox is selected in the Editor tab of the Options
dialog box opened via [Setup -> Options].
Right-clicking on the Download modules folder opens a pop-up menu containing the available options (Available when
the debugger is connected).
Pop-up Menu Option
Macro Recording
Function
Download all module
Downloads all modules in the Download modules list on the
Target tab of the Debug Settings dialog box (i.e. download
modules shown under the Download Modules folder in the
Projects tab of the workspace window).
Download A New Module
Opens the Download Module dialog box, which allows you to add
download modules.
Debug Settings
-
Opens the Debug Settings, which allows you to modify the debug
settings.
Configure View
-
Configures the workspace view.
Right-clicking on a download module opens a pop-up menu containing the available options (Available when the
debugger is connected).
Pop-up Menu Option
Macro Recording
Function
Download
Downloads modules.
Download (Debug Data Only)
Downloads modules (debug data only).
Unload
Unloads modules.
Download A New Module
Opens the Download Module dialog box, which allows you to add
download modules.
Remove
-
Removes the selected modules.
Debug Settings
-
Opens the Debug Settings dialog box, which allows you to modify
the debug settings.
Configure View
-
Configures the workspace view.
Relocate Module *
-
Opens a dialog box which allows you to select one directory for
relocating all files retrieved from the download module.
Properties
-
Shows the selected download module setting in the Download
Module dialog box. This download module setting can be modified.
The download module will be unloaded if it has already been
downloaded.
Note:
*. If you use a debug-only project (i.e., "Debugger only - xxxxxx"), this menu option will be displayed.
REJ10J2169-0100 Rev.1.00
Jul 01, 2010
Page 44 of 523
High-performance Embedded Workshop V.4.08
2. Build Basics
Right-clicking on a file retrieved from the download module opens a pop-up menu containing the available options
(Available only when you use the debug-only project).
Pop-up Menu Option
Macro Recording
Function
Open <file name>
-
Opens a file in the High-performance Embedded Workshop editor.
Add File
-
Adds files to a project.
Configure View
-
Configures the workspace view.
Relocated file(s)
-
Opens a dialog box which allows you to select the same short
filename retrieved from the download module at a new location.
Properties
-
Displays file properties.
Right-clicking on the Dependencies folder opens a pop-up menu containing the available options.
Pop-up Menu Option
Macro Recording
Function
Configure View
-
Configures the workspace view.
Right-clicking on a dependence file opens a pop-up menu containing the available options.
Pop-up Menu Option
Macro Recording
Function
Version Control
-
Executes a version control system.
Configure View
-
Configures the workspace view.
Show Differences
-
Compares files.
Properties
-
Displays file properties.
For details on "Current project", "Loaded project" and "Unloaded project", see section 2.12, Setting the current project.
2.3
Project files
In order for the High-performance Embedded Workshop to be able to build your application, you must first tell it which
files should be in the project and how each file should be built (see the figure below).
REJ10J2169-0100 Rev.1.00
Jul 01, 2010
Page 45 of 523
High-performance Embedded Workshop V.4.08
2.3.1
2. Build Basics
Adding files to a project
Before building an application, select files to configure the application.
To add files to a project
1.
Files can be added to the active project only. Select one of the following operations to open the Add files to
project 'project name' dialog box:
•
Select [Project -> Add Files], OR
•
Right-click on the project within the Projects tab of the workspace window and select Add Files from the
pop-up menu, OR
•
Press the "Insert" key when the Projects tab of the Workspace window is selected.
2.
Select the file(s) you wish to add to the project.
3.
A Relative Path checkbox is available at the bottom of this dialog box. Selecting this checkbox allows the files
to be relative project files. These project files are relative to the workspace file and can also be placed outside
the workspace structure. Even if you re-allocate the entire source tree, the High-performance Embedded
Workshop is able to check the relative position of the files to find them. By default, this checkbox is selected.
4.
A Hide Project Files checkbox is available at the bottom of this dialog box. Selecting this checkbox only shows
the files not added to the current project. By default, this checkbox is not selected.
5.
Click the Add button.
REJ10J2169-0100 Rev.1.00
Jul 01, 2010
Page 46 of 523
High-performance Embedded Workshop V.4.08
2. Build Basics
There are other ways to add files to a project
•
Right-clicking on an open file in the Editor window displays a pop-up menu. If the file is already in the project
then the Add File To Project menu option is disabled. Select the Add File To Project menu option to add the
file to the current project.
•
In the High-performance Embedded Workshop it is also possible to ‘drag and drop’ files from Windows®
Explorer onto the Projects tab of the workspace window. For details, see section 2.3.2, Drag and drop of files
and folders.
Notes:
•
If you add a file that has an unrecognized file type to the project, then the file will be added to the project, but
certain functions will be disabled for this file. When you double-click on a file with an unrecognized file type in
the Workspace window, the open operation is passed to the Windows® operating system (instead of opening the
file in the editor). The default ‘Open’ operation is then carried out as if the file was double-clicked in Windows®
Explorer. To view the currently defined extensions, use the File Extensions dialog box. See section 2.5, File
extensions and file groups, for further information.
•
Hide Project Files is not selectable under the Windows Vista® or Windows® 7 operating system.
2.3.2
Drag and drop of files and folders
It is possible to ‘drag and drop’ files or folders from Windows® Explorer onto the Projects tab of the workspace
window. These files or folders can only be dropped onto a project in the active project or a user folder in the active
project. Note, however, that you cannot drag and drop files or folders onto multiple folders.
When you drag and drop files
The behavior depends on the destination.
•
A file dropped onto the active project is added into the group folder of the file type. If a suitable group folder
does not exist, the High-performance Embedded Workshop creates it. For example, if you drop the file “test.c”
onto the active project, this file will be added to the group folder “C source file”.
•
A file dropped onto a user folder is directly added to this folder. Even if a file with the same name is already in
the folder, the new file can be added to the folder only when these two files have different paths.
•
If a file of an unrecognized file type is added to the project, this file is directly added to the project.
To drag and drop folders
Drag and drop of a folder from the Windows® Explorer opens the Add Files From Folder dialog box, which allows you
to select the files in the folder that you wish to add to the project. This dialog box shows the names of all files included in
the folder that was dropped. Filename and File Type show the full paths of files and file types, respectively.
REJ10J2169-0100 Rev.1.00
Jul 01, 2010
Page 47 of 523
High-performance Embedded Workshop V.4.08
2. Build Basics
1.
In the dialog box, the files are initially sorted by the file type in alphabetical order. If you click a column header
(of file names or types), the files will be sorted by the file name or type.
2.
You can select multiple files by clicking. If you then click on one of the checkboxes for the selected files or
press the Space key, checkboxes for all of the selected files will be switched ON or OFF (depending on the
previous state).
3.
If the Show files in subfolders checkbox is selected, the dialog box also shows the files within subfolders under
the folder that was dropped. Otherwise the dialog box only shows the files within the folder that was dropped.
By default, this checkbox is selected.
4.
If the Show source files only checkbox is selected, the dialog box only shows the files having the extension
specified for the source files in this project (e.g. C source files). Otherwise the dialog box shows all files. If the
High-performance Embedded Workshop cannot recognize the file type, “Unknown type” will be shown in the
File Type column. By default, this checkbox is selected.
5.
If the Create folder structure in project checkbox is selected, files are added to the tree where the folder was
dropped. For example, when a folder “data” containing some files is dropped onto the tree, the files are added
into a user folder “data”, which is newly created.
If the Create folder structure in project checkbox is not selected, when you drop a folder onto a user folder,
files in the folder are added into this user folder. When a folder is dropped onto the active project tree, files in
the folder are added into the group folder of the file type (e.g. a file “main.c” is added into the group folder “C
source file”). If a suitable group folder does not exist, the High-performance Embedded Workshop creates it.
Files of an unknown type dropped onto the project are directly added to the project.
By default, this checkbox is not selected.
REJ10J2169-0100 Rev.1.00
Jul 01, 2010
Page 48 of 523
High-performance Embedded Workshop V.4.08
2. Build Basics
6.
Clicking the Uncheck All button deselects all checkboxes, while clicking the Check All button selects all
checkboxes.
7.
Clicking the OK button adds all selected files, which have tick marks in their checkboxes, to the project. Next
time this dialog box is opened, it shows the most recently used setting.
2.3.3
Removing files from a project
There are three ways of removing files from a project
•
Files can be individually removed from a project,
•
A selection of files can be removed,
•
All files can be removed.
To remove a file(s) from a project
1.
Select one of the following operations to open the Remove Project Files dialog will be displayed:
•
Select [Project -> Remove Files], OR
•
Right-click on the project within the Projects tab of the workspace window and select Remove Files from the
pop-up menu.
2.
Select the file(s) that you want to remove from the Project files list.
3.
Click the Remove button to remove the file(s), or click the Remove All button to remove all files from the list.
4.
Click the OK button to remove the files from the project.
REJ10J2169-0100 Rev.1.00
Jul 01, 2010
Page 49 of 523
High-performance Embedded Workshop V.4.08
2. Build Basics
To remove selected files from a project using the Projects tab of the Workspace window
1.
Select the files that you want to remove in the Projects tab of the Workspace window. Multiple files can be
selected by holding down the SHIFT or CTRL key.
2.
Press Delete.
3.
A confirmation dialog box opens for you to select whether or not to delete the selected files from the project. To
delete the selected files, select Yes. Otherwise select No.
If you do not wish to open this confirmation dialog box, select the Don’t ask this question again checkbox. To
open this dialog box again, select [Setup -> Options] to open the Options dialog box. Select the Delete file
from project checkbox on the Confirmation tab. By default, this checkbox is selected.
2.3.4
Excluding a project file from build
A file in a project can be excluded from build on a configuration by configuration basis.
To exclude a project file from build
1.
2.
Click on the file that you want excluded from build, in the Projects tab of the Workspace window.
It is also possible to select several files by using a mouse or inputs through the keyboard as follows:
•
To select several files
Click the files while pressing the CTRL key.
•
Select several files as a range
Click a file as the start of the range. Then keep pressing the SHIFT key and click another file as the end of
the selected range.
Take either of the two ways listed below. A red cross (
excluded from build.
) will appear on the file’s icon, and the file will be
•
Select Exclude Build <file>, where <file> is the name of the selected file, from the pop-up menu opened
by right-clicking. <file> is not displayed if several files are selected.
•
Select [Build -> Include/Exclude Build].
REJ10J2169-0100 Rev.1.00
Jul 01, 2010
Page 50 of 523
High-performance Embedded Workshop V.4.08
2.3.5
2. Build Basics
Including a project file in build
A file that has been excluded from build can be included again.
To include a project file in build
1.
2.
2.4
Click on a file that has previously been excluded from build, in the Projects tab of the Workspace window.
It is also possible to select several files by using a mouse or inputs through the keyboard as follows:
•
To select several files
Click the files while pressing the CTRL key.
•
Select several files as a range
Click a file as the start of the range. Then keep pressing the SHIFT key and click another file as the end of
the selected range.
Take either of the two ways listed below. The red cross will be removed from the file’s icon (
will be included in build.
), and the file
•
Select Include Build <file>, where <file> is the name of the selected file, from the pop-up menu opened by
clicking the right-mouse button. <file> is not displayed if several files are selected.
•
Select [Build -> Include/Exclude Build].
User folders in the workspace
In the High-performance Embedded Workshop it is possible to add folders to the Projects tab of the workspace window.
This allows you to logically group your files into certain areas within a project. The folder can be set to any name and
this is entered in a dialog box. The operations listed below are not allowed, however, for folders Download modules and
Dependencies that are automatically displayed.
To add a user folder
1.
Select the project on the Projects tab of the Workspace window.
2.
Right-click and select Add Folder.
3.
Enter the name in Folder of the Add Folder dialog box.
4.
Click OK.
5.
You can now drag and drop files into this folder to group them logically.
REJ10J2169-0100 Rev.1.00
Jul 01, 2010
Page 51 of 523
High-performance Embedded Workshop V.4.08
2. Build Basics
To add a sub-folder
1.
Select the folder on the Projects tab of the Workspace window.
2.
Right-click and select Add Folder.
3.
Enter the name in Folder of the Add Folder dialog box
4.
Click OK.
5.
You can now drag and drop files into this folder to group them logically.
To drag and drop a folder
Drag a folder in the active project from the Projects tab of the Workspace window.
•
If the folder is dropped onto the active project, the folder is directly added into the project.
•
If the folder is dropped onto a user folder in the active project, the folder is added into the user folder.
You can also drag folders from the Windows® Explorer and drop it into the Projects tab of the workspace window. For
details, see section 2.3.2, Drag and drop of files and folders.
To remove a user folder
1.
Select the folder on the Projects tab of the Workspace window.
2.
Select one of the following operations (the folder must be empty):
•
Press the Delete key.
•
Right-click and select Remove Folder from the pop-up menu.
To modify a user folder name
1.
Select the folder on the Projects tab of the Workspace window.
2.
Right-click and select Rename Folder from the pop-up menu.
3.
Enter the new name in Folder of the Rename Folder dialog box.
4.
Click OK.
REJ10J2169-0100 Rev.1.00
Jul 01, 2010
Page 52 of 523
High-performance Embedded Workshop V.4.08
2.5
2. Build Basics
File extensions and file groups
The High-performance Embedded Workshop can identify files by their extension. The system defines certain extensions
depending upon the tools that are being used. For example, if you are using a compiler then the .c extension will be in the
‘C source file’ group and will be used as input to the compiler phase. Additionally, the High-performance Embedded
Workshop allows you to define your own extensions. For example, if the project you are developing uses assembler
source files the default extension may be .src. If you would like to use a different extension instead of .src (e.g. .asm)
then you can define a new extension and request that the High-performance Embedded Workshop treats it in the same
way as a .src file.
File extensions and file groups can be viewed and modified via the File Extensions dialog box, which is invoked by
selecting [Project -> File Extensions]. This dialog box displays all the extensions and file groups that are defined within
the current workspace.
The File Extensions list is divided into two columns. On the left are the file extensions, and on the right are the file
groups associated with the extensions. Many file extensions can belong to the same group. For example, assembler
source files may have several extensions in a single project (e.g. .src, .asm, .mar etc.).
REJ10J2169-0100 Rev.1.00
Jul 01, 2010
Page 53 of 523
High-performance Embedded Workshop V.4.08
2.5.1
2. Build Basics
Associating an application with a file group
In addition to opening a file with the editor, the File Extensions dialog box allows you to associate any application with
any file group so that when you double-click on a file in the Projects tab of the Workspace window, the appropriate
application is launched with the file.
To associate an application with a file group
1.
Select [Project -> File Extensions]. The File Extensions dialog box opens.
2.
Select the file group that you want to associate from the file extensions list.
3.
Click the Open with button. The Modify File Extension dialog box opens.
REJ10J2169-0100 Rev.1.00
Jul 01, 2010
Page 54 of 523
High-performance Embedded Workshop V.4.08
4.
2. Build Basics
Select None to remove any association, Editor to open this type of file in the internal/external editor, or select
Other to open this type of file with a specific application. If you select Other, you can either specify a new
application, or select any previously defined application from the drop-down list. Click the Add button to define
a new application. The Add Application dialog box opens.
Enter the name of the tool into the Name field. Enter the full path to the tool in the Command field (do not
include any parameters). Enter the parameters that are required to open a file into the Parameters field. Be sure
to use the $(FULLFILE) placeholder to specify the location of the file (see Reference 5, Placeholders, for more
information on placeholders). Enter the initial directory in which you would like the application to run into the
Initial directory field. Click the OK button to finish creating the application. Click the Modify button to
modify an application. The Modify Application dialog box will be displayed. This dialog is the same as the
Add Application dialog box described above except that the Name field is read-only. Modify the settings as
desired and then click the OK button.
5.
2.5.2
Click the OK button to set the application for the selected file group.
Creating a new file extension and file group
If you want to manage files that are not, by default, recognized by the High-performance Embedded Workshop (e.g.
documents) then you need to create a new extension and a new file group.
To create a new file extension in a new file group
1.
Select [Project -> File Extensions]. The File Extensions dialog box opens.
2.
Click the Add button. The Add File Extension dialog box opens.
REJ10J2169-0100 Rev.1.00
Jul 01, 2010
Page 55 of 523
High-performance Embedded Workshop V.4.08
2. Build Basics
3.
Enter the extension that you want to define into the File extension field. Use only alphanumeric and an
underscore as characters of a file extension string. The drop-down list contains all extensions that are undefined
in the current project. Selecting one of these extensions will add the text to the file extension field automatically.
4.
Select the Extension belongs to new group option and enter a description that defines this new file group.
5.
At this stage it is possible to change the associated application. There are four available choices in the Open
"<extension group>" with drop-down list:
•
Editor
•
None
•
Other
•
Windows default
If Editor is selected, the Open File function in the workspace window causes the file to be opened in the Highperformance Embedded Workshop editor. If None is selected then the Open File operation is disabled when it is
attempted. Selecting Other allows you to configure another tool for the Open File operation. See section 2.5.1,
Associating an application with a file group, for more details. If Windows default is selected then the Open File
function in the Workspace window passes the Open File operation to the Windows® operating system. This then
selects the default behavior for this file extension as defined in Windows® Explorer.
6.
Click the OK button to add the extension to the File Extensions list.
REJ10J2169-0100 Rev.1.00
Jul 01, 2010
Page 56 of 523
High-performance Embedded Workshop V.4.08
2.5.3
2. Build Basics
Creating a new file extension
If your files use a different extension from those accepted by the High-performance Embedded Workshop for a given
phase (e.g. your assembler source files are .asm but the High-performance Embedded Workshop only recognizes .src),
then you need to create a new extension and add it to an existing file group. This process is described below.
To create a new file extension in an existing file group
1.
Select [Project -> File Extensions]. The File Extensions dialog box opens.
2.
Click the Add button. The Add File Extension dialog box opens.
3.
Enter the extension that you want to define into the File extension field. Use only alphanumeric and an
underscore as characters of a file extension string. The drop-down list contains all extensions that are undefined
in the current project. Selecting one of these extensions will add the text to the file extension field automatically.
4.
Select the Extension belongs to an existing group option and select the group to which you would like to add
this new extension.
5.
Click the OK button to add the extension to the File Extensions list.
REJ10J2169-0100 Rev.1.00
Jul 01, 2010
Page 57 of 523
High-performance Embedded Workshop V.4.08
2.6
2. Build Basics
Setting build options
Once you have added the necessary files to the project, the next step is to instruct the High-performance Embedded
Workshop on how to build each file. To do this, you will need to select a menu option from the Build menu. The
contents of this menu depend upon which tools you are using.
To set options for a build phase
1.
Select the Build menu and select the phase whose options you would like to modify.
2.
A dialog box will be displayed allowing you to specify the options.
3.
After making your selections, click the OK button to set them.
To obtain further information, use the context-sensitive help button or select the area in which you need assistance and
press F1.
2.7
Build configurations
The High-performance Embedded Workshop allows you to store all of your build options into a build configuration, i.e.
you can ‘freeze’ all of the options and give them a name. Later on, if you select that configuration, all options for all of
the build phases will be restored. These configurations also allow the user to specify debugger settings for a build
configuration. This means that each configuration can be targeted at a different end platform.
The figure below shows three configurations: Default, MyDebug and MyOptimized. In the first configuration, Default,
each phase (compile and assemble) is set to its standard settings. In the second configuration, MyDebug, each file is
being built with debug information switched on. In the third configuration, MyOptimized, each file is being built with
optimization on full and without any debug information. The developer of this project can select any of those
configurations and build them without having to return to the options dialogs to set them again.
REJ10J2169-0100 Rev.1.00
Jul 01, 2010
Page 58 of 523
High-performance Embedded Workshop V.4.08
2.7.1
2. Build Basics
Selecting a build configuration
To select the current configuration
1.
Select [Build -> Build Configurations]. The Build Configurations dialog box opens.
2.
Select the build configuration that you want to use from the Current Configuration drop-down list.
3.
Click the OK button.
You can also select a different build configuration by selecting it from the Current Configuration drop-down list on the
Standard toolbar.
2.7.2
Adding a new build configuration
To add a new build configuration
1.
Select [Build -> Build Configurations]. The Build Configurations dialog box opens.
2.
Click the Add button. The Add Configuration dialog box opens.
3.
Enter the new build configuration name into the Configuration name field. As you enter the new build
configuration name, the directory underneath changes to reflect the configuration directory that will be used.
4.
Select one of the existing build configurations, on which you want to base the new build configuration, from the
Based on configuration drop-down list.
5.
Click the OK buttons on both dialogs to complete the creation of the new build configuration.
REJ10J2169-0100 Rev.1.00
Jul 01, 2010
Page 59 of 523
High-performance Embedded Workshop V.4.08
2.7.3
2. Build Basics
Removing a build configuration
To remove a build configuration
1.
Select [Build -> Build Configurations]. The Build Configurations dialog box opens.
2.
Select the build configuration to remove and click the Remove button.
3.
Click the OK button to close the Build Configurations dialog box.
2.8
Building a project
2.8.1
Building individual files
The High-performance Embedded Workshop lets you build project files individually.
To build an individual file
1.
Select the file to build from the Projects tab of the Workspace window.
2.
Select one of the following operations:
•
Click the Build File toolbar button (
•
Select Build <file> from the pop-up menu, OR
•
Select the [Build -> Build File] menu option, OR
•
Press CTRL+F7.
), OR
All output is redirected to the Build tab of the Output window.
2.8.2
Building a project
The Build option only compiles or assembles those files that have changed since the last build. Additionally, it will
rebuild source files if they depend upon a file that has changed since the last build. For instance, if the file ‘TEST.C’
#include’s the file ‘HEADER.H’ and the latter has changed since the last build, the file ‘TEST.C’ will be recompiled.
To perform a build operation
Select one of the following operations:
•
Click the Build toolbar button (
•
Press F7, OR
•
Select [Build -> Build], OR
REJ10J2169-0100 Rev.1.00
Jul 01, 2010
), OR
Page 60 of 523
High-performance Embedded Workshop V.4.08
•
2. Build Basics
Right-click on a project in the Projects tab of the Workspace window and select [Build -> Build] from the
pop-up menu.
The Build All option compiles and assembles all source files, irrespective of whether they have been modified or not,
and links all of the new object files produced.
To perform a build all operation
Select one of the following operations:
•
Click the Build All toolbar button (
•
Select [Build -> Build All], OR
•
Right-click on a project in the Projects tab of the Workspace window and select [Build -> Build All] from the
pop-up menu.
), OR
All output from a build or build all operation is redirected to the Build tab of the Output window. Both the Build and the
Build All operations will terminate if any project files produce errors.
2.8.3
Building multiple projects
The High-performance Embedded Workshop allows you to build multiple projects and configurations at once.
To build multiple projects
1.
Select [Build -> Build Multiple]. The Build Multiple dialog box opens.
2.
The Build Multiple dialog box gives you the choice of which projects and configurations to build. Select the
check boxes next to the projects and configurations that you want to build. For example, in figure below if you
wanted to build the entire “hewtest2” project you would check the “hewtest2-Debug” and the “hewtest2Release” selections and leave all other check boxes unchecked.
REJ10J2169-0100 Rev.1.00
Jul 01, 2010
Page 61 of 523
High-performance Embedded Workshop V.4.08
2. Build Basics
3.
When you are happy with your chosen selection, click the Build button and the High-performance Embedded
Workshop will build the selected projects and configurations.
4.
If you want to build all of the projects, click the Build All button. This will automatically select all projects and
configurations, and build them all.
5.
If you also wish to delete intermediate and output files of the selected project or configuration, click the Clean
button. This does not execute the build.
6.
Results from the build are displayed in the Build tab of the Output window in the same way as in a normal build
process.
7.
If you use the dialog again it will restore the checked status from the last time you used it.
2.8.4
Stopping tool execution
The High-performance Embedded Workshop allows you to halt the build process once it is under way.
To stop tool execution
Select one of the following operations:
•
Click the Stop Tool Execution toolbar button (
•
Select [Build -> Stop Tool Execution].
), OR
The ‘Build Stopped by User’ message appears in the Build tab of the Output window.
REJ10J2169-0100 Rev.1.00
Jul 01, 2010
Page 62 of 523
High-performance Embedded Workshop V.4.08
2. Build Basics
Note:
Do NOT assume that any output from the tool you terminated is valid. It is recommended that you delete any output files
produced and ensure that the phase is executed again.
2.8.5
Deleting intermediate and output files produced in building
You can delete intermediate and output files (produced in building) included in the current configuration in the project.
To delete intermediate and output files included in the current configuration in the project
Select one of the following operations:
•
Select [Build -> Clean Current Project], OR
•
Right-click on a project in the Projects tab of the workspace window. Select [Build -> Clean Current Project]
from the pop-up menu.
A confirmation dialog opens for you to select whether or not to delete all intermediate and output files produced in
building. To delete all files, select Yes. Otherwise select No or Cancel.
If you do not wish to open this confirmation dialog box, select the Don’t ask this question again checkbox.
To open the confirmation dialog box again
1.
Select [Setup -> Options]. The Options dialog box opens.
2.
Select the Confirmation tab.
3.
Select the Clean project checkbox. This checkbox is selected by default.
4.
Click OK.
REJ10J2169-0100 Rev.1.00
Jul 01, 2010
Page 63 of 523
High-performance Embedded Workshop V.4.08
2. Build Basics
To delete intermediate and output files in all projects of the workspace
Select one of the following operations:
•
Click the Clean All Projects toolbar button (
•
Select [Build -> Clean All Projects], OR
•
Right-click on a workspace in the Projects tab of the workspace window. Select [Clean All Projects] from the
pop-up menu.
), OR
A confirmation dialog opens for you to select whether or not to delete all intermediate and output files produced in
building. To delete all files, select Yes. Otherwise select No.
If you do not wish to open this confirmation dialog box, select the Don’t ask this question again checkbox.
To open the confirmation dialog box again
1.
Select [Setup -> Options]. The Options dialog box opens.
2.
Select the Confirmation tab.
3.
Select the Clean workspace checkbox. This checkbox is selected by default.
4.
Click OK.
The Build tab in the Output window shows all projects and configurations in which intermediate and output files have
been deleted.
You can select multiple configurations and delete intermediate and output files produced in building. For details, see
section 2.8.3, Building multiple projects.
REJ10J2169-0100 Rev.1.00
Jul 01, 2010
Page 64 of 523
High-performance Embedded Workshop V.4.08
2. Build Basics
Note:
The types of intermediate and output files to be deleted vary with the package and version number.
•
C Compiler Package for M16C Series V.5.45 Release 00 or later
•
C Compiler Package for M32C Series V.5.42 Release 00 or later
•
Compiler Package for R32C Series V.1.02 Release 00 or later
Relocatable, absolute, linkage list (".MAP"), and assembly-program list files (".LIS") are deleted.
Subcommand files of toolchains are not deleted.
The extension for absolute files varies with the specified format.
•
C Compiler Package for M16C Series V.5.30 Release 0 to V.5.44 Release 00
•
C Compiler Package for M32C Series V.5.40 Release 0 to V.5.41 Release 01A
•
C Compiler Package for R32C Series V.1.01 Release 00
•
C/C++ Compiler Package for SuperH Family V.5.1 to V.9.03 Release 02
•
C/C++ Compiler Package for H8SX, H8S, H8 Family V.3.0A to V.7.00 Release 00
•
C/C++ Compiler Package for RX Family V.1.00 Release 00
•
C Compiler Package for M32R Family V.5.00 Release 00 to V.5.01 Release 01
•
C Compiler Package for 740 Family V.1.00 Release 1 to V.1.01 Release 02
•
Assembler Package for 740 Family V.4.10 Release 02
Only relocatable and absolute files are deleted. Linkage list (".MAP") and assembly-program list (".LIS") files,
and subcommand files of toolchains are not deleted.
The extension for absolute files varies with the specified format.
2.8.6
Configuring the Build tab of the Output window
The Build tab shows the output from any build process (e.g. compiler, assembler and so on). If an error is encountered in
a source file, an icon and the error message will be displayed in the Build tab, along with the source file name and line
number.
If you click on a toolbar button or pop-up menu option associated with display of error messages, the line of the error
message will be highlighted (with text in white and its background in dark blue) and the editor will show the source code
of that line (if the line has any source code).
Double-clicking the line of an error message will also show the source code in the editor.
When you attempt an operation to display an error or warning, the status bar shows this error or warning message.
REJ10J2169-0100 Rev.1.00
Jul 01, 2010
Page 65 of 523
High-performance Embedded Workshop V.4.08
2. Build Basics
You can also customize the Build tab so that the texts in the lines of error messages will be highlighted in a color
different from that of the texts in other lines. The figure below shows the error messages in red and warnings in green as
an example.
Right-clicking displays a pop-up menu containing available options.
A basic operation is allocated to the toolbar.
The functions of Toolbar display and Customize toolbar are also included in the pop-up menu displayed by rightclicking the toolbar area.
Pop-up Menu Option
Toolbar Button Function
-
Highlights the next occurrence of error and shows the source
code in the editor.
-
Highlights the previous occurrence of error and shows the source
code in the editor.
-
Highlights the next occurrence of warning and shows the source
code in the editor.
-
Highlights the previous occurrence of warning and shows the
source code in the editor.
Display next Error/Warning/Info
Displays the editor that generated the next build error or warning.
Display previous Error/Warning/Info
Displays the editor that generated the previous build error or
warning.
Help
Shows the help information about the line.
Go to Error/Warning/Info
-
Goes to the associated source line.
Clear Window
Clears the contents of the window.
Save
Saves the contents of the window into a text file.
Copy
Copies the selected contents onto the Windows® clipboard.
Toolbar display
-
Shows or hides the toolbar.
Customize toolbar
-
Customizes toolbar buttons.
REJ10J2169-0100 Rev.1.00
Jul 01, 2010
Page 66 of 523
High-performance Embedded Workshop V.4.08
2. Build Basics
The Build tab also shows an icon corresponding to the error message output by build execution.
Icon Name
Icon
Error Message Level
Build Error
Error
Build Warning
Warning
Information
Information
You can also customize the Build tab of the Output window so that the texts in the lines of error messages will be
highlighted in a color different from that of the texts in other lines.
To customize the current colors
1.
Select [Setup -> Format Views] to open the Format Views dialog box.
2.
Select the Output item from the tree in the left-hand section of the dialog box and expand it.
3.
Select the category for which you wish to change the color from the table below.
Category
Foreground Color of
Background Color of Tab(s) to be Type of Output to
the Color Tab (Default) the Color Tab (Default) Applied
be Applied
Text
SYSTEM
SYSTEM
All tabs
All
Build Error Text
Black
White
Build
Error
Build Warning Text
Black
White
Build
Warning
Information Text
Black
White
Build
Information
4.
Change the selection in the Foreground and Background lists of the Color tab.
5.
Click the OK button.
2.8.7
Controlling the content of the Build tab of the Output window
It is often useful to display extra information (such as the command line options that are being applied to a file) during a
build. The High-performance Embedded Workshop allows you to specify whether or not you want such options
displayed in the Build tab of the output window during a Build, Build All or Build File operation via the Options dialog
box.
To view or hide extra information during a build
1.
Select [Setup -> Options]. The Options dialog box opens.
2.
Select the Build tab.
REJ10J2169-0100 Rev.1.00
Jul 01, 2010
Page 67 of 523
High-performance Embedded Workshop V.4.08
3.
Set the three check boxes in the Show group as follows:
•
Command line controls whether the command line is shown as each tool is executed.
•
Environment controls whether the environment is shown as each tool is executed.
•
Initial directory controls whether the current directory is shown as each tool is executed.
2.8.8
2. Build Basics
Displaying out of date files in the Workspace window
Files updated later than the file generated by the previous build (i.e. out of date files) are marked in the workspace
window. In the window below the file "demo.c" is out of date.
When you click Build next time these files will be re-built. This is also displayed for dependent projects of the current
project.
The view of these files is updated whenever something that affects the build occurs, e.g. options changing, file addition,
dependencies changing, files modified, etc.
To display out of date files in the workspace window
1.
Select [Setup -> Options]. The Options dialog box opens.
2.
Select the Build tab.
REJ10J2169-0100 Rev.1.00
Jul 01, 2010
Page 68 of 523
High-performance Embedded Workshop V.4.08
3.
Check the Mark out of date files check box.
4.
Click OK.
2.9
2. Build Basics
File dependencies
A typical project will contain dependencies between files. For example, a C file may ‘#include’ one or more header files.
In complex projects, source files will include (or depend upon) others and this can quickly become difficult to manage.
However, the High-performance Embedded Workshop provides a dependency scanning mechanism whereby all files in a
project are checked for dependencies. Once complete, the Projects tab of the Workspace window will display an up-todate list with all the project file dependencies.
Initially, the dependencies for all files are contained within the Dependencies folder (although this can be modified by
configuring the projects tab).
Note:
Some include files may include other files. Up to 31 nesting levels of dependent files are displayed in the Dependencies
folder.
REJ10J2169-0100 Rev.1.00
Jul 01, 2010
Page 69 of 523
High-performance Embedded Workshop V.4.08
2. Build Basics
File dependencies in a project are automatically updated at the following operation timings:
Operation Timing
Specific Operation
Open workspace
Select option in the Welcome! dialog box
Select [File -> New Workspace]
Select [File -> Open Workspace]
Add a project to workspace
Select [Project -> Insert Project]
Set the current project
Select [Project -> Set Current Project]
Add files to a project
Select [File -> Add Files]
Save files
Select [File -> Save]
Build
Select [Build -> Build]
Automatic dependency scanning
Deselect the Disable automatic dependency scanning checkbox
To prevent automatic scanning of file dependencies in a project
1.
Select [Setup -> Options]. The Options dialog box opens.
2.
Select the Build tab.
3.
Select the Disable automatic dependency scanning checkbox. This checkbox is not selected by default.
4.
Click OK.
Note:
Selecting this option clears all file dependencies in a project. To manually update file dependencies in a project,
see "To manually update file dependencies in a project".
REJ10J2169-0100 Rev.1.00
Jul 01, 2010
Page 70 of 523
High-performance Embedded Workshop V.4.08
2. Build Basics
When [Build -> Build] is selected, a confirmation dialog box appears to ask if you wish to update the file dependencies
before executing the build.
If you have not manually updated dependency data, it may be out of date.
When you want dependency data to be updated prior to build, select Yes.
If you select No, it executes "Build" based on current dependency scanning data.
If you do not wish to open this confirmation dialog box, select the Don’t ask this question again checkbox.
To open the confirmation dialog box again
1.
Select [Setup -> Options]. The Options dialog box opens.
2.
Select the Confirmation tab.
3.
Select the Scan Dependencies Prior To Build checkbox. This checkbox is selected by default.
4.
Click OK.
To manually update file dependencies in a project
Select one of the following operations:
•
Select [Build -> Update All Dependencies], OR
•
Right-click on a project in the Projects tab of the Workspace window and select [Build -> Update All
Dependencies] from the pop-up menu.
REJ10J2169-0100 Rev.1.00
Jul 01, 2010
Page 71 of 523
High-performance Embedded Workshop V.4.08
2.10
2. Build Basics
Configuring the Workspace window
If you right-click anywhere inside the Projects tab of the Workspace window, a pop-up menu will be invoked. Select the
Configure View menu option to modify the way in which information is displayed. The following four sections detail
the effect of each option on the Configure View dialog box.
Show Dependencies Under Each File
If you check the Show dependencies under each file checkbox, the dependent files are shown under the including
source file as a flat structure, i.e. the files themselves become folders (as in figure (ii) below). If this option is not selected
then a separate folder contains all dependencies (as in figure (i) below).
Show Standard Library Includes
By default, any dependent files found in standard include paths will not be shown (as in figure (j) below). For example,
in C code, if you write a ‘#include’ statement, such as ‘#include <stdio.h>’, stdio.h will not be listed as a dependent file.
To view such system include files, select the Show standard library includes checkbox (as in figure (jj) below).
REJ10J2169-0100 Rev.1.00
Jul 01, 2010
Page 72 of 523
High-performance Embedded Workshop V.4.08
2. Build Basics
Show File Paths
By default, any files will not be shown with their full path (as in figure (k) below). If the Show file paths checkbox is
selected, all of the files in the Projects tab of the Workspace window are shown with their full path, i.e. from a drive letter
(as in figure (kk) below).
Sorting the workspace window into time stamp order
When Sort files in time order option is selected, the workspace window is then sorted into file time stamp order. The
newest files are located at the top of list with the older files towards the bottom.
If files are updated after selecting this option, manually update the order of these files.
To manually update the file order
Select Refresh Order in the pop-up menu on the Projects tab of the Workspace window.
REJ10J2169-0100 Rev.1.00
Jul 01, 2010
Page 73 of 523
High-performance Embedded Workshop V.4.08
2.11
2. Build Basics
Inserting a project into the workspace
When a workspace is created, it contains only one project but, after it is created, you can insert new or existing projects
into the workspace.
To insert a new project into the workspace
1.
Select [Project -> Insert Project]. The Insert Project dialog box opens.
2.
Select the New project radio button.
3.
Click the OK button. The Insert New Project dialog box opens.
4.
Enter the name of the new workspace into the Project Name field. This can be up to 32 characters in length and
contain letters, numbers and the underscore character. Especially, do not use a minus sign, or a space. As you
enter the project name the High-performance Embedded Workshop will add a sub-directory for you
automatically. This can be deleted if desired.
5.
Use the Browse button to graphically select the directory in which you would like to create the project.
Alternatively, you can type the directory into the Directory field manually.
6.
The project type list displays all of the available project types (e.g. Application, Library etc.). Select the type of
project that you want to create from this list.
7.
Click the OK button to create the project and insert it into the workspace.
To insert an existing project into a workspace
1.
Select [Project -> Insert Project]. The Insert Project dialog box opens.
2.
Select the Existing project radio button.
3.
Click the Browse button to search for the project database file (".HWP" file).
4.
Click the OK button to insert the existing project into the workspace.
REJ10J2169-0100 Rev.1.00
Jul 01, 2010
Page 74 of 523
High-performance Embedded Workshop V.4.08
2.12
2. Build Basics
Setting the current project
A project can be in three states - the Current project, a Loaded project or an Unloaded project.
Since a workspace can contain many projects, only one of them can be the Current project at any time. This project is
the one that build actions and debug operations can be performed on (e.g. clicking the Build toolbar button will build the
Current project).
To set a project as the current project
Select one of the following operations:
•
Select the project that you want to make active from the [Project -> Set Current Project] sub-menu, OR
•
Select the project from the Projects tab of the workspace window. Right-click to display the pop-up menu and
select the Set as Current Project option.
If the project is Loaded, it is possible to open the project’s directory and view the files. It is also possible to change the
builder or debugger options for the project. A Loaded project can also have tool executions performed on it from the
Tools menu.
To unload a project from the workspace
1.
Select the Loaded project from the Projects tab of the workspace window.
2.
Right-click to display the pop-up menu and select the Unload Project option. It is possible to select multiple
projects in the workspace window to perform this operation.
If the project is Unloaded, its icon appears ‘grayed’ in the Projects tab of the workspace window and no actions can be
performed upon it.
Unloaded projects can be loaded by the following operations.
To load all projects in the workspace
1.
Select a workspace in the Projects tab of the workspace window.
2.
Right-click to display the pop-up menu and select the Load All Projects option.
REJ10J2169-0100 Rev.1.00
Jul 01, 2010
Page 75 of 523
High-performance Embedded Workshop V.4.08
2. Build Basics
To load a project in the workspace
1.
Select the Unloaded project from the Projects tab of the workspace window.
2.
Right-click to display the pop-up menu and select the Load Project option. It is possible to select multiple
projects in the workspace window to perform this operation.
2.13
Specifying dependencies between projects
The projects within a workspace can be dependent upon one another so that when one project is built, all its dependent
projects are built first. This is useful if one project uses another in the workspace. For example, imagine that a workspace
contains two projects. The first project is a library, which is included by an application project. In this case the library
must have been built and up-to-date before the second application can build correctly. To achieve this situation we can
specify the library as a dependent (i.e. child) project of the application project. This would then allow the library to be
built first if it is out-of-date.
When a dependent project is built, the High-performance Embedded Workshop attempts to match the configuration in the
dependent project with that of the current project. This means that if the current configuration is ‘Debug’ then the Highperformance Embedded Workshop will attempt to build the ‘Debug’ configuration in the dependent project. If this
matched configuration does not exist then the High-performance Embedded Workshop will use the configuration that
was last used in the dependent project.
To make projects depend upon another
1.
Select [Project -> Dependent Projects]. The Dependent Projects dialog box opens.
2.
Select the project to which you would like to add dependents. When you do this, the Dependent projects list
will display all of the projects in the workspace (excluding the selected project).
3.
The Dependent projects list has a checkbox for each project listed. Set the associated checkboxes to make
those projects depend upon the selected project.
4.
Click on the OK button.
When there is a project dependent on the current project, the High-performance Embedded Workshop checks whether
building of the dependent project should be executed earlier than that of the current project.
When the current project is a parent, the dependency checking will be performed on its child project.
Even if another project is dependent on the child project, this dependent project will not be checked.
REJ10J2169-0100 Rev.1.00
Jul 01, 2010
Page 76 of 523
High-performance Embedded Workshop V.4.08
2.14
2. Build Basics
Removing a project from the workspace
To remove a project from a workspace
1.
Select the project that you wish to remove in the Projects tab of the workspace window.
2.
Right-click on the selected project to invoke a pop-up menu.
3.
Select Remove Project.
Note:
You cannot remove the Current project from the workspace.
2.15
Relative projects paths in the workspace
In the High-performance Embedded Workshop when you add a project you can choose to add the project to the
workspace using a relative path. This allows you to position a file above the workspace directory and it will still be
relocated correctly if you relocate the High-performance Embedded Workshop workspace. The project is always relative
to the workspace so if the project is one directory above the workspace before it is moved the High-performance
Embedded Workshop will try to find the project in the same relative location after the relocation procedure. This is
especially useful if you are using a project shared between more than one workspace.
In older versions of High-performance Embedded Workshop this project would not have been relocated and would have
still tried to access the original file path. The older version of High-performance Embedded Workshop could only
relocate the projects, which were in a sub-directory of the workspace directory. This is still the standard behavior for the
High-performance Embedded Workshop.
To add the project to the workspace using a relative path
1.
Select the project in the workspace window.
2.
Right-click on the selected project to invoke a pop-up menu.
3.
Select Properties.
4.
Click the Project file specified as a relative path (in the .HWS file) checkbox to switch the relative file path
feature.
5.
Click OK.
REJ10J2169-0100 Rev.1.00
Jul 01, 2010
Page 77 of 523
High-performance Embedded Workshop V.4.08
3. Advanced Build Features
3. Advanced Build Features
This chapter explains the advanced build concepts.
3.1
The build process revisited
“Chapter 2, Build Basics” began by describing the build process in terms of a compiler, an assembler and a linker. This
will be the case for most installations of the High-performance Embedded Workshop. However, if you want to begin
changing the build process (e.g. adding and removing phases) then it is important to understand more about the way in
which a build functions.
3.1.1
What is a build?
Building a project means applying a set of tools upon certain input files in order to produce the desired output. Thus, we
apply a compiler upon C/C++ source files in order to create object files, we apply an assembler upon assembler source
files in order to create object files and so forth. At each step or ‘phase’ of the build, we apply a different tool upon a
different set of input files. The figure below presents a different view of the build process.
The High-performance Embedded Workshop provides the ability to change this build process via its Build Phases dialog
box, which can be accessed by selecting [Build -> Build Phases]. On the left-hand side are the phases that are defined in
the current project.
REJ10J2169-0100 Rev.1.00
Jul 01, 2010
Page 78 of 523
High-performance Embedded Workshop V.4.08
3. Advanced Build Features
The remainder of this chapter details the various functions that the Build Phases dialog box provides.
3.2
Creating a custom build phase
If you want to execute another tool before, during or after a standard build process then this can be achieved by creating
your own (i.e. custom) build phase.
To create a new custom build phase
1.
Select [Build -> Build Phases] to invoke the Build Phases dialog box.
2.
Click the Add button. This will invoke the New Build Phase wizard dialog box.
3.
Follow the 4 steps below. To move forward and backward between steps click the Next > and < Previous
buttons respectively.
Step 1
The first step asks whether you want to create an entirely new phase or whether you want to add a system phase. A
system phase is a ‘ready-made’ phase which is already defined within the toolchain you are using (e.g. compiler,
assembler, linker, librarian, etc.) or a utility phase (e.g. file copy, complexity analyzer etc.). The Add an existing system
phase button is inactive if no more system phases are available. Select the Create a new custom phase button to create
your own build phase.
REJ10J2169-0100 Rev.1.00
Jul 01, 2010
Page 79 of 523
High-performance Embedded Workshop V.4.08
3. Advanced Build Features
Step 2
The second step asks what type of phase you would like to create. There are two choices: multiple or single. When a
multiple phase is executed, the command is applied to each file in the project of a certain file group. For example, if you
set the input file group to be C source files then the command will be executed once for each C source file in the project.
A single phase is executed once at most during a build.
The input file group list contains the current file groups defined for the project. It is possible to define multiple input file
groups by selecting the Multiple Groups entry in the input file group list.
REJ10J2169-0100 Rev.1.00
Jul 01, 2010
Page 80 of 523
High-performance Embedded Workshop V.4.08
3. Advanced Build Features
Once this choice has been made the input file group selection is displayed as Multiple Groups. This dialog box allows
the user to choose multiple input file groups for the custom phase being added to the project. To select a file group check
the box next to the file group’s name. One or more file groups can be selected in this dialog box.
Step 3
The third step requests the fundamental information about the new build phase. Enter the name of the phase into the
Phase name field. Enter the location of the program file into the Command field (do not insert any command line
options as these options are specified via the Options menu of the High-performance Embedded Workshop menu bar).
Specify the default options for the phase (i.e. what options you would like new files to take when added to the project)
into the Default Options field. If you have a preferred directory in which you would like this program to run (i.e. where
you want the current working directory to be set to before the tool is executed) then enter it into the Initial directory
field.
REJ10J2169-0100 Rev.1.00
Jul 01, 2010
Page 81 of 523
High-performance Embedded Workshop V.4.08
3. Advanced Build Features
Step 4
The fourth and final step allows you to specify any environment variables that the phase requires.
To add a new environment variable click the Add button (the Environment Variable dialog is displayed). Enter the
variable name into the Variable field and the variable’s value into the Value field and then click the OK button to add
the new variable to the list. To modify an environment variable select the variable from the list and then click the Modify
button. Make the required changes to the Variable and Value fields and then click the OK button to add the modified
variable to the list. To remove environment variables select the variable that you want to remove from the list and then
click the Remove button.
If the tool you are adding can display its output whilst the tool is running then use the Read Output on Fly option. This
will display the tool output as each line of output happens. If this option is set to off then the High-performance
Embedded Workshop will store all output that is being displayed by the tool, and display it in the Output window when
the tool has finished its operation. This can be a problem when the tool is running an operation that might take many
minutes, as it is difficult to see the progress of the current execution.
REJ10J2169-0100 Rev.1.00
Jul 01, 2010
Page 82 of 523
High-performance Embedded Workshop V.4.08
3. Advanced Build Features
Note:
Using Read Output on Fly can cause problems when using certain tools on certain operating systems. If you are having
problems with tools locking up or freezing in High-performance Embedded Workshop then un-check the Read Output
on Fly option.
Click the Finish button to create the new phase. By default the new phase is added to the bottom of the Build phase
order list in the Build Order tab of the Build Phases dialog box.
3.3
Ordering build phases
In a standard build (shown in figure below), you could add a phase at four different positions: before the compiler (1),
before the assembler (2), before the linker (3) or after the linker (4).
You may place your own custom phases or move system phases to any position in the build order. It is important to
remember that if the output of your custom phase can be input into another phase then the phase order must be correct if
the build is to behave as intended.
Select [Build -> Build Phases]. The Build Phases dialog box will be displayed. The build phase dialog box provides
facilities for ordering build phases via the Build Phases dialog box. It has two tabs, which are concerned with the
ordering of phases: Build Order and Build File Order. And then you can click OK button.
REJ10J2169-0100 Rev.1.00
Jul 01, 2010
Page 83 of 523
High-performance Embedded Workshop V.4.08
3.3.1
3. Advanced Build Features
Build Order tab
The Build Order tab displays the current order in which phases will be executed when the Build ( ) or Build All (
buttons is selected. The check box to the left of each phase indicates whether or not the phase is currently enabled. A
phase can be toggled on/off by checking/unchecking its corresponding checkbox respectively.
)
To change the order of phases (system/custom) in a build or build all operation
1.
Select the phase to be moved and then click the Move Up and Move Down buttons to move the phase up and
down respectively.
2.
Click the OK button to set the new ordering.
To view the properties of a system phase
1.
Select the system phase that you would like to view.
2.
Click the Modify button.
3.
The Command tab shows general information about the phase. This may include copyright information, version
information and so on.
4.
Select the Environment tab to view the environment settings of the phase.
5.
Click the OK button to close the dialog box.
To modify a custom phase
1.
Select the custom phase that you would like to modify.
2.
Click the Modify button. The Modify Phase dialog box will be invoked with the Command tab selected.
REJ10J2169-0100 Rev.1.00
Jul 01, 2010
Page 84 of 523
High-performance Embedded Workshop V.4.08
3. Advanced Build Features
3.
Change the contents of Command and Initial directory as appropriate.
4.
If there are multiple shot phases, select the file type to execute a phase from the Input file group (for multishot phases only) drop-down list.
5.
Select the Don’t check for input file(s) existence before executing checkbox if you don’t want the Highperformance Embedded Workshop to abort the execution of the phase if any of the input files do not exist.
6.
Select the Read output on-the-fly checkbox if you want to display build output as it happens, rather than
showing the output at the end of each phase execution.
7.
Select the Environment tab to edit the environment settings for the phase.
8.
Use the Add, Modify and Remove buttons to add, modify and remove environment variables respectively.
9.
Select the Output Syntax tab and define the error, warning, and information for the custom phase.
Messages that include filenames can only be handled as syntax. Thus all syntax defined on the Output Syntax
page should include filenames. Always use a placeholder to specify a filename.
REJ10J2169-0100 Rev.1.00
Jul 01, 2010
Page 85 of 523
High-performance Embedded Workshop V.4.08
3. Advanced Build Features
When the lines showing error messages in the Build tab of the output window match the definition of Output
Syntax, you can find icons on the left to the error messages and view the source code in the editor.
If the Renesas SuperH C/C++ compiler is used, for example, the following error message may be output to the
Build tab of the output window.
C:\Workspace\SH\SH\resetprg.c(70) : C2225 (E) Undeclared name "a"
To define this error, type the following syntax.
$(FULLFILE)($(LINE))*(E)*
The correspondence between an error message and its syntax is as shown below.
Error Message (Example)
Output Syntax (Example) Description
C:\Workspace\SH\SH\resetprg.c $(FULLFILE)
Placeholder of the file name with its full path
(70)
($(LINE))
Placeholder of the line number enclosed with
parentheses
: C2225
*
Wild-card for “:” and error message number
(E)
(E)
(E) indicating an error
Undeclared name "a"
*
Wild-card for error message
There are some restrictions on these regular expressions. For example, it is not possible to define two unclear
strings next to each other, such as "**", "*$(FILEDIR)", or "$(FULLFILE)*".
It is also not possible to define ":", "\", and ".", which are commonly used in filenames and directory names, to
separate placeholders for filenames and directory names from other characters, such as
"$(FULLFILE):$(LINE)" or "$(FILENAME).*".
REJ10J2169-0100 Rev.1.00
Jul 01, 2010
Page 86 of 523
High-performance Embedded Workshop V.4.08
•
3. Advanced Build Features
When "Error" has been selected as the syntax type and the output message matches the definition of the
syntax:
An error icon ( ) appears on the left to the message output as the result of building. Doubleclicking on the line displays the corresponding source code in the editor.
•
When "Warning" has been selected as the syntax type and the output message matches the definition of the
syntax:
A warning icon ( ) appears on the left to the message output as the result of building. Doubleclicking on the line displays the corresponding source code in the editor.
•
When "Other" has been selected as the syntax type and the output message matches the definition of the
syntax:
An information icon ( ) appears on the left to the message output as the result of building. Doubleclicking on the line displays the corresponding source code in the editor.
The total number of errors and warnings will also be displayed in the Build tab of the output window at the end
of a build phase.
10. Use the Add, Modify and Remove buttons to add, modify and remove output syntax line formats respectively.
11. Click the OK button when all modifications have been made.
Note:
You can only change the environment of a system phase via the Tools Administration dialog box.
To remove a custom phase
1.
Select the phase to be removed and click the Remove button.
2.
Click the OK button to confirm the new settings.
To import a custom phase
1.
Click the Import button. The Import Custom Phase dialog box is displayed, which allows you to browse to an
existing project, from which you want to import a custom phase.
2.
Choose the location of the project, from which you want to import a custom phase. Once selected, the Import
Phase dialog box is displayed, which lists the custom phases in the imported project.
3.
Once you have decided which phase to import, highlight it in the list and click the OK button. The phase will
then be added to the Build Phases dialog box, at the bottom of the build order.
REJ10J2169-0100 Rev.1.00
Jul 01, 2010
Page 87 of 523
High-performance Embedded Workshop V.4.08
3.3.2
3. Advanced Build Features
Build File Order tab
If you were to select a C source file from the Workspace window and then activate [Build -> Build File] (or click the
Build File toolbar button ( ) you would expect the file to be compiled. Likewise, if you were to select an assembly
source file from the workspace window and then activate [Build -> Build File] you would expect the file to be
assembled. The connection between file group and which phase(s) to execute is managed by the Build File Order tab of
the Build Phases dialog box. The list displays all of the current phases that will be executed when the build file operation
is selected upon the file group shown in the File group list box. In figure below the “C source file” file group is selected
and the “Compiler” and “MyPhase” phases are associated with it. Entries in the Phase order list, of the Build File
Order tab, are added automatically as new entries are added to the Build Order tab.
For example, if you were to add a phase which takes C source files as input then this phase will be automatically added to
the list of phases to execute when a build file operation is applied to a C source file. If you don’t want a certain phase to
execute when [Build -> Build File] is selected then clear the check box to the left of the phase name in the Phase order
list.
3.3.3
File Mappings tab
By default, the files input to a build phase are only taken from the project, i.e. all project files of the type specified in the
Select input file group drop-down list on the New Build Phase dialog box. Select [Build -> Build Phases]. The Build
Phases dialog box will be displayed. If you would like a build phase to take files output from a previous build phase
(these files are called intermediate files), then you must define this in the File Mappings tab of the Build Phases dialog
box.
REJ10J2169-0100 Rev.1.00
Jul 01, 2010
Page 88 of 523
High-performance Embedded Workshop V.4.08
3. Advanced Build Features
A File Mapping means that you would like the output files of a certain type produced by one build phase (referred to as
the Source phase) to another build phase (referred to as the Destination phase). Such intermediate files are then passed
in addition to the project files.
To add a file mapping
1.
Click the Add button. The Define File Mapping dialog box opens.
2.
Select an existing file group to use for the new mapping from the File group drop-down list.
3.
Select the source phase (i.e. the phase that generates the files) from the Source phase drop-down list.
4.
Select the destination phase (i.e. the phase that takes these files) from the Destination phase drop-down list.
5.
Click the OK button to create the new mapping.
To modify a file mapping
1.
Select the mapping to be modified.
2.
Click the Modify button. The Define File Mapping dialog box opens.
3.
Modify the options as necessary.
4.
Click the OK button to commit the changes.
To remove a file mapping
1.
Select the mapping to be removed.
2.
Click the Remove button.
3.
Click the OK button to commit the changes.
REJ10J2169-0100 Rev.1.00
Jul 01, 2010
Page 89 of 523
High-performance Embedded Workshop V.4.08
3.4
3. Advanced Build Features
Setting custom build phase options
Once you have defined a custom phase, you will want to specify the command line options that should be used when it is
executed. Each defined phase has a menu option in the Build menu. To specify options for that phase select it. The dialog
that will be displayed depends on whether the custom phase selected was multiple or single (according to the selection of
phase type when it was created in the New Build Phase wizard).
If the phase selected was multiple then a list of project files is displayed on the left-hand side of the dialog to enable you
to specify the build options on a file by file basis. If the phase selected was single then there is no project file list
displayed. In either case, the three tabs below are available. This is where you can set the options that you want to apply
to the selected file(s). You can also choose which configurations are being viewed. In the configuration list, each
configuration is listed along with a special entry named Multiple configurations. If you select Multiple configurations
then the Select project configurations to modify dialog box is displayed which allows you to select more than one
configuration. This method is used throughout High-performance Embedded Workshop for modifying multiple
configurations at once.
3.4.1
Options tab
This tab allows you to define the command line options that will be passed to the phase. The Command field displays
the command that was entered when you defined the phase. Enter into the Options field the command line arguments
that you would like to pass to the command. If you want to insert a placeholder, select the relevant placeholder from the
Placeholder drop-down list and then click the Insert button. See Reference 5, Placeholders, for more information on
placeholders.
REJ10J2169-0100 Rev.1.00
Jul 01, 2010
Page 90 of 523
High-performance Embedded Workshop V.4.08
3. Advanced Build Features
Note:
An error will be returned when the total number of characters of the command line options exceeds 256.
3.4.2
Output Files tab
This tab is where you can specify the output files that will be produced by the phase. Before each file is passed into this
phase, the High-performance Embedded Workshop checks that the output files are of a less recent date than the input file.
If so, the phase will be executed for that file (i.e. input files have been modified since the output file or files were last
produced). If the files are up-to-date then the phase will not be executed.
Note:
If no output files are specified, the phase will execute regardless.
To add an output file
1.
Click the Add button. The Add Output File dialog box will be invoked.
2.
Enter the file path or browse to it using the Browse button.
3.
Click the OK button to add this output file to the list.
REJ10J2169-0100 Rev.1.00
Jul 01, 2010
Page 91 of 523
High-performance Embedded Workshop V.4.08
3. Advanced Build Features
To modify an output file
1.
Select the output file that you would like to modify.
2.
Click the Modify button. The Modify Output File dialog box opens.
3.
Modify the fields as required.
4.
Click the OK button to add the modified entry back to the list.
To remove an output file
1.
Select the output file that you would like to remove.
2.
Click the Remove button.
An output file’s path can include placeholders.
3.4.3
Dependent Files tab
This tab is where you can specify the dependent files that are needed by the phase. Before each file is passed into this
phase, the High-performance Embedded Workshop checks that the dependent files are of a more recent date than the
input file. If so, the phase will be executed for that file (i.e. dependent files have been modified since the input files was
last modified). If not, the phase will not be executed.
To add a dependent file
1.
Click the Add button. The Add Dependent File dialog box opens.
2.
Enter the file path or browse to it using the Browse button.
3.
Click the OK button to add this output file to the list.
REJ10J2169-0100 Rev.1.00
Jul 01, 2010
Page 92 of 523
High-performance Embedded Workshop V.4.08
3. Advanced Build Features
To modify a dependent file
1.
Select the dependent file that you would like to modify.
2.
Click the Modify button. The Modify Dependent File dialog box opens.
3.
Modify the fields as required.
4.
Click the OK button to add the modified entry back to the list.
To remove a dependent file
1.
Select the dependent file that you would like to remove.
2.
Click the Remove button.
A dependent file’s path can include placeholders.
3.5
Controlling the build
By default, the High-performance Embedded Workshop will execute all of the phases in a build and only stop if a fatal
error is encountered. You can change this behavior by setting the controls on the Build tab of the Options dialog box.
Select [Setup -> Options] to display the Options dialog box and then select the Build tab. If you want to stop the build
when a certain number of errors are exceeded then set the Stop build if the number of errors exceeds checkbox and
specify the error count limit in the field to the right. If you want to stop the build when a certain number of warnings are
exceeded then set the Stop build if the number of warnings exceeds checkbox and specify the warning count limit in
the field to the right.
In addition to specifying error and warning count limits, the Build tab also allows you to request that the Command line,
Environment and Initial directory of each execution should be displayed. Check the appropriate check boxes as
necessary.
REJ10J2169-0100 Rev.1.00
Jul 01, 2010
Page 93 of 523
High-performance Embedded Workshop V.4.08
3. Advanced Build Features
Notes:
•
Irrespective of what these controls are set to, the build will always halt if a fatal error is encountered.
•
When projects are dependent on one another, building stops if an error occurs in the child project and its parent
project will not be built.
Note the following descriptions when you check the Stop build if the number of errors exceeds check box and specify
a number to the controls.
The build will stop immediately once the maximum number of errors or warnings is exceeded. It will not continue to the
end of the current phase.
When the number of errors in one execution of a tool exceeds the specified number, the number of error messages
displayed on the “Output” window is the specified number plus one. A message saying that the number of error has
exceeded the specified number is NOT displayed on the Output window.
The same things as Stop build if the number of errors exceeds shown above hold also in Stop build if the number of
warnings exceeds. There is no correlation between Stop build if the number of errors exceeds and Stop build if the
number of warnings exceeds. They are independent.
3.6
Logging build output
The High-performance Embedded Workshop allows you to write the results of each build to file.
To specify a log file
1.
Select [Setup -> Customize]. The Customize dialog box opens.
2.
Select the Log tab.
3.
Select the Generate build log checkbox.
4.
Enter the full path of the log file into the Path field, or browse to it graphically by clicking the Browse button,
or click the placeholder button ( ) and select the placeholder from the pop-up menu.
5.
Click the OK button to confirm the new log file settings.
REJ10J2169-0100 Rev.1.00
Jul 01, 2010
Page 94 of 523
High-performance Embedded Workshop V.4.08
3.7
3. Advanced Build Features
Changing toolchain version
If two or more versions of the same toolchain are registered in the High-performance Embedded Workshop, you can
choose a version of the toolchain on the Change Toolchain Version dialog box. To invoke the dialog, select [Tools ->
Change Toolchain Version]. Choose one of the versions from the Toolchain version drop-down list and click the OK
button to enforce your choice.
To show information about toolchain components, select a tool from the Toolchain build phase drop-down list on the
Change Toolchain Version dialog box, and click the Information button. A tool information dialog box will show you
information about the tool. Click the Close button to close the dialog box.
3.8
Generating a makefile
The High-performance Embedded Workshop allows you to generate a makefile associated with your workspace. Highperformance Embedded Workshop is capable of generating hmake, nmake, and gnumake compatible files. The make tool
to execute makefiles is operated in the DOS command prompt and thus the use of makefiles allows you to build projects
without High-performance Embedded Workshop.
The generated makefiles can be executed in the High-performance Embedded Workshop. For details, see section 3.9,
Using a makefile inside the High-performance Embedded Workshop system.
To generate a makefile
1.
Open a workspace where you wish to generate a makefile (if the workspace includes two or more projects, the
active project must be one in which you wish to generate a makefile).
2.
Select a configuration for generating a makefile.
REJ10J2169-0100 Rev.1.00
Jul 01, 2010
Page 95 of 523
High-performance Embedded Workshop V.4.08
3. Advanced Build Features
3.
Select [Build -> Generate Makefile]. The Generate Makefile dialog box opens.
4.
Select a makefile type in Generate makefile for.
•
the current configuration in the currently active project
•
all configurations in the currently active project
•
all configurations in all loaded projects in the current workspace
5.
Enter the file name in the MakeFile name edit box. To insert a placeholder, place the cursor at the position
where you wish to insert the placeholder, click the placeholder button ( ), and select Placeholder from the
pop-up menu. The default makefile names are as follows.
•
When "the current configuration in the currently active project" is selected:
$(PROJECTNAME)_$(CONFIGNAME).mak
•
When "all configurations in the currently active project" is selected: $(PROJECTNAME).mak
•
When "all configurations in all loaded projects in the current workspace" is selected: $(WORKSPNAME).mak
6.
Select a makefile format in the Makefile format drop-down list. High-performance Embedded Workshop is
capable of generating GNUMake, HMake and NMake compatible files.
7.
In the Relative paths drop-down list, select how directories within the makefile should be expressed.
“Workspace directory and below only” is the default option. See the table below for details.
Option
Workspace Directory and below Outside the Workspace Directory
None
Absolute path
Absolute path
Workspace directory and below only
Relative path
Absolute path
All
Relative path
Relative path
REJ10J2169-0100 Rev.1.00
Jul 01, 2010
Page 96 of 523
High-performance Embedded Workshop V.4.08
8.
3. Advanced Build Features
Selecting the Use static sub-command files checkbox will generate separate command files in the make
destination directory. By default, this checkbox is not selected.
Note:
While a toolchain included in the compiler packages listed below is in use, the Use static sub-command files
checkbox has a fixed tick if you have selected GNUMake in Makefile format.
- C/C++ Compiler Package for SuperH Family
- C/C++ Compiler Package for H8SX, H8S, H8 Family
- C/C++ Compiler Package for RX Family
9.
Selecting the Scan dependencies whilst building make file checkbox will execute a dependency scan before
creation of a makefile. This checkbox is selected by default.
10. Click OK.
The High-performance Embedded Workshop will create a subdirectory called ’make’ within the current workspace
directory and then generate the makefile into it. The executable HMAKE.EXE, located in the High-performance
Embedded Workshop installation directory, is provided for you to execute the makefiles generated by HMake selected in
Makefile format.
If you wish to modify makefiles, see Reference 13, HMAKE User Guide.
Note:
If the name of the High-performance Embedded Workshop installation directory includes a space, the GNU Make
command may not work correctly when GNU Make is selected as the makefile format with the makefile generating
function.
To execute a makefile (HMake)
1.
Open a DOS Command Prompt window and move to the ‘make’ directory where the makefile was generated.
2.
Execute HMAKE. Its command line is HMAKE.EXE <makefile>.
Note:
The degree of portability of a generated makefile is entirely dependent upon how portable the project itself is. For
example, any compiler options that include full paths to an output directory or include file directory will mean that, when
given to another user with a different installation, the build will probably fail. In general use placeholders wherever
possible - using a full, specific path should be avoided when possible.
REJ10J2169-0100 Rev.1.00
Jul 01, 2010
Page 97 of 523
High-performance Embedded Workshop V.4.08
3.9
3. Advanced Build Features
Using a makefile inside the High-performance Embedded Workshop system
The High-performance Embedded Workshop also allows you to configure the internal build to use a particular make tool
(hmake, nmake, or gmake) as well as the internal High-performance Embedded Workshop system.
The build procedures using makefiles are listed below. nmake and gmake tools must be prepared by the user, while
hmake is installed in the High-performance Embedded Workshop installation directory.
To set-up the internal makefile execution
1.
Create a High-performance Embedded Workshop workspace.
2.
If you want to use a High-performance Embedded Workshop generated makefile, select [Build -> Generate
Makefile] to generate a makefile. For details, see section 3.8, Generating a makefile.
3.
Select [Setup -> Options]. The Options dialog box opens.
4.
Click the Build tab.
5.
Enter the make tool name to execute the makefile in the Command (excluding parameters) edit box. The
default is hmake ($(HEWDIR)\hmake.exe).
6.
Select the Use makefile build system (for this workspace) checkbox. This means that the makefile should be
executed rather than the internal build.
7.
While the Generate makefile before build commences checkbox is selected, the High-performance Embedded
Workshop will generate a makefile before executing the build. This means the makefile will always be up to
date with the High-performance Embedded Workshop project system.
8.
Enter the file name in the Makefile filename edit box. The default file name is
“$(WORKSPDIR)\make\$(PROJECTNAME)_$(CONFIGNAME).mak”.
Note: This entry can be left empty if no makefile needs to be specified on the command line.
9.
In the Initial directory edit box, enter the current directory where the makefile is to be executed. When this edit
box is empty, the initial directory will default to “$(WORKSPDIR)”.
REJ10J2169-0100 Rev.1.00
Jul 01, 2010
Page 98 of 523
High-performance Embedded Workshop V.4.08
3. Advanced Build Features
10. Enter the options for building the makefile in the Makefile options edit box.
11. Enter the options for cleaning the makefile in the Clean options edit box.
12. Click on the OK button.
Once this system is setup the build button, menu and keyboard shortcuts are linked to the makefile tool execution. The
clean all projects button, menu and keyboard shortcut will also be linked to the makefile execution. All output is directed
to the Build tab of the output window as in the case of the normal build. If you are using a build phase supported by
High-performance Embedded Workshop the line of an error message can be double-clicked to jump to the source files.
The help link should also be supported. Note when using the HMAKE.exe system the Build All toolbar button ( ) will
pass a command to HMAKE to force a re-build all operation.
To set-up the makefile system environment
By default, the makefile will be executed in the default system environment (the same environment used within Highperformance Embedded Workshop). If this is not desirable, the environment can be configured as described below:
1.
In the Build tab, click the System button to the right of the Makefile options controls. This will launch the
Makefile System Environment dialog box:
2.
The Inherit system environment checkbox can be used to alter the inheritance of the system environment:
Set: The makefile will be executed in the standard environment. (Default.)
Clear: The makefile will be executed in a fresh environment.
Note:
Only the "SystemRoot" variable will be carried over into the new environment as it is needed to allow program
to run in Windows®.
3.
In both cases, additional environment variable can be set using the Environment variables controls. Any values
set here will override the value in the current system environment.
4.
Click OK to save the changes, and return to the Options dialog box. Values will not be committed to the
Workspace until the OK button in that dialog is also used.
REJ10J2169-0100 Rev.1.00
Jul 01, 2010
Page 99 of 523
High-performance Embedded Workshop V.4.08
3.10
3. Advanced Build Features
Customizing the High-performance Embedded Workshop linkage order
Modules are usually linked in the alphabetical order in High-performance Embedded Workshop. However, you can
specify the linkage order if you wish to.
To manually change the linkage order
1.
Click [Build -> Linkage Order]. The Linkage Order dialog box opens.
2.
Select the Use custom linkage order check box.
3.
The Object order list box allows you to specify the linkage order of modules. Each module has a different icon
depending on where it originated from. This is shown below:
Note:
While a toolchain included in the compiler packages listed below is in use, the Object order list box shows
library files along with object files.
- C/C++ Compiler Package for SuperH Family
- C/C++ Compiler Package for H8SX, H8S, H8 Family
- C/C++ Compiler Package for RX Family
However, only object files matter to the linkage order. The order of library files is only used in searching for
undefined symbols.
REJ10J2169-0100 Rev.1.00
Jul 01, 2010
Page 100 of 523
High-performance Embedded Workshop V.4.08
3. Advanced Build Features
You can change the linkage order in the following ways.
•
•
To move a single or consecutive modules
Move to top
Moves the selected module(s) to the top.
Move up
Switches the selected module(s) and the
previous module.
Move down
Switches the selected module(s) and the
next module.
Move to bottom
Moves the selected module(s) to the
bottom.
To move non-consecutive modules
Move to top
Moves all of the selected modules to the
top.
Group up
Moves all of the selected modules to the
position of the first one among them.
Group down
Moves all of the selected modules to the
position of the last one among them.
Move to bottom
Moves all of the selected modules to the
bottom.
REJ10J2169-0100 Rev.1.00
Jul 01, 2010
Page 101 of 523
High-performance Embedded Workshop V.4.08
3. Advanced Build Features
If the top module is selected, the Move to top and Move up buttons will be disabled. If the bottom module is
selected, the Move to bottom and Move down buttons will be disabled.
The current linkage order can be saved in a text format. You can modify the linkage order saved in the file and load it to
apply the new linkage order.
To load the linkage order from a text file
1.
Click [Build -> Linkage Order]. The Linkage Order dialog box opens.
2.
Select the Use custom linkage order check box.
3.
Click on the Import button. The Import Linkage Order dialog box opens.
4.
Choose a file and click on the Select button. The Linkage Order Import Report dialog box opens.
5.
To load the linkage order saved in the file, click on the Continue button. The listbox will be updated with the
new linkage order.
Note: This will overwrite your current linkage order.
6.
Click on the Cancel button to close the dialog box without modifying your current linkage order.
To save the linkage order in a text file
1.
Click [Build -> Linkage Order]. The Linkage Order dialog box opens.
2.
Select the Use custom linkage order check box.
3.
Click on the Export button. The Export Linkage Order dialog box opens.
4.
Choose a file and directory and click on the Save button. The current settings in the list box are saved in the
specified text file.
Example:
# Exported linkage order for project "Project_name" - configuration "Debug"
c:\workspace\workspace_name\project_name\debug\main.obj
c:\workspace\workspace_name\project_name\debug\resetprg.obj
c:\workspace\workspace_name\project_name\debug\intprg.obj
c:\workspace\workspace_name\project_name\debug\runtime_library.lib
c:\workspace\workspace_name\project_name\debug\projectname.lib
c:\workspace\workspace_name\project_name\debug\user_edit_options.lib
REJ10J2169-0100 Rev.1.00
Jul 01, 2010
Page 102 of 523
High-performance Embedded Workshop V.4.08
3. Advanced Build Features
Open the file (e.g. in the Editor), modify the linkage order, and then save it in the text format. Follow the
procedures of “To import the linkage order from the text file” to load the new linkage order.
When you are using multiple configurations it is likely that the linkage order will be very similar. To do this effectively
you can copy the current settings in the dialog to other configurations. This is described below:
To copy the linkage order from one configuration to another
1.
Click [Build -> Linkage Order]. The Linkage Order dialog box opens.
2.
Select the Use custom linkage order check box.
3.
Select the configuration you wish to copy in the Current configuration drop-down list. This defaults to the
currently loaded configuration.
4.
Click the Copy to button this displays the Select Configuration To Copy To dialog box and asks you which of
the configurations in the current project you wish to copy the current linkage order to.
5.
Select a configuration and click OK.
REJ10J2169-0100 Rev.1.00
Jul 01, 2010
Page 103 of 523
High-performance Embedded Workshop V.4.08
4. Editor
4. Editor
This chapter describes how to use the editor that is provided with the High-performance Embedded Workshop.
4.1
Editor window
The editor window contains the file windows that are being viewed or edited.
The title bar of the active window will appear a different color from that of the others (“dbsct.c” is the active window in
figure bellow). All text operations such as typing, pasting text and so forth only affect the active window.
To switch to another source file window (i.e. to make some other window the active window) there are a number of
methods:
•
Click on it if it is visible, OR
•
Press CTRL+TAB or CTRL+SHIFT+TAB to cycle through the windows one after another, OR
•
Select the window by name from the Window menu, OR
•
Select its tab at the bottom of the editor window.
Title bar
Toolbar
Shows information on files (file name, asterisk * while editing, and Read-Only attribute). If a
file is included in a directory of the current project, the file name is displayed on the title bar of
the editor window. Otherwise the title bar of the editor window displays the file name
including its absolute path.
The toolbar is only shown while the debugger is connected. When one display mode is active,
clicking another toolbar button switches the display mode. If you place the mouse pointer on a
toolbar button, the name of the button pops up.
REJ10J2169-0100 Rev.1.00
Jul 01, 2010
Page 104 of 523
High-performance Embedded Workshop V.4.08
Column header
Column
Source code field
Tab
4.2
4. Editor
You can adjust the column width by dragging the mouse on a column header. Moreover, rightclicking the column header displays a pop-up menu. A tick mark right next to an entry
indicates that this column is displayed. Clicking an entry will switch showing/hiding the
column. If you place the mouse pointer on a column header, the name of the column pops up.
You can also select showing/hiding the column header itself.
There are several spaces (columns) on the left of the source code field. If you place the mouse
pointer on a column, the name of the column pops up.
This field includes codes highlighting the syntax. The maximum number of characters per line
shown in the editor is 8,192. Right-clicking within this field displays a pop-up menu
containing available options.
Shows information on files (file name and asterisk * while editing). If you place the mouse
pointer on a tab, the file name including its absolute path pops up.
Right-clicking within this field displays a pop-up menu containing available options.
Working with multiple files
The file area is where you will work with the files of your project. The editor allows you to have many files open at one
time, to switch between them, to arrange them in different configurations and to edit them in whichever order you want
to. The operations that you can perform upon the windows are typical of most Windows® applications and they can be
found under the Window menu:
Menu Option
Operation
[Window -> Cascade]
Arrange all open windows so that they overlap, with the top left of each Editor window
visible.
[Window -> Tile Horizontally]
Arrange all open windows horizontally so that they occupy the entire Editor window,
without any overlaps.
[Window -> Tile Vertically]
Arrange all open windows vertically so that they occupy the entire Editor window, without
any overlaps.
[Window -> Arrange Icons]
Line up all minimized windows at the bottom of the Editor window.
[Window -> Close All]
Close all open Editor windows.
The files within the editor can be displayed in a ‘notebook’ style. This means that each file has a separate tab associated
with it to aid in navigating between files.
To show files in a notebook style
1.
Select [Setup -> Options]. The Options dialog box opens.
2.
Select the Editor tab.
3.
Select the Show files in notebook checkbox as appropriate.
4.
Click the OK button.
REJ10J2169-0100 Rev.1.00
Jul 01, 2010
Page 105 of 523
High-performance Embedded Workshop V.4.08
4.3
Standard file operations
4.3.1
Creating a new file
4. Editor
To create a new editing window
Select one of the following operations:
•
Click the New File toolbar button (
•
Press CTRL+N, OR
•
Select [File -> New].
), OR
The new window will be given an arbitrary name by default. You can provide a new name when you save the file.
4.3.2
Editing a file
The High-performance Embedded Workshop editor’s standard editing functionality is available through the usual
methods (i.e. the menu, toolbar and keyboard shortcuts) and is additionally supported via a pop-up menu that is local to
each Editor window. Right-click in an open Editor window to invoke the pop-up menu.
The table below outlines the basic operations that are provided by the editor.
Operation
Effect
Action
Undo
Reverses the last editing operation
Select [Edit -> Undo]
Press CTRL+Z
Redo
Repeats the last undone editing operation
Select [Edit -> Redo]
Press CTRL+Y
Cut
Removes highlighted text and places it on the
Windows® clipboard
Click the Cut toolbar button ( )
Press CTRL+X
Select [Edit -> Cut]
Select Cut from the pop-up menu
Copy
Places a copy of the highlighted text into the Windows® Click the Copy toolbar button (
)
clipboard
Press CTRL+C
Select [Edit -> Copy]
Select Copy from the pop-up menu
Paste
Copies the contents of the Windows® clipboard into the Click the Paste toolbar button (
)
active window at the position of the insertion cursor
Press CTRL+V
Select [Edit -> Paste]
Select Paste from the pop-up menu
Clear
Removes highlighted text (it is not copied to the
Windows® clipboard)
Select [Edit -> Clear]
Press Delete
Select All
Selects (i.e. highlights) the entire contents of the active
window
Select [Edit -> Select All]
Press CTRL+A
REJ10J2169-0100 Rev.1.00
Jul 01, 2010
Page 106 of 523
High-performance Embedded Workshop V.4.08
4. Editor
If you edit the file, the title bar of the editor window shows an asterisk (*). (e.g. filename.c*)
This asterisk remains until you save the file. If you undo all the changes made in the file, the asterisk disappears.
Selecting text in the editor
It is possible to select text in the same manner as all editors. However to access column selection hold down the ALT
key while you are selecting the text with the mouse. This changes the selection technique from line to column selection.
4.3.3
Saving a file
To save the contents of an editing window
1.
Ensure that the window, whose contents you want to save, is the active window.
2.
Select one of the following operations:
•
Click the Save File toolbar button (
•
Press CTRL+S, OR
•
3.
Select [File -> Save].
If the file has not been saved before, a File Save dialog box will be displayed. Enter a filename, specify a
directory and then click the OK button to create the file with the name given in the directory specified. If the file
has been saved before then the file will be updated (no dialog box will be displayed).
), OR
To save the contents of an editing window under a new name
1.
Ensure that the window, whose contents you want to save, is the active window.
2.
3.
Select [File -> Save As].
A File Save dialog box will be displayed. Enter a filename, specify a directory and then click the OK button to
create the file with the name given, in the directory specified.
To save the contents of every open editor window
1.
Select one of the following operations:
•
Click the Save All toolbar button (
•
2.
Select [File -> Save All].
If any of the files has not been saved before, a File Save dialog box will be displayed. Enter a filename, specify
a directory and then click the OK button to create the file with the name given in the directory specified. If any
of the files have been saved before, then that file will be updated (no dialog will be displayed).
REJ10J2169-0100 Rev.1.00
Jul 01, 2010
), OR
Page 107 of 523
High-performance Embedded Workshop V.4.08
4. Editor
When you attempt to save a read-only file, a confirmation dialog box appears asking if you wish to save the file as
another name.
•
Clicking Yes opens the Save file dialog box. Change the file name before saving.
•
Clicking No closes the file without saving.
•
Clicking Overwrite saves the file by overwriting the contents. The file is no longer read-only.
•
Clicking Cancel cancels the attempt to save the file.
4.3.4
Opening a file
To open a file
1.
Select one of the following operations to open a File Open dialog box:
•
Click the File Open toolbar button (
•
Press CTRL+O, OR
•
2.
Select [File -> Open].
Use the directory browser to navigate to the directory in which the file you want to open is located. Use the Files
of Type combo box to select the type of file you want to open (or set it to All Files (*.*) to see every file in a
directory).
3.
Once you have located the file, select it and click Open.
), OR
To open a file, drag the file from the Windows® Explorer and drop it into the High-performance Embedded Workshop
main window.
To open a source file on the Projects tab of the workspace window, select one of the following ways:
•
Double-click the file, OR
•
Select the file and click the right-hand mouse button. Select Open <file name> from the pop-up menu, OR
•
If the file has already been selected (focused), press Enter.
REJ10J2169-0100 Rev.1.00
Jul 01, 2010
Page 108 of 523
High-performance Embedded Workshop V.4.08
4. Editor
You can also use another editor (external editor) to open files. For details, see section 6.9,Using an external editor.
The High-performance Embedded Workshop keeps track of the last files that you have opened and adds them to the File
menu under the [Recent Files] sub-menu.
To open a recently used file
Select [File -> Recent Files] and from this sub-menu select the desired file.
4.3.5
Closing files
To close an individual file
Select one of the following operations:
•
Double-click the Editor window’s system menu (located at the top left of each window), OR
•
Click on the Editor window’s system menu (located at the top left of each window) and select the Close menu
option, OR
•
Ensure that the window that you want to close is the active window and then press CTRL+F4, OR
•
•
Ensure that the window that you want to close is the active window and then select [File -> Close], OR
Click on the Close button (located at the top right of each window).
To close all files
Select [Window -> Close All].
If you attempt to close an edited file that is not saved, a confirmation dialog box appears asking if you wish to save the
file.
•
Clicking No closes the file without saving.
•
Clicking Cancel returns to the editor window.
REJ10J2169-0100 Rev.1.00
Jul 01, 2010
Page 109 of 523
High-performance Embedded Workshop V.4.08
4. Editor
•
Clicking Yes closes the file by overwriting the contents. If the file has the read-only attribute, a confirmation
dialog box appears asking if you wish to save the file as another name.
•
Clicking Yes opens the Save file dialog box. Change the file name before saving.
•
Clicking No closes the file without saving.
•
Clicking Overwrite closes the file by overwriting the contents.
•
Clicking Cancel returns to the editor window.
4.3.6
Pop-up menu to close the window
In the High-performance Embedded Workshop editor window it is possible to save and close editor file window via the
related tab’s pop-up menu.
Right-clicking on the tab of the Editor window opens a pop-up menu containing available options.
Pop-up Menu Option
Function
Save
Saves the contents of an editing window.
Close
Closes an individual file.
REJ10J2169-0100 Rev.1.00
Jul 01, 2010
Page 110 of 523
High-performance Embedded Workshop V.4.08
4. Editor
In the Disassembly window it is possible to close window via the related tab’s pop-up menu.
Right-clicking on the tab of the Disassembly window opens a pop-up menu containing available options.
Pop-up Menu Option
Function
Close
Closes the Disassembly window.
4.4
Searching and navigating through files
4.4.1
Finding text
To search for text in the current file
1.
Ensure that the window, whose contents you want to search, is the active window.
2.
Position the insertion cursor at the point from which you want to start your search.
3.
Select one of the following operations to open the Find dialog box:
•
Click the Find toolbar button (
•
Press the CTRL+F key, OR
•
•
Select [Edit -> Find], OR
Select Find from the pop-up menu in the Editor window.
), OR
4.
Enter the text that you want to search for into the Find what field, or select a previous search string from the
drop-down list box. If you select text before invoking the find operation, the selected text will be automatically
placed into the Find what field.
5.
If you would like to search for character string as a whole word then click the Match whole word only
checkbox. When this option is not selected, the search will be for any string that is matched by the search string.
6.
If you would like your search to be case-sensitive (i.e. to distinguish between upper and lower case letters) then
check the Match case checkbox.
7.
If your search string uses regular expressions then check the Regular expressions checkbox. See Reference 4,
Regular Expressions, for further information.
REJ10J2169-0100 Rev.1.00
Jul 01, 2010
Page 111 of 523
High-performance Embedded Workshop V.4.08
4. Editor
8.
The Direction radio buttons allow you to select the direction of the search. Selecting Down means that the
search will be performed from the insertion cursor towards the bottom of the file. Selecting Up means that the
search will be performed from the insertion cursor towards the top of the file.
9.
Click the Find Next button to begin the search.
You can also search for text in multiple files.
4.4.2
Finding text in multiple files
To search for text in multiple files
1.
Select one of the following operations to open the Find In Files dialog box:
•
Click the Find In Files toolbar button (
•
Press the F4 key, OR
•
Select [Edit -> Find in Files].
), OR
2.
Enter the text that you want to search for into the Find field, or select a previous search string from the dropdown list box. If you selected text before invoking the find operation, the selected text will be automatically
placed into the Find what field.
3.
Enter the file extensions of the files you would like to search into the In files/types field. If several extensions
are specified, be sure to separate them with a semicolon (e.g. *.C; *.H).
REJ10J2169-0100 Rev.1.00
Jul 01, 2010
Page 112 of 523
High-performance Embedded Workshop V.4.08
4. Editor
4.
If you would like your search to be case-sensitive (i.e. to distinguish between upper and lower case letters) then
check the Match case checkbox.
5.
If you would like your search to match a whole word, as opposed to matching all occurrences, then check the
Match whole word only checkbox.
Note: this option is mutually-exclusive with the Regular expressions, only one of these two options can be
used at any given time.
6.
If your search string uses regular expressions then check the Regular expressions checkbox. See Reference 4,
Regular Expressions, for further information.
7.
If you would like your search results to appear in the Find in Files 2 tab in the Output Window instead of the
Find in Files 1 tab, check the Output to 'Find in Files 2' checkbox (this enables two different sets of search
results to be available in the Output Window).
8.
Select a search location type.
•
Directory
Selecting this option will enable searching a directory (or directory structure) for the given search string. For this
options, set the Search sub directories checkbox if you also wish to search all sub-directories of the given
directory. If you just want to search the specified single directory in Directory field then ensure that this
checkbox is not checked.
•
Active project
Selecting this option will enable you to search the files belonging to the currently active project in the
workspace.
•
All loaded projects
Selecting this option will enable you to search the files belonging to all loaded projects in the workspace.
Note that the Active project and All loaded projects options will not search project dependencies (include
files).
9.
4.4.3
Click Find to begin the search. Any matches found will be displayed in the Find in Files 1 or Find in Files 2
tab of the Output window. To stop a Find In Files action once it is under way, select the [Edit -> Stop Find in
Files] menu option. Once the Find In Files operation is complete, you may jump to an instance of the search
string by double-clicking on the desired entry in the Output window.
Replacing text
Replacing text is similar to finding text, as discussed in the previous section. The difference is that when the text is found
you have the option to replace it with other text.
To replace text in a file
1.
Ensure that the window, whose contents you want to replace, is the active window.
2.
Position the insertion cursor at the point from which you want to start your search.
REJ10J2169-0100 Rev.1.00
Jul 01, 2010
Page 113 of 523
High-performance Embedded Workshop V.4.08
4. Editor
3.
Select one of the following operations to open the Replace dialog box:
•
Press the CTRL+H key, OR
•
•
Select [Edit -> Replace], OR
Select Replace from the pop-up menu in the Editor window.
8.
Enter the text that you want to search for into the Find what field, or select a previous search string from the
drop-down list box. If you select text before invoking the replace operation, the selected text will be
automatically placed into the Find what field.
9.
Enter the text that you want to replace the search string with, or select a previous replace string from the dropdown list box.
10. If you would like to search for character string as a whole word then click the Match whole word only
checkbox. When this option is not selected, the search will be for any string that is matched by the search string.
11. If you would like your search to be case-sensitive (i.e. to distinguish between upper and lower case letters) then
check the Match case checkbox.
12. If your search string uses regular expressions then check the Regular expressions checkbox. See Reference 4,
Regular Expressions, for further information.
13. If you clicked the Find Next button, the editor will search for the first occurrence of the search string. Click the
Replace button if you want to replace it. Click Replace All button to replace all occurrences or click the Cancel
button to stop the replace action. If you select Selection in the Replace In field, the replace action will be
performed in the range of the selected text. If you select Whole file, the replace action will be performed on the
whole file. If you select All open files, all files that are currently open in the editor will have the replace
operation carried out on them.
4.4.4
Jumping to a specified line
To jump to a line in a file
1.
Ensure that the window, whose contents you want to replace, is the active window.
2.
Select one of the following operations to open the Goto dialog box:
REJ10J2169-0100 Rev.1.00
Jul 01, 2010
Page 114 of 523
High-performance Embedded Workshop V.4.08
•
•
•
3.
4. Editor
Press CTRL+G, OR
Select [Edit -> Goto Line], OR
Select Goto Line from the pop-up menu in the Editor window.
Enter the number of the line that you want to jump to into the Line number box and then click the OK button.
The insertion cursor will be placed at the start of the line number specified.
4.5
Bookmarks
When working with many large files at a time, it can become difficult to locate specific lines or areas of interest.
Bookmarks enable you to specify lines that you want to jump back to at a subsequent time. One example of its use is in a
large C file where you may want to set a bookmark on each function definition. Once a bookmark has been set, it exists
until it is removed or the file is closed.
To set a bookmark
1.
Place the insertion cursor on the line to mark.
2.
Select one of the following operations:
•
Click the Toggle Bookmark toolbar button (
•
Press CTRL+F2, OR
•
•
3.
), OR
Select [Edit -> Bookmarks -> Toggle Bookmark], OR
Right-click and select [Bookmarks -> Toggle Bookmark] from the pop-up menu.
A bookmark icon ( ) will be placed on the bookmarked line, to indicate that it is an active bookmark.
To remove a bookmark
1.
Place the insertion cursor on the marked line.
2.
Select one of the following operations:
•
Click the Toggle Bookmark toolbar button (
•
Press CTRL+F2, OR
•
•
3.
), OR
Select [Edit -> Bookmarks -> Toggle Bookmark], OR
Right-click and select [Bookmarks -> Toggle Bookmark] from the pop-up menu.
The bookmark icon will be removed from the line.
REJ10J2169-0100 Rev.1.00
Jul 01, 2010
Page 115 of 523
High-performance Embedded Workshop V.4.08
4. Editor
To jump to the next bookmark in a file
1.
Ensure that the insertion cursor is somewhere within the file to be searched.
2.
Select one of the following operations:
•
Click the Next Bookmark toolbar button (
•
Press F2, OR
•
•
Select [Edit -> Bookmarks -> Next Bookmark], OR
Right-click and select [Bookmarks -> Next Bookmark] from the pop-up menu.
), OR
To jump to the previous bookmark in a file
1.
Ensure that the insertion cursor is somewhere within the file to be searched.
2.
Select one of the following operations:
•
Click the Previous Bookmark toolbar button (
•
Press SHIFT+F2, OR
•
•
Select [Edit -> Bookmarks -> Previous Bookmark], OR
Right-click and select [Bookmarks -> Previous Bookmark] from the pop-up menu.
), OR
To remove all bookmarks
1.
Ensure that the window, whose bookmarks you want to remove is the active window.
2.
Select one of the following operations:
•
Click the Clear All Bookmarks toolbar button (
•
•
Select [Edit -> Bookmarks -> Clear All Bookmarks], OR
Right-click and select [Bookmarks -> Clear All Bookmarks] from the pop-up menu.
4.6
), OR
Printing a file
To print a file
1.
Ensure that the window, whose contents you want to print, is the active window.
2.
Select one of the following operations:
•
Click the Print toolbar button (
•
Press CTRL+P, OR
•
Select [File -> Print].
REJ10J2169-0100 Rev.1.00
Jul 01, 2010
), OR
Page 116 of 523
High-performance Embedded Workshop V.4.08
4.7
Configuring text layout
4.7.1
Page set-up
4. Editor
When you print a file from the High-performance Embedded Workshop editor, the settings in the print dialog affect the
way the file is printed (e.g. double or single sided). Control over how the text is formatted on the page can also be
controlled via the Page Setup option. This allows you to specify the margins (top, bottom, left and right) of your
printouts. It is often necessary to set this because some printers cannot print to the edges of an A4 page. Furthermore,
some users have their own layout requirements (e.g. a large left-hand margin so that code can be placed in an A4 binder).
To set up the page margins
1.
Select [File -> Page Setup]. The Page Setup dialog box opens.
2.
Enter the width of the margins required into the Left, Right, Top and Bottom fields.
3.
Set the Inch or mm option accordingly.
4.
Click the OK button for the new settings to take effect.
To set up the header and footer information
1.
Select [File -> Page Setup]. The Page Setup dialog box opens.
2.
Enter into the Header and Footer edit fields the text required to be displayed. All normal placeholders are
available along with page numbering, text justification and date fields. These are all expanded before the page is
to be printed.
3.
Click the OK button for the new settings to take effect.
REJ10J2169-0100 Rev.1.00
Jul 01, 2010
Page 117 of 523
High-performance Embedded Workshop V.4.08
4. Editor
To set up print wrapping
1.
Select [File -> Page Setup]. The Page Setup dialog box opens.
2.
Click the Wrap Text check box. This switches on the wrap text facility when printing so no text is truncated
and everything is visible.
3.
Click OK for the new settings to take effect.
4.7.2
Changing tabs
To change tab size
1.
Select [Setup -> Options]. The Options dialog box opens.
2.
Select the Editor tab.
3.
Enter into Tab Size the number of desired tabs.
4.
Click the OK button for the new tab settings to take effect.
When the TAB key is pressed in the editor a tab character is usually stored in the file. However, sometimes it is
preferable to store spaces instead. The representation of tab characters can be controlled via the Options dialog box.
To use spaces as tabs
1.
Select [Setup -> Options]. The Options dialog box opens.
2.
Select the Editor tab.
3.
Set the Use spaces as tabs checkbox as appropriate.
4.
Click the OK button for the new tab settings to take effect.
4.7.3
Auto indentation
When you press Enter the editor, the insertion cursor will move to the next line down, at the first column (i.e. against the
left-hand side of the window). Auto Indentation is a feature which, when RETURN is pressed, places the insertion
cursor on the next line (as before) but under the first non-whitespace character of the previous line. This enables you to
type neat C/C++ or assembler code faster as you don’t have to type leading spaces or tabs yourself.
REJ10J2169-0100 Rev.1.00
Jul 01, 2010
Page 118 of 523
High-performance Embedded Workshop V.4.08
4. Editor
The figure below illustrates two examples. The first shows the effect of pressing Enter when the Auto Indentation
feature is disabled - the insertion cursor returns to the left-hand side of the window on the next line. When the ‘int z = 20’
line is typed, it is not aligned with the previous two lines. The second example shows the effect of pressing Enter when
Auto Indentation is enabled - the insertion cursor drops underneath the ‘i’ of the ‘int’ word on the previous line. Now,
when the ‘int z = 20’ line is typed, it is automatically aligned (i.e. automatically indented).
To enable/disable Auto Indentation
4.8
1.
Select [Setup -> Options]. The Options dialog box opens.
2.
Select the Editor tab.
3.
Set the Enable auto indentation checkbox. By default, this checkbox is selected.
4.
Click the OK button for the new settings to take effect.
Splitting a window
The High-performance Embedded Workshop editor allows you to split an editor window into two. The split bar button is
located just underneath the maximize button at the top right-hand corner of any editor window (as shown below).
To split a window
Double-click the split bar button to split the window in half, or click on the split bar button, keep the button pressed, drag
the mouse down and then release the mouse button at the point you want to split the window.
To adjust the position of the split bar
Click on the split bar itself, keep the button pressed then move the bar to the new position and then release the button.
REJ10J2169-0100 Rev.1.00
Jul 01, 2010
Page 119 of 523
High-performance Embedded Workshop V.4.08
4. Editor
To remove the split bar
Double-click on the split bar or move the split bar to the top or bottom of the window.
4.9
Changing the editor font
The High-performance Embedded Workshop allows you to specify the font to be used in its internal editor. All editor
windows, regardless of the file type, use the same font.
To change the editor font
1.
Select [Setup -> Format Views]. The Format Views dialog box opens.
2.
Select the Source icon in the tree. The Font tab should be available on the right of the Format Views dialog
box.
3.
Select the font type from the Font list.
4.
Select the font size from the Point Size list.
5.
When this is being modified the sample text below shows what the font will look like.
6.
Click the OK button.
4.10
Syntax coloring
To enhance code readability, the High-performance Embedded Workshop editor can display specific strings (i.e.
keywords) in different colors. For instance, C source code comments could be shown in green, and C types (e.g. int)
could be shown in blue.
The coloring method used can be specified on a file group by file group basis. For example, you can define different
color schemes for C source file, C header file, Assembly source file, or Assembly include file.
Note:
When you create a new file, syntax coloring will not be active, as a new file does not initially have an extension (new
files are named arbitrarily by the editor without an extension). In order to activate syntax coloring, you must save the new
file with a name and extension that the High-performance Embedded Workshop recognizes. See section 2.5, File
extensions and file groups, for information on file extensions.
REJ10J2169-0100 Rev.1.00
Jul 01, 2010
Page 120 of 523
High-performance Embedded Workshop V.4.08
4.10.1
4. Editor
Changing text colors
To change existing colors
1.
Select [Setup -> Format Views]. The Format Views dialog box opens.
2.
Select the view you are interested in changing the font for. If it is the editor expand the "Source" in the tree on
the left hand side of the dialog box.
3.
Select the file type for which you want to edit syntax coloring from the File group list and then expand and
select it.
4.
Select the category are interested in. The tabs on the right side of the dialog box change depending on the
selection.
5.
Select the Color tab.
6.
Modify the Foreground and Background color lists as desired. The System color refers to the current window
foreground and background settings in Control Panel.
7.
Click the OK button for the new color settings to take effect.
4.10.2
Creating new keywords
To create new keyword groups
1.
Select [Setup -> Format Views]. The Format Views dialog box opens. Expand the Source view icon in the
tree.
2.
Select the file type for which you want to create a new keyword group from the tree on this dialog box.
REJ10J2169-0100 Rev.1.00
Jul 01, 2010
Page 121 of 523
High-performance Embedded Workshop V.4.08
3.
4. Editor
Click the Add button underneath the tree. The Add Category dialog box then opens. Enter the name of the
group into the Category Title field. Click the OK button to add a keyword group. To modify the name of the
group, select the keyword group and click the Modify button underneath the tree. Modify Category dialog box
then opens. Enter the name of the group into the Category Title field. To remove a keyword group from the
tree, select the keyword group and click the Remove button underneath the tree.
To create new keywords
1.
Select [Setup -> Format Views]. The Format Views dialog box opens.
2.
Select the desired keyword group to be modified.
3.
Click the Keywords tab.
4.
Click the Add button to add a keyword. Then the Add Keyword dialog box opens. Specify a keyword in the
Keyword field and click the OK button to close the dialog box. To remove a keyword from the Keywords list,
select the keyword and click the Remove button.
REJ10J2169-0100 Rev.1.00
Jul 01, 2010
Page 122 of 523
High-performance Embedded Workshop V.4.08
4. Editor
Note:
On the Keyword field of the Add Keyword dialog box, specify a keyword which consists of only alphanumeric, an
underscore, and the # character.
4.10.3
Enabling/disabling syntax coloring
To enable/disable syntax coloring
1.
Select [Setup -> Options]. The Options dialog box opens.
2.
Select the Editor tab.
3.
Set the Enable syntax coloring checkbox as necessary and then click the OK button.
4.11
Templates
When developing software it is often necessary to enter the same text repeatedly, for instance, when typing a function
definition, for loop or a comment block for a function. The High-performance Embedded Workshop editor allows you to
specify a block of text (or template) which can be inserted into the currently active Editor window. Thus, once a template
has been defined, it can be automatically inserted without the need to re-enter it manually.
Figure below shows a list of templates, which is located on the Templates tab of the Workspace window.
Any new templates, which have been added to the High-performance Embedded Workshop, are displayed under the
Templates folder. The Toolchain Templates folder is for templates, which are read only and have been provided for use
in the High-performance Embedded Workshop system by the current toolchain.
Templates in this view can be dragged for insertion into an editor file. It is also possible to drag an area of text from the
editor into the templates folder for quick template creation.
Right-clicking on the Templates folder opens a pop-up menu containing the available options.
Pop-up Menu Option
Function
Add
Adds a new template.
Remove
Removes the current selection.
Edit
Edits the current selection.
REJ10J2169-0100 Rev.1.00
Jul 01, 2010
Page 123 of 523
High-performance Embedded Workshop V.4.08
4.11.1
4. Editor
Defining a template
To define a template
1.
Select one of the following operations to display the Define Templates dialog box:
•
Click the Define Template toolbar button (
•
Select [Edit -> Templates -> Define Templates], OR
•
Right-click on the Templates in the Templates tab of the workspace window and select Edit from the pop-up
menu, OR
•
Right-click in the editor window and select [Templates -> Define Templates] from the pop-up menu.
), OR
2.
Click the Add button. The Add Template dialog box is displayed, which asks you to enter your chosen
template name. This name must be unique, otherwise a duplicated template name message will be displayed and
the template will not be added.
3.
If you want to modify an existing template use the Template Name drop-down menu to select which template
you want to modify.
4.
Enter the desired text into the Template Text area. You can copy text from another Editor window and then
paste it into this dialog box using CTRL+V.
5.
Enter the following placeholder to insert special information when the template is inserted:
Menu Entry
Placeholder
Replaced With
File path + name
$(FULLFILE)
Filename (including full path)
File name
$(FILENAME)
Filename (excluding path, including extension)
File leaf
$(FILELEAF)
Filename (excluding path and extension)
Workspace name
$(WORKSPNAME)
Workspace name
Project name
$(PROJECTNAME)
Current project name
Line number
$(LINE)
First line number of template insertion
Time
$(TIME)
Current time
Date, text
$(DATE_TEXT)
Current date in text form
REJ10J2169-0100 Rev.1.00
Jul 01, 2010
Page 124 of 523
High-performance Embedded Workshop V.4.08
6.
4. Editor
Menu Entry
Placeholder
Replaced With
Date, day/month/year
$(DATE_DMY)
Current date in dd/mm/yy form
Date, month/day/year
$(DATE_MDY)
Current date in mm/dd/yy form
Date, year/month/day
$(DATE_YMD)
Current date in yy/mm/dd form
User name
$(USER)
Current Windows® user
Cursor position
$(CURSOR)
Insertion cursor - positions the cursor in this position
after template has been inserted
Enter ‘$(CURSOR)’ to specify where the insertion cursor is to be placed after the template has been inserted. If
this is not specified then the insertion cursor will be placed after the last character in the template, as in a normal
paste operation.
There are 10 shortcut keys reserved for templates. If you want to designate one of these select the key in the
drop-down list at the bottom of the edit template dialog box. These range from ALT+0 to ALT+9.
7.
User input
When defining a template it is possible to define a user input field. Using the following placeholder specifies this
$(USERINPUT<n:1-10>|”<some text>“). The 'n' is a number, which identifies the user input identifier.
These placeholders can be added manually but the User Input button on the Define Templates dialog box adds these
placeholders in an automated manner. When the template is inserted into a file a dialog is displayed which allows you to
enter some custom text for each of these fields. This text is then inserted instead of the placeholder. You can define ten
of these user input fields.
4.11.2
Deleting a template
To delete a template
1.
Select one of the following operations to display the Define Templates dialog box:
•
Click on the Define Template toolbar button (
•
Select [Edit -> Templates -> Define Templates], OR
•
Right-click on the Templates in the Templates tab of the workspace window and select Edit from the pop-up
menu, OR
•
Right-click in the editor window and select [Templates -> Define Templates] from the pop-up menu.
), OR
2.
Use the Template Name drop-down list to select the name of the template you wish to remove and then click
the Remove button.
3.
Clicking the OK button saves the changes and closes the dialog box.
REJ10J2169-0100 Rev.1.00
Jul 01, 2010
Page 125 of 523
High-performance Embedded Workshop V.4.08
4. Editor
To remove selected templates using the Templates tab of the Workspace window
1.
Select the templates that you want to remove in the Templates tab of the Workspace window. Multiple
templates can be selected by holding down the SHIFT or CTRL key.
2.
Right-click on the Templates within the Templates tab of the workspace window and select Remove from the
pop-up menu.
4.11.3
Inserting a template
To insert a template
1.
Select one of the following operations to display the Insert Template dialog box:
•
Click the Insert Template toolbar button (
•
Select [Edit -> Templates -> Insert Template], OR
•
Right-click in the editor window and select [Templates -> Insert Templates] from the pop-up menu.
2.
), OR
Use the Template Name drop-down list to select the name of the template to be inserted, and then click the OK
button. The dialog box is closed and the chosen template is added to the current Editor window.
Alternatively, you can press ALT along with the number of the template to be inserted (e.g. ALT+4 to insert template 4).
You can define these shortcuts on the Defile Templates dialog box. A drop-down list is available at the bottom of the
Defile Templates dialog box.
4.12
Brace matching
Complicated source code can often become unwieldy, especially when blocks of C /C++ code are deeply nested within
each other, or when complex logic statements are expressed within a large ‘if’ clause. To help in such situations, the
High-performance Embedded Workshop editor provides a Brace Matching feature, which highlights text between
braces of type { }, ( ) and [ ].
To find a matching brace
1.
Either highlight the open brace to match from or place the cursor before it.
2.
Select one of the following operations:
•
Click the Match Braces toolbar button (
•
Press CTRL+SHIFT+M, OR
•
Select [Edit -> Match Braces], OR
•
Select Match Braces from the pop-up menu.
REJ10J2169-0100 Rev.1.00
Jul 01, 2010
), OR
Page 126 of 523
High-performance Embedded Workshop V.4.08
4. Editor
To check the structure of an entire file, place the cursor at its start and then repeatedly invoke the match brace operation.
The editor will successively highlight each pair of braces in turn until there are no more left to match.
4.13
Setting the read-only attribute for a file
While using the High-performance Embedded Workshop, you can set a file to be read-only. When you attempt to save a
read-only file, a confirmation dialog box appears asking if you wish to save the file as another name.
To set a file to be read-only
1.
Select one of the following operations:
•
Right-click on a file in the Projects tab of the workspace window to open a pop-up menu. You can even select
multiple files, OR
•
Right-click within the editor window to open a pop-up menu.
2.
Selecting Properties opens the Properties dialog box.
3.
Select the Read-only checkbox. If you have selected two or more files including both read-only and writable
files, the checkbox is gray (intermediate state). By default, this checkbox is not selected.
4.
The title bar of the editor window shows “Read-Only”.
When a file is open within the editor window and if you switch on/off the read-only attribute of the file via the
Windows® Explorer, it does not match the attribute shown on the title bar of the editor window (because the title bar is
not updated). The attribute shown on the title bar is not updated until you start modifying the contents or re-open the file.
4.14
Preventing modification of files while debugging
Use this option if you wish to prevent modification of files while debugging with High-performance Embedded
Workshop and a debugger connected. This prevents modification of all files that are open in the High-performance
Embedded Workshop editor.
To prevent modification of files while debugging
1.
Select [Setup -> Options] to open the Options dialog box.
2.
Select the Editor tab.
REJ10J2169-0100 Rev.1.00
Jul 01, 2010
Page 127 of 523
High-performance Embedded Workshop V.4.08
4. Editor
3.
Selecting the Do not allow file editing when target is connected checkbox prevents modification of files while
the High-performance Embedded Workshop is connected to a debugger. In other words, if the Highperformance Embedded Workshop is not connected to a debugger, files can be modified. By default, this
checkbox is not selected.
4.
Click OK.
4.15
Managing the editor columns
The editor in High-performance Embedded Workshop has the ability to manage columns (apart from the main editor
column). These can be added and used by any component in the High-performance Embedded Workshop system.
Examples of this functionality might include a hardware breakpoint column added by the target, or possibly an address
information column added by the debugger. The global column states feature is also accessible from the main edit menu.
To switch off a column in all source files
1.
Select one of the following operations to display the Global Editor Column States dialog box:
•
Select [Edit -> Define Column Format], OR
•
Right-click in the editor window and select Define Column Format from the pop-up menu.
2.
If the column’s checkbox is checked then the column is enabled; if the column’s checkbox is gray then this
means that the column is enabled in some files, and disabled in others.
3.
Click the OK button for the new column settings to take effect.
To switch off a column in one source file
1.
Open the editor window of the file which you wish to remove a column from.
2.
Select one of the following operations:
•
Right-clicking the column header displays a pop-up menu. A tick mark right next to an entry indicates that this
column is displayed. Clicking an entry will switch showing/hiding the column, OR
REJ10J2169-0100 Rev.1.00
Jul 01, 2010
Page 128 of 523
High-performance Embedded Workshop V.4.08
•
4. Editor
Right-click in the editor window and select Columns. The cascaded menu option appears. Each column is
displayed in this pop-up menu. If the column is enabled it will have a tick next to its name. Clicking on the entry
will toggle whether the column is displayed or not.
You can adjust the column width by dragging the mouse on a column header.
4.16
Showing/hiding the column header
The editor window has a column header. You can select to show or hide the column header.
To switch showing/hiding the column header
1.
Right-click within a field in the editor window showing source or disassembly codes.
2.
A pop-up menu opens. Select Turn Header On/Off.
4.17
Opening a file within the editor
The High-performance Embedded Workshop allows you to open a file within the editor window.
To open a file shown in the editor window
1.
Right-click on the file name in the Source field in the editor window.
2.
Select Open '<file name>' from the pop-up menu.
4.18
Tooltip watch
Use this function to know the value of a variable defined in the source program. Open the editor window or disassembly
window (in source mode) to view the source program and rest the mouse cursor over the variable name that you want to
examine. A tooltip (pop-up window) will appear showing the watch information.
REJ10J2169-0100 Rev.1.00
Jul 01, 2010
Page 129 of 523
High-performance Embedded Workshop V.4.08
4. Editor
To use Tooltip watch
1.
Select [Setup -> Options]. The Options dialog box opens.
2.
Select the Editor tab.
3.
Check the Enable tooltip watch check box.
4.
Click OK.
To view a tooltip watch on the editor window or disassembly window (in source mode)
1.
Open the editor window or disassembly window (in source mode) showing the variable that you want to
examine.
2.
Rest the mouse cursor over the variable name that you want to examine. A tooltip will appear near the variable
containing basic watch information for that variable.
4.19
Evaluate an expression
Launches the Evaluate dialog box allowing the user to enter a numeric expression, e.g. "205*2", and display the result in
all currently supported radices.
To evaluate an expressions
1.
Select [Edit -> Evaluate]. The Evaluate dialog box opens.
2.
Enter the expression that you wish to evaluate and click the Evaluate button.
REJ10J2169-0100 Rev.1.00
Jul 01, 2010
Page 130 of 523
High-performance Embedded Workshop V.4.08
4. Editor
Provides a calculator function, evaluating simple and complex expressions, with parentheses and symbols. All operators
have the same precedence but parentheses may be used to change the order of evaluation. The operators have the same
meaning as in C/C++. Expressions can also be used in any command where a number is required. The result is displayed
in all supported radix types.
Valid operators:
Addition (+)
Subtraction (-)
Multiplication (*)
Division (/)
Logical AND (&&) *
Logical OR (||) *
Logical NOT (!) *
Equal to (==)
Bitwise AND (&)
Bitwise OR (|)
Bitwise NOT (~)
Unequal to (!=)
Left arithmetic shift (<<)
Right arithmetic shift (>>)
Less than (<)
Greater than (>)
Modulo (%) *
Bitwise exclusive OR (^)
Less than or equal to (<=)
Greater than or equal to (>=)
Note:
*. Support for this function depends on the debugger.
Register names:
It can be useful to be able to use the value contained in a CPU register when you are entering a value. You can
do this by specifying the register name prefixed by the ‘#’ or ‘%’ character, e.g.: ‘#PC’ or ‘%PC’.
The supported prefix depends on the debugger.
Character Constants:
Characters enclosed in single quote marks (') may be use as character constants. For example, 'A', etc. These
character constants are converted to ASCII code and used as 1-byte immediate values.
Character String Literals:
Character strings enclosed in double quote marks (") may be use as character string literals. Examples are
"abc", etc.
Note:
Support for this function depends on the debugger.
REJ10J2169-0100 Rev.1.00
Jul 01, 2010
Page 131 of 523
High-performance Embedded Workshop V.4.08
5. Tools Administration
5. Tools Administration
You can control the components that are used by the High-performance Embedded Workshop via the Tools
Administration dialog box, which is invoked by selecting [Tools -> Administration]. The Tools Administration
dialog box is only accessible when no workspace is open.
There are five standard types of component:
Toolchain
System Tool
Utility Phase
Debugger Component
Extension Component
A Toolchain is a set of build phases (e.g. compiler, assembler, linker and librarian).
These components provide the build capability.
A System Tool is an application (.EXE) that can be launched from the Tools menu.
These are often provided as extra applications, which support the toolchain (e.g. an
interactive graphical librarian, etc.).
A Utility Phase is a ‘ready made’ build phase, which supports some specific build
functionality (e.g. analyze complexity of source code, count lines of source code, etc.).
These components provide added functionality to the build that is not toolchain-specific.
A Debugger Component is a component that supports some specific debugger
functionality (e.g. CPU DLL, Target platform, Object reader, etc.).
An Extension Component is a component that provides key functionality in a certain area
of the High-performance Embedded Workshop system. These components cannot be
unregistered when installed (e.g. The High-performance Embedded Workshop builder,
debugger and flash support).
REJ10J2169-0100 Rev.1.00
Jul 01, 2010
Page 132 of 523
High-performance Embedded Workshop V.4.08
5.1
5. Tools Administration
Tool locations
The High-performance Embedded Workshop maintains the locations of High-performance Embedded Workshop
compatible components automatically as each new tool is installed. After installation, the High-performance Embedded
Workshop stores information about the component (including its location). This is referred to as Registration. Although
initial registration is automatic, during the course of development or if you want to manage the tools being used in your
projects more effectively, you may need to register components yourself.
5.2
High-performance Embedded Workshop registration files
When a High-performance Embedded Workshop compatible component (i.e. toolchain, system tool or utility phase) is
installed, part of its installation will include a file with the extension .HRF. This file describes the component to the
High-performance Embedded Workshop (see the figure below).
The process of registration refers to loading a component’s .HRF file into the Tools Administration dialog box (see the
figure below).
In order to use a component with High-performance Embedded Workshop it must first be registered (see section 5.3,
Registering a component, for further information). The Tools Administration dialog box shows all currently registered
components. To access it, ensure no workspaces are open and then select [Tools -> Administration]. If you attempt to
access the Tools Administration dialog box when a workspace is open, the Tools Administration dialog box is opened
but cannot be modified. When High-performance Embedded Workshop is installed, any new tools are automatically
REJ10J2169-0100 Rev.1.00
Jul 01, 2010
Page 133 of 523
High-performance Embedded Workshop V.4.08
5. Tools Administration
registered. Day to day usage of the High-performance Embedded Workshop though, may mean you need to know more
about the tools registration process.
High-performance Embedded Workshop stores tool information in a tool database file, which is stored in the root of the
tool installation directory. By default this is set to the High-performance Embedded Workshop application directory,
however if you are working in a network environment this directory may be set to another location. It is possible to
change the tool directory location and this causes a re-scan of the tools that are registered in High-performance
Embedded Workshop.
To change the tools directory location
1.
Select [Tools -> Administration]. The Tools Administration dialog box opens.
2.
Click the Modify button, which is next to the Current HEW tools location field.
3.
Browse to the root directory of the new tool location and click the OK button.
4.
This will switch the directory and change the tool location to the new directory. It will be necessary to scan for
any new tools that may be in this location. This can be achieved by using the Search Disk or Register Tool
functionality.
5.3
Registering a component
The High-performance Embedded Workshop will automatically attempt to register any new components installed since
the last time it was invoked. However, in some circumstances you may need to register components yourself.
In some cases it is useful to search a drive for High-performance Embedded Workshop-compatible components. This is
especially useful if the High-performance Embedded Workshop installation was deleted or corrupted, as it can recreate
your tool information instantly.
To search for components and register them
1.
Click the Search Disk button on the Tools Administration dialog box. The Search Disk for Components
dialog box opens.
2.
Enter the directory in which you would like to search into the top field, or browse to it graphically by clicking
the Browse button.
3.
Check the Include Subfolders checkbox if you would like to search the directory specified and all directories
below it.
4.
Click the Start button to begin the search. During the search, the Start button will change to a Stop button.
Click the Stop button to halt the search at any time.
5.
The results of the search are shown in the Located Components list. Select a component and click the Register
button to register an individual component, or click the Register All button to register all located components.
6.
Click the Close button to exit the dialog box.
REJ10J2169-0100 Rev.1.00
Jul 01, 2010
Page 134 of 523
High-performance Embedded Workshop V.4.08
5. Tools Administration
To register a single component
1.
Click the Register button on the Tools Administration dialog box.
2.
Browse to the component’s .HRF file and click the OK button to register that component.
Note:
The High-performance Embedded Workshop registration file is located in the root directory of a component’s
installation.
5.4
Unregistering a component
The components that are registered with the High-performance Embedded Workshop affect the way it behaves. For
example, every compatible system tool that is registered will be added to the Tools menu when a new project is created.
Sometimes this may not be desirable. If this is not required, open the Tools Administration dialog box, select the
undesired component from the Registered Components list and click the Unregister button. A dialog box will be
invoked, which asks you to confirm this action. Click Yes to unregister the component.
Note:
Unregistering a component does not remove its installation from the hard disk. It simply removes the information that the
High-performance Embedded Workshop was storing about that component (i.e. it ‘disconnects’ it from the Highperformance Embedded Workshop). The action can be easily reversed at any time by registering the tool manually (see
section 5.3, Registering a component).
REJ10J2169-0100 Rev.1.00
Jul 01, 2010
Page 135 of 523
High-performance Embedded Workshop V.4.08
5.5
5. Tools Administration
Viewing and editing component properties
To view information regarding a component, select it from the Registered Components list on the Tools
Administration dialog box and click the Properties button. The Properties dialog box opens.
The General tab displays the name, version and location of the selected component.
Select the Information tab to view any information about the component. This may include copyright information,
enhancements and so on.
If there is an issue with the component and it is working incorrectly additional information is displayed here.
Select the Environment tab, if it exists, to view and edit a component’s environment settings. This tab is most
commonly used to modify the environment of a toolchain.
REJ10J2169-0100 Rev.1.00
Jul 01, 2010
Page 136 of 523
High-performance Embedded Workshop V.4.08
5. Tools Administration
To add a new environment variable
1.
Click the Add button. The Environment Variable dialog opens.
2.
Enter the variable name into the Variable field.
3.
Enter the variable’s value into the Value field
4.
Click the OK button to add the new variable to the Environment tab.
To modify an environment variable
1.
Select the variable that you want to modify from the Environment tab.
2.
Click the Modify button. The Environment Variable dialog box opens.
3.
Make the required changes to the Variable and Value fields.
4.
Click the OK button to modify the environment variable.
To remove an environment variable
1.
Select the variable that you want to remove from the Environment tab.
2.
Click the Remove button.
REJ10J2169-0100 Rev.1.00
Jul 01, 2010
Page 137 of 523
High-performance Embedded Workshop V.4.08
5. Tools Administration
Note:
Placeholder pop-up menus are included to ensure that the environment can be specified as flexibly as possible. For
further information about using placeholders, see Reference 5, Placeholders.
5.6
Technical support
The Tools Administration dialog box is capable of displaying information regarding ‘hidden’ system components.
These are part of the High-performance Embedded Workshop itself, and cannot be registered/unregistered manually. If
you check the Show all components checkbox on the Tools Administration dialog, extra component folders are
displayed (see the figure below).
When seeking technical support, you may be asked to give details about some or all of these components. To do so, open
the respective folder, select a component and click the Properties button. The Properties dialog box will be invoked.
The High-performance Embedded Workshop also has a feature that outputs tool information regarding the registered
components to a file. This allows you to retrieve information about the entire High-performance Embedded Workshop
system. This information can then be sent to your technical support contact if you are experiencing problems with the
High-performance Embedded Workshop.
To output tool information
1.
Select [Tools -> Administration]. The Tools Administration dialog box opens.
2.
Click the Tool information button. A Save tool information file dialog box is displayed.
3.
Choose the location of the output file and click the OK button.
4.
A file is created in the chosen location with the current registered tool setup of the High-performance Embedded
Workshop.
If any of the components have problems these can be seen in the tools administration dialog. If the icon has an additional
icon this explains the problem. There are two additional icons that can be displayed.
REJ10J2169-0100 Rev.1.00
Jul 01, 2010
Page 138 of 523
High-performance Embedded Workshop V.4.08
5. Tools Administration
If a component is found but cannot be used due to it being an old version or another dependent component is not
available then the icon in figure below is used to show this.
Component not found icon
If the component is not located where the registration file says it is then the icon in figure below is used to show this.
Incompatible component found icon
Note:
If the tool has one of these errors then it is possible to get more information by the following method:
To get tool error feedback
5.7
1.
Select [Tools -> Administration]. The Tools Administration dialog box opens.
2.
Select the tool in the list that has an issue.
3.
Click Properties.
4.
Select the information tab and scroll the edit field to the bottom.
5.
The reason for the problem will be displayed in this area.
Using On-Demand components
The High-performance Embedded Workshop version 3.0 onwards has the concept of on-demand components. These
components are not automatically loaded by the application or the debugger component. These components can be
loaded by the user or as part of the project generation process.
REJ10J2169-0100 Rev.1.00
Jul 01, 2010
Page 139 of 523
High-performance Embedded Workshop V.4.08
5. Tools Administration
To load or unload an on-demand component manually
1.
Click [Project -> Components]. The Component Gallery dialog box opens.
2.
Select the component you wish to load. Click the Load button. The components image should change to the
loaded state.
3.
If you wish to unload a component. Select the component. Click the Unload button. The components image
should change to the unloaded state.
4.
Click OK to verify the changes.
Note:
Each project in your workspace can have different components loaded and unloaded. If you have multiple projects you
can use the “Multiple projects” and “All projects” items to change a components load status over more than one project.
If you select a combination which means the component is loaded in one project and not anther then the intermediate
state icon is displayed.
5.8
Custom project types
The [Project -> Create Project Type] menu option in High-performance Embedded Workshop and allows you to create
a template for your project. This menu option takes the settings of the current project and then creates a project type for
you. The user can specify the name of the new type and the style of the Project Generation Wizard. Once created, these
project types appear in the Tools Administration dialog box and are initially hidden in the System Components part of
the Tools Administration tree.
To export one of the Custom Project Generators, select the Export button on the Tools Administration dialog box. The
export functionality packages the Custom Project Generator into a binary file, which includes an executable. This can be
given to another user who then runs the executable. This installs the Project Generator into the correct location on the
target user’s machine.
REJ10J2169-0100 Rev.1.00
Jul 01, 2010
Page 140 of 523
High-performance Embedded Workshop V.4.08
5. Tools Administration
Note:
A project template can be created by selecting [Project -> Create Project Type] based on the project in use. This
template includes the version information of the toolchain. When a project is created by using this template after the
toolchain version has been updated in your High-performance Embedded Workshop system, check that the toolchain
version of the created project matches the using environment. When the registered toolchain can be updated, the
toolchain version can be changed in the dialog box that is displayed by selecting [Tools -> Change Toolchain Version].
REJ10J2169-0100 Rev.1.00
Jul 01, 2010
Page 141 of 523
High-performance Embedded Workshop V.4.08
6. Customizing the Environment
6. Customizing the Environment
6.1
Customizing the toolbars
The High-performance Embedded Workshop provides standard toolbars as detailed in the Toolbars topic. In addition to
these, you may also construct your own toolbars.
To create a new toolbar
1.
Select [Setup -> Customize]. The Customize dialog box opens.
2.
Select the Toolbars tab.
3.
Click the New button. The New Toolbar dialog box opens.
4.
Enter the name of the new toolbar into the Toolbar Name field.
5.
Click the OK button to create the new toolbar.
Note:
When a new toolbar is created it will appear undocked (i.e. ‘floating’) and empty.
To add buttons to a toolbar
1.
Select [Setup -> Customize]. The Customize dialog box opens.
2.
Select the Commands tab.
3.
Browse the available buttons by selecting the button categories from the Categories list. Select a button from
the Buttons area to display information on its operation.
4.
Click and drag a button from the dialog box onto the toolbar.
REJ10J2169-0100 Rev.1.00
Jul 01, 2010
Page 142 of 523
High-performance Embedded Workshop V.4.08
6. Customizing the Environment
To remove buttons from a toolbar
1.
Select [Setup -> Customize]. The Customize dialog box opens.
2.
Select the Commands tab.
3.
Click and drag a button from the toolbar onto the Buttons area.
To modify the name of a user-defined toolbar
1.
Select [Setup -> Customize]. The Customize dialog box opens.
2.
Select the Toolbars tab.
3.
In the Toolbars list, select the user-defined toolbar and whose name you want to modify.
4.
Modify the name of the toolbar in the Toolbar Name field.
5.
Click the OK button to save the toolbar’s new name.
To remove a user-defined toolbar
1.
Select [Setup -> Customize]. The Customize dialog box opens.
2.
Select the Toolbars tab.
3.
Select the user-defined toolbar from the Toolbars list and the Reset button will change to a Delete button. Click
the Delete button.
To reset a standard toolbar back to its original state
1.
Select [Setup -> Customize]. The Customize dialog box opens.
2.
Select the Toolbars tab.
3.
Select the standard toolbar from the Toolbars list and then click the Reset button.
REJ10J2169-0100 Rev.1.00
Jul 01, 2010
Page 143 of 523
High-performance Embedded Workshop V.4.08
6. Customizing the Environment
To reset the toolbar position back to its original state
1.
Select [Setup -> Customize]. The Customize dialog box opens.
2.
Select the Toolbars tab.
3.
Click the Reset Positions button.
The Reset Positions button reverts all toolbars back to their original 'factory' default positions. Be careful as this will
reset any custom positions that you may have setup during your session.
To show or hide toolbar tooltips
1.
Select [Setup -> Customize]. The Customize dialog box opens.
2.
Select the Toolbars tab.
3.
Set the Show Tooltips checkbox as desired.
6.2
Customizing the Tools menu
The Tools menu can be customized to include your own menu options.
To add a new menu option
1.
Select [Setup -> Customize]. The Customize dialog box.
2.
Select the Menu tab. The first thing you need to decide is whether you are adding a global application-wide tool
(which will be available to all of your workspaces), or whether you wish to add a workspace-wide tool (which is
only valid for the current workspace). Once you have chosen, choose the relevant section of the dialog box.
REJ10J2169-0100 Rev.1.00
Jul 01, 2010
Page 144 of 523
High-performance Embedded Workshop V.4.08
6. Customizing the Environment
3.
Click the Add button. The Add Tool dialog box opens.
4.
Enter the name of the tool into the Name field.
5.
Enter the command, excluding arguments, into the Command field.
6.
Enter any arguments that you would like to pass to the command into the Arguments field.
7.
Enter the initial directory, in which you would like the tool to run, into the Initial directory field.
8.
Click the OK button to add the menu option to the Tools menu.
New menu options are added to the bottom of the list (i.e. bottom of the Tools menu).
To modify a menu option
1.
Select [Setup -> Customize]. The Customize dialog box opens.
2.
Select the Menu tab.
3.
Select the menu option that you would like to modify and then click the Modify button.
4.
Make the desired changes on the Modify Tool dialog box and then click the OK button.
REJ10J2169-0100 Rev.1.00
Jul 01, 2010
Page 145 of 523
High-performance Embedded Workshop V.4.08
6. Customizing the Environment
To remove a menu option
1.
Select [Setup -> Customize]. The Customize dialog box opens.
2.
Select the Menu tab.
3.
Select the menu option that you would like to remove and then click the Remove button.
When you have one or more tools added the System Tools toolbar will be available in High-performance Embedded
Workshop. This will have one toolbar button for each tool. Clicking on a tools button will launch the tool exactly as if it
had been selected from the Tools menu. For tools that have EXE commands, the button’s image will be the same as the
Windows® icon for the EXE. If no such image is available the default image ( ) will be used.
6.3
Using custom placeholders
Throughout the High-performance Embedded Workshop the user can use a number of pre-defined placeholders for
directory definitions. For example, the user can use the “$(PROJDIR)” variable to signify the current High-performance
Embedded Workshop project directory. This makes it much easier to relocate projects and keep all of the paths correct.
The High-performance Embedded Workshop also has the ability to define custom placeholders. This means you can
enter your own custom placeholder definition and decide upon its directory value. Once defined this placeholder becomes
available throughout the rest of the High-performance Embedded Workshop system.
The placeholders can be defined on an application-wide level so the placeholders are available to all workspaces and
projects that use the High-performance Embedded Workshop. The other method of defining the placeholders is using the
workspace-wide custom placeholders. This means the placeholders can only be used in the current workspace. This list is
only available when you have a workspace open.
REJ10J2169-0100 Rev.1.00
Jul 01, 2010
Page 146 of 523
High-performance Embedded Workshop V.4.08
6. Customizing the Environment
To add a custom placeholder
1.
Select [Setup -> Customize]. The Tools Customize dialog box opens.
2.
Select the Placeholders tab.
3.
Choose whether you need to use an application-wide or workspace-wide placeholder.
4.
Click the Add button which is adjacent to the list you require. The Add New Placeholder dialog box opens.
5.
In the fields provided choose a suitable name for the placeholder and a description of what the placeholder
means.
6.
Choose a directory, which relates to this placeholder.
Note:
In High-performance Embedded Workshop V.2.01 or later version, the user-defined directory can be set as the custom
placeholder, which can be used for setting the toolchain option. When the directory path is specified, specify an absolute
path in ‘Directory’, as shown in figure below.
REJ10J2169-0100 Rev.1.00
Jul 01, 2010
Page 147 of 523
High-performance Embedded Workshop V.4.08
6.4
6. Customizing the Environment
Using the workspace and project log facilities
The High-performance Embedded Workshop has workspace and project logging facilities integrated into the application.
These facilities can be switched on via the log tab on the Customize dialog box. This option is especially useful when the
network database is in operation. This is because user names and changes are logged to this file.
When the Generate workspace log check box is clicked any workspace changes will be logged to a file with the same
name as the workspace with a “.log” extension. This file will be located in the same directory as the workspace file.
When the Generate log for projects check box is clicked any projects in the current workspace that have changes made
to them will be logged to a file with the same name as the project with a “.log” extension. This file will be located in the
same directory as the project file.
The log file is updated when the workspace is saved.
6.5
Configuring the help system
The High-performance Embedded Workshop provides context sensitive help within the Editor window. In other words,
if you select some text in the Editor window and then press F1, the High-performance Embedded Workshop will attempt
to locate help on that selected item. The help files that will be searched are listed in the Help tab of the Setup Customize
dialog box.
To add a new help file
1.
Select [Setup -> Customize]. The Setup Customize dialog box opens.
2.
Select the Help tab.
REJ10J2169-0100 Rev.1.00
Jul 01, 2010
Page 148 of 523
High-performance Embedded Workshop V.4.08
6. Customizing the Environment
3.
Click the Add button. The Add Help File dialog box opens.
4.
Enter a description of the help file into the Description field.
5.
Enter the full path of the help file into the File name field (or browse to it graphically by clicking the Browse
button).
6.
Click the OK button to add the new help file to the list.
To make a help file the default choice, select it from the Default Help File drop-down list or set it to None if you would
like to be prompted for a help file whenever F1 is pressed.
To remove a help file
1.
Select [Setup -> Customize]. The Setup Customize dialog box opens.
2.
Select the Help tab.
3.
Select the help file to be removed and then click Remove.
4.
Click the OK button to confirm the new help file settings.
REJ10J2169-0100 Rev.1.00
Jul 01, 2010
Page 149 of 523
High-performance Embedded Workshop V.4.08
6.6
6. Customizing the Environment
Keyboard shortcut customization
The High-performance Embedded Workshop allows the keyboard shortcuts to be customized to your own preferences.
This means that major operations can be configured to different keys especially useful if you are migrating from a
different tool.
To reach the keyboard shortcut customization dialog click [Setup -> Customize]. Then when Customize dialog box is
invoked click the Keyboard tab.
This dialog box allows instant selection of either the default High-performance Embedded Workshop keyboard shortcuts
or the PD debugger shortcuts. To change the entire keyboard layout select an item in the Default keyboard layout dropdown list. By default it uses the High-performance Embedded Workshop settings.
A number of operations are possible on this dialog box:
To add a new keyboard shortcut
1.
Select the main menu category of the command you wish to modify. It is only possible to modify the
commands that have a menu. Only some cases are special that allow modification, these are named global.
2.
Select the command you wish to modify or add a new keyboard shortcut for in the Commands list. The current
shortcut is displayed in the Current keyboard shortcut field.
3.
Enter the new shortcut in the New keyboard shortcut field. Various combinations of buttons can be used here.
For example "CTRL+J" or "CTRL+SHIFT+O", etc. If the chosen shortcut is already in use it is displayed
below the New keyboard shortcut field.
REJ10J2169-0100 Rev.1.00
Jul 01, 2010
Page 150 of 523
High-performance Embedded Workshop V.4.08
6. Customizing the Environment
4.
If you are happy with your selection click the Assign button.
5.
Changes are not saved until the OK button is clicked on the Customize dialog box.
To remove a keyboard shortcut
1.
Select the main menu category of the command you wish to modify. It is only possible to modify the
commands that have a menu. Only some cases are special that allow modification, these are named global.
2.
Select the command you wish to modify or add a new keyboard shortcut for in the Commands list. The current
shortcut is displayed in the Current keyboard shortcut field.
3.
Click the Remove button.
4.
Changes are not saved until the OK button is clicked on the Customize dialog box.
To reset all the keyboard shortcuts
1.
Click the Reset button. All shortcuts revert to the default settings for the currently selected keyboard layout.
2.
Changes are not saved until the OK button is clicked on the Customize dialog box.
The keyboard shortcuts dialog box allows you to import and export keyboard settings to a defined file. This allows you
to easily transfer settings from one machine to another.
To import keyboard shortcuts
1.
Select the keyboard layout you wish to replace with your imported settings in the Default keyboard layout
drop-down list.
2.
Click the Import button. A standard file dialog box opens.
3.
Choose the filename to load the keyboard layout from.
4.
Click OK.
To export keyboard shortcuts
1.
Click the Export button. A standard file dialog is displayed.
2.
Choose the filename to save the settings of the currently selected keyboard layout to.
3.
Click OK.
REJ10J2169-0100 Rev.1.00
Jul 01, 2010
Page 151 of 523
High-performance Embedded Workshop V.4.08
6.7
Scope of a control in the setup
6.7.1
Scope of a control in the Customize dialog box
6. Customizing the Environment
The scope of each control in the Customize dialog box, which is launched via [Setup -> Customize], differs. This can be
confusing so these have been listed below:
Tab
Control
Scope
Toolbar
All
Each workspace
Command
All
The whole system
Menu
Application wide tools
The whole system
Workspace wide tools
Each workspace
Application wide custom placeholder
The whole system
Workspace wide placeholder
Each workspace
Debugger tool
Each project
Debugger location
Default: whole system and each project basis
Command line options
Each project
Session file
Each project
Download module
Each project
Log
All
Each workspace
Help
All
Each workspace
Keyboard
All
The whole system
Placeholders
Debugger
6.7.2
Scope of a control in the Options dialog box
Scope of each control of each tab of the Options dialog box, which is launched via [Setup -> Options], affects the whole
system.
6.8
Specifying workspace options
The High-performance Embedded Workshop allows you to control several aspects of a workspace via the Options dialog
box. To invoke it select [Setup -> Options], and select the Workspace tab.
6.8.1
Opening the last workspace at start-up
When you exit the High-performance Embedded Workshop, the last workspace you had open is stored. On subsequently
launching the High-performance Embedded Workshop, you may want the last workspace to be opened automatically.
REJ10J2169-0100 Rev.1.00
Jul 01, 2010
Page 152 of 523
High-performance Embedded Workshop V.4.08
6. Customizing the Environment
To open the last workspace at start-up
1.
Select [Setup -> Options]. The Options dialog box opens.
2.
Select the Workspace tab.
3.
Select the Open last workspace at start-up checkbox if you would like the High-performance Embedded
Workshop to automatically open the last workspace when it is launched.
4.
Click the OK button.
6.8.2
Restoring files on opening a workspace
When you close a workspace, the High-performance Embedded Workshop stores the names of the files that were open at
that time. When you open a workspace, the High-performance Embedded Workshop can restore (i.e. open) the same files
so that you can continue your session in exactly the same state as when you left it. If you would like the files associated
with a workspace to be opened when the workspace is opened, then set this checkbox.
To restore files on opening a workspace
1.
Select [Setup -> Options]. The Options dialog box opens.
2.
Select the Workspace tab.
3.
Select the Restore files on opening workspace checkbox if you would like the files associated with a
workspace to be opened when the workspace is opened.
4.
Click the OK button.
6.8.3
Displaying workspace information on opening a workspace
When many workspaces are being used, it is sometimes difficult to remember exactly what is contained within each
workspace. The High-performance Embedded Workshop allows you to enter a textual description of each workspace.
This description can be displayed whenever a workspace is opened.
To enter a workspace description
1.
Select the workspace icon from the Projects tab of the workspace window.
2.
Right-click to invoke the pop-up menu and then select Properties. The Workspace Properties dialog box
opens.
3.
Enter the description into the Information field.
REJ10J2169-0100 Rev.1.00
Jul 01, 2010
Page 153 of 523
High-performance Embedded Workshop V.4.08
6. Customizing the Environment
4.
Select the Show workspace information on workspace open checkbox if you want a Workspace Properties
dialog box to be launched on opening a workspace. This checkbox has the same role as the Display workspace
information dialog on opening workspace checkbox on the Workspace tab of the Options dialog box.
5.
Click the OK button.
6.8.4
Saving the workspace before executing any tools
It is possible to force the High-performance Embedded Workshop into saving the current workspace before executing
any build phases (i.e. build, build all or build file operations) or version control commands.
To save the workspace before executing any tools
1.
Select [Setup -> Options]. The Options dialog box opens.
2.
Select the Workspace tab.
3.
Select the Save workspace before executing any tools checkbox.
4.
Click the OK button.
6.8.5
Prompting before saving a workspace
If you are using the Save workspace before executing any phases function, you may want the High-performance
Embedded Workshop to prompt you before saving the workspace. For further information about saving a workspace
before executing phases, see section 6.8.4, Save workspace before executing any phases.
To display a prompt before saving the workspace
1.
Select [Setup -> Options]. The Options dialog box opens.
2.
Select the Workspace tab.
3.
Select the Prompt before saving workspace checkbox.
4.
Click the OK button.
REJ10J2169-0100 Rev.1.00
Jul 01, 2010
Page 154 of 523
High-performance Embedded Workshop V.4.08
6.8.6
6. Customizing the Environment
Prompting before saving a session
Checking this option will force the High-performance Embedded Workshop into displaying a prompt before the session
is saved to disk.
To display a prompt before saving the session
1.
Select [Setup -> Options]. The Options dialog box opens.
2.
Select the Workspace tab.
3.
Select the Prompt before saving session checkbox.
4.
Click the OK button.
6.8.7
Enabling auto-backup facilities
The High-performance Embedded Workshop supports the facility to backup the workspace, project and session files at
regular intervals. This means that if your application or development system should fail you will not lose so much work.
Any changes you have made will be saved to temporary files.
When re-opening the workspace you will be prompted and asked if you wish to auto-recover the files that were not saved
during your last session.
To enable auto-file backup facilities
1.
Select [Setup -> Options]. The Options dialog box opens.
2.
Select the Workspace tab.
3.
Select the Save Auto-Recovery info checkbox as necessary.
4.
Select the number of minutes you wish the auto-backup facility to be launched.
5.
Click the OK button.
Restoring your files
If you open your workspace and the following dialog is displayed it means that the last time the workspace was used
problems were encountered.
REJ10J2169-0100 Rev.1.00
Jul 01, 2010
Page 155 of 523
High-performance Embedded Workshop V.4.08
6. Customizing the Environment
To recover the files check the checkbox alongside the filenames you wish to recover and click OK. Clicking Cancel will
discard the auto-recovery files and load from the original files.
6.8.8
Setting the projects to load on workspace open
You can configure which projects are initially loaded on workspace open. This is an application wide setting which is
only relevant to workspaces that contain multiple projects.
To change the projects to load on workspace open
1.
Select [Setup -> Options]. The Options dialog box opens.
2.
Click the Workspace tab.
3.
To determine the action when a workspace is opened, change the Project load on workspace open drop list to
one of the following options:
•
Last used current project
Only the current project when you last closed the workspace will be loaded.
•
All projects
All projects belonging to the open workspace will be loaded.
•
Last loaded projects
Any project which was loaded when you last closed the workspace will be loaded.
REJ10J2169-0100 Rev.1.00
Jul 01, 2010
Page 156 of 523
High-performance Embedded Workshop V.4.08
4.
6. Customizing the Environment
Click the OK button.
6.8.9
Specifying a default directory for new workspaces
When a new workspace is created, the High-performance Embedded Workshop invokes the New Project Workspace
dialog box. One of the fields on this dialog is the directory in which the new workspace will be created. By default, this is
the Workspace directory. However, it is also possible to set this default directory to another location.
To change the default directory for new workspaces
1.
Select [Setup -> Options]. The Options dialog box opens.
2.
Select the Workspace tab.
3.
Enter the directory in which to create new workspaces into the Default directory for new workspaces field, or
browse to it graphically by clicking the Browse button.
4.
Click the OK button.
6.9
Using an external editor
The High-performance Embedded Workshop allows you to use an external editor. Once an external editor has been
specified, it will be launched when the following actions are performed:
•
Selecting a file in the Open File dialog box opened by selecting [File -> Open].
•
Selecting [File -> Recent Files].
•
Double-clicking on a file in the Projects tab of the workspace window.
•
Double-clicking on an entry in the Navigation tab of the workspace window.
•
Double-clicking on an error/warning in the Build tab of the output window.
•
Double-clicking on an entry in the Find in Files 1 tab of the output window.
•
Double-clicking on an entry in the Find in Files 2 tab of the output window.
•
Right-clicking on a file within the Projects tab of the workspace window and selecting the Open <file> in
external editor option from the pop-up menu.
•
Clicking the Edit Code button in the Breakpoints dialog box opened by selecting [Edit -> Source
Breakpoints].
•
Drag and drop into the High-performance Embedded Workshop window:
When a file is dragged from the Windows® Explorer and dropped into the High-performance Embedded
Workshop window (note that, however, a drag and drop of a file onto the current project and user folder into
the Projects tab of the workspace window only adds this file to the project and does not open the file.)
REJ10J2169-0100 Rev.1.00
Jul 01, 2010
Page 157 of 523
High-performance Embedded Workshop V.4.08
6. Customizing the Environment
To specify an external editor
1.
Select [Setup -> Options]. The Options dialog box opens.
2.
Select the Editor tab.
3.
Check the Use external editor checkbox. The External Editor dialog box opens.
4.
Enter the path of the executable (without any arguments) into the Command field.
5.
Enter the arguments required to open a file into the Arguments to open file field. Use the $(FULLFILE)
placeholder to represent the path of the file to be opened.
6.
Enter the arguments required to open a file at a specific line into Arguments to open file at line field. Use the
$(FULLFILE) placeholder to represent the path of the file to be opened and the $(LINE) placeholder to represent
the line number at which the cursor should be initially positioned.
7.
Clicking the Advanced>> button allows you to select the external or internal (High-performance Embedded
Workshop) editor for use when you attempt to open a file by any of the following operations.
•
File open menu
When a file is selected in the Open File dialog box.
By default, the internal editor is selected.
•
Workspace window double click
When a file in the Projects tab or an entry in the Navigation tab is double-clicked in the workspace window
By default, the external editor is selected.
REJ10J2169-0100 Rev.1.00
Jul 01, 2010
Page 158 of 523
High-performance Embedded Workshop V.4.08
•
6. Customizing the Environment
Output window double click
When an error or warning in the Build tab or an entry in the Find in Files 1 or Find in Files 2 tab is doubleclicked in the output window
By default, the external editor is selected.
•
Drag and drop file into HEW main window
When a file is dragged from the Windows® Explorer and dropped into the High-performance Embedded
Workshop window (note that, however, a drag and drop of a file onto the current project and user folder into
the Projects tab of the workspace window only adds this file to the project and does not open the file.)
By default, the internal editor is selected.
8.
Click the OK button.
When the Use external editor checkbox is selected, the following actions always select the external editor for use.
•
Clicking the Edit Code button in the Breakpoints dialog box opened by selecting [Edit -> Source Breakpoints].
•
Selecting [File -> Recent Files].
If you select a file in the Projects tab of the workspace window and right-click to display a pop-up menu, the Open <file
name> in external editor menu option is available under the Open <file name> menu option.
Note:
When using an external editor be aware of the following issues:
•
Each time you invoke the external editor, in whichever way, a separate instance of the editor will be launched.
•
You must save your own files before you perform a Build, Build All or Build File operation.
6.10
Customizing the font in your views
The High-performance Embedded Workshop contains many components which you may wish to make look differently.
It is possible to change the font and text coloring for the views.
To change the look of your windows
1.
Select [Setup -> Format Views]. The Format Views dialog box opens.
2.
Select the view you are interested in changing the appearance of. To change all views select the "All views"
category.
REJ10J2169-0100 Rev.1.00
Jul 01, 2010
Page 159 of 523
High-performance Embedded Workshop V.4.08
6. Customizing the Environment
3.
Expand the item in the tree to see all items you can change the look of.
4.
Select the item. Notice the tab changes on the right of this dialog box.
5.
Change the font or text color.
6.
Click OK to save the changes and the views will be automatically updated with the new coloring.
The Format Views dialog box allows you to customize the color and font of text shown in the windows.
Item
Category
Objects to be Customized
Source
Selected Text
A selected text shown in the editor window and disassembly window (in
source mode)
PC Line Highlight
The line at the PC (program counter) in the editor window and
disassembly window (in source mode) while the Enable line highlight
for PC position checkbox is selected in the Editor tab of the Options
dialog box
Other keyword groups based Comment or keywords* shown in the editor window and disassembly
on the syntax of respective file window (in source mode)
types
Note:
Control, Declaration, Operator, PreProcessor, Value, Directive
Difference
LHS Different Lines
Unmatched text lines shown in the left pane in the Difference window
LHS Moved Lines
Moved text lines shown in the left pane in the Difference window
RHS Different Lines
Unmatched text lines shown in the right pane in the Difference window
RHS Moved lines
Moved text lines shown in the right pane in the Difference window
Register
Modified
Text sections of changed values shown in the Register window
Memory
Accessed
Text sections of executed codes at coverage measurement shown in
the Memory window
Not Accessed
Text sections of codes not executed at coverage measurement shown
in the Memory window
Unknown
Text outside the coverage range shown in the Memory window
No Memory
Text outside the memory range shown in the Memory window
REJ10J2169-0100 Rev.1.00
Jul 01, 2010
Page 160 of 523
High-performance Embedded Workshop V.4.08
Item
Output
Disassembly
All
6.11
6. Customizing the Environment
Category
Objects to be Customized
Modified
Text sections of changed values shown in the Memory window
Build Error
Lines of error messages shown in the Build tab of the Output window
Build Warning
Lines of warning messages shown in the Build tab of the Output window
Information
Lines of information messages shown in the Build tab of the Output
window
PC Line Highlight
The line at the PC (program counter) in the editor window and
disassembly window (in mixed mode or disassembly mode) or
Disassembly window while the Enable line highlight for PC position
checkbox is selected in the Editor tab of the Options dialog box
Source Lines
Source codes shown in the editor window and disassembly window (in
mixed mode)
Text
Text shown in the windows
Using the virtual desktop
High-performance Embedded Workshop has implemented the concept of the virtual desktop. This allows window
configurations to be defined that can be switched with the click of a button. When a particular button is clicked the
windows are hidden or displayed depending on the current settings of that window configuration.
It is possible to have a maximum of 4 desktop configurations in use. When the session is saved the window positions for
each configuration are saved to the session file. You can then switch simply between each configuration to gain access to
the other windows. The toolbars and windows are dependent on the virtual desktop configuration. Source files are
independent of the virtual desktop system and will remain in view.
To rename your configuration to a more meaningful name
1.
Select [Window -> Virtual desktop -> Desktop Manager]. The Desktop manager dialog box opens.
2.
Select the window configuration you wish to change the name for.
3.
Click Rename.
4.
Enter the new meaningful name in the edit field and click OK.
5.
Click OK to keep the changes and revert to the High-performance Embedded Workshop main window.
To switch desktop configurations
There are a number of ways to switch desktop configuration. The first and easiest method is using the virtual desktop
buttons located on the status bar. These are shown below.
REJ10J2169-0100 Rev.1.00
Jul 01, 2010
Page 161 of 523
High-performance Embedded Workshop V.4.08
6. Customizing the Environment
In this example the selected desktop is number 1. This has been given the name "Build" by the user. Its description is
seen in the edit box to the right on the buttons. Clicking a different desktop selects that button and changes the
description control. Once clicked High-performance Embedded Workshop then loads the windows in the new
configurations style.
Another method of changing the desktop configuration is as follows:
1.
Select [Window -> Virtual Desktop].
2.
Select is cascaded menu.
3.
Then select the desktop configuration you wish to view on this menu. The selected option is ticked.
REJ10J2169-0100 Rev.1.00
Jul 01, 2010
Page 162 of 523
High-performance Embedded Workshop V.4.08
7. Version Control
7. Version Control
The High-performance Embedded Workshop provides facilities for connecting to version control system. Some of the
reasons why version control systems are used with a project are:
•
To maintain the integrity of a project.
•
To store each stage of a project.
•
To enable different users to co-develop a project by controlling revisions to its source files.
Figure below illustrates a typical project where a version control system is in use. This shows three users who all use the
same-shared network drive to exchange source code. The version control system provides access and updates to the
source files.
•
Files Supported for Version Control by the High-performance Embedded Workshop
Version control by the High-performance Embedded Workshop basically supports the following types of files.
File type
Extension Group
File Extension
Supported CPU Family
Workspace file
HEW Workspace
hws
Common
Project file
HEW Projects
hwp
Common
File for version control
Configuration file
hvc
Common
Source file
C source file
c
Common
REJ10J2169-0100 Rev.1.00
Jul 01, 2010
Page 163 of 523
High-performance Embedded Workshop V.4.08
File type
7. Version Control
Extension Group
File Extension
Supported CPU Family
C++ source file
cpp
Assembly source file
a30
•
•
•
•
•
•
•
•
•
•
•
ms
a74
asm
mar
src
Include file
SuperH family
H8SX, H8S, H8 family
RX family
M32R family
M16C family
R8C family
M32R family
740 family
SuperH family
H8SX, H8S, H8 family
RX family
C header file
h
Common
C++ header file
hpp
•
•
•
•
Assembly include file
inc
Common
SuperH family
H8SX, H8S, H8 family
RX family
M32R family
Other types of files can also be supported once they are added to the project.
•
Version Control System that can be Connected with the High-performance Embedded Workshop
High-performance Embedded Workshop does not provide the version control system itself. It must be installed in your
PC in advance. The High-performance Embedded Workshop can be connected to the version control system via the GUI
interface. First, select a version control system, which you wish to connect with the High-performance Embedded
Workshop. Either of the followings can be selected:
Type
Version Control System Name Description
Displayed on Screen
Version control by custom settings
Custom VCS
Version control by Microsoft® Visual Microsoft Visual SourceSafe
SourceSafe 5.0, 6.0 and 2005
REJ10J2169-0100 Rev.1.00
Jul 01, 2010
Any version control system in which commandline commands should be executed via the MSDOS command prompt (such as RCS, CVS, or
PVCS).
The commands in the version control system
must be defined as being associated with the
GUI interface of the High-performance
Embedded Workshop.
Microsoft® Visual SourceSafe 5.0, 6.0 and 2005.
Main features are already defined.
Page 164 of 523
High-performance Embedded Workshop V.4.08
7.1
7. Version Control
Selecting a Version Control System
The [Tools -> Version Control] sub-menu contains eight menu options but only the [Tools -> Version Control ->
Select] option is initially available. This is because a version control system is not yet active for the current workspace.
To select a version control system
1.
Select [Tools -> Version Control -> Select]. The Select Version Control System dialog box opens, which lists
all of the supported version control systems.
2.
Select the desired version control system from the Version control system list.
3.
Click on the OK button.
•
Once the "Custom VCS" is selected as a version control system, the [Tools -> Version Control -> Configure]
option will become available. See Chapter 8, Custom Version Control System.
•
Once "Microsoft Visual SourceSafe" is selected as a version control system, other options of the [Tools -> Version
Control -> Select] option will become available. See Chapter 9, Visual SourceSafe Version Control System.
To deselect a version control system
1.
Select [Tools -> Version Control -> Select]. The Select Version Control System dialog box opens.
2.
Select "<None>" from the Version control systems list.
3.
Click on the OK button.
REJ10J2169-0100 Rev.1.00
Jul 01, 2010
Page 165 of 523
High-performance Embedded Workshop V.4.08
7.2
7. Version Control
Importing and exporting a set-up
Each workspace can have a different version control setup. The High-performance Embedded Workshop allows you to
store the version control settings independently so that you can import them into other workspaces. This greatly reduces
the amount of time it takes to configure the same version control settings across several workspaces.
To export a version control setup
1.
Select [Tools -> Version Control -> Configure]. The Version Control Setup dialog box opens.
2.
Click the Export button. An Export current Version Control configuration dialog box opens.
3.
Browse to the directory in which you would like to save the configuration.
4.
Enter the name of the file and then click the Save button.
To import a version control setup
1.
Select [Tools -> Version Control -> Configure] menu option. The Version Control Setup dialog box opens.
2.
Click the Import button. An Import a Version Control configuration dialog box opens.
3.
Browse to the *.HVC file that you would like to import.
4.
Select the file and then click the Import button.
REJ10J2169-0100 Rev.1.00
Jul 01, 2010
Page 166 of 523
High-performance Embedded Workshop V.4.08
8. Custom Version Control System
8. Custom Version Control System
If you have selected "Custom VCS" as the version control system in section 7.1, Select a Version Control System, the
following definitions are necessary for connection of the High-performance Embedded Workshop and Custom VCS.
•
Version control menu options and locations of the associated command executables (.EXE), command
parameters, how to control the execution result of version control commands, etc.
•
Locations of files for version control (directory mapping) and global variables
•
Execution control of version control commands, user settings, and other general options
After defining this information, you can execute a command of the custom version control system by selecting a Highperformance Embedded Workshop menu option or toolbar button and view the result in the High-performance Embedded
Workshop.
For installation and setting of the version control system, refer to the user’s manual for respective version control
systems.
For details on operations of the High-performance Embedded Workshop with the custom version control system, see
section 8.11, Usage example of the Custom Version Control System.
8.1
Defining Version Control menu options
The custom version control system allows you to invoke a version control command, either by selecting an option from
the [Tools -> Version Control] sub-menu, or by clicking a version control toolbar button. When either of these actions is
performed, the associated commands are executed and the output is displayed in the Version Control tab of the output
window.
To execute a command by a version-control menu option or toolbar button
1.
Select the items to which you want to apply the version control command, from the Projects tab of the
workspace window. This may include a workspace, projects, folders and files. Right-click to invoke a pop-up
menu. You can select a menu option you have defined from the Version Control submenu. A command
associated with this menu option will be executed on the files contained in the workspace, project, or folder, or
file itself selected in the workspace window.
2.
For example, if you select the workspace icon, all of the files in all of the projects will be passed to the version
control command (this will include any High-performance Embedded Workshop system files).
3.
Select the required menu option from the [Tools -> Version Control] sub-menu or click the desired version
control toolbar button.
The custom version control support allows you the highest degree of flexibility in specifying how a version control
system is to be used. To configure it, select [Tools -> Version Control -> Configure]. The Version Control Setup
dialog box opens.
REJ10J2169-0100 Rev.1.00
Jul 01, 2010
Page 167 of 523
High-performance Embedded Workshop V.4.08
8. Custom Version Control System
The Commands tab has two lists of menu options.
•
System-defined menu options (System menu options and toolbar buttons)
System menu options and toolbar buttons lists the menu options always shown as the [Tools -> Version Control] submenus. These menu options also have an associated toolbar button on the Version Control toolbar. This contains the six
menu options associated with the most frequently used version control commands.
•
User-defined menu options (User menu options)
User menu options lists user-defined menu options. Menu options defined in this list will be added to the end of [Tools > Version Control] sub-menus. If you wish to add menu options not included in the system menu options, they must be
defined in this list. User-defined menu options are not shown on the version control toolbar.
8.1.1
System-defined menu options
There are six version control toolbar buttons. They provide you with a shortcut to the most commonly used version
control commands. Initially, when you first create a workspace, these toolbar buttons are inactive because you have not
yet associated any version control commands to them.
The toolbar buttons are equivalent to the six menu options on the [Tools -> Version Control] sub-menu. In other words,
selecting [Tools -> Version Control -> Get from VCS] will have exactly the same effect as clicking the Get from VCS
toolbar button. As the toolbar buttons themselves are fixed, the only operation that you can perform upon them is to
define which commands should be executed when they are clicked.
In order to invoke commands from the toolbar or the system defined options of the [Tools -> Version Control] submenu, you must first define the associated commands that should be executed when they are activated. The names of the
options and their intended action are listed.
REJ10J2169-0100 Rev.1.00
Jul 01, 2010
Page 168 of 523
High-performance Embedded Workshop V.4.08
8. Custom Version Control System
Option
Description
Add to VCS
Add selected files to version control system.
Remove from VCS
Remove selected files from version control system.
Get from VCS
Get a read only local copy of the selected files from version control system.
Check out from VCS
Get a writable local copy of the selected files from version control system.
Check in to VCS
Put back, i.e. update, the selected files in version control system with the local copy.
Get VCS status
View the status of the selected files.
To define a command to be executed via the system menu or toolbar button
1.
Select [Tools -> Version Control -> Configure]. The Version Control Setup dialog box opens.
2.
Select a menu option in which you wish to define a command from System menu options and toolbar buttons
list and click the Modify button. The Define Commands dialog box opens.
3.
Click the Add button to define a command in the selected menu option. See section 8.2, Defining Version
Control commands, for further information.
4.
Close the Define Commands dialog box by clicking the OK button.
5.
Close the Version Control Setup dialog box by clicking the OK button.
8.1.2
User-defined menu options
You can create as many user-defined menu options as you like, name them how you want and define their order in the
menu.
If you have already created user-defined menu options, definitions of the commands can be modified or deleted. It is also
possible to change the order of menu options being displayed.
User-defined menu options do not appear on the version control toolbar.
To create a new user-defined version control menu option
1.
Select [Tools -> Version Control -> Configure]. The Version Control Setup dialog box opens.
2.
Click the Add button. The Add Menu Option dialog box opens.
3.
Enter the name of the menu option into the Option field.
4.
Click the Add button. The Add Command dialog box opens. For details, see section 8.2, Defining Version
Control commands.
5.
Click the OK button to close the Add Command dialog box.
6.
Click the OK button to close the Add Menu Option dialog box.
7.
Click the OK button to close the Version Control Setup dialog box.
REJ10J2169-0100 Rev.1.00
Jul 01, 2010
Page 169 of 523
High-performance Embedded Workshop V.4.08
8. Custom Version Control System
To modify a user-defined version control menu option
1.
Select [Tools -> Version Control -> Configure]. The Version Control Setup dialog box opens.
2.
Select the menu option to be modified from the User menu options list and then click the Modify button. The
Define Commands dialog box opens.
3.
Select the menu option to be modified from the Commands list and then click the Modify button. The Modify
Commands dialog box opens. For details, see section 8.2, Defining Version Control commands.
4.
Click the OK button to close the Modify Commands dialog box.
5.
Click the OK button to close the Define Commands dialog box.
6.
Click the OK button to close the Version Control Setup dialog box.
To remove a user-defined version control menu option
1.
Select [Tools -> Version Control -> Configure]. The Version Control Setup dialog box opens.
2.
Select the menu option to be removed from the [User menu options list and click the Remove button.
3.
Close the Version Control Setup dialog box by clicking the OK button.
To change the ordering of user-defined version control menu options
1.
Select [Tools -> Version Control -> Configure]. The Version Control Setup dialog box opens.
2.
Select the menu option to be moved and then click the Move up and Move down buttons as necessary.
3.
Close the Version Control Setup dialog box by clicking the OK button.
8.2
Defining Version Control commands
Version control commands are listed in the Define Commands dialog box. You can define as many commands as you
want to and specify the order in which they execute. Existing commands can be modified or removed.
To define a new version control command
1.
Click the Add button on the Define Commands dialog box. The Add Command dialog box opens.
REJ10J2169-0100 Rev.1.00
Jul 01, 2010
Page 170 of 523
High-performance Embedded Workshop V.4.08
8. Custom Version Control System
2.
Enter the full path of the command into the Version control executable field, or browse to it graphically by
clicking the Browse button.
3.
Enter the arguments for the command into the Arguments field.
4.
Enter into Initial directory the directory from which you would like to run the executable or browse to it
graphically by clicking Browse. In most cases this should be set to the $(FILEDIR) placeholder, which means
that the command should be executed from the same directory as the file.
5.
Set the Executable return code options as appropriate (see section 8.5, Executable return code).
6.
Click the OK button to define the new command.
To modify a version control command
1.
Select the command to be modified from the Commands list of the Define Commands dialog box.
2.
Click the Modify button. The Modify Command dialog box will be displayed.
3.
Modify the information as necessary and then click the OK button.
To remove a version control command
1.
Select the command to be removed from the Commands list of the Define Commands dialog box.
2.
Click the Remove button.
To change the ordering of version control menu options
1.
Select the menu option to be moved from the Commands list of the Define Commands dialog box.
2.
Click the Move up and Move down buttons as necessary.
REJ10J2169-0100 Rev.1.00
Jul 01, 2010
Page 171 of 523
High-performance Embedded Workshop V.4.08
8.3
8. Custom Version Control System
Specifying arguments
It is obvious that arguments must be specified correctly, otherwise the version control tool executed will not function as
intended. However, it is also important, when using custom version control support, to specify the arguments in a flexible
way, as a single version control command can be applied to more than one file. To facilitate this, the Arguments field has
a placeholder button (see Reference 5, Placeholders, for an in depth discussion of placeholders), which when clicked on,
invokes a pop-up menu of all available placeholders. An explanation of each version control placeholder and how their
values are derived can be found in the table below.
Pop-up menu
Placeholder
Value And How It Is Determined
User login name
$(USERNAME)
Current user login ('General' tab)
User login password
$(PASSWORD)
Current user password ('General' tab)
Version control directory
$(VCDIR)
‘Virtual’ version control mapping ("Projects" tab)
Comment
$(COMMENT)
Comment specified before command execution
File path + name
$(FULLFILE)
Full path and name of the file involved in the operation
Filename
$(FILENAME)
Filename (including extension) of the file involved in the operation
File leaf
$(FILELEAF)
Filename (excluding extension) of the file involved in the operation
File extension
$(EXTENSION)
Extension of the file involved in the operation
File directory
$(FILEDIR)
Directory of the file involved in the operation
Configuration directory
$(CONFIGDIR)
Current configuration directory
Project directory
$(PROJDIR)
Current project directory
Workspace directory
$(WORKSPDIR)
Current workspace directory
Temp Directory
$(TEMPDIR)
Temporary directory
Command directory
$(EXEDIR)
Version control executable directory
Windows directory
$(WINDIR)
Directory where Windows® is installed
Windows system directory
$(WINSYSDIR)
Directory where Windows® system files exist
Workspace name
$(WORKSPNAME)
Current workspace name
Project name
$(PROJECTNAME)
Current project name
Configuration name
$(CONFIGNAME)
Current configuration name
8.4
Specifying comments
If a version control command contains the placeholder ‘$(COMMENT)’, the High-performance Embedded Workshop
will request that you enter the comment when the command is executed (via the Please Enter Comment dialog box).
You may specify a comment for each file or, if you would like to specify the same comment for all files, check the Apply
comment to all files checkbox before clicking the OK button.
8.5
Executable return code
While each version control command executes, its output is redirected to the Version Control tab of the output window.
When the command’s execution is complete, its return code is obtained. When defining a command, you can determine
whether this return code can be used to indicate that the command failed and that the remaining commands should not be
executed (i.e. abort). The controls contained in the Executable return code group allow you to specify this behavior.
REJ10J2169-0100 Rev.1.00
Jul 01, 2010
Page 172 of 523
High-performance Embedded Workshop V.4.08
8. Custom Version Control System
If the return code of the commands can be used to indicate a failure then you should select the Command has failed if
the return code is option and set the drop-down list and edit box as required. If the Command has failed if the return
code is option is selected then the High-performance Embedded Workshop will check the return code of each command
to determine whether a failure occurred. If this is the case, no further commands will be executed and any other processes
which would follow the commands (e.g. build) will not be executed.
If the Return code of tool is not meaningful option is selected then the High-performance Embedded Workshop will
not check the return code of each command. Consequently, all commands will execute regardless.
8.6
Specifying file locations
When referring to a file’s location, be sure to use a placeholder, otherwise the command will only relate to a hardwired
file. For example, let’s imagine that a version control executable has been selected which uses a -GET command to
obtain a read-only copy of a file. The Arguments field could be specified as:
-GET ‘c:\vc\files\project\main.c’
However, when executed, this command can only ever -GET the file MAIN.C. To resolve this problem, Highperformance Embedded Workshop uses a system of placeholders and directory mappings. Directory mappings tell the
High-performance Embedded Workshop which ‘working’ directories (i.e. where source files are being worked on) map
to which ‘controlled’ directories (i.e. where the source files are stored in the version control system). Mappings between
these two directory systems can be specified via the Projects tab of the Version Control Setup dialog box.
Once the mappings have been defined, you can use the Version control directory placeholder, $(VCDIR), to represent
the directory in which the project file is stored.
To define a new directory mapping
1.
Select [Tools -> Version Control -> Configure]. The Version Control Setup dialog box opens.
2.
Select the Projects tab.
REJ10J2169-0100 Rev.1.00
Jul 01, 2010
Page 173 of 523
High-performance Embedded Workshop V.4.08
8. Custom Version Control System
3.
Click the Add button, which is next to the Version Control Directory Mappings list. The Version Control
Directory Mapping dialog box opens.
4.
Specify a High-performance Embedded Workshop workspace directory or project directory in the Source
directory field. Select one of the following operations:
•
Enter the directory name, OR
•
Click the placeholder button. Then select "Project directory" or "Workspace directory" from the menu, OR
•
Click the Browse button to open the Browse to Source Directory dialog box. Select the directory and click the
Select button.
5.
Enter the version control directory into the Version Control Directory field.
6.
Click the OK button.
To modify a directory mapping
1.
Select [Tools -> Version Control -> Configure]. The Version Control Setup dialog box opens. Select the
Projects tab.
2.
Select the mapping to be modified from the Version Control Directory Mappings list and then click the
Modify button. The Version Control Directory Mapping dialog box opens.
3.
Make the necessary changes to the two directories and then click the OK button to confirm the new settings.
To remove a directory mapping
1.
Select [Tools -> Version Control -> Configure]. The Version Control Setup dialog box opens. Select the
Projects tab.
2.
Select the mapping to be removed from the Version Control Directory Mappings list and then click the
Remove button.
REJ10J2169-0100 Rev.1.00
Jul 01, 2010
Page 174 of 523
High-performance Embedded Workshop V.4.08
8.7
8. Custom Version Control System
Specifying file locations example
Consider the scenario shown in the figure below. It shows three directories, which are mapped from a shared version
control drive (X:\) to a local drive where the development is being done (C:\).
Now let’s imagine that a version control executable has been selected which uses a -GET command to obtain a read-only
copy of a file. In order to get all of the files in a project we need to use the following command:
-GET ‘$(VCDIR)\$(FILENAME)’
When the High-performance Embedded Workshop executes the command for a given project file, it will replace
$(VCDIR) for the equivalent version control directory in the file mapping.
For example, suppose FILE1.C is located at c:\work\application\project1\FILE1.C. If the -GET command is applied to
FILE1.C then:
1.
‘x:\vc\sw\app\project1’ is substituted for ‘$(VCDIR)’, as this is the version control directory mapping for
‘c:\work\application\project1’.
2.
‘FILE1.C’ is substituted for ‘$(FILENAME)’.
REJ10J2169-0100 Rev.1.00
Jul 01, 2010
Page 175 of 523
High-performance Embedded Workshop V.4.08
8.8
8. Custom Version Control System
Specifying environment
Select the Projects tab of the Version Control Setup dialog box to view the current settings.
To add a new environment variable
1.
Click the Add button beside the Environment list (the Environment Variable dialog box will be invoked).
2.
Enter the variable name into the Variable field.
3.
Enter the variable’s value into the Value field.
4.
Click the OK button to add the new variable to the Environment list.
To modify an environment variable
1.
Select the variable that you want to modify from the Environment list.
2.
Click the Modify button beside the list.
3.
Make the required changes to the Variable and Value fields.
4.
Click the OK button to add the modified variable back to the list.
To remove an environment variable
8.9
1.
Select the variable that you want to remove from the Environment list.
2.
Click the Remove button beside the list.
Controlling execution of a Version Control System
The General tab of the Version Control Setup dialog box allows you to control the way in which the version control
system is executed. It also shows the full path to the current version control configuration file.
REJ10J2169-0100 Rev.1.00
Jul 01, 2010
Page 176 of 523
High-performance Embedded Workshop V.4.08
8. Custom Version Control System
The execution of a version control system can be modified via the following three checkboxes:
•
Prompt before executing command
If this checkbox is selected then, before any version control commands are executed, a dialog is displayed, which lists all
of the files involved in the operation. Files may be deselected by clearing the associated checkbox. Clicking the OK
button will apply the command to each of the selected files. Clicking the Cancel button will abort the operation.
•
Run in DOS window
By default, the output of the version control commands is redirected to the Version Control tab of the output window. If
you would rather run each command in a separate DOS window then set this checkbox. Select Close DOS window on
exit checkbox if you wish the DOS window to close after execution has been completed.
•
Use forward slash ‘/’ as version control directory delimiter
By default, when the High-performance Embedded Workshop substitutes the $(VCDIR) placeholder, it uses the
backward slash character ‘\’ to divide directories. However, if the version control system you are using uses a forward
slash character (e.g. Visual SourceSafe) to divide directories then select the Use forward slash ‘/’ as version control
directory delimiter checkbox.
8.10
Specifying a user name and password
Most version control tools will require you to pass a username and password on the command line in order to keep files
secure, and to keep a record of which files were changed by which users. The custom version control support provides
two placeholders: User login name, $(USERNAME), and User login password, $(PASSWORD). When the command
is executed, these placeholders will be replaced with the current settings in the General tab of the Version Control
Setup dialog box.
In order to give the $(USERNAME) and $(PASSWORD) fields a value you will first need to login. If you have not
logged in before a command is executed, which uses either of these placeholders, then you will be prompted to do so
before the command can be executed.
To login (i.e. specify a username and password)
1.
Select [Tools -> Version Control -> Configure]. The Version Control Setup dialog box opens.
2.
Select the General tab.
3.
Click the Log In button. The Log in dialog box opens.
REJ10J2169-0100 Rev.1.00
Jul 01, 2010
Page 177 of 523
High-performance Embedded Workshop V.4.08
8. Custom Version Control System
4.
Enter your username into the User name field.
5.
Enter your password into the Password field.
6.
Re-type your password again into the Confirm password by retyping it below field.
7.
Click the OK button to set the new username and password. If there is any inconsistency between the two
versions of the password that you entered, you will be requested to type your password again.
8.11
Usage example of the Custom Version Control System
The custom version control system includes any version control system in which command-line commands should be
executed via the MS-DOS command prompt. The usage examples in this section use the following version control
systems to be connected with the High-performance Embedded Workshop.
•
Connecting the High-performance Embedded Workshop with RCS
•
Connecting the High-performance Embedded Workshop with CVS
8.11.1
Connecting the High-performance Embedded Workshop with RCS
In this example, the High-performance Embedded Workshop is to be connected with RCS.
•
RCS environment
The following types of version control system can be used:
o
GNU RCS
o
GNU diff
This procedure assumes that the version control system is located at "C:\RCS".
REJ10J2169-0100 Rev.1.00
Jul 01, 2010
Page 178 of 523
High-performance Embedded Workshop V.4.08
•
8. Custom Version Control System
Workspace
Create a High-performance Embedded Workshop workspace in the following folder.
C:\WorkSpace\rcs_sample
Then create a folder for RCS.
C:\WorkSpace\rcs_sample\rcs_sample\RCS
The following pages describe the procedures to create a workspace, make settings for version control, check-in, compare,
check-out, and view logs.
Step 1: Create a workspace
Step 2: Selecting Custom Version Control System
Step 3: Making settings for Version Control
Step 4: Using the Version Control facility (Check-in)
Step 5: Using the Version Control facility (Compare)
Step 6: Using the Version Control facility (Check-out)
Step 7: Using the Version Control facility (View Logs)
8.11.1.1 Step 1: Create a workspace
1.
Select [File -> New Workspace] to open the New Project Workspace dialog box.
2.
Create a workspace with the following conditions.
•
Workspace Name: rcs_sample
•
Project Name: rcs_sample
•
Directory: C:\WorkSpace\rcs_sample
3.
Create a folder for RCS.
C:\WorkSpace\rcs_sample\rcs_sample\RCS
REJ10J2169-0100 Rev.1.00
Jul 01, 2010
Page 179 of 523
High-performance Embedded Workshop V.4.08
8. Custom Version Control System
8.11.1.2 Step 2: Selecting Custom Version Control System
1.
Select [Tools -> Version Control -> Select]. The Select Version Control System dialog box opens.
2.
Select Custom VCS.
3.
Click the OK button.
8.11.1.3 Step 3: Making settings for Version Control
Select [Tools -> Version Control -> Configure] to open the Version Control Setup dialog box.
•
Setting environment variables
1.
Select the Projects tab.
REJ10J2169-0100 Rev.1.00
Jul 01, 2010
Page 180 of 523
High-performance Embedded Workshop V.4.08
8. Custom Version Control System
2.
Click the Add button on Environment.
3.
The Environment dialog box appears.
4.
Enter "path" in Variable and "%path%;C:\RCS" in Value, respectively.
5.
Click the OK button.
6.
Click the Add button. Also enter the following environment variables in Environment.
LOGNAME=user
TZ=JST-9
•
Specifying actions
1.
Select the General tab.
2.
Deselect the Prompt before executing command checkbox. (Leave it selected, however, if you wish to see the
file name before executing commands.)
REJ10J2169-0100 Rev.1.00
Jul 01, 2010
Page 181 of 523
High-performance Embedded Workshop V.4.08
•
8. Custom Version Control System
3.
Select the Run in DOS Window checkbox. (This is because the RCS commands must be input via the MS-DOS
prompt.)
4.
Deselect the Close DOS Window on exit checkbox. (This is because errors must be viewed in the MS-DOS
prompt.)
Setting up commands
1.
Select the Commands tab.
2.
Click the Add button on User menu options.
3.
The Add Menu Option dialog box appears.
4.
Enter "Initialize" in Option and click the Add button.
5.
The Add Command dialog box appears.
6.
Enter "C:\RCS\CI.EXE" in Version control executable.
7.
Enter "-l $(FILENAME)" in Arguments.
8.
Enter "$(PROJDIR)" in Initial directory.
9.
Click the OK button.
10. Click the OK button in the Add Menu Option dialog box.
Tip:
It is recommended that you only register some commands frequently used for version control. Other commands should
be used via the MS-DOS command prompt.
REJ10J2169-0100 Rev.1.00
Jul 01, 2010
Page 182 of 523
High-performance Embedded Workshop V.4.08
8. Custom Version Control System
Also set up the following tree commands in the same way.
Command
Option Name
Characters to be Input
Check out
Version control executable
C:\RCS\CO.EXE
Argument
-l -f $(FILENAME)
Initial directory
$(PROJDIR)
Version control executable
C:\RCS\RCSDIFF.EXE
Argument
$(FILENAME)
Initial directory
$(PROJDIR)
Version control executable
C:\RCS\RLOG.EXE
Argument
$(FILENAME)
Initial directory
$(PROJDIR)
Diff
Log
Preparation for version control is now completed.
8.11.1.4 Step 4: Using the Version Control facility (Check-in)
1.
Enter a keyword at line 12 in the file "rcs_sample.c" so that you will be able to see the changes made in the file.
//$Id$
2.
Select the file "rcs_sample.c" in the Projects tab of the workspace window and then select [Tools -> Version
Control -> Check in].
3.
The MS-DOS command prompt window opens.
4.
Enter a comment for check-in after the prompt (">>") and press Enter.
5.
Enter one period '.' and press Enter.
rcs_sample.c,v <-- rcs_sample.c
enter description, terminated with single '.' or end of file:
NOTE: This is NOT the log message!
>> .
initial revision: 1.1
done
C:\RCS>
6.
Enter "exit" and press Enter. This closes the MS-DOS command prompt window.
7.
A High-performance Embedded Workshop confirmation dialog box appears. Click Yes. The keyword now
includes the file name, revision number, date, and user name.
REJ10J2169-0100 Rev.1.00
Jul 01, 2010
Page 183 of 523
High-performance Embedded Workshop V.4.08
8. Custom Version Control System
Tip:
If you do not wish to see the result of command execution in the MS-DOS command prompt window, select the Close
DOS Window on exit checkbox in the General tab of the Version Control Setup dialog box.
8.11.1.5 Step 5: Using the Version Control facility (Compare)
1.
To compare with the checked-in file, modify the file "rcs_sample.c" and save it.
2.
Select the file "rcs_sample.c" in the Projects tab of the workspace window and select [Tools -> Version
Control -> Diff].
3.
The MS-DOS command prompt window appears and shows the result of comparison.
4.
Enter "exit" and press the Enter key. This closes the MS-DOS command prompt window.
RCS file: rcs_sample.c,v
Working file: rcs_sample.c
head: 1.1
branch:
locks: strict
user: 1.1
access list:
symbolic names:
keyword substitution: kv
total revisions: 1;
selected revisions: 1
description:
---------------------------revision 1.1
locked by: user;
date: 2006/03/14 07:22:42; author: user; state: Exp;
Initial revision
=============================================================================
8.11.1.6 Step 6: Using the Version Control facility (Check-out)
Use the check-out command to undo the changes made in the file.
1.
Select the file "rcs_sample.c" in the Projects tab of the workspace window and select [Tools -> Version
Control -> Check out].
2.
The MS-DOS command prompt window appears and shows the result of check-out.
REJ10J2169-0100 Rev.1.00
Jul 01, 2010
Page 184 of 523
High-performance Embedded Workshop V.4.08
8. Custom Version Control System
3.
Enter "exit" and press the Enter key. This closes the MS-DOS command prompt window.
4.
A High-performance Embedded Workshop confirmation dialog box appears. Click Yes. The file has returned to
its original state.
8.11.1.7 Step 7: Using the Version Control facility (View Logs)
Use the log command to view the changes.
1.
Select the file "rcs_sample.c" in the Projects tab of the workspace window and select [Tools -> Version
Control -> Log].
2.
The MS-DOS command prompt window appears and shows the log information.
3.
Enter "exit" and press the Enter key. This closes the MS-DOS command prompt window.
8.11.2
Connecting the High-performance Embedded Workshop with CVS
In this example, the High-performance Embedded Workshop is to be connected with CVS.
•
CVS tool environment
The following type of version control system can be used:
o
CVS
This procedure assumes that the version control system is located at "C:\cvs-1-11-17".
•
Workspace
Create a High-performance Embedded Workshop workspace in the following folder.
C:\WorkSpace\sampleCVS
Then create a folder for CVS.
C:\src\sampleCVS
Note:
In this version control using the High-performance Embedded Workshop and CVS, only versions of source files can be
controlled. It cannot control versions of any other files (such as workspace or project files).
The following pages describe the procedures to create a workspace, make settings for version control, create a repository,
register a module, check-out, check the status, compare, register the result, and view logs.
REJ10J2169-0100 Rev.1.00
Jul 01, 2010
Page 185 of 523
High-performance Embedded Workshop V.4.08
8. Custom Version Control System
Step 1: Create a workspace
Step 2: Selecting Custom Version Control System
Step 3: Making settings for Version Control
Step 4: Using the Version Control facility (Create a Repository)
Step 5: Using the Version Control facility (Register a Module)
Step 6: Using the Version Control facility (Check-out)
Step 7: Using the Version Control facility (Modify the File)
Step 8: Using the Version Control facility (Check the Status)
Step 9: Using the Version Control facility (Compare)
Step 10: Using the Version Control facility (Register the Result)
Step 11: Using the Version Control facility (View Logs)
8.11.2.1 Step 1: Create a workspace
1.
Select [File -> New Workspace] to open the New Project Workspace dialog box.
2.
Create a workspace with the following conditions.
•
Workspace Name: sampleCVS
•
Project Name: sampleCVS
•
Directory: C:\WorkSpace\sampleCVS
3.
Exit the High-performance Embedded Workshop.
4.
Create a folder for CVS.
C:\src\sampleCVS
5.
Move the file you wish to control from "C:\WorkSpace\sampleCVS\sampleCVS" to "C:\src\sampleCVS".
6.
Start up the High-performance Embedded Workshop and open the created workspace "sampleCVS".
7.
Select [Project -> Remove Files] to open the Remove Project Files dialog box.
8.
Select the file you wish to control and click the Remove button.
9.
Click OK button.
10. Select [Project -> Add Files] to open the Add files to project 'sampleCVS' dialog box.
11. Select the file you wish to control and click the Add button.
REJ10J2169-0100 Rev.1.00
Jul 01, 2010
Page 186 of 523
High-performance Embedded Workshop V.4.08
8. Custom Version Control System
8.11.2.2 Step 2: Selecting Custom Version Control System
1.
Select [Tools -> Version Control -> Select].
2.
The Select Version Control System dialog box opens.
3.
Select Custom VCS.
4.
Click the OK button.
8.11.2.3 Step 3: Making settings for Version Control
Select [Tools -> Version Control -> Configure] to open the Version Control Setup dialog box.
•
Setting environment variables
1.
Select the Projects tab.
2.
Click the Add button on Environment.
3.
The Environment dialog box appears.
4.
Enter "CVSROOT" in Variable and "C:\cvs-1-11-17\DATABASE" in Value, respectively.
REJ10J2169-0100 Rev.1.00
Jul 01, 2010
Page 187 of 523
High-performance Embedded Workshop V.4.08
5.
•
8. Custom Version Control System
Click the OK button.
Setting up commands
1.
Select the Commands tab.
2.
Click the Add button on User menu options.
3.
The Add Menu Option dialog box appears.
4.
Enter "Initialize" in Option and click the Add button.
5.
The Add Command dialog box appears.
6.
Enter "C:\cvs-1-11-17\cvs.exe" in Version control executable.
7.
Enter "init" in Arguments.
8.
Enter "C:\src\sampleCVS" in Initial directory.
REJ10J2169-0100 Rev.1.00
Jul 01, 2010
Page 188 of 523
High-performance Embedded Workshop V.4.08
9.
8. Custom Version Control System
Click the OK button.
10. Click the OK button in the Add Menu Option dialog box.
Also set up the following six commands in the same way.
Command
Option Name
Characters to be Input
Register
Version control executable
C:\cvs-1-11-17\cvs.exe
Argument
import -m "New Source" sampleCVS Renesas rel-20060228
Initial directory
C:\src\sampleCVS
Version control executable
C:\cvs-1-11-17\cvs.exe
Argument
checkout sampleCVS
Initial directory
C:\src
Version control executable
C:\cvs-1-11-17\cvs.exe
Argument
status $(FILENAME)
Initial directory
C:\src\sampleCVS
Version control executable
C:\cvs-1-11-17\cvs.exe
Argument
diff $(FILENAME)
Initial directory
C:\src\sampleCVS
Version control executable
C:\cvs-1-11-17\cvs.exe
Argument
commit -m "modify" $(FILENAME)
Initial directory
C:\src\sampleCVS
Version control executable
C:\cvs-1-11-17\cvs.exe
Argument
log $(FILENAME)
Initial directory
C:\src\sampleCVS
Check out
Status
Diff
Commit
Log
Preparation for version control is now completed.
REJ10J2169-0100 Rev.1.00
Jul 01, 2010
Page 189 of 523
High-performance Embedded Workshop V.4.08
8. Custom Version Control System
8.11.2.4 Step 4: Using the Version Control facility (Create a Repository)
1.
Select [Tools -> Version Control -> Initialize].
2.
Select the file in the Initialize dialog box and click the OK button.
Executing C:\cvs-1-11-17\cvs.exe init
Command(s) completed successfully.
8.11.2.5 Step 5: Using the Version Control facility (Register a Module)
1.
Select [Tools -> Version Control -> Register].
2.
Select the file in the Register dialog box and click the OK button.
Executing C:\cvs-1-11-17\cvs.exe import -m "New Source" sampleCVS Renesas rel-20060228
N sampleCVS/dbsct.c
(Omit)
No conflicts created by this import
Command(s) completed successfully.
8.11.2.6 Step 6: Using the Version Control facility (Check-out)
1.
Select [Tools -> Version Control -> Checkout].
2.
Select the file in the Checkout dialog box and click the OK button.
3.
The Version Control tab of the output window shows the following message.
Executing C:\cvs-1-11-17\cvs.exe checkout sampleCVS
U sampleCVS/dbsct.c
(Omit)
cvs.exe checkout: Updating sampleCVS
Command(s) completed successfully.
8.11.2.7 Step 7: Using the Version Control facility (Modify the File)
Use the High-performance Embedded Workshop editor to modify the file (and save it). In this example, the file
"sampleCVS.c" is modified.
REJ10J2169-0100 Rev.1.00
Jul 01, 2010
Page 190 of 523
High-performance Embedded Workshop V.4.08
8. Custom Version Control System
8.11.2.8 Step 8: Using the Version Control facility (Check the Status)
1.
The status of the file "sampleCVS.c" should be checked.
2.
Select [Tools -> Version Control -> Status].
3.
Select the file in the Status dialog box and click the OK button.
4.
The Version Control tab of the output window shows the following message.
Executing C:\cvs-1-11-17\cvs.exe status sampleCVS.c
===================================================================
File: sampleCVS.c
Status: Locally Modified
Working revision: 1.1.1.1 Tue Feb 28 02:46:30 2006
Repository revision: 1.1.1.1 C:\cvs-1-11-17\DATABASE/sampleCVS/sampleCVS.c,v
Sticky Tag: (none)
Sticky Date: (none)
Sticky Options: (none)
Command(s) completed successfully.
The status of the file "sampleCVS.c" is shown as "Locally Modified".
8.11.2.9 Step 9: Using the Version Control facility (Compare)
1.
The changes made in the file "sampleCVS.c" should be checked.
2.
Select [Tools -> Version Control -> Diff].
3.
Select the file in the Diff dialog box and click the OK button.
4.
The Version Control tab of the output window shows the following message.
Executing C:\cvs-1-11-17\cvs.exe diff sampleCVS.c
Index: sampleCVS.c
===================================================================
RCS file: C:\cvs-1-11-17\DATABASE/sampleCVS/sampleCVS.c,v
retrieving revision 1.1.1.1
diff -r1.1.1.1 sampleCVS.c
28c28,31
< printf("### Data Input ###\n");
--> //loop
> while(1)
REJ10J2169-0100 Rev.1.00
Jul 01, 2010
Page 191 of 523
High-performance Embedded Workshop V.4.08
8. Custom Version Control System
>{
> printf("### Data Input ###\n"); //loop
49a53,54
> //loop
>}
Command(s) completed successfully.
You can see the changes made in the file "sampleCVS.c".
8.11.2.10
Step 10: Using the Version Control facility (Register the Result)
1.
Select [Tools -> Version Control -> Commit].
2.
Select the file in the Commit dialog box and click the OK button.
3.
The Version Control tab of the output window shows the following message.
Executing C:\cvs-1-11-17\cvs.exe commit -m "modify" sampleCVS.c
Checking in sampleCVS.c;
C:\cvs-1-11-17\DATABASE/sampleCVS/sampleCVS.c,v <-- sampleCVS.c
new revision: 1.2; previous revision: 1.1
done
Command(s) completed successfully.
8.11.2.11
Step 11: Using the Version Control facility (View Logs)
1.
Select [Tools -> Version Control -> Log].
2.
Select the file in the Log dialog box and click the OK button.
3.
The Version Control tab of the output window shows the following message.
Executing C:\cvs-1-11-17\cvs.exe log sampleCVS.c
RCS file: C:\cvs-1-11-17\DATABASE/sampleCVS/sampleCVS.c,v
Working file: sampleCVS.c
head: 1.2
branch:
locks: strict
access list:
symbolic names:
rel-20060228: 1.1.1.1
REJ10J2169-0100 Rev.1.00
Jul 01, 2010
Page 192 of 523
High-performance Embedded Workshop V.4.08
8. Custom Version Control System
Renesas: 1.1.1
keyword substitution: kv
total revisions: 3; selected revisions: 3
description:
---------------------------revision 1.2
date: 2006/02/28 03:39:22; author: user; state: Exp; lines: +6 -1
modify
---------------------------revision 1.1
date: 2006/02/28 02:46:30; author: user; state: Exp;
branches: 1.1.1;
Initial revision
---------------------------revision 1.1.1.1
date: 2006/02/28 02:46:30; author: user; state: Exp; lines: +0 -0
New Source
======================================================================
Command(s) completed successfully.
REJ10J2169-0100 Rev.1.00
Jul 01, 2010
Page 193 of 523
High-performance Embedded Workshop V.4.08
9. Visual SourceSafe Version Control System
9. Visual SourceSafe Version Control System
The High-performance Embedded Workshop provides specific support for the Microsoft® Visual SourceSafe version
control system.
The Visual SourceSafe version control system associates a project in your workspace with a project inside a Microsoft®
Visual SourceSafe database.
Select a menu option from the [Tools -> Version Control] submenu or click a Version Control toolbar button to
quickly activate the commands most frequently used in the Microsoft® Visual SourceSafe version control system.
For installation and option settings of Microsoft® Visual SourceSafe, refer to the online help or user’s manual for
Microsoft® Visual SourceSafe. In this section, it is assumed that the login username and password have been set.
The outline of procedures for version control by the High-performance Embedded Workshop connected with Microsoft®
Visual SourceSafe is described below. For other functions available, see section 9.2, Visual SourceSafe commands.
1.
Attaching Microsoft® Visual SourceSafe to a workspace
Associate a project in a High-performance Embedded Workshop workspace with a project inside a Microsoft®
Visual SourceSafe database.
•
Select "Microsoft Visual SourceSafe" as the version control system to be connected with the High-performance
Embedded Workshop.
•
Login Microsoft® Visual SourceSafe.
•
Specify the name and location of the project to be created in Microsoft® Visual SourceSafe.
2.
Adding files
Select the files in a High-performance Embedded Workshop workspace that you would like to add to
Microsoft® Visual SourceSafe.
3.
Checking out a file
Select the files that you would like to modify in the High-performance Embedded Workshop workspace and
check them out.
4.
Checking in a file
Select the files modified in the High-performance Embedded Workshop workspace and check them in.
9.1
Attaching Visual SourceSafe to a workspace
The following sections describe how you can associate Microsoft® Visual SourceSafe with your current workspace.
First, you need to select Microsoft® Visual SourceSafe as the version control system to be connected with the Highperformance Embedded Workshop.
REJ10J2169-0100 Rev.1.00
Jul 01, 2010
Page 194 of 523
High-performance Embedded Workshop V.4.08
9. Visual SourceSafe Version Control System
To attach Microsoft® Visual SourceSafe to a workspace
1.
Select [Tools -> Version Control -> Select]. The Select Version Control System dialog box opens.
2.
Select the "Microsoft Visual SourceSafe" entry from the Microsoft Version control systems list.
3.
Click OK. The SourceSafe Login dialog box opens.
4.
Enter your Visual SourceSafe username into the Username field and password into the Password field.
5.
For the Database path field, specify the Visual SourceSafe database file (SRCSAFE.INI) into which you would
like to add this project. Select either of the following operations:
•
Click the Browse button to open the Select Visual SourceSafe database dialog box. Select the Visual
SourceSafe database file and click the Select button, OR
REJ10J2169-0100 Rev.1.00
Jul 01, 2010
Page 195 of 523
High-performance Embedded Workshop V.4.08
9. Visual SourceSafe Version Control System
•
Enter the full path of the Visual SourceSafe database file in the Database path field.
6.
The Create SourceSafe Project For Workspace dialog box was displayed.
7.
The Project name field shows the name of the High-performance Embedded Workshop workspace. The
Project name field displays the name of the project (i.e. folder) to be created in the database. If necessary you
can change this name to another.
8.
The tree underneath the Project name field shows the structure of the database specified in Step 5. Select the
folder into which you would like to create the folder specified in Project name.
9.
Click the OK button in the Create SourceSafe Project For Workspace dialog box. The Create SourceSafe
Project dialog box opens. The example below shows that the High-performance Embedded Workshop
workspace “Workspace_Name” is added as a project “Workspace_Name” into Visual SourceSafe database. The
Project name field shows “Poject_Name” that is to be created next.
10. Click the OK button in the Create SourceSafe Project dialog box.
11. Repeat step 10 for each of the projects in the current workspace.
REJ10J2169-0100 Rev.1.00
Jul 01, 2010
Page 196 of 523
High-performance Embedded Workshop V.4.08
9. Visual SourceSafe Version Control System
The structure image of projects and sub-projects in the Visual SourceSafe database, High-performance Embedded
Workshop workspace and projects, and the workspace directory in the hard disk is shown below.
The High-performance Embedded Workshop has now created the necessary projects within Visual SourceSafe, and set
up the version control toolbar and menu for immediate access.
9.2
Visual SourceSafe commands
The following eight commands are available via the version control toolbar or menu:
Tools -> Version Control menu
Version Control Toolbar
Function
Add to VCS
Adding files to Visual SourceSafe
Remove from VCS
Removing files from Visual SourceSafe
Get from VCS
Getting read-only copy of files from Visual SourceSafe
Check out from VCS
Checking out writable copy of files from Visual
SourceSafe
Check in to VCS
Checking in writable copy of files into Visual
SourceSafe
Get VCS status
Viewing the status of files in Visual SourceSafe
Undo Check Out
-
Undoing a check out operation in Visual SourceSafe
Show History
-
Viewing the history of files in Visual SourceSafe
9.2.1
Adding files to Visual SourceSafe
In the previous section, a mapping between the workspace directory on your hard disk (i.e. the working directory) and the
project directory in Visual SourceSafe (i.e. the directory controlled by Visual SourceSafe) has been established.
However, the project directory (and any subdirectories) on your hard disk may contain many source files, whereas the
directory it is mapped to in Visual SourceSafe will be initially empty.
You need to add files to the Visual SourceSafe project.
REJ10J2169-0100 Rev.1.00
Jul 01, 2010
Page 197 of 523
High-performance Embedded Workshop V.4.08
9. Visual SourceSafe Version Control System
To add files to Visual SourceSafe
1.
Select the files that you would like to add to Visual SourceSafe, in the Projects tab of the workspace window.
You may also select a file folder, project folder, workspace folder or combination thereof. When selecting the
project or workspace folder, the High-performance Embedded Workshop system files will be added to the
selected file list. For example, selecting the project folder will also add the project file (.HWP) to the Files list.
If the project file is then checked out and the version is newer than when it was last loaded, you will be asked
whether you want to reload the project.
2.
Select one of the following operations:
•
Click the Add to VCS toolbar button (
•
Select [Tools -> Version Control -> Add to VCS], OR
•
Right-click to invoke a pop-up menu and select [Version Control -> Add to VCS].
3.
The Add to VCS dialog box opens. Select the checkbox on the left to the name of the file that you wish to add
and click the OK button.
), OR
When you add files to Visual SourceSafe, the local versions in your working directory will become read-only. If you
select the Keep checked out checkbox in the Add to VCS dialog box before you check the files into Visual SourceSafe,
these files can be writable even when they are added. To check that the Add to VCS operation was carried out as you
expected, or to quickly review the status of all of the files in a project:
1.
Select the project folder whose files you want to check, in the Projects tab of the workspace window.
2.
Select one of the following operations:
•
Click the Get VCS status toolbar button (
•
Select [Tools -> Version Control -> Get VCS status], OR
•
Right-click the selected item to invoke a pop-up menu and select [Version Control -> Get VCS status].
REJ10J2169-0100 Rev.1.00
Jul 01, 2010
), OR
Page 198 of 523
High-performance Embedded Workshop V.4.08
3.
9.2.2
9. Visual SourceSafe Version Control System
The status of each file will be displayed in the Version Control tab of the output window, or the File(s) Status
dialog box. For setting of location where the status is to be displayed, see section 9.3, Visual SourceSafe
command options. The information shown includes whether the file is added to the project, if the file is checked
out and, if it is checked out, and who did so.
Removing files from Visual SourceSafe
If you wish to take files out of Visual SourceSafe, the files must be removed.
To remove files from Visual SourceSafe
1.
Select the files that you would like to remove from Visual SourceSafe, in the Projects tab of the workspace
window. You may also select a file folder, project folder, workspace folder or combination thereof.
2.
Select one of the following operations:
•
Click the Remove from VCS toolbar button (
•
Select [Tools -> Version Control -> Remove from VCS], OR
•
Right-click to invoke a pop-up menu and select [Version Control -> Remove from VCS].
3.
The Remove from VCS dialog box opens. Select the checkbox on the left to the name of the file that you wish
to remove and click the OK button.
9.2.3
), OR
Getting read-only copy of files from Visual SourceSafe
Visual SourceSafe protects your source files and ensures that only one user can have a writable copy of a controlled file
at any one time. However, it is possible for any user to obtain a read-only copy of any file.
REJ10J2169-0100 Rev.1.00
Jul 01, 2010
Page 199 of 523
High-performance Embedded Workshop V.4.08
9. Visual SourceSafe Version Control System
To get read-only copy of files from Visual SourceSafe
1.
Select the files that you would like to get from Visual SourceSafe, in the Projects tab of the workspace window.
You may also select a file folder, project folder, workspace folder or combination thereof.
2.
Select one of the following operations:
•
Click the Get from VCS toolbar button (
•
Select the [Tools -> Version Control -> Get from VCS] menu option, OR
•
Right-click to invoke a pop-up menu and select [Version Control -> Get from VCS].
3.
The Get from VCS dialog box opens. Select the checkbox on the left to the name of the file that you wish to
obtain and click the OK button.
9.2.4
), OR
Checking out writable copy of files from Visual SourceSafe
Visual SourceSafe protects your source files and ensures that only one user can have a writable copy of a controlled file
at any one time. The check out operation takes a writable copy of the file from Visual SourceSafe and places it on your
local drive. This can only be done if another user has not already checked out (a blue mark next to file name) the files in
question.
To check out writable copy of files from Visual SourceSafe
1.
Select the files that you would like to check out from Visual SourceSafe, in the Projects tab of the workspace
window. You may also select a file folder, project folder, workspace folder or combination thereof.
2.
Select one of the following operations:
•
Click the Check out from VCS toolbar button (
•
Select [Tools -> Version Control -> Check out from VCS], OR
•
Right-click to invoke a pop-up menu and select [Version Control -> Check out from VCS].
REJ10J2169-0100 Rev.1.00
Jul 01, 2010
), OR
Page 200 of 523
High-performance Embedded Workshop V.4.08
9. Visual SourceSafe Version Control System
3.
The Check out from VCS dialog box opens. Select the checkbox on the left to the name of the file that you
wish to obtain and click the OK button.
4.
When the operation is finished the file has a red mark next to its name. This means you as the current user of
High-performance Embedded Workshop has checked it out.
REJ10J2169-0100 Rev.1.00
Jul 01, 2010
Page 201 of 523
High-performance Embedded Workshop V.4.08
9.2.5
9. Visual SourceSafe Version Control System
Checking in writable copy of files into Visual SourceSafe
Visual SourceSafe protects your source files and ensures that only one user can have a writable copy of a controlled file
at any one time. The check out operation takes a writable copy of the file from Visual SourceSafe and places it on your
local drive. Once a file is checked out it is edited and then checked back in so that the edits can be made available to
other users.
To check in edits made to files in Visual SourceSafe
1.
Select the files that you would like to check back into Visual SourceSafe, in the Projects tab of the workspace
window. You may also select a file folder, project folder, workspace folder or combination thereof.
2.
Select one of the following operations:
•
Click the Check in to VCS toolbar button (
•
Select [Tools -> Version Control -> Check in to VCS], OR
•
Right-click to invoke a pop-up menu and select [Version Control -> Check in to VCS].
3.
The Check in to VCS dialog box opens. Select the checkbox on the left to the name of the file that you wish to
check back into Visual SourceSafe and click the OK button.
4.
When the operation is finished the file has a red mark next to its name. This means you as the current user of
High-performance Embedded Workshop has checked it out.
5.
The red mark next to the file name is removed, which indicates that the file has been checked into Visual
SourceSafe. If you select the Keep checked out checkbox in the Check in to VCS dialog box before you check
the files into Visual SourceSafe, these files can be writable even when they are checked out.
REJ10J2169-0100 Rev.1.00
Jul 01, 2010
), OR
Page 202 of 523
High-performance Embedded Workshop V.4.08
9.2.6
9. Visual SourceSafe Version Control System
Viewing the status of files in Visual SourceSafe
Although files appear in your High-performance Embedded Workshop project (in the Projects tab of the Workspace
window), Visual SourceSafe is not necessarily controlling them. Some of the files that are being controlled by Visual
SourceSafe will be checked in, and others will be checked out (i.e. being edited by a user). The Get VCS status
command displays the current status of files.
The status of each file will be displayed in the Version Control tab of the output window, or the File(s) Status dialog
box. For setting of location where the status is to be displayed, see section 9.3, Visual SourceSafe command options.
To view the status of files in Visual SourceSafe
1.
Select the files whose status you would like to view, in the Projects tab of the workspace window. You may
also select a file folder, project folder, workspace folder or combination thereof.
2.
Select one of the following operations:
•
Click the Get VCS status toolbar button (
•
Select [Tools -> Version Control -> Get VCS status], OR
•
Right-click to invoke a pop-up menu and select [Version Control -> Get VCS status].
3.
The Version Control tab of the output window or the File(s) Status dialog box shows the status of files.
9.2.7
), OR
Undoing a check out command in Visual SourceSafe
Visual SourceSafe protects your source files and ensures that only one user can have a writable copy of a controlled file
at any one time. The check out operation takes a writable copy of the file from Visual SourceSafe and places it on your
local drive. Once a file is checked out it is edited and then checked back in so that the edits can be made available to
other users. However, if the check out operation was carried out by mistake, or perhaps is no longer required, then the
operation can be undone.
To undo a check out of files from Visual SourceSafe
1.
Select the files upon which you would like to undo a previous check out operation, in the Projects tab of the
workspace window. You may also select a file folder, project folder, workspace folder or combination thereof.
2.
Select one of the following operations:
•
Select [Tools -> Version Control -> Undo Check Out], OR
•
Right-click to invoke a pop-up menu and select [Version Control -> Undo Check Out].
REJ10J2169-0100 Rev.1.00
Jul 01, 2010
Page 203 of 523
High-performance Embedded Workshop V.4.08
9. Visual SourceSafe Version Control System
3.
The Undo Check Out dialog box opens. Select the checkbox on the left to the name of the file that you would
like to undo a previous check out operation and click the OK button.
4.
If the file has been modified, the confirmation message box shown below appears. To continue the check-out
operation, click the Cancel button. To load the unmodified file from the version control system, click the Yes
button. If you click the No button, the contents of the local file will be different from those of the file in the
version control system.
9.2.8
Viewing the history of files in Visual SourceSafe
Visual SourceSafe controls the edits to the files in its projects and allows you to view the complete history of these edits
right back to the time that the file was first added to the project.
The status of each file will be displayed in the Version Control tab of the output window, or the File(s) History dialog
box. For setting of location where the status is to be displayed, see section 9.3, Visual SourceSafe command options.
To view the revision history of files in Visual SourceSafe
1.
Select the files whose history you would like to view, in the Projects tab of the workspace window. You may
also select a file folder, project folder, workspace folder or combination thereof.
2.
Select one of the following operations:
•
Select [Tools -> Version Control -> Show History], OR
•
Right-click to invoke a pop-up menu and select [Version Control -> Show History].
3.
The Version Control tab of the output window or the File(s) History dialog box shows the revision history of
files.
REJ10J2169-0100 Rev.1.00
Jul 01, 2010
Page 204 of 523
High-performance Embedded Workshop V.4.08
9.3
9. Visual SourceSafe Version Control System
Visual SourceSafe command options
You can control the way in which the history and status commands are displayed by selecting [Tools -> Version Control
-> Configure].
1.
Select [Tools -> Version Control -> Configure]. The Version Control Setup dialog box opens.
2.
Select the General tab.
3.
To display the results of a history command in a dialog box then check the Display dialog box for history
checkbox or clear it if you would rather display the output in the Version Control tab of the Output window.
4.
To display the results of a status command in a dialog box, check the Display dialog box for file status
checkbox or clear it if you would rather display the output in the Version Control tab of the Output window.
9.4
Version Control setup
You can view or modify the general settings for the High-performance Embedded Workshop connected with Visual
SourceSafe.
1.
Select [Tools -> Version Control -> Configure]. The Version Control Setup dialog box opens.
2.
Select the General tab.
3.
The User details group box shows the login user ID and password, and database file in Visual SourceSafe.
4.
You can modify the user ID, password, or database in the Log in dialog box opened by clicking the Log In
button.
5.
The Configuration file group box shows the configuration file in the current version control system.
REJ10J2169-0100 Rev.1.00
Jul 01, 2010
Page 205 of 523
High-performance Embedded Workshop V.4.08
9.5
9. Visual SourceSafe Version Control System
Specifying file locations
You can view the current mapping in the project. Select the project that you wish to view the mapping from the Show
mappings for project drop-down list. The High-performance Embedded Workshop workspace and project directory,
and Visual SourceSafe project directory are shown in the list. Mapping of projects can be added, modified, or removed.
For detail, see section 8.6, Specifying file locations.
To define a new directory mapping
1.
Select [Tools -> Version Control -> Configure]. The Version Control Setup dialog box opens.
2.
Select the Mapping tab.
3.
Click the Add button. The Version Control Directory Mapping dialog box opens.
4.
Specify a High-performance Embedded Workshop workspace directory or project directory in the Source
directory field. Select one of the following operations:
•
Enter the directory name, OR
•
Click the placeholder button. Then select "Project directory" or "Workspace directory" from the menu, OR
•
Click the Browse button to open the Browse to Source Directory dialog box. Select the directory and click the
Select button.
5.
Enter the name of the Visual SourceSafe project directory to be mapped to the source directory in the Version
Control Directory Mapping field.
6.
Click the OK button.
REJ10J2169-0100 Rev.1.00
Jul 01, 2010
Page 206 of 523
High-performance Embedded Workshop V.4.08
9. Visual SourceSafe Version Control System
To modify a directory mapping
1.
Select [Tools -> Version Control -> Configure]. The Version Control Setup dialog box opens.
2.
Select the Mapping tab.
3.
Select the mapping to be modified from the list and then click the Modify button. The Version Control
Directory Mapping dialog box opens.
4.
To modify a mapping, make the same setting as required for adding a mapping in the Version Control Directory
Mapping dialog box.
5.
Click the OK button.
To remove a directory mapping
9.6
1.
Select [Tools -> Version Control -> Configure]. The Version Control Setup dialog box opens.
2.
Select the Mapping tab.
3.
Select the mapping to be removed from the list and then click the Remove button.
Adding Visual SourceSafe commands
In the Custom Commands tab of the Version Control Setup dialog box, you can add a menu defining a Visual
SourceSafe command not included in the version control submenu.
Selecting this menu executes the defined command. Output information on execution of this command will be shown in
the Version Control tab of the Output window.
This section introduces the definition of Properties command as an example.
REJ10J2169-0100 Rev.1.00
Jul 01, 2010
Page 207 of 523
High-performance Embedded Workshop V.4.08
•
9. Visual SourceSafe Version Control System
Execution control of version control commands
1.
Select the Prompt before executing command checkbox.
2.
Deselect the Run in DOS Window checkbox. (This is because the RCS commands must be input via the MSDOS prompt.)
3.
Select the User forward-slash '/' as version control directory delimiter checkbox. (Visual SourceSafe uses
this format.)
For detail, see section 8.9, Controlling execution of a Version Control System.
•
Setting up commands
1.
Click the Add button. The Add Menu Option dialog box appears.
2.
Enter "Properties" in Option and click the Add button. The Add Command dialog box appears.
REJ10J2169-0100 Rev.1.00
Jul 01, 2010
Page 208 of 523
High-performance Embedded Workshop V.4.08
9. Visual SourceSafe Version Control System
3.
Enter the executable file (SS.EXE) for version control system in Version control executable.
4.
Enter "Properties -y$(USERNAME),$(PASSWORD) -i- $(VCDIR)/$(FILENAME)" in Arguments.
5.
Enter "$(FILEDIR)" in Initial directory.
6.
Click the OK button.
7.
Click the OK button in the Add Menu Option dialog box.
For detail, see section 8.2, Defining Version Control commands.
•
Command Execution
1.
Select [Tools -> Version Control -> Properties].
2.
Select the file in the Properties dialog box and click the OK button.
3.
Output information on execution of this command will be shown in the Version Control tab of the Output
window.
REJ10J2169-0100 Rev.1.00
Jul 01, 2010
Page 209 of 523
High-performance Embedded Workshop V.4.08
10. Sharing Projects by Network Facilities
10. Sharing Projects by Network Facilities
The High-performance Embedded Workshop is capable of sharing workspaces and projects across a network. This
allows users to concurrently work on shared projects and see each other’s changes as they happen. This system can be
used in conjunction with version control. The major difference with using this system is that each user can modify and
update the workspace and project without making all of the other users reload their project and potentially lose all their
changes.
This system is implemented by making one of the machines attached to the network the server machine. All other client
machines then use the service this machine is providing. So if one of the client machines adds a new file, the server
machine is notified. The server then notifies all other clients the action has taken place. This procedure is shown below.
The network system allows users to be given access rights to files. This allows the project administrator to make sure the
only people who can modify the project and source files are allowed to do so. This might allow the administrator to limit
each user to only have write capabilities for their own area of the project, other areas would be read only. This could limit
any potential conflict or damage one user could do to other areas of the project. These limitations can be set to a number
of different levels. This is outlined later in this section.
Notes:
•
Sharing projects by network facilities is not possible under the Windows Vista® or Windows® 7 operating
system.
•
Certain operations are locked when other clients are carrying them out. This means that if one user is currently
changing the toolchain options all of the other users can only see read only versions of this data.
•
The performance of High-performance Embedded Workshop does suffer when using the network facilities. If
working in a small team it might be more suitable to use the single user mode and version control.
REJ10J2169-0100 Rev.1.00
Jul 01, 2010
Page 210 of 523
High-performance Embedded Workshop V.4.08
10. Sharing Projects by Network Facilities
Procedures necessary before invoking the High-performance Embedded Workshop on a PC with Windows® XP
Service Pack 2 or later
See the following section, 10.1, Sharing projects by network facilities in a PC with Windows® XP Service Pack 2 or
later.
To setup a project file on the server machine
1.
Create a project file for the network.
2.
As the directory of the New Project Workspace dialog, specify a network path that can be recognized by both
the server machine and the client machine.
Example: \\WorkGroup\Severl\ShareDirectory
Sharing workspaces
The directory specified by the above procedure (step 2) must be shared. The High-performance Embedded Workshop’s
network facilities share the source, object, and other files in the server machine. These files exist only in the server
machine. From the client machine, the files are accessed via the network.
To open a workspace from the client machine
To open a workspace on the network from the client machine, search the network path and select the workspace in the
Open Workspace dialog box.
10.1
Sharing projects by network facilities in a PC with Windows® XP Service Pack
2 or later
Windows® XP Service Pack 2 provides enhanced security measures.
In a PC with Windows® XP Service Pack 2 or later, you cannot share projects by network facilities if the Windows®
operating system is in its default state. Before invoking the High-performance Embedded Workshop, you should take the
procedures listed below to change the settings of the PC so that High-performance Embedded Workshop system will be
accessed via network. When your server machine and client machine have Windows® XP Service Pack 2 or later, the
settings are required for both machines.
•
For a server machine with Windows® XP Service Pack 2 or later
Step1: Firewall
1.
Select Control Panel from the Windows® start menu.
2.
Click Network and Internet Connections in the Control Panel.
3.
Click Windows Firewall in the Network and Internet Connections. The Windows Firewall dialog box is
invoked.
REJ10J2169-0100 Rev.1.00
Jul 01, 2010
Page 211 of 523
High-performance Embedded Workshop V.4.08
10. Sharing Projects by Network Facilities
4.
Click the Exceptions tab.
5.
Click the Add Program button to open the Add a Program dialog box.
6.
Click the Browse button and select \System\Sec\HewServer\Hew3Server.exe under the High-performance
Embedded Workshop installation directory.
7.
Click the OK button and close the Add a Program dialog box.
8.
Click the Add Port button to open the Add a Port dialog box.
9.
Enter "DCOM" in Name and "135" in Port Number and select TCP option button.
10. Click the OK button and close the Add a Port dialog box.
11. Click the OK button in the Windows Firewall dialog box.
12. Close the Network and Internet Connections.
13. Close the Control Panel.
Step2: DCOM
1.
Select Run from the Windows® start menu. The Run dialog box is invoked.
2.
Enter "dcomcnfg" in the Open field and click the OK button. The Component Services window opens.
3.
Expand the tree. If the Window Security Alert dialog box appears at expansion, click the Keep Blocking
button.
Console Root -> Component Services -> Computers -> My Computer
4.
Right-click on My Computer and select Properties from the pop-up menu. The My Computer Properties
dialog box is invoked.
5.
Click the COM Security tab.
6.
Click the Edit Limits button in the Access Permissions area to open the Access Permission dialog box.
7.
Select "ANONYMOUS LOGON" in the Group or user names list.
8.
Select the Allow checkbox for Remote Activation in the Permission for ANONYMOUS LOGON list.
9.
Click the OK button and close the Access Permission dialog box.
10. Click the Edit Limits button in the Launch and Activation Permission area to open the Launch Permission
dialog box.
11. Select "Everyone" in the Group or user names list.
12. Select the Allow checkbox for Local Launch in the Permission for Everyone list. Select the Allow checkbox
for Remote Activation in the Permission for Everyone list.
13. Click the OK button and close the Launch Permission dialog box.
REJ10J2169-0100 Rev.1.00
Jul 01, 2010
Page 212 of 523
High-performance Embedded Workshop V.4.08
10. Sharing Projects by Network Facilities
14. Click the OK button on the My Computer Properties dialog box.
15. Close the Component Services window.
•
For a client machine with Windows® XP Service Pack 2 or later
Firewall
1.
Select Control Panel from the Windows® start menu.
2.
Click Network and Internet Connections in the Control Panel.
3.
Click Windows Firewall in the Network and Internet Connections. The Windows Firewall dialog box is
invoked.
4.
Click the Exceptions tab.
5.
Click the Add Program button to open the Add a Program dialog box.
6.
Click the Browse button and select HEW2.exe under the High-performance Embedded Workshop installation
directory.
7.
Click the OK button and close the Add a Program dialog box.
8.
Click the Add Port button to open the Add a Port dialog box.
9.
Enter "DCOM" in Name and "135" in Port Number and select TCP option button.
10. Click the OK button and close the Add a Port dialog box.
11. Click the OK button in the Windows Firewall dialog box.
12. Close the Network and Internet Connections.
13. Close the Control Panel.
10.2
Enabling network facilities to share projects
To use network facilities to share projects
1.
Select [Setup -> Options]. The Options dialog box opens.
2.
Select the Network tab.
3.
Click the Enable network data access checkbox. This should add an administrator to the system without a
password. The administrator is the only user that can add additional users to the system and change user access
rights. The administrator has the highest level of access.
4.
Before leaving the network dialog the administrator must set their password. It is not possible to leave this
dialog box until this is completed. This is described in the following section.
5.
Close the Options dialog box.
REJ10J2169-0100 Rev.1.00
Jul 01, 2010
Page 213 of 523
High-performance Embedded Workshop V.4.08
10. Sharing Projects by Network Facilities
6.
When the dialog box is closed you are asked if you want to save the workspace and then re-open it. This is
because the workspace must be re-opened in the shared access mode. If the changes are not saved then they will
be lost. Click OK to share projects by network facilities.
7.
When you re-open the workspace and log into the system, a dialog is displayed showing your current access
rights. For example if you are the admin user the level will be administrator. When this dialog is closed the
High-performance Embedded Workshop server window is opened and the network facilities to share projects
are enabled.
10.3
Setting the administrator user's password
To set the administrator users password
1.
Continue from the previous sections (step 4).
2.
Click the Password button. This should have been enabled when the network data access was enabled.
3.
The Change password dialog box opens.
4.
The user name is read only in the top field. In this case it should be Admin.
5.
Type the new password into both of the fields and click OK.
6.
This should set the user and password on the Network tab of Options dialog box.
REJ10J2169-0100 Rev.1.00
Jul 01, 2010
Page 214 of 523
High-performance Embedded Workshop V.4.08
10.4
10. Sharing Projects by Network Facilities
Adding new users to the system
The initial setting of the network database adds an administrator user and a guest user to the system. The following levels
of access are possible in the High-performance Embedded Workshop system:
Administrator
Full read/write access
Read/write file access
Read only
Full access to every aspect of High-performance Embedded Workshop. The user can add
and remove users from the projects and change access rights. The administration user
can change the workspace and project files and also the source files.
The workspace and project files can be modified, as can the source files. But it is not
possible to change user access rights from this access level.
Only the source files can be modified. All project settings can only be viewed not
modified.
All source files and project files can only be viewed as read only. Nothing can be
modified.
When any user opens a network-enabled project they must type in their user name and password. Until this is done no
access can be granted. Once entered the user is given one of the levels of access as seen above.
To add a new user to the system
1.
Log in with a user who has administrator access rights. The process for doing this is described above.
2.
Select [Setup -> Options]. The Options dialog box opens.
3.
Select the Network tab.
4.
Click the Access rights button. The User access rights dialog is displayed.
5.
Click the Add button. The Add new user dialog box opens. This allows you as the administration user to add a
new log in name and password. Normally the password should be set to some default text or left blank. Then
click OK.
6.
Once OK is clicked the user is added with read only rights. To change the access level select the user you wish
to modify and then click the required radio button. Then click OK to save the access rights changes.
To remove an existing user to the system
1.
Log in with a user who has administrator access rights. The process for doing this is described above.
2.
Select [Setup -> Options]. The Options dialog box opens.
3.
Select the Network tab.
4.
Click the Access rights button. The User access rights dialog is displayed.
5.
Select the user you wish to remove in the users list.
6.
Press the Remove button.
7.
Then click OK to save the access rights changes.
REJ10J2169-0100 Rev.1.00
Jul 01, 2010
Page 215 of 523
High-performance Embedded Workshop V.4.08
10.5
10. Sharing Projects by Network Facilities
Changing your password
To change your password
1.
Log into the High-performance Embedded Workshop network database you are changing your password for.
Select [Setup -> Options]. The Options dialog box opens.
2.
Select the Network tab.
3.
Click the Password button.
4.
Enter your new password and confirm it in the second edit box.
5.
Click OK.
6.
Then click OK to save the password change.
10.6
Note on using the network facilities to share projects
When you share a networked project for the first time the High-performance Embedded Workshop automatically
connects you to the correct network High-performance Embedded Workshop service. This is defined using machine
name. If the workspace cannot be found using the machine name then the dialog below appears. Simply type or browse
the location of the machine and click OK. If you want to be the server machine then leave the radio button on its default
selection, use local machine.
REJ10J2169-0100 Rev.1.00
Jul 01, 2010
Page 216 of 523
High-performance Embedded Workshop V.4.08
10. Sharing Projects by Network Facilities
If you have previously been the server of a workspace then the following message will be displayed when you attempt
connection to another machine. Clicking Yes then connects your machine to the new location.
Note:
If the network is running multiple High-performance Embedded Workshop workspaces with the network facilities to
share projects enabled then a user can only access one of them at one time. The only instance when this is not the case is
if the same machine is serving all of the network workspaces.
REJ10J2169-0100 Rev.1.00
Jul 01, 2010
Page 217 of 523
High-performance Embedded Workshop V.4.08
11. Comparing Files
11. Comparing Files
The High-performance Embedded Workshop has an integrated difference view. You can perform a difference
comparison with two files on your local drive or a local file and a file in the Microsoft® Visual SourceSafe system.
11.1
Opening the Difference window
To perform a difference comparison with two files on your local drive
1.
Select one of the following operations:
•
Select a file in the Projects tab of the workspace window. Right-click on the selected file to open a pop-up
menu. Select Show Differences, OR
•
Click the Compare Files toolbar button (
•
Select [View -> Differences]. Right-click within the window to open a pop-up menu. Select [Compare].
2.
The Compare Files dialog box opens.
3.
Ensure the Compare with file on drive radio button is enabled.
4.
Enter the name of a file to be compared to in Reference file. If you have opened the Compare Files dialog box
via the workspace window at step 1, the file name is already entered in Reference file. Select a previously used
file from the drop-down list box or click the Browse button to browse a file.
5.
Clicking the Advanced button displays the Compare Files - Advanced Options dialog box. This allows you to
perform the difference comparison without taking white space into account. Click OK when you are finished
with this options dialog box.
6.
Click Compare.
REJ10J2169-0100 Rev.1.00
Jul 01, 2010
), OR
Page 218 of 523
High-performance Embedded Workshop V.4.08
11. Comparing Files
To perform a difference comparison with a local file and a file in Visual SourceSafe system
1.
The High-performance Embedded Workshop must be connected to the Visual SourceSafe system. Add the two
files you wish to compare to the Visual SourceSafe system in advance.
2.
Select one of the following operations:
•
Select a file in the Projects tab of the workspace window. Right-click on the selected file to open a pop-up
menu. Select Show Differences, OR
•
Click the Compare Files toolbar button (
•
Select [View -> Differences]. Right-click within the window to open a pop-up menu. Select Compare.
3.
The Compare Files dialog box opens.
4.
Click the Compare with version control radio button. This radio button is selectable if the High-performance
Embedded Workshop has been connected to the Visual SourceSafe system.
5.
Enter the name of a file to be compared to in Reference file. If you have opened the Compare Files dialog box
via the workspace window at step 2, the file name is already entered in Reference file. Select a previously used
file from the drop-down list box or click the Browse button to browse a file.
6.
Clicking the Advanced button displays the Compare Files - Advanced Options dialog box. This allows you to
perform the difference comparison without taking white space into account. Click OK when you are finished
with this options dialog.
7.
Click Compare.
), OR
The Difference window is displayed.
REJ10J2169-0100 Rev.1.00
Jul 01, 2010
Page 219 of 523
High-performance Embedded Workshop V.4.08
11. Comparing Files
Window configuration
•
In the Difference window, the left and right panes respectively show the files to be compared.
•
Their names are at the header of each pane.
•
If you hover the mouse cursor on the boundary of the two panes, the cursor turns into a double-sided arrow. To
adjust the widths of the panes, drag the mouse to a desirable position.
Options
Right-clicking displays a pop-up menu containing available options.
A basic operation is allocated to the toolbar.
The Toolbar display and Customize toolbar options are also included in the pop-up menu opened by right-clicking on
the toolbar.
Pop-up Menu Option Toolbar Button Macro Recording
Function
Compare
-
This opens a new compare window so that some new
files can be compared and the differences displayed.
-
This opens a dialog which allows you to choose a file to
export the current difference results to a textual format.
Ignore white space
-
The ignore white space option which is on the advanced
options dialog can be toggled via this menu option.
Find
-
Displays a standard find dialog. This uses the same find
dialog as the High-performance Embedded Workshop
editor.
Find previous
-
Finds the next previous string that meets the find
requirements.
Export results to file
-
REJ10J2169-0100 Rev.1.00
Jul 01, 2010
Page 220 of 523
High-performance Embedded Workshop V.4.08
11. Comparing Files
Pop-up Menu Option Toolbar Button Macro Recording
Function
Find next
-
Finds the next string that meets the find requirements.
Previous difference
-
Automatically jumps the view to the next previous
difference.
Next difference
-
Automatically jumps the view to the next difference.
Refresh comparison
-
-
Refreshes the view to manually run the difference
comparison again. This can be used if either file has
been modified since the last comparison.
Toolbar display
-
-
Shows or hides the toolbar
Customize toolbar
-
-
Customizes toolbar buttons.
REJ10J2169-0100 Rev.1.00
Jul 01, 2010
Page 221 of 523
High-performance Embedded Workshop V.4.08
12. Navigation Facilities
12. Navigation Facilities
The High-performance Embedded Workshop has a number of new integrated navigation facilities.
The Navigation tab of the workspace window contains categories for all supported navigation types. In Highperformance Embedded Workshop the following navigation components are supported as standard:
Navigation Type (Category)
Function
C Defines
All #defines for C and C++ source files are displayed.
C Functions
All ANSI C standard functions are for C source files displayed.
C++ Class
All classes, functions and members are displayed for C++ source files.
By default, it is possible to display the navigation items grouped by a navigation category.
Underneath each category, the navigation items belonging to the active project are displayed in the alphabetical order.
To group the display of navigation items by a navigation category
1.
If you right-click anywhere inside the Navigation tab, a pop-up menu will be invoked.
2.
Un-check the Group By File menu option. This option is unchecked by default.
The Navigation view lets you see the navigation items on a file-by-file basis.
Each file in the active project is shown in the tree, and the navigation items belonging to each file are displayed below it
in the alphabetical order.
REJ10J2169-0100 Rev.1.00
Jul 01, 2010
Page 222 of 523
High-performance Embedded Workshop V.4.08
12. Navigation Facilities
To group the display of navigation items by a file
1.
If you right-click anywhere inside the Navigation tab, a pop-up menu will be invoked.
2.
Check Group By File.
It is possible to disable scanning for certain navigation categories if you do not require the information.
To switch off a navigation category
1.
If you right-click anywhere inside the Navigation tab, a pop-up menu will be invoked.
2.
Select Select Categories. The Select Categories dialog box is displayed.
REJ10J2169-0100 Rev.1.00
Jul 01, 2010
Page 223 of 523
High-performance Embedded Workshop V.4.08
3.
Un-check any categories you are not interested in seeing definitions for.
4.
Click OK.
12. Navigation Facilities
To update the navigation view
1.
If you right-click anywhere inside the Navigation tab, a pop-up menu will be invoked.
2.
Select Refresh.
Notes:
•
The navigation items are displayed gradually as the files are scanned. This means it may take some time if there
are many files to fully complete the Navigation view update.
•
Files are re-scanned when they are saved. This means that navigation information will not be available for new
classes and functions until the file or files are saved.
•
Group By File and Group By Access cannot both be on at the same time. Switching one on will switch the
other one off.
12.1
C function and #define navigation component
These components simply add the function and #define definitions to the navigation view.
REJ10J2169-0100 Rev.1.00
Jul 01, 2010
Page 224 of 523
High-performance Embedded Workshop V.4.08
12. Navigation Facilities
To jump to a definition
Select either of the following ways.
•
Double-click a function or a #define definition on the Navigation tab.
•
Right-click on a function or a #define definition on the Navigation tab. Select Go to Definition from the pop-up
menu.
12.2
C++ navigation component
The C++ navigation component supports the following structures in the view for C++ source files. The basic structure of
the information is shown below.
The C++ navigation view uses a number of icons to describe the type of function or variable the icon belongs too. These
are listed in the table below:
REJ10J2169-0100 Rev.1.00
Jul 01, 2010
Page 225 of 523
High-performance Embedded Workshop V.4.08
12. Navigation Facilities
Double clicking on a navigation item by default jumps you to the associated navigation items declaration. This default
behavior can be modified by selecting Jump To Definition On Double-Click from the pop-up menu (this option is
unchecked by default). When this option is checked, double-clicking a navigation item jumps you to the associated
navigation items definition.
To jump to the definition
Select either of the following ways.
•
Right-click on navigation items on the Navigation tab to display a pop-up menu and check that Jump To
Definition On Double-Click is checked. Double-click a navigation item on the Navigation tab.
•
Right-click on navigation items on the Navigation tab to display a pop-up menu. Select Go to Definition.
To jump to the declaration
Select either of the following ways.
•
Right-click on navigation items on the Navigation tab to display a pop-up menu and check that Jump To
Definition On Double-Click is unchecked. Double-click a navigation item on the Navigation tab.
•
Right-click on navigation items on the Navigation tab to display a pop-up menu. Select Go to Declaration.
To list the member variables and functions in the alphabetical order
1.
Right-click on navigation items on the Navigation tab to display a pop-up menu.
2.
Un-check Group By Access. This option is unchecked by default.
REJ10J2169-0100 Rev.1.00
Jul 01, 2010
Page 226 of 523
High-performance Embedded Workshop V.4.08
12. Navigation Facilities
To group the display of public, private, and protected member variables and functions together
1.
Right-click on navigation items on the Navigation tab to display a pop-up menu.
2.
Check Group By Access. This option is unchecked by default.
Note that Group By File and Group By Access cannot both be on at the same time. Switching one on will switch the
other one off.
Another useful facility is the capability of viewing the base or derived classes for a certain selection.
To view the Base or derived classes
1.
Right-click on class on the Navigation tab to display a pop-up menu.
2.
To see the derived classes for the selection click the Show Derived Classes menu option. To see the base
classes for the selection click the Show Base Classes menu option.
3.
Depending on the selection a dialog is displayed which shows the class structure selected in an expanded tree
format.
4.
Click Close to close this dialog once you have the information you require.
12.3
Jump to a definition from the editor
It is possible to select navigation items of #defines, C functions, or C++ classes from the source codes shown in the editor
window and view the positions where these navigation items are defined.
Note, however, that these navigation items must be under the categories checked on the Navigation tab of the workspace
window.
To jump to a definition
1.
Right-click on a navigation item, which you wish to view where it is defined, within the Source field of the
Editor window.
2.
Select Go To Definition Of 'Navigation item' from the pop-up menu.
REJ10J2169-0100 Rev.1.00
Jul 01, 2010
Page 227 of 523
High-performance Embedded Workshop V.4.08
3.
12.4
12. Navigation Facilities
If two or more navigation items are found, the Select Navigation Item dialog box appears. File names and line
numbers are listed in the dialog box. Double-click an item, or select an item and press the OK button.
Drag and drop navigation items
It is possible 'drag and drop' navigation items of #defines, C functions, or C++ classes shown in the Navigation tab of the
workspace window. The Category (C Defines, C Functions, and C++ Classes), Globals Folder, and File items will not be
draggable.
Drag and drop of navigation items into a file that's currently open in the editor
This makes it easier for you to write code, as you will be able to drag the relevant items into the file, instead of having to
type them.
REJ10J2169-0100 Rev.1.00
Jul 01, 2010
Page 228 of 523
High-performance Embedded Workshop V.4.08
•
Multiple items can be dragged at the same time (these will appear on separate lines).
•
The navigation item names will be inserted in alphabetical order.
•
Note that if you drag a function, only the function's name will be dragged.
12.5
12. Navigation Facilities
Smart edit capability
Another feature of the High-performance Embedded Workshop is its smart edit facility. This is enabled by default for all
C++ source files. This feature allows the High-performance Embedded Workshop editor to access C++ navigation
information and provide auto-completion help when using C functions, #defines, C++ classes, and member functions.
The High-performance Embedded Workshop editor accesses C functions, #defines, and C++ navigation information and
shows the smart editor’s list in a pop-up window.
To use the Smart edit facilities
1.
Select [Setup -> Options]. The Options dialog box opens.
2.
Select the Editor tab.
3.
The Enable Smart-edit should be checked.
4.
Click OK.
With this option switched on if you are working on C or C++ file the smart-edit capability should be enabled.
REJ10J2169-0100 Rev.1.00
Jul 01, 2010
Page 229 of 523
High-performance Embedded Workshop V.4.08
12. Navigation Facilities
Note:
When the navigation category C Defines, C Functions, or C++ Classes is unchecked in the Navigation tab of the
workspace window, the High-performance Embedded Workshop’s smart editor function is disabled.
During normal usage the following editor operations will make the smart edit facilities visible.
•
If you are using an object and are trying to access the members using the ‘.’ or ‘->’. If you do this a pop-up window
will be displayed which may help you select the correct member more efficiently than typing. Whilst typing the popup window will keep track of the keys you have pressed to help your selection. If you press return then the currently
selected member will be added. This pop-up window is also used when using the ‘::’ method and it is displayed in
figure below. Pressing CTRL+SPACE displays the pop-up window. This pop-up window disappears when a member
is added.
•
If you are trying to use C or C++ functions then the pop-up window in Figure below is displayed when the first open
bracket is entered. This pop-up window allows you to see what functions are available for the current object.
Selecting the function automatically enters the remaining parameters for you. Pressing CTRL+SHIFT+SPACE opens
this pop-up window, which is visible until a closing bracket is entered.
•
It is possible to select a C function, #define, C++ class, or member function in the pop-up window and add it to the
High-performance Embedded Workshop editor window by either of the following ways:
o
Right-click within the High-performance Embedded Workshop editor window to display a pop-up menu and
select List Members. A pop-up window opens. Select an item you wish to add and press ENTER, OR
o
Press CTRL+SPACE to display a pop-up window. Select an item you wish to add and press ENTER.
REJ10J2169-0100 Rev.1.00
Jul 01, 2010
Page 230 of 523
High-performance Embedded Workshop V.4.08
13. Map
13. Map
Among the section settings of the linkage editor and the contents of the linkage list file output by the linkage editor,
information on sections and symbols are respectively shown. There are the following features.
Sections
- A tree view in the form of address - section group - section
- Assignment of sections can be changed by drag and drop
- You can add, modify, or delete addresses, section groups, and sections
- The source file for the address in the selected line can be opened in the editor window
- The contents can be printed out
Symbols
- Lists all symbol information or those for respective sections
- You can search for, filter, or sort (this function is not supported by the evaluation version) symbol information
- The source file for the address in the selected line can be opened in the editor window
- The contents can be printed out
•
Supported toolchains
The toolchains included in the following compiler packages support the map function.
•
o
C/C++ Compiler Package for SuperH Family V.7.1.03 or later
o
C/C++ Compiler Package for H8SX, H8S, H8 Family V.5.0.05 or later
o
C Compiler Package for M16C Series V.5.42 Release 00 or later
o
C Compiler Package for M32C Series V.5.41 Release 00 or later
o
C Compiler Package for R32C Series V.1.01 Release 00 or later
o
C/C++ Compiler Package for RX Family V.1.00 Release 00 or later
To view the information on sections and symbols
To view the information on sections and symbols, the following setting is required in advance:
1.
Select [Build -> xxxxxx Standard Toolchain] to open the build options dialog box.
REJ10J2169-0100 Rev.1.00
Jul 01, 2010
Page 231 of 523
High-performance Embedded Workshop V.4.08
2.
Select List for Category in the Link/Library tab.
3.
Select the Generate list file checkbox. This allows output of information on sections.
4.
Click the Enable all button. This allows output of information on symbols.
5.
Select [Build -> Build].
13. Map
Note:
If a subcommand file is specified as shown below, the section setting information of the linkage editor will not be shown
in the Map Section Information window.
REJ10J2169-0100 Rev.1.00
Jul 01, 2010
Page 232 of 523
High-performance Embedded Workshop V.4.08
13.1
13. Map
Managing section settings
You can add, modify, or delete information on sections on the GUI through the Map Section Information window. It is
also easy to check the section settings after modification.
13.1.1
Opening the Map Section Information window
To open the Map Section Information window
1.
Select one of the following operations to open the Select Map Window Type dialog box:
•
Select [View -> Map], OR
•
Click the Map toolbar button (
2.
Select "Map Section Information" in the Map drop-down list.
3.
Click OK.
).
Window configuration
REJ10J2169-0100 Rev.1.00
Jul 01, 2010
Page 233 of 523
High-performance Embedded Workshop V.4.08
•
13. Map
The left pane shows the map information and section settings of the linkage editor.
- Section settings of the linkage editor are displayed.
- While in the edit mode, each of subsection groups, overlay groups, and sections can be dragged and dropped.
User Operation
Select a subsection group (
) or
) and drag it while
section (
holding the Ctrl key
Select an overlay group (
) and
drag it while holding the Ctrl key
Select a subsection group (
Select a subsection group (
•
Added before the item where
dropped
‘Normal select’ pointer showing the item name and
an upward-pointing arrow when placed over a
destination where the item can be moved to
Added to the next of the item
where dropped
) or
) and drag it
Select an overlay group (
drag it
‘Normal select’ pointer showing the item name and
a ‘+’ sign when placed over a destination where
Copied to the last of the items
the item can be copied to
) or
) and drag it while
section (
holding the Shift key
section (
Appearance of the Mouse Pointer while an Item Position of the Dropped Item
is Dragged
Copied to the next of the item
where dropped
) and
‘Normal select’ pointer showing the item name
when placed over a destination where the item
can be moved to
Added to the last of the items
The right pane shows the section settings after a build.
- Nothing is displayed in this pane if there is no linkage list file (.map) output by the linkage editor.
- You can adjust the column width by dragging the mouse on a column header. Moreover, right-clicking the column
header displays a pop-up menu. A tick mark right next to an entry indicates that this column is displayed. Clicking
an entry will switch showing/hiding the column.
- Clicking the column header sorts the listed items. When the window is first opened, the items are sorted by the value
of Start Address.
- The Overlay column shows the name of the primary section.
Window options
•
Map information and section settings of the linkage editor (left pane)
Right-clicking displays a pop-up menu containing available options.
A basic operation is allocated to the toolbar.
The Toolbar display and Customize toolbar options are also included in the pop-up menu opened by right-clicking on
the toolbar.
REJ10J2169-0100 Rev.1.00
Jul 01, 2010
Page 234 of 523
High-performance Embedded Workshop V.4.08
Pop-up Menu Option
Toolbar Button
13. Map
Function
Section Edit Mode
Enters the edit mode.
Add Section Group
Adds the section group.
Add Section
Adds the section.
Add Overlay Group *1
Adds the overlay group.
Section Auto Registration
Automatically adds missing sections.
Edit Selected Item
Edits the selected item.
Cut
Cuts the section information.
Copy
Copies the section information.
Paste
Pastes the section information.
Delete
Deletes the section information.
Move up
Moves up the section information.
Move Down
Moves down the section information.
Change Primary Section *1
Changes primary section.
Memory Map Setting *2
Sets a memory map.
Memory Resource Auto Allocate *2
Automatically allocates the memory resource.
Print
Prints section setting tree view.
Toolbar display
-
Shows or hides the toolbar.
Customize toolbar
-
Customizes toolbar buttons.
Notes:
*1. This pane cannot be used when the linkage editor does not support overlay.
*2. The following debuggers support this facility.
- The Simulator Debugger for the SuperH Family
- The Simulator Debugger for the H8SX, H8S, H8 Family
- The Simulator Debugger for the RX Family
•
Section settings after a build (right pane)
Right-clicking displays a pop-up menu containing available options.
A basic operation is allocated to the toolbar.
The Toolbar display and Customize toolbar options are also included in the pop-up menu opened by right-clicking on
the toolbar.
Pop-up Menu Option
Toolbar Button
Function
Show Unallocated Area
Shows the unallocated area.
Show No Size Section
Shows the no size section.
View source
Views the source code for the address in the selected line.
Print
Prints section list view.
REJ10J2169-0100 Rev.1.00
Jul 01, 2010
Page 235 of 523
High-performance Embedded Workshop V.4.08
13.1.2
13. Map
Entering/exiting the edit mode
To edit the section information shown in the left pane, the High-performance Embedded Workshop must enter the edit
mode. By default, the edit mode is not selected.
To enter the edit mode
1.
Right-click within the left pane to open a pop-up menu.
2.
Select Section Edit Mode. This allows the High-performance Embedded Workshop to enter the edit mode.
3.
There is a tick mark on Section Edit Mode.
While the High-performance Embedded Workshop is in the edit mode, the options listed in the table below are available.
Right-click on an item in the left pane. The following options with “
Pop-up Menu Option
Toolbar
Button
“ in the table can be selected.
Item
Root
Address Section group Subsection group Overlay group Section
Add Section Group
Add Section
Add Overlay Group *1
*2
Section Auto Registration
Edit Selected Item
Cut
Copy
Paste
Delete
Move up
Move Down
Change Primary Section *1
Notes:
*1. This pane cannot be used when the linkage editor does not support overlay.
*2. Will be supported by the toolchains included in the compiler packages listed below.
- C/C++ Compiler Package for SuperH Family V.9.00 Release 04 or later
- C/C++ Compiler Package for H8SX, H8S, H8 Family V.6.01 Release 02 or later
- C/C++ Compiler Package for RX Family V.1.00 Release 00 or later
REJ10J2169-0100 Rev.1.00
Jul 01, 2010
Page 236 of 523
High-performance Embedded Workshop V.4.08
13. Map
To exit the edit mode
1.
Right-click within the left pane to open a pop-up menu.
2.
Select Section Edit Mode.
3.
The confirmation dialog box shown below opens. To reflect the changes to the section settings of the linkage
editor, select Yes.
4.
The High-performance Embedded Workshop exits the edit mode. The tick mark on Section Edit Mode has
disappeared.
13.1.3
Adding a section group
In the edit mode, you can add a section group.
To add a section group
1.
Right-click within the left pane to open a pop-up menu.
2.
Select Add Section Group.
3.
The Add Section Group dialog box appears.
4.
Enter the start address of a section in Section Start Address.
5.
Enter a section group name in Section Group Name. If you specify section names separated by a comma, each
of them will be added as a section. In the example above, “Section1” and “Section2” are added as sections.
REJ10J2169-0100 Rev.1.00
Jul 01, 2010
Page 237 of 523
High-performance Embedded Workshop V.4.08
13. Map
In the tree of the left pane, the new section group is added under the address.
13.1.4
Adding a section
In the edit mode, you can add a section under a section group, subsection group, or overlay group.
To add a section
1.
Right-click on a section group, subsection group, or overlay group to open a pop-up menu.
2.
Select Add Section.
3.
The Add Section dialog box appears.
4.
Enter a section name in Section Name.
In the tree of the left pane, the new section is added under the section group, subsection group, or overlay group.
13.1.5
Adding an overlay group
In the edit mode, you can add an overlay group *1 under a section group, subsection group, or section *2.
To add an overlay group
1.
Right-click on a section group, subsection group, or section to open a pop-up menu.
2.
Select Add Overlay Group.
3.
The Add Overlay Group dialog box appears.
REJ10J2169-0100 Rev.1.00
Jul 01, 2010
Page 238 of 523
High-performance Embedded Workshop V.4.08
4.
13. Map
Enter an overlay group name in Overlay Group Name.
In the tree of the left pane, the new overlay group is added under the section group, subsection group, or section.
Notes:
*1. This item cannot be used when the linkage editor does not support overlay.
*2. Will be supported by the toolchains included in the compiler packages listed below.
- C/C++ Compiler Package for SuperH Family V.9.00 Release 04 and later
- C/C++ Compiler Package for H8SX, H8S, H8 Family V.6.01 Release 02 and later
- C/C++ Compiler Package for RX Family V.1.00 Release 00 and later
13.1.6
Automatically registering the unregistered section
In the edit mode, if any of the sections listed in the right pane is missing in the left pane, this section can automatically be
added to the left pane.
To automatically add missing sections
•
1.
Right-click within the left pane to open a pop-up menu.
2.
Select Section Auto Registration.
If some sections are missing in the left pane and the right pane includes a section group whose address value is
smaller than the smallest address among the missing sections, all of these sections will be added to the last in the
section group.
REJ10J2169-0100 Rev.1.00
Jul 01, 2010
Page 239 of 523
High-performance Embedded Workshop V.4.08
•
13. Map
If some sections are missing in the left pane and none of the addresses of section groups listed in the right pane is
smaller than the smallest address among the missing sections, all of these sections will be added as a section group at
the smallest address among the missing sections.
Note:
If an overlay section is missing, this will be added as a normal section.
13.1.7
Editing a selected item
In the edit mode, you can also modify the address value and the name of a section group, subsection group, overlay
group, or section.
To modify the selected item
1.
Select either of the following operations:
•
Right-click on an item in the left pane to open a pop-up menu. Select Edit Selected Item, OR
•
Double-click to modify a value.
2.
The Edit Selected Item dialog box appears.
3.
Enter a string or integer value into an edit field.
13.1.8
Setting the primary section
In the edit mode, you can set a selected overlay group as the primary section.*
To set the primary section
1.
Right-click on an overlay group in the left pane to open a pop-up menu.
2.
Select Change Primary Section.
REJ10J2169-0100 Rev.1.00
Jul 01, 2010
Page 240 of 523
High-performance Embedded Workshop V.4.08
13. Map
In the tree of the left pane, the selected overlay group is set as the primary section.
Note:
*. This function cannot be used when the linkage editor does not support overlay.
13.1.9
Setting a memory map
While the High-performance Embedded Workshop is connected with a debugger, you can set a memory map.
To set a memory map
1.
Right-click within the left pane to open a pop-up menu.
2.
Select Memory Map Setting.
3.
The memory map setting dialog box opens. The current mapping of the address space is shown as a list. Set a
memory map or memory resource as necessary.
4.
Click the OK button.
Note:
The following debuggers support this facility.
- The Simulator Debugger for the SuperH Family
- The Simulator Debugger for the H8SX, H8S, H8 Family
- The Simulator Debugger for the RX Family
13.1.10 Automatically allocating the memory resource
When there is a linkage list file (.map) output by the linkage editor, the memory resource can be automatically allocated
according to the memory map and linkage map information. While the High-performance Embedded Workshop is
connected with a debugger, you can allocate a memory resource.
To automatically allocate the memory resource
1.
Right-click within the left pane to open a pop-up menu.
2.
Select Memory Resource Auto Allocate. The dialog box shown below appears.
REJ10J2169-0100 Rev.1.00
Jul 01, 2010
Page 241 of 523
High-performance Embedded Workshop V.4.08
3.
To continue processing, click OK.
4.
When allocation is completed, the dialog box shown below appears.
13. Map
Note:
The following debuggers support this facility.
- The Simulator Debugger for the SuperH Family
- The Simulator Debugger for the H8SX, H8S, H8 Family
- The Simulator Debugger for the RX Family
13.1.11 Printing out the section settings tree
You can also print out the section settings tree in the left pane.
To print out the section settings tree
1.
Right-click within the right pane to open a pop-up menu.
2.
Select Print.
3.
The standard print formatting and selection dialog box opens. From here you can choose your printer and page
setup options.
REJ10J2169-0100 Rev.1.00
Jul 01, 2010
Page 242 of 523
High-performance Embedded Workshop V.4.08
13. Map
13.1.12 Viewing unallocated areas
You can view areas where no section is allocated. By default, this function is not selected.
To view unallocated areas
1.
Right-click within the right pane to open a pop-up menu.
2.
Select Show Unallocated Area.
3.
There is a tick mark on Show Unallocated Area. The right pane shows all areas where no section is allocated,
which is indicated by “Unallocated Area” in the Name column.
13.1.13 Viewing sections of size 0
You can view sections of size 0. By default, this function is not selected.
To view sections of size 0
1.
Right-click within the right pane to open a pop-up menu.
2.
Select Show No Size Section.
3.
The right pane shows all sections of size 0. At this time, the “End Address” column does not show the end
addresses.
13.1.14 Viewing the source code for the address
The source file for the address in the selected line will be opened in the editor window.
To view the source code for the address
Select one of the following operations:
•
Right-click on the section-list line in the right pane to open a pop-up menu. Then select View Source, OR
•
Double-click on the section-list line in the right pane.
REJ10J2169-0100 Rev.1.00
Jul 01, 2010
Page 243 of 523
High-performance Embedded Workshop V.4.08
13. Map
13.1.15 Printing out the section list
You can also print out the section list in the right pane.
To print out the section list
1.
Right-click within the right pane to open a pop-up menu.
2.
Select Print.
3.
The standard print formatting and selection dialog box opens. From here you can choose your printer and page
setup options.
13.2
Viewing symbols
You can view symbols in each of the sections in the Map Symbol Information window.
Even if there are too many symbols, the search or filtering function can be used to view necessary information only.
13.2.1
Opening the Map Symbol Information window
To open the Map Symbol Information window
1.
Select one of the following operations to open the Select Map Window Type dialog box:
•
Select [View -> Map], OR
•
Click the Map toolbar button (
2.
Select "Map Symbol Information" in the Map drop-down list.
3.
Click OK.
REJ10J2169-0100 Rev.1.00
Jul 01, 2010
).
Page 244 of 523
High-performance Embedded Workshop V.4.08
13. Map
Window configuration
•
The left pane shows the map list of the linkage editor.
- Nothing is displayed in this pane if there is no linkage list file (.map) output by the linkage editor.
- Selecting the root of the map list ("Linker map list") shows all symbol information in the right pane.
- Selecting a section in the map list only shows symbol information of the selected section in the right pane.
•
The right pane shows the symbol information of the linkage editor.
- Clicking the column header sorts the listed items. When the window is first opened, the items are sorted by the value
of Start Address.
- The Attribute column shows the symbol attribute.
Entry:
Function:
Data:
None:
Entry function
Function name
Variable name
Undefined (label or assembly symbol)
- The Scope column shows the scope attribute.
Global:
Local:
REJ10J2169-0100 Rev.1.00
Jul 01, 2010
Global symbol
Local symbol
Page 245 of 523
High-performance Embedded Workshop V.4.08
13. Map
Window options
•
Map list of the linkage editor (left pane)
Right-clicking displays a pop-up menu containing available options.
A basic operation is allocated to the toolbar.
The Toolbar display and Customize toolbar options are also included in the pop-up menu opened by right-clicking on
the toolbar.
Pop-up Menu Option
Toolbar Button
Print
Function
Prints section tree view.
Toolbar display
-
Shows or hides the toolbar.
Customize toolbar
-
Customizes toolbar buttons.
•
Symbol information of the linkage editor (right pane)
Right-clicking displays a pop-up menu containing available options.
A basic operation is allocated to the toolbar.
The Toolbar display and Customize toolbar options are also included in the pop-up menu opened by right-clicking on
the toolbar.
Pop-up Menu Option
Toolbar Button
Function
Find
Finds a symbol.
Find Next
Finds the next symbol that matches the search text.
Filter
Filters the symbol information.
View source
Views the source code for the address in the selected line.
Print
Prints section list view.
13.2.2
Printing out the map list
You can also print out the map list in the left pane.
To print out the map list
1.
Right-click within the left pane to open a pop-up menu.
2.
Select Print.
3.
The standard print formatting and selection dialog box opens. From here you can choose your printer and page
setup options.
REJ10J2169-0100 Rev.1.00
Jul 01, 2010
Page 246 of 523
High-performance Embedded Workshop V.4.08
13.2.3
13. Map
Finding symbols
You can search for the linkage editor symbols.
To search for symbols
1.
Right-click within the right pane to open a pop-up menu.
2.
Select Find. The Find Symbol dialog box appears.
3.
Enter a symbol name you wish to find in Name, or select one from those you have previously searched for in the
drop-down list box.
4.
To distinguish uppercase and lowercase characters, select the Match case checkbox.
5.
To use wild-cards (? or *), select the Wild card checkbox.
6.
?:
A character
*:
A string
Click OK.
When a symbol is found, a line that contains the symbol is highlighted in the right pane.
To find the next occurrence of the symbol, select Find Next.
13.2.4
Filtering the symbol information
You can view the filtered symbol information of the linkage editor.
To filter the symbol information
1.
Right-click within the right pane to open a pop-up menu.
2.
Select Filter. The Filter Symbol dialog box appears.
REJ10J2169-0100 Rev.1.00
Jul 01, 2010
Page 247 of 523
High-performance Embedded Workshop V.4.08
13. Map
3.
Select the Enable Filter checkbox. By default, this checkbox is not selected.
4.
Select a column in Filter Column.
5.
Select a filtering condition in Filter Item.
Filter Column
Filter Item
Function
Attribute (symbol attribute)
Function
Filter by functions
Data
Filter by data symbols
Entry
Filter by positions to start execution
None
Filter by other symbols (such as labels)
Global
Filter by global symbols
Scope (scope attribute)
Normal
Filter by local symbols
Section (sections containing symbols)
Section name
Filter by section names
File (files containing symbols)
File name
Filter by file names
6.
Clicking the Set All button selects the check boxes of all filtering conditions.
7.
Clicking the Clear All button de-selects the check boxes of all filtering conditions.
8.
Click OK.
Symbol information of the linkage editor shown in the right pane is filtered by the selected condition. For further filtering
by combining a different condition, select another column and then select a filtering condition in the column.
To disable filtering, de-select the Enable Filter checkbox in the Filter Symbol dialog box.
REJ10J2169-0100 Rev.1.00
Jul 01, 2010
Page 248 of 523
High-performance Embedded Workshop V.4.08
13.2.5
13. Map
Viewing the source code for the address
The source file for the address in the selected line will be opened in the editor window.
To view the source code for the address
Select one of the following operations:
•
Right-click on the symbol-list line in the right pane to open a pop-up menu. Then select View Source, OR
•
Double-click on the symbol-list line in the right pane.
13.2.6
Printing out the symbol information
You can also print out the symbol information in the right pane.
To print out the symbol information
1.
Right-click within the right pane to open a pop-up menu.
2.
Select Print.
3.
The standard print formatting and selection dialog box opens. From here you can choose your printer and page
setup options.
REJ10J2169-0100 Rev.1.00
Jul 01, 2010
Page 249 of 523
High-performance Embedded Workshop V.4.08
14. Command Line
14. Command Line
The High-performance Embedded Workshop Command Line Interpreter allows the user to control the debugger by
sending text-based commands instead of the window menus and commands. It is especially useful if a series of
predefined commands need to be sent to the debugger by calling them from a batch file and, optionally, recording the
output in a log file.
Notes:
•
Specifying a file in the command line
To specify a file in the command line, use a placeholder (excluding TCL). If you wish to specify a directory not included
in the placeholder, specify an absolute path. After specifying the absolute path, this file will not be correctly found when
it is in another host computer or environment where the path content is different. In such cases, specify the file again.
FILE_LOAD ELF/DWARF2 $(CONFIGDIR)\\demo.abs
•
Separating command parameters
You can use TCL commands while TCL is enabled. The use of the TCL command batch, in which parameters are
separated by tabs, is also possible.
For
{set
puts
i
[memory_display
0}
{$i
<
300
10]
2}
{incr
i}
{
}
When TCL is disabled, TCL commands are not usable. Only white space can be used to separate parameters so using
tabs instead will cause the following error.
>TCL
TCL Disabled
>memory_display 300 10
Error: Invalid command
14.1
Opening the Command Line window
Choose [View -> Command Line] or click the Command Line toolbar button ( ) to open the Command Line window.
If available, the window title displays the current batch and log file names separated by colons.
The High-performance Embedded Workshop command and TCL commands can be input in this window. For
information about the available commands, see Reference 3, Commands, and the on-line help.
The Command Line window has two tabs: Console and Debugger.
REJ10J2169-0100 Rev.1.00
Jul 01, 2010
Page 250 of 523
High-performance Embedded Workshop V.4.08
14. Command Line
Window configuration
•
Console tab
This pane allows the user to input text-based commands to control the target platform. The results of command
execution shown on this pane are in synchronization with the lower pane of the Debugger tab.
•
o
The command can be executed by pressing the "Enter" key after the command is input at the prompt (>) on the
last line in the window.
o
Pressing the CTRL + UP ARROW or CTRL + DOWN ARROW keys on the last line in the window displays
the previously executed command line.
o
A series of command lines can be called from a batch file and the results can be output to a file. The contents of
the selected batch file are shown in the upper pane of the Debugger tab.
o
You can clear the information shown on this pane. The contents of the lower pane of the Debugger tab will also
be cleared.
Debugger tab
This pane allows the user to perform single stepping or set breakpoints in the selected batch file to control the
target platform.
When a batch file has been loaded, placing the mouse cursor on the line dividing the panes turns the mouse
cursor into a double-headed arrow. Click and drag the mouse cursor to a desired position to adjust the size of
the panes.
REJ10J2169-0100 Rev.1.00
Jul 01, 2010
Page 251 of 523
High-performance Embedded Workshop V.4.08
o
14. Command Line
Upper pane (contents of the batch file)
The upper pane shows the contents of the selected batch file and allows debugging. However, you cannot
modify data in this pane.
o
The contents of the selected batch file are displayed.
Single stepping of command lines can be performed in the selected batch file.
Execution can start from the top of the batch file.
A breakpoint ( ) can be set in the Breakpoint column on the left to the command line.
A yellow arrow (
The line where execution is to start (i.e. the yellow arrow (
file.
The results of command execution can be output to a file.
) in the Breakpoint column indicates the command line where execution is to start.
)) can be returned to the top of the batch
Lower pane (results of command execution)
The lower pane shows the results of command execution. This information is in synchronization with the
contents of the Console tabbed pane. However, you cannot modify data in this pane.
You can clear the information shown in this pane. The contents of the Console tabbed pane will also be
cleared.
REJ10J2169-0100 Rev.1.00
Jul 01, 2010
Page 252 of 523
High-performance Embedded Workshop V.4.08
14. Command Line
Options
•
Console tab
Right-clicking displays a pop-up menu containing available options.
A basic operation is allocated to the toolbar.
The Toolbar display and Customize toolbar options are also included in the pop-up menu opened by right-clicking on
the toolbar.
Pop-up Menu Option
Toolbar Button
Macro Recording
Function
Set Batch File
-
Specifies a batch file.
Play
-
Plays the current batch file.
Stop
-
Stops execution of the current batch file.
Set Log File
-
Specifies a log file.
Logging
-
Starts or stops output to log file.
Browse
-
Enters a full path to the file.
Placeholder Configuration
directory
-
Pastes the $(CONFIGDIR) placeholder.
Configuration
name
-
Pastes the $(CONFIGNAME) placeholder.
Project directory
-
Pastes the $(PROJDIR) placeholder
Project name
-
Pastes the $(PROJECTNAME) placeholder.
Workspace
directory
-
Pastes the $(WORKSPDIR) placeholder.
Workspace name
-
Pastes the $(WORKSPNAME) placeholder.
HEW Installation
directory
-
Pastes the $(HEWDIR) placeholder.
Select All
-
Selects (i.e. highlights) the entire contents of
the active window.
Copy
-
Places a copy of the highlighted text into the
Windows® clipboard.
Cut
-
Removes the selected text block and copy
them onto the Windows® clipboard.
Paste
-
Copies the contents of the Windows®
clipboard into the active window at the
position of the insertion cursor.
Clear Window
-
Clears the contents of the Command Line
window.
Undo
-
Undoes the last operation.
-
-
Once an opening bracket “[“ or “{“ is input
and the nesting follows, this button is visible.
(This button selection is impossible.)
Toolbar display
-
-
Shows or hides the toolbar.
Customize toolbar
-
-
Customizes toolbar buttons.
REJ10J2169-0100 Rev.1.00
Jul 01, 2010
Page 253 of 523
High-performance Embedded Workshop V.4.08
•
Debugger tab
o
Upper pane (contents of the batch file)
14. Command Line
Right-clicking displays a pop-up menu containing available options.
A basic operation is allocated to the toolbar.
The Toolbar display and Customize toolbar options are also included in the pop-up menu opened by right-clicking on
the toolbar.
Pop-up Menu Option
Toolbar Button Macro Recording Function
Set Batch File
-
Specifies a batch file.
Play
-
Plays the current batch file.
Stop
-
Stops execution of the current batch file.
-
Resets the status of a batch file.
-
Single-steps in a batch file.
Reset
-
Step
Insert/Remove
Breakpoint
-
-
Toggles a break point on the current line of a batch file.
Enable/Disable
Breakpoint
-
-
Enables or disables the current breakpoint on the
current line of a batch file.
Clear All Breakpoints
-
-
Removes all breakpoints of a batch file.
Set Log File
-
Specifies a log file.
Logging
-
Starts or stops output to log file.
Toolbar display
-
-
Shows or hides the toolbar.
Customize toolbar
-
-
Customizes toolbar buttons.
o
Lower pane (results of command execution)
Right-clicking displays a pop-up menu containing available options.
A basic operation is allocated to the toolbar.
The Toolbar display and Customize toolbar options are also included in the pop-up menu opened by right-clicking on
the toolbar.
Pop-up Menu Option
Toolbar Button Macro Recording Function
Clear Window
14.2
-
Clears the contents of the Command Line window.
Specifying a batch file
It is useful to use a batch file when a series of predefined command lines need to be executed. Create a batch file by a text
editor and write necessary command lines. The default extension of a batch file is .hdc.
Choose Set Batch File from the pop-up menu to open the Set Batch File dialog box, in which the name of a batch file
(*.hdc) can be specified. Clicking the OK button displays the specified batch file name as the window title. Clicking the
Cancel button closes the dialog box without modifying the setting.
REJ10J2169-0100 Rev.1.00
Jul 01, 2010
Page 254 of 523
High-performance Embedded Workshop V.4.08
14. Command Line
After a batch file has been specified, the upper pane of the Debugger tabbed pane in the Command Line window shows
the contents of the batch file. When saving the session, the batch file name will also be saved.
Notes:
•
•
The batch file is automatically closed if any of the GUI features or command listed below is run. The information
shown in the upper pane of the Debugger tabbed pane is cleared.
o
Closing a workspace (CLOSE_WORKSPACE)
o
Creating a new workspace
o
Inserting a project into the workspace
o
Adding a session
If you modify the contents of the batch file after it has been specified, the information shown in the upper pane of the
Debugger tabbed pane in the Command Line window will be updated. The status of the batch file will be reset, with
all breakpoints deleted.
If you modify the contents after the batch file has been specified, the High-performance Embedded Workshop shows a
message telling that the batch file will be loaded again.
If you do not wish to open this confirmation dialog box, select the Don't ask this question again checkbox.
To open the confirmation dialog box again
1.
Select [Setup -> Options]. The Options dialog box opens
2.
Select the Confirmation tab.
3.
Select the Auto-reload Batch File checkbox. This checkbox is selected by default.
4.
Click OK.
REJ10J2169-0100 Rev.1.00
Jul 01, 2010
Page 255 of 523
High-performance Embedded Workshop V.4.08
14.3
14. Command Line
Executing a batch file
Click the Play button in the Set Batch File dialog box or choose Play from the pop-up menu to execute the batch file.
The Play menu is displayed in gray while the file is running and can be used when the batch file execution stops and
control returns to the user.
The message box shown below appears when a user attempts to close the Command Line window during execution of a
command file.
To terminate the execution of the batch file and close the Command Line window, click OK. To continue the execution,
click Cancel. This does not close the Command Line window.
14.4
Stopping command execution
Choose Stop from the pop-up menu to stop command execution. The Stop menu becomes valid during command
execution.
14.5
Specifying a log file
Choose Set Log File from the pop-up menu to open the Open Log File dialog box, in which a log file to store the
command execution results can be specified.
Enter the name of a log file (*.log). The logging option is automatically set and the name of the file is shown on the
window title bar.
Opening a previous log file will ask the user if they wish to append or overwrite the current log.
REJ10J2169-0100 Rev.1.00
Jul 01, 2010
Page 256 of 523
High-performance Embedded Workshop V.4.08
14.6
14. Command Line
Starting or stopping logging
Choose Logging from the pop-up menu to toggle logging to file on and off. When logging is active, the button becomes
effective. Note that the contents of the log file cannot be viewed until logging is completed, or temporarily disabled by
clearing the check box. Re-enabling logging will append to the log file.
14.7
Entering a full path to the file
It is recommended that the full path to a file is specified as a file name in the Command Line window because the current
directory can be moved. However, care must be taken to enter the correct full path to a file when it is entered from the
keyboard. To save this trouble, a full path can be easily specified by browsing through files.
Choose Browse from the pop-up menu to open the Browse dialog box. Select a file and click Open to paste the full path
to the selected file to the cursor location. This option can only be used when the cursor is located on the last line.
14.8
Pasting a placeholder
Select a placeholder from the Placeholder submenu in the pop-up menu to paste the selected placeholder to the cursor
location. This function is only available when the cursor is located on the last line.
Placeholder sub-menu
Placeholder
Configuration directory
$(CONFIGDIR)
Configuration name
$(CONFIGNAME)
Project directory
$(PROJDIR)
Project name
$(PROJECTNAME)
Workspace directory
$(WORKSPDIR)
Workspace name
$(WORKSPNAME)
HEW Installation directory
$(HEWDIR)
14.9
Selecting all the window contents
Choose Select All from the pop-up menu to select all contents in the Command Line window.
14.10 Copying the selection onto the clipboard
Choose Copy from the pop-up menu to copy the selected text block onto the Windows® clipboard. Only available if the
test block is selected.
14.11 Cutting out the selection to the clipboard
Choose Cut from the pop-up menu to remove the selected text block and copy them onto the Windows® clipboard. This
option is available only when you have selected the text block currently being input at the latest cursor position.
REJ10J2169-0100 Rev.1.00
Jul 01, 2010
Page 257 of 523
High-performance Embedded Workshop V.4.08
14. Command Line
14.12 Pasting the contents of the clipboard
Choose Paste from the pop-up menu to insert the content of the Windows® clipboard at the current cursor position. This
option can only be used when the cursor is at the last line.
14.13 Clearing the contents of the Command Line window
Selecting Clear window from the pop-up menu of the Command Line window clears all of the information shown in the
Console tabbed pane and in the upper pane of the Debugger tabbed pane of the Command Line window.
14.14 Undoing the last operation
Choose Undo from the pop-up menu to undo the last operation at the latest cursor position (on the text currently being
input).
14.15 Checking brace matching
While the Brackets Opened Indicator toolbar button (
cannot be operated.
) is displayed, users can see if brackets match. The button
Once an opening bracket “[“ or “{“ is input and the nesting follows, the Brackets Opened Indicator toolbar button is
visible ( ) until “]” or “}” is input as the closing bracket.
Example of a TCL Function Input in the State
Command Line Window
>set bit 1
None
1
None
>set value 1
None
1
None
>set r 1
None
1
None
>if {$bit & $value} {
Opening brace is input
> set r 0$r
None
>} else {
Opening and closing braces are input
>
None
set r 1$r
>}
Closing brace is input
>
01
None
REJ10J2169-0100 Rev.1.00
Jul 01, 2010
Toolbar Button is Visible
Page 258 of 523
High-performance Embedded Workshop V.4.08
14. Command Line
14.16 Resetting the status of a batch file
The status of a batch file can be reset on the Debugger tabbed pane of the Command Line window. This feature is not
available when no batch file has been specified.
A reset involves the following operations:
•
The yellow arrow returns to the top of the batch file.
•
The command interactive mode is exit.
•
If a closing parenthesis is missing, it will automatically be entered.
To reset the status of a batch file
1.
Open the Debugger tabbed pane of the Command Line window.
2.
Right-click on the upper pane to open the pop-up menu.
3.
Select Reset.
Notes:
•
•
Information such as the name of the batch file and breakpoints in the batch file is saved in the session. If you change
the session on the Debugger tabbed pane of the Command Line window, the pane now shows the contents of the
batch file specified for the current session. The status of the batch file is also automatically reset even in cases where
the batch file includes any of the following commands.
o
Setting the current project (CHANGE_PROJECT)
o
Selecting a session (CHANGE_SESSION)
If you change the configuration, the status of the batch file is also automatically reset even in cases where the batch
file includes the following command.
o
Selecting a build configuration (CHANGE_CONFIGURATION)
14.17 Single-stepping in a batch file
Single-stepping of command lines starting from the top of the batch file is possible on the Debugger tabbed pane of the
Command Line window. This feature is not available when no batch file has been specified.
REJ10J2169-0100 Rev.1.00
Jul 01, 2010
Page 259 of 523
High-performance Embedded Workshop V.4.08
14. Command Line
To single-step in a batch file
1.
Open the Debugger tabbed pane of the Command Line window.
2.
Perform one of the following operations in the upper pane.
•
Click on the Step toolbar button (
•
Right-click within the pane to open the pop-up menu and select Step.
•
With a focus in the pane, press the "Ctrl+F10" keys.
).
The yellow arrow ( ) moves to the next command line. If some errors have occurred, however, the arrow does
not move to the next line.
Note:
If the batch file includes the commands listed below, debugging of the batch file on the Debugger tabbed pane of the
Command Line window cannot proceed. Instead, use the Console tabbed pane of the Command Line window to execute
the batch file.
•
CLOSE_WORKSPACE
When a command is run, the batch file will be closed.
•
CHANGE_PROJECT or CHANGE_SESSION
When a command is run, the contents of the batch file specified for the current session will be shown in the
pane.
•
CHANGE_CONFIGURATION
When a command is run, the status of the batch file will automatically be reset.
REJ10J2169-0100 Rev.1.00
Jul 01, 2010
Page 260 of 523
High-performance Embedded Workshop V.4.08
14. Command Line
14.18 Setting a breakpoint in a batch file
Breakpoints can be set on command lines in a batch file on the Debugger tabbed pane of the Command Line window.
This feature is not available when no batch file has been specified.
To set a breakpoint in a batch file
1.
Open the Debugger tabbed pane of the Command Line window.
2.
Perform one of the following operations in the upper pane.
•
Double-click on the Breakpoint column for the line where the execution should stop.
•
Place the cursor on the line where the execution should stop. Then right-click to open the pop-up menu and
select Insert/remove breakpoint.
A breakpoint icon ( ) appears on the Breakpoint column. This indicates that a breakpoint has been set.
3.
To switch enabling and disabling of the breakpoint that has been set, right-click and select Enable/disable
breakpoint from the pop-up menu.
4.
To delete the breakpoint, right-click and select Insert/remove breakpoint, or double-click on the column.
5.
To delete all breakpoints, right-click and select Clear all breakpoints from the pop-up menu.
Execute the batch file with the Debugger tabbed pane open in the Command Line window. At a break, the execution
stops before the command line where the breakpoint has been set. If you select Step or Play after the break, the execution
restarts at the command line indicated by the yellow arrow ( ). Up to 256 breakpoints can be set. When saving the
session, all breakpoints that have been set are also saved.
Notes:
•
No break occurs if the batch file has been executed with the Console tabbed pane open in the Command Line
window.
•
If you modify the contents of the batch file after it has been specified, the information shown in the upper pane of the
Debugger tabbed pane in the Command Line window will be updated. The status of the batch file will be reset, with
all breakpoints deleted.
REJ10J2169-0100 Rev.1.00
Jul 01, 2010
Page 261 of 523
High-performance Embedded Workshop V.4.08
15. Macro-Recording Support Facility
15. Macro-Recording Support Facility
The macro-recording support facility allows you to record operations, which are associated with the High-performance
Embedded Workshop system applications *1, build *2, and debugging *3, as High-performance Embedded Workshop
command-line commands or to execute these recorded commands.
Files to record the operations (High-performance Embedded Workshop macro files) are command line batch files that
have “hdc” as the extension and can be modified. These files are stored in the “Macros” folder within the Highperformance Embedded Workshop management information folder under the application data folder for each user
profile. By default, the file Default.hdc is created.
Note, however, that High-performance Embedded Workshop is not capable of recording all operations in the Highperformance Embedded Workshop system corresponding to the High-performance Embedded Workshop command-line
commands. For the operations that can be recorded, a macro record icon ( ) is shown in the "Macro Recording" column
of the menu list. This indicates that this operation can be recorded into a High-performance Embedded Workshop macro
file.
Notes:
*1. Changing a project, session, or configuration
*2. Compilation and build.
*3. Downloading a module, changing a memory value or register value, setting/deleting a software breakpoint, and
running a program
The macro-recording support facility is available in the Tools menu and on the Macros toolbar.
The procedure from selection of Record Macro ( ) to that of Stop Macro consists one macro and one High-performance
Embedded Workshop macro file can record multiple macros (a set of High-performance Embedded Workshop
command-line commands). A macro includes multiple High-performance Embedded Workshop command-line
commands.
15.1
Macro menu and toolbar
The macro recorder has both a menu and toolbar integrated into the High-performance Embedded Workshop.
The macro menu is available on the Tools menu. It has the following standard menu options:
The Macros menu option opens the Macro dialog box. This allows management of the current macro files and functions.
The other menus options are the same as those seen on the Macros toolbar.
REJ10J2169-0100 Rev.1.00
Jul 01, 2010
Page 262 of 523
High-performance Embedded Workshop V.4.08
15. Macro-Recording Support Facility
It is also possible to associate macro functions with a menu, when you do this additional menu options are added
underneath the standard macro menu options. This is shown below.
Items that also have an associated toolbar have their icons displayed alongside the menu options.
The standard buttons on the Macros toolbar are shown below.
•
The Record Macro button starts the macro recording process. After this button is clicked debugging and Highperformance Embedded Workshop management operations are recorded. This operation is the same as the
Record macro menu on the Tools menu.
•
The Play Macro button starts a macro function playback. If more than one macro is defined, the select macro
function dialog is displayed to ask you to select specific macro for playback.
•
The Pause Macro button is only enabled when recording or playing back a macro function. This pauses the
current operation so that you can return to it later.
•
The Stop Macro button is only enabled when recording or playing back a macro function. This halts the current
macro operation that is being carried out.
In the same way you can associate macros with a menu you can associate them with a toolbar. When you associate the
macro you can decide to use a user defined toolbar icon or the default High-performance Embedded Workshop macro
function icon. Once added the associated macros appear to the right of the standard macro buttons. Clicking these
buttons then automatically launches the associated macro function.
REJ10J2169-0100 Rev.1.00
Jul 01, 2010
Page 263 of 523
High-performance Embedded Workshop V.4.08
15.2
15. Macro-Recording Support Facility
Using the Macro dialog box
The Macro dialog box allows you to access and manager the macro files currently in use in the High-performance
Embedded Workshop system. The Macro dialog box is shown below.
The Current macro file drop-down list holds all of the macro files currently in use in the High-performance Embedded
Workshop system. These files are stored in the “Macros” folder within the High-performance Embedded Workshop
management information folder under the application data folder for each user profile. Any files that are copied into this
directory are automatically added to the Current macro file drop-down list.
The macros functions in the Current macro file selection are shown in the Macro functions list box. Changing the
Current macro file selection will automatically update this list. If you check the Show all available macro functions
check box then all macros currently defined are displayed in the list. When selected this option ignores the value of the
Current macro file drop-down list box.
It can be useful to use multiple macro files to logically hold related areas. For example you might like to create a
different macro file for use with different debugger targets.
To execute macro files that have relative paths, specify the initial directory in Initial directory. Change the directory in
the same way as using the change-directory command and execute macro files in the initial directory.
To create a new blank macro file
1.
Select [Tools -> Macros]. The Macro dialog box opens.
2.
Click the New button.
REJ10J2169-0100 Rev.1.00
Jul 01, 2010
Page 264 of 523
High-performance Embedded Workshop V.4.08
15. Macro-Recording Support Facility
3.
Enter the new macro file name.
4.
Click OK. The new file name is added to the Current macro file drop-down list.
To import an existing macro file
1.
Select [Tools -> Macros]. The Macro dialog box opens.
2.
Click the Import button.
3.
Browse to the existing macro file.
4.
Click Select. The new file name is added to the Current macro file drop-down list.
5.
When you select the macro file name in the list the available macros are displayed.
It is possible to manually edit any of the macro files. The files are text based High-performance Embedded Workshop
command batch files.
To edit an existing macro file
1.
Select [Tools -> Macros]. The Macro dialog box opens.
2.
Select the macro file, the function exists in.
3.
Select the macro in the function list you wish to edit.
4.
Click the Edit button.
5.
The Macros dialog box is dismissed and the file is opened in the editor.
You can also drag and drop a macro file into the High-performance Embedded Workshop window to open this file (in the
same way as opening an ordinary text file).
To remove the currently selected macro from the existing macro file
1.
Select [Tools -> Macros]. The Macro dialog box opens.
2.
Select the macro file, the function exists in.
3.
Select the macro in the function list you wish to remove.
4.
Click the Remove button.
Pressing the Close button closes the Macro dialog box. It is not possible to cancel operations on this dialog box.
REJ10J2169-0100 Rev.1.00
Jul 01, 2010
Page 265 of 523
High-performance Embedded Workshop V.4.08
15.3
15. Macro-Recording Support Facility
Importing a macro file with existing macros
If you want to import an existing High-performance Embedded Workshop macro file from another machine which
already has a number of macros this is easily achieved by the following operations.
One method for importing macro files is from the macro dialog. The instructions are shown below:
To import an existing macro file into High-performance Embedded Workshop
1.
Select [Tools -> Macros]. The Macro dialog box opens.
2.
Click the Import button. A standard file browser is opened for you to select the existing macro file you wish to
import.
3.
Select the file and click Select. The file is now imported. It automatically becomes the default macro file in the
Current macro file drop-down list. The file is also copied into the "Macros" folder within the High-performance
Embedded Workshop management information folder under the application data folder for each user profile.
4.
Then click Close on the Macro dialog box and the macro file is ready for use.
Another method is to simply copy the new macro file into the Macros folder in the High-performance Embedded
Workshop root directory. High-performance Embedded Workshop will automatically detect the new file and add its
information to the High-performance Embedded Workshop macros dialog box. The new file will not be the default file
for use so you will then have to enter the macro dialog box to switch the default macro file to the newly copied one.
15.4
Recording a macro
There are a number of ways to record a macro file in the High-performance Embedded Workshop, these options are
discussed below.
To record a macro from the toolbar or menu
1.
Click the Record Macro button ( ) or menu option on the Macros toolbar or the Tools menu. To indicate that
a recording operation is taking place the mouse cursor is modified to include the record icon ( ). When the
macro is being recorded the Pause Macro ( ) and Stop Macro ( ) buttons and menus are enabled. When the
macro is being recorded the pause and stop buttons ( ) and menus are enabled.
2.
If you are using a debugger that does not support the macro facility a warning is displayed that states the
following "Warning: The target does not support macros. Recording will be limited. Do you wish to
continue?". If you click yes the record operation will continue.
3.
Recording will continue until you click Stop Macro. For details, see section 15.5, Functions that can be
recorded into macro files.
4.
When Stop Macro is clicked a dialog is displayed that allows you to enter the macro name.
REJ10J2169-0100 Rev.1.00
Jul 01, 2010
Page 266 of 523
High-performance Embedded Workshop V.4.08
5.
15. Macro-Recording Support Facility
Clicking OK saves the name and adds it to the current macro file. Clicking cancel dismisses the dialog box and
loses the macro recording.
Another method is to launch the recording process via the Macro dialog box.
To record a macro from the macro dialog box
1.
Select [Tools -> Macros]. The Macro dialog box opens.
2.
Click the Record button. The Macro dialog box is dismissed and the recording operation begins.
15.5
Functions that can be recorded into macro files
High-performance Embedded Workshop is not capable of recording all operations in the High-performance Embedded
Workshop system into macro files as scripts. For the operations that can be recorded, “Record Macro” in the menu list
shows a macro record icon. This indicates that the operation can be recorded into a macro file.
•
Recordable functions (common to all High-performance Embedded Workshop products)
•
Recordable functions (dependent on the debugger)
15.5.1
Recordable functions (common to all High-performance Embedded Workshop products)
Recordable functions common to all High-performance Embedded Workshop products included in tool packages are
listed in the table below.
•
Handling menu options, shortcut keys, and toolbar buttons
While a macro is being recorded, if you handle a menu option, shortcut key, or toolbar button of those listed below or
make any setting in a dialog box opened, these operations will be recorded into a macro file.
Menu
Menu Option
Shortcut Key
Toolbar Button
File
Open Workspace
-
-
Save Workspace
-
-
Close Workspace
-
-
New Session
-
-
Import Session
-
-
Save Session
-
-
Refresh Session
-
-
Download A New Module *2
-
-
Recent Workspaces
-
-
Recent Downloaded Modules
-
-
REJ10J2169-0100 Rev.1.00
Jul 01, 2010
Page 267 of 523
High-performance Embedded Workshop V.4.08
15. Macro-Recording Support Facility
Menu
Menu Option
Shortcut Key
Edit
Toggle Breakpoint
F9
Enable/Disable Breakpoint
CTRL+F9
Set Current Project
-
-
Insert Project
-
-
Edit Project Configuration *3
-
-
Build File
CTRL+F7
Build
F7
Build All
-
Build Multiple
-
-
Clean Current Project
-
-
Clean All Project
-
-
Build Configurations *4
-
Debug Sessions *5
-
Reset CPU
-
Go
F5
Reset Go
SHIFT+F5
Free Go *3
-
Go to Cursor
-
Set PC to Cursor
-
Run
-
Step In
F11
Step Over
F10
Step Out
SHIFT+F11
Step
-
-
Auto
-
-
Assembly
-
-
Source
-
-
Project
Build *1
Debug
Step Mode
Setup
Toolbar Button
-
Halt Program
-
Initialize
-
Connect *3
-
Disconnect *3
-
Save Memory
-
-
Verify Memory *3
-
-
-
Download
Modules
<File name of the download module>
-
-
All Download Modules
-
-
Unload Modules
<File name of the download module>
-
-
All Downloaded Modules
-
-
Hex
-
Decimal
-
Oct
-
Bin
-
Radix
REJ10J2169-0100 Rev.1.00
Jul 01, 2010
Page 268 of 523
High-performance Embedded Workshop V.4.08
15. Macro-Recording Support Facility
Notes:
*1. This menu is not displayed while a debug-only project "Debugger only - xxxxxx" created by High-performance
Embedded Workshop V.4.01 or later is in use.
*2. Only options Offset, File format, Filename, Access size, and Perform memory verify during download can be
recorded; Download debug information only and Download automatically on target connection are not
recordable.
*3. Support for this function depends on the debugger.
*4. Selections made from the Current configuration drop-down list can be recorded.
*5. Selections made from the Current session drop-down list can be recorded.
•
Windows
While a macro is being recorded, operations made in the windows listed below will be recorded into a macro file. For
information on the types of recordable operations, see the descriptions of the respective windows.
Window Name
Opened by
Projects tab of the Workspace window
[View -> Workspace]
Editor
Double-clicking on a file in the Projects tab of the workspace window
Disassembly
[View -> Disassembly]
Register
[View -> CPU -> Registers]
Memory
[View -> CPU -> Memory]
IO
[View -> CPU -> IO]
15.5.1.1 Projects tab of Workspace window
While a macro is being recorded, the following operations will be recorded into a macro file.
Target
Operation
Function
Workspace
Clean All Projects pop-up Click on the menu option
menu option *1
Deletes intermediate and output
files from configurations in all
projects in this workspace.
Builds out of date project files.
Project
Build pop-up menu option
*1
Build All pop-up menu
option *1
Builds project files, regardless of
whether the project files are out
of date.
Clean Current Project
pop-up menu option *1
Deletes intermediate and output
files from the current
configuration in this project.
Set as Current Project
pop-up menu option
Sets this project as the current
project.
REJ10J2169-0100 Rev.1.00
Jul 01, 2010
Page 269 of 523
High-performance Embedded Workshop V.4.08
Target
Project file
Download
modules folder
15. Macro-Recording Support Facility
Operation
Function
Build <File name> pop-up
menu option *1
Builds a file.
Download all module
pop-up menu option
Loads all object (program) files.
Download A New Module Make setting in the dialog box opened Loads an object (program) file.
pop-up menu option
by clicking on the menu option *2
-
Double-click on a download module
Download module Download module pop-up Click on the menu option
menu option
Download module (debug
data only) pop-up menu
option
Unload module pop-up
menu option
Unloads an object (program) file
from memory.
Download A New Module Make setting in the dialog box opened Loads an object (program) file.
pop-up menu option
by clicking on the menu option *2
Notes:
*1. Available only when there is a toolchain installed.
*2. Only options Offset, File format, Filename, Access size, and Perform memory verify during download can be
recorded; Download debug information only and Download automatically on target connection are not
recordable.
15.5.1.2 Editor window
While a macro is being recorded, the following operations will be recorded into a macro file.
Display Mode
Target
Operation
Function
Source mode
Build "<File name>" pop-up menu
option
Click on the
menu option
Builds the selected file.
Mixed/disassembly
mode
Toggle Breakpoint pop-up menu
option
Sets or clears a software breakpoint.
Enable/Disable Breakpoint pop-up
menu option
Enables or disables the current software
breakpoint.
Go To Cursor pop-up menu option
Runs program until the PC reaches cursor.
Set PC Here pop-up menu option
Sets PC to the address at cursor.
S/W Breakpoints column
Double-click on Sets or clears a software breakpoint.
the column
Go To Cursor pop-up menu option
Click on the
menu option
Set PC Here pop-up menu option
Enables or disables the current software
breakpoint.
Toggle Breakpoint pop-up menu
option
Runs program until the PC reaches cursor.
Enable/Disable Breakpoint pop-up
menu option
Sets PC to the address at cursor.
REJ10J2169-0100 Rev.1.00
Jul 01, 2010
Sets or clears a software breakpoint.
Page 270 of 523
High-performance Embedded Workshop V.4.08
Display Mode
15. Macro-Recording Support Facility
Target
Operation
Function
S/W Breakpoints column
Double-click on Sets or clears a software breakpoint.
the column
15.5.1.3 Disassembly window
While a macro is being recorded, the following operations will be recorded into a macro file.
Display Mode
Target
Operation
Function
Source mode
Toggle Breakpoint pop-up menu
option
Click on the
menu option
Sets or clears a software breakpoint.
Enable/Disable Breakpoint pop-up
menu option
Enables or disables the current software
breakpoint.
Go To Cursor pop-up menu option
Runs program until the PC reaches cursor.
Set PC Here pop-up menu option
Sets PC to the address at cursor.
S/W Breakpoints column
Double-click Sets or clears a software breakpoint.
on the column
Mixed/disassembly Go To Cursor pop-up menu option
mode
Set PC Here pop-up menu option
Click on the
menu option
Sets or clears a software breakpoint.
Enables or disables the current software
breakpoint.
Toggle Breakpoint pop-up menu
option
Runs program until the PC reaches cursor.
Enable/Disable Breakpoint pop-up
menu option
Sets PC to the address at cursor.
S/W Breakpoints column
Double-click Sets or clears a software breakpoint.
on the column
15.5.1.4 Register window
While a macro is being recorded, the following operations will be recorded into a macro file.
Target
Operation
Function
Edit pop-up menu option
Make setting in the dialog box opened by clicking on the menu option
Flag register *
Click on the flag register
Changes a register's
content.
Value
In-place edit
Make setting in a dialog box opened by double-clicking a value
Note:
*. Support for this function depends on the debugger.
15.5.1.5 Memory window
While a macro is being recorded, the following operations will be recorded into a macro file.
Target
Operation
Set Pop-up menu option/toolbar button
Make setting in the dialog box opened Modifies memory contents.
by clicking on the menu option or
Fills a block of memory.
toolbar button
Moves a block of memory.
Fill Pop-up menu option/toolbar button
Move Pop-up menu option/toolbar button
REJ10J2169-0100 Rev.1.00
Jul 01, 2010
Function
Page 271 of 523
High-performance Embedded Workshop V.4.08
Target
15. Macro-Recording Support Facility
Operation
Function
Compare Pop-up menu option/toolbar button *
Compares memory contents.
Save Pop-up menu option/toolbar button
Saves memory to a file.
Load Pop-up menu option/toolbar button
Loads a memory area contents
from a file.
Value
In-place edit
Modifies memory contents.
Make setting in the dialog box opened
by double-clicking a value
Note:
*. Support for this function depends on the debugger.
15.5.1.6 IO window
While a macro is being recorded, the following operations will be recorded into a macro file.
Target
Operation
Function
Value
In-place edit
Modifies the I/O register contents.
Make setting in the dialog box opened by double-clicking a value
15.5.2
Recordable functions (dependent on the debugger)
Recordable functions dependent on the debugger included in tool packages are listed in the table below.
•
•
•
•
H8S/Tiny E8a Emulator Debugger
H8 Tiny/Super Low Power E8a Emulator Debugger
H8 Tiny/Super Low Power E8 Emulator Debugger
E10A-USB Emulator Software (H8SX Device Group)
All debugging functions can be recorded into a macro file.
• R8C/Tiny E8 Emulator Debugger
• M16C/Tiny, M16C/62P E8 Emulator Debugger
• M32C/80 E8 Emulator Debugger
While a macro is being recorded, operations made in the windows listed below will be recorded into a macro file. For
information on the types of recordable operations, see the descriptions of the window.
Window Name
Opened by
Editor
Double-clicking on a file in the Projects tab of the workspace window
Disassembly
[View -> Disassembly]
Label
[View -> Symbol -> Label]
Watch
[View -> Symbol -> Watch]
Locals
[View -> Symbol -> Locals]
Event
[View -> Code -> Eventpoints]
REJ10J2169-0100 Rev.1.00
Jul 01, 2010
Page 272 of 523
High-performance Embedded Workshop V.4.08
15. Macro-Recording Support Facility
• E10A-USB Emulator Software (other than the H8SX device group)
• E6000 Emulator Software
• E6000H Emulator Software
While a macro is being recorded, operations made in the windows listed below will be recorded into a macro file. For
information on the types of recordable operations, see the descriptions of the window.
Window Name
Opened by
Editor
Double-clicking on a file in the Projects tab of the workspace window
Disassembly
[View -> Disassembly]
Label
[View -> Symbol -> Label]
Watch
[View -> Symbol -> Watch]
Locals
[View -> Symbol -> Locals]
• E100 Emulator Software
While a macro is being recorded, if you handle a menu option, shortcut key, or toolbar button of those listed below,
these operations will be recorded into a macro file.
Menu
Menu Option
Debug
RTOS Debug
Shortcut Key
Go To Cursor
-
Step In
Alt+F11
Step Over
Alt+F10
Step Out
Shift+Alf+F11
Toolbar Button
While a macro is being recorded, operations made in the window or dialog box listed below will be recorded into a
macro file. For information on the types of recordable operations, see the descriptions of the window or dialog box.
Window/Dialog Box Name
Opened by
Editor
Double-clicking on a file in the Projects tab of the workspace window
Disassembly
[View -> Disassembly]
Label
[View -> Symbol -> Label]
Watch
[View -> Symbol -> Watch]
Locals
[View -> Symbol -> Locals]
Code Coverage
[View -> Code -> Code Coverage]
Data Coverage
[View -> Code -> Data Coverage]
Hardware Break
[View -> Event -> Hardware Break]
Trace conditions
[View -> Event -> Trace Conditions]
Performance Analysis Conditions
[View -> Event -> Performance Analysis Conditions]
Trigger Output Conditions
[View -> Event -> Trigger Output Conditions]
Realtime Profile
[View -> Performance -> Realtime Profile]
Configuration properties
[Setup -> Emulator -> System]
Device Setting
[Setup -> Emulator -> Device Setting]
Start/Stop Function Setting
[Setup -> Emulator -> Start Stop Function Setting]
REJ10J2169-0100 Rev.1.00
Jul 01, 2010
Page 273 of 523
High-performance Embedded Workshop V.4.08
•
•
•
•
•
•
•
•
15. Macro-Recording Support Facility
M32C PC7501 Emulator Debugger
M16C R8C PC7501 Emulator Debugger
M32C PC4701 Emulator Debugger
M16C R8C PC4701 Emulator Debugger
M32C Compact Emulator Debugger
M16C R8C Compact Emulator Debugger
M32C FoUSB/UART Debugger
M16C R8C FoUSB/UART Debugger
While a macro is being recorded, operations made in the windows listed below will be recorded into a macro file. For
information on the types of recordable operations, see the descriptions of the window.
Window Name
Opened by
ASMWatch
[View -> Symbol -> ASMWatch]
CWatch
[View -> Symbol -> CWatch]
S/W Break Points
[View -> Break -> S/W Break Points]
Address Interrupt Break Points
[View -> Break -> Address Interrupt Break Points]
• E200F Emulator Software
While a macro is being recorded, operations made in the window or dialog box listed below will be recorded into a
macro file. For information on the types of recordable operations, see the descriptions of the window or dialog box.
Window/Dialog Box Name
Opened by
Editor
Double-clicking on a file in the Projects tab of the workspace window
Disassembly
[View -> Disassembly]
Label
[View -> Symbol -> Label]
Watch
[View -> Symbol -> Watch]
Locals
[View -> Symbol -> Locals]
Trace
[View -> Code -> Trace]
Event
[View -> Code -> Eventpoints]
Realtime Profile
[View -> Performance -> Realtime Profile]
Configuration
[Setup -> Emulator -> System]
• M32C Simulator Debugger
• M16C R8C Simulator Debugger
While a macro is being recorded, operations made in the windows listed below will be recorded into a macro file. For
information on the types of recordable operations, see the descriptions of the window.
Window Name
Opened by
ASMWatch
[View -> Symbol -> ASMWatch]
CWatch
[View -> Symbol -> CWatch]
S/W Break Points
[View -> Break -> S/W Break Points]
• Simulator Debugger for SuperH Family
• Simulator Debugger for H8SX, H8S, H8 Family
• Simulator Debugger for RX Family
While a macro is being recorded, operations made in the windows listed below will be recorded into a macro file. For
information on the types of recordable operations, see the descriptions of the window.
REJ10J2169-0100 Rev.1.00
Jul 01, 2010
Page 274 of 523
High-performance Embedded Workshop V.4.08
15. Macro-Recording Support Facility
Window Name
Opened by
Editor
Double-clicking on a file in the Projects tab of the workspace window
Disassembly
[View -> Disassembly]
Label
[View -> Symbol -> Label]
Watch
[View -> Symbol -> Watch]
Locals
[View -> Symbol -> Locals]
Coverage
[View -> Code -> Coverage]
Trace
[View -> Code -> Trace]
Event
[View -> Code -> Eventpoints]
Simulated I/O
[View -> CPU -> Simulated I/O]
Support of this function depends on the debugger in use. For details, refer to the user’s manual, help files, or the release
notes for the emulator or the simulator debugger.
15.5.2.1 Editor window
While a macro is being recorded, the following operation will be recorded into a macro file.
Display Mode
Target
Operation
Function
Source mode
Instant Watch pop-up menu
option
Make setting in the dialog box opened by
clicking on the menu option
Adds a symbol.
•
E8 emulator software
Target
Operation
Function
Event Breakpoints column
Double-click on the column
Sets or clears a hardware breakpoint.
15.5.2.2 Disassembly window
While a macro is being recorded, the following operation will be recorded into a macro file.
Display Mode
Target
Operation
Function
Source mode
Instant Watch pop-up menu
option
Make setting in the dialog box opened by
clicking on the menu option
Adds a symbol.
•
E8 emulator software
Target
Operation
Function
Event Breakpoints column
Double-click on the column
Sets or clears a hardware breakpoint.
REJ10J2169-0100 Rev.1.00
Jul 01, 2010
Page 275 of 523
High-performance Embedded Workshop V.4.08
15. Macro-Recording Support Facility
15.5.2.3 Label window
While a macro is being recorded, the following operations will be recorded into a macro file.
Target
Operation
Function
Add pop-up menu option/toolbar button
Make setting in the dialog box opened by
clicking on the menu option or toolbar button
Defines a symbol.
Delete pop-up menu option/toolbar button
Click on the menu option or toolbar button
Deletes a symbol.
Delete All pop-up menu option/toolbar button
Deletes all symbols.
Load pop-up menu option/toolbar button
Make setting in the dialog box opened by
clicking on the menu option or toolbar button
Defines symbols.
BP column
Double-click on the column
Sets or clears a software
breakpoint.
15.5.2.4 Watch window
While a macro is being recorded, the following operations will be recorded into a macro file.
Target
Operation
Function
Enable Auto Update pop-up menu option/toolbar Click on the menu option or toolbar Sets real-time check of a
button
button
symbol to enable.
Enable Auto Update All pop-up menu
option/toolbar button
Sets real-time check of all
symbols to enable.
Disable Auto Update pop-up menu option/toolbar
button
Sets real-time check of a
symbol to disable.
Disable Auto Update All pop-up menu
option/toolbar button
Sets real-time check of all
symbols to disable.
Record Update Value -> Start Recording pop-up Make setting in the dialog box
menu option/toolbar button
opened by clicking on the menu
option or toolbar button
Starts to record the updated
values.
Record Update Value -> Stop Recording pop-up Click on the menu option or toolbar Stops recording the updated
menu option/toolbar button
button
values.
Add Watch pop-up menu option/toolbar button *
Edit Name pop-up menu option/toolbar button
Edit Value pop-up menu option/toolbar button
Delete pop-up menu option/toolbar button
Delete All pop-up menu option/toolbar button
Make setting in the dialog box
opened by clicking on the menu
option or toolbar button
Adds a symbol.
Deletes and adds a symbol.
Edits the value of a symbol.
Click on the menu option or toolbar Deletes a symbol.
button
Deletes all watch items.
Radix -> Hexadecimal pop-up menu
option/toolbar button
Sets radix for hexadecimal for
this value.
Radix -> Decimal pop-up menu option/toolbar
button
Sets radix for decimal for this
value.
Radix -> Octal pop-up menu option/toolbar button
Sets radix for octal for this
value.
Radix -> Binary pop-up menu option/toolbar
button
Sets radix for binary for this
value.
'+' or '-' sign
REJ10J2169-0100 Rev.1.00
Jul 01, 2010
Click on the sign
Expands or collapses a symbol.
Page 276 of 523
High-performance Embedded Workshop V.4.08
15. Macro-Recording Support Facility
Target
Operation
Function
Watched variable name
Make setting in the dialog box
opened by double-clicking a value
Deletes and adds a symbol.
Value
In-place edit
Edits the value of a symbol.
Make setting in the dialog box
opened by double-clicking a value
Note:
*. Scope is not recordable.
15.5.2.5 Local window
While a macro is being recorded, the following operations will be recorded into a macro file.
Target
Operation
Function
Edit pop-up menu
option/toolbar button
Make setting in the dialog box opened by clicking on the menu option
or toolbar button
Changes a local item's
value.
Value
Make setting in the dialog box opened by double-clicking on a value
In-place edit
15.5.2.6 Event window
While a macro is being recorded, the following operations will be recorded into a macro file.
Target
Operation
Function
Add pop-up menu option/toolbar button Make setting in the dialog box
Edit pop-up menu option/toolbar button opened by clicking on the menu
option or toolbar button
Adds the break point or break condition.
Enable pop-up menu option/toolbar
button
Enables the selected break points or
break conditions.
Edits the break point or break condition.
Click on the menu option or toolbar
button
Disable pop-up menu option/toolbar
button
Disables the selected break points or
break conditions.
Delete pop-up menu option/toolbar
button
Removes the selected break points or
break conditions.
Delete All pop-up menu option/toolbar
button
Removes all break points or break
conditions.
15.5.2.7 Code Coverage window
While a macro is being recorded, the following operation will be recorded into a macro file.
Target
Operation
Hardware Settings pop-up
menu option/toolbar button
Make setting in the dialog box opened by
•
clicking on the menu option or toolbar button •
REJ10J2169-0100 Rev.1.00
Jul 01, 2010
Function
Allocates code coverage memory.
De-allocates code coverage memory.
Page 277 of 523
High-performance Embedded Workshop V.4.08
15. Macro-Recording Support Facility
15.5.2.8 Data Coverage window
While a macro is being recorded, the following operation will be recorded into a macro file.
Target
Operation
Hardware Settings pop-up
menu option/toolbar button
Make setting in the dialog box opened by
•
clicking on the menu option or toolbar button •
Function
Allocates data coverage memory.
De-allocates data coverage memory.
15.5.2.9 Hardware Break dialog box
While a macro is being recorded, the following operation will be recorded into a macro file.
Target
Operation
Function
Apply button
Click on the button
Changes the hardware break conditions.
Detail button for Access Protect Violation
Make setting in the
Sets the access violation area.
dialog
box
opened
by
Detail button for Read from an uninitialized memory
clicking on the button
Detail button for Stack access violation
Detail button for Task stack access violation
15.5.2.10
Trace conditions dialog box
While a macro is being recorded, the following operation will be recorded into a macro file.
Target
Operation
Function
Apply button
Click on the button
Changes the trace conditions.
Detail button for Access Protect Violation
Make setting in the
Sets the access violation area.
Detail button for Read from an uninitialized memory dialog box opened by
clicking on the button
Detail button for Stack access violation
Detail button for Task stack access violation
15.5.2.11
Performance Conditions dialog box
While a macro is being recorded, the following operation will be recorded into a macro file.
Target
Operation
Function
Apply button
Click on the button
Changes the performance conditions.
15.5.2.12
Trigger Output Conditions dialog box
While a macro is being recorded, the following operation will be recorded into a macro file.
Target
Operation
Function
Apply button
Click on the button
Changes the trigger output conditions.
REJ10J2169-0100 Rev.1.00
Jul 01, 2010
Page 278 of 523
High-performance Embedded Workshop V.4.08
15.5.2.13
15. Macro-Recording Support Facility
Realtime Profile window
While a macro is being recorded, the following operations will be recorded into a macro file.
•
E200F Emulator Software
Target
Operation
Function
Clear Data pop-up menu
option/toolbar button
Click on the menu option or toolbar button
Clears all measurement data of
real-time profile.
Save To File pop-up menu
option/toolbar button
Make setting in the dialog box opened by clicking
on the menu option or toolbar button
Saves real-time profile
measurement results to a file.
•
E100 Emulator Software
Target
Operation
Function
Set pop-up menu option/toolbar button
Make setting in the
dialog box opened by
clicking on the menu
option or toolbar button
•
•
•
•
Allocates real-time profile memory.
De-allocates real time profile memory.
Sets real-time profile measurement mode.
Enables or disables each task ID individually.
Properties pop-up menu option/toolbar button
Set the unit of the measurement of a realtime
profile.
Save To File pop-up menu option/toolbar
button
Saves real-time profile measurement results to a
file.
Clear Data pop-up menu option/toolbar button Click on the menu
Clears all measurement data of real-time profile.
option or toolbar button
15.5.2.14
Configuration properties dialog box
While a macro is being recorded, the following operation will be recorded into a macro file.
Target
Operation
Function
OK button
Click on the button
•
•
•
•
•
•
15.5.2.15
Selects the operating clock.
Sets up the debugger.
Selects a switching function.
Allocates emulation memory.
Sets on overwriting of the internal flash memory.
Sets the warning of exceptional events.
Device Setting dialog box
While a macro is being recorded, the following operation will be recorded into a macro file.
Target
Operation
Function
OK button
Click on the button
Selects a device and operation mode.
REJ10J2169-0100 Rev.1.00
Jul 01, 2010
Page 279 of 523
High-performance Embedded Workshop V.4.08
15.5.2.16
15. Macro-Recording Support Facility
Start/Stop Function Setting dialog box
While a macro is being recorded, the following operation will be recorded into a macro file.
Target
Operation
Function
OK button
Click on the button
Specifies the address of a work area and an executing routine.
15.5.2.17
ASMWatch window
While a macro is being recorded, the following operations will be recorded into a macro file.
Target
Operation
Function
Set pop-up menu
option/toolbar button
Make setting in the dialog box opened by clicking on the menu
option or toolbar button
Sets new data to
selected watch point.
Value
Make setting in the dialog box opened by double-clicking a value
In-place edit
15.5.2.18
CWatch window
While a macro is being recorded, the following operations will be recorded into a macro file.
Target
Operation
Function
Set pop-up menu
option/toolbar button
Make setting in the dialog box opened by clicking on the menu option Sets new data to
or toolbar button
selected C watch point.
Value
Make setting in the dialog box opened by double-clicking on a value
In-place edit
15.5.2.19
S/W Breakpoints window
While a macro is being recorded, the following operations will be recorded into a macro file.
Target
Operation
Function
Add button
Click on the button
Adds the break point.
Delete button
Removes the selected break point.
Delete All button
Removes all break points.
Enable button
Enables the selected break point.
All Enable button
Enables all break points.
Disable button
Disables the selected break point.
All Disable button
Disables all break points.
Selected item in the
S/W Break Point list
Double-click on the item
REJ10J2169-0100 Rev.1.00
Jul 01, 2010
Enables or disables the selected software breakpoint.
Page 280 of 523
High-performance Embedded Workshop V.4.08
15.5.2.20
15. Macro-Recording Support Facility
Address Interrupt Break Points dialog box
While a macro is being recorded, the following operations will be recorded into a macro file.
Target
Operation
Function
Add button
Click on the button
Adds the break point.
Delete button
Removes the selected break point.
Delete All button
Removes all break points.
Enable button
Enables the selected break point.
All Enable button
Enables all break points.
Disable button
Disables the selected break point.
All Disable button
Disables all break points.
Selected item in the Address
Interrupt Break Point list
15.5.2.21
Double-click on the item
Sets or clears a software breakpoint.
Trace window
While a macro is being recorded, the following operation will be recorded into a macro file.
Target
Operation
Function
Acquisition pop-up menu
option/toolbar button
Make setting in the dialog box opened by clicking on the
menu option or toolbar button
Configures trace acquisition
parameters.
15.5.2.22
Configuration dialog box
While a macro is being recorded, the following operation will be recorded into a macro file.
Target
Operation
Function
OK button
Click on the button
Sets the emulator operation conditions.
15.5.2.23
Coverage window
While a macro is being recorded, the following operations will be recorded into a macro file.
Target
Operation
Function
Enable All pop-up menu option/toolbar button
Click on the menu option or
toolbar button
Enables all the coverage functions.
Clear All pop-up menu option/toolbar button
Add Range pop-up menu option/toolbar button
Edit Range pop-up menu option/toolbar button
Enable pop-up menu option/toolbar button
Clear Data pop-up menu option/toolbar button
Save Data pop-up menu option/toolbar button
Load Data pop-up menu option/toolbar button
REJ10J2169-0100 Rev.1.00
Jul 01, 2010
Clears the coverage data for all
functions.
Make setting in the dialog box
Adds a new coverage range.
opened by clicking on the menu Edits selected coverage range.
option or toolbar button
Click on the menu option or
toolbar button
Enables or disables coverage.
Clears the coverage data.
Make setting in the dialog box
Saves the coverage data.
opened by clicking on the menu Loads the coverage data from file.
option or toolbar button
Page 281 of 523
High-performance Embedded Workshop V.4.08
15.5.2.24
15. Macro-Recording Support Facility
Simulated I/O window
While a macro is being recorded, the following operation will be recorded into a macro file.
Target
Operation
Function
Erase All pop-up menu Click on the menu option Clears the contents of the Simulated I/O window.
option/toolbar button
or toolbar button
15.6
Playing a macro
There are a number of ways to play a macro file in the High-performance Embedded Workshop, these options are
discussed below.
To play a macro from the toolbar or menu
1.
Click the Play Macro button ( ) or menu option on the Macros toolbar or the Tools menu.
2.
If there is only one macro defined it is automatically played. If multiple macro functions exist in the current
default macro file a dialog is displayed that asks you to choose which macro you wish to execute. When playing
the mouse cursor is modified to include the play icon (
).
3.
Click OK and the macro is executed. When the macro is being executed the pause ( ) and stop ( ) buttons
and menus are enabled. When pausing the mouse cursor is modified to include the pause icon (
).
It is also easy to run a macro from the macro toolbar, menu or via a keyboard shortcut if you have set up macro function
assignments in the Macro dialog box. For information on this area read the "Assigning a macro" information.
Another method is to launch the macro function via the Macro dialog box.
To play a macro from the macro dialog box
1.
Select [Tools -> Macros]. The Macro dialog box opens.
2.
Select the macro file which contains the function you want to play.
3.
Select the macro function in the function list that you want to play.
4.
Click the Play button.
5.
The Macro dialog box is dismissed and the macro function executed.
REJ10J2169-0100 Rev.1.00
Jul 01, 2010
Page 282 of 523
High-performance Embedded Workshop V.4.08
15.7
15. Macro-Recording Support Facility
Editing a macro
It is also possible to edit macros in the following way.
To edit a macro
1.
Select [Tools -> Macros]. The Macro dialog box opens.
2.
Select the macro file which contains the function you want to edit.
3.
Select the macro function in the Macro functions that you want to edit.
4.
Click the Edit button.
5.
The Macro dialog box is dismissed and the file opened in the High-performance Embedded Workshop editor.
The Macros are stored in the "Macros" folder within the High-performance Embedded Workshop management
information folder under the application data folder for each user profile. These files are just text based TCL files that
can also be manually edited in the High-performance Embedded Workshop editor window. Any changes made will
automatically be picked up by the High-performance Embedded Workshop next time the macro is executed.
15.8
Assigning a macro
It is possible to assign a macro to either a custom menu option, toolbar or keyboard shortcut. This allows you to quickly
access macros which you often use. It is possible to assign a single macro to a Tools menu, Macros toolbar and keyboard
shortcut all at the same time if you want. A custom menu and a toolbar button are shown in alphabetical order.
To assign a macro to a toolbar button
1.
Select [Tools -> Macros]. The Macro dialog box opens.
2.
Select the macro file which contains the function you want to assign.
3.
Select the macro function in the Macro functions list that you want to assign.
4.
Click the Assign button. The Macro assign dialog box is displayed.
5.
Select the Assign to Toolbar check box.
6.
You can now modify the macro description in the Description field. This will be used as the toolbar tool tip if
you assign the macro to a toolbar button.
7.
Now you can decide whether you will use the default macro toolbar button (
button image from an existing bitmap file. (*.bmp)
8.
To specify your own image simply click the browse button to open a standard file browser. This will allow you
to manually locate the file on your machine.
REJ10J2169-0100 Rev.1.00
Jul 01, 2010
) or specify your own toolbar
Page 283 of 523
High-performance Embedded Workshop V.4.08
9.
15. Macro-Recording Support Facility
Click OK and the toolbar is added to the Macros toolbar.
To assign a macro to a menu
1.
Select [Tools -> Macros]. The Macro dialog box opens.
2.
Select the macro file which contains the function you want to assign.
3.
Select the macro function in the Macro functions list that you want to assign.
4.
Click the Assign button. The Macro assign dialog box is displayed.
5.
Select the Assign to Menu Name check box.
6.
You can now modify the macro description in the Description field. This will be used as the menu tool tip if
you assign the macro to menu.
7.
Enter the menu name as you want it to appear on the tools menu.
8.
Click OK and the menu is added to the Tools menu.
To assign a macro to a keyboard shortcut
1.
Select [Tools -> Macros]. The Macro dialog box opens.
2.
Select the macro file which contains the function you want to assign.
3.
Select the macro function in the Macro functions list that you want to assign.
4.
Click the Assign button. The Macro assign dialog box is displayed.
5.
Select the Assign to Keyboard Shortcut check box.
6.
Select the keyboard shortcut you wish to assign to the macro in the drop-down list.
7.
Click OK and the shortcut is now available for use.
15.9
Configuring the Macro tab of the Output window
Shows the current records of macros. You can view information such as High-performance Embedded Workshop
command-line commands recorded into a High-performance Embedded Workshop macro file from execution of [Tools > Macro Recording] to [Tools -> Stop Macro]. It is also possible to view this information while recording.
REJ10J2169-0100 Rev.1.00
Jul 01, 2010
Page 284 of 523
High-performance Embedded Workshop V.4.08
15. Macro-Recording Support Facility
Right-clicking displays a pop-up menu containing available options.
A basic operation is allocated to the toolbar.
The Toolbar display and Customize toolbar options are also included in the pop-up menu opened by right-clicking on
the toolbar.
Pop-up Menu Option
Toolbar Button
Function
Clear Window
Clears the contents of the window.
Save
Saves the contents of the window into a text file.
Copy
Copies the selected contents onto the Windows® clipboard.
Toolbar display
-
Shows or hides the toolbar.
Customize toolbar
-
Customizes toolbar buttons.
REJ10J2169-0100 Rev.1.00
Jul 01, 2010
Page 285 of 523
High-performance Embedded Workshop V.4.08
16. Test Support Facility
16. Test Support Facility
The High-performance Embedded Workshop provides regression testing facilities for your application by the test support
facility. Regression test is re-execution of a previous test after modification of the program to verify the result. The test
tool allows High-performance Embedded Workshop macro and batch files to be executed and the system can then be
compared to see if it matches the original captured data.
It is possible to create many tests and scripts and automate the testing procedure. Then once the testing has been
completed the results are displayed in an easy to understand format in the test browser window. This can significantly
reduce the work needed to execute many regression tests.
The test tool uses the TCL command line batch files as its method of executing the features and functions of Highperformance Embedded Workshop. These functions can be created easily using the macro recorder feature or by
manually editing them yourself.
If you need to automate the execution of the actual tests the test tool also supports command line operation. Many
commands are available that allow you to open and close suites, run and compare test data.
The first step towards using the test tool is to create a test suite. This is available on the main Test menu. Then you must
edit the test suite to create some actual tests. Then you can execute the tests using the "Run tests" menu option.
Note, however, that High-performance Embedded Workshop is not capable of acquiring test-image information of all
functions in the High-performance Embedded Workshop system. For the items from which test-image information can be
acquired, see section 16.6, Functions that can be saved as test-image data into test-image files.
16.1
Creating a test suite
A test suite is a set of tests. A test suite has a very similar concept to a workspace. The test suite can contain many tests
which in turn can contain many macros to be executed.
REJ10J2169-0100 Rev.1.00
Jul 01, 2010
Page 286 of 523
High-performance Embedded Workshop V.4.08
16. Test Support Facility
Test suites are independent to the current High-performance Embedded Workshop workspace. This allows your test
suite to work with multiple workspaces and projects to test different situations in one test suite. The "open_workspace"
and "change_project" commands all work with the test suite feature so allow you to control which workspace is currently
in use.
To create a test suite
1.
Select [Test -> Create New Test Suite]. The Create New Test Suite dialog box opens.
2.
Enter the test suite name.
3.
Initially the workspace directory is shown in Directory for test suite. This can be modified as required.
4.
Clicking OK. The test suite is then created. This then enables a number of other options on the Test menu.
Once the test suite is created the Test tab of the workspace window has the test suite added to it. This tab allows quick
navigation around your test suite and fast access to the tests.
A file is located in the destination location with the filename ".HTS" (High-performance Embedded Workshop test suite).
16.2
Opening and closing test suites
Once a test suite is created it is saved to a file with the extension ".HTS" (High-performance Embedded Workshop test
suite). To open this file again after you have created it previously you can use the following operation.
To open a test suite
1.
Select [Test -> Open Test Suite]. The Open Test Suite dialog box opens.
2.
Select the test suite file. Then click Select. The test suite is loaded. This then enables a number of other items on
the Test menu and opens the test suite contents in the Test tab of the workspace window.
When test suites are opened the filename of the suite is added to the Recently used test suite list on the File menu. This
allows access to open your test suites after the initial Open test Suite menu operation.
REJ10J2169-0100 Rev.1.00
Jul 01, 2010
Page 287 of 523
High-performance Embedded Workshop V.4.08
16. Test Support Facility
To close a test suite
Select [Test -> Close Test Suite]. Once clicked the current test suite is closed and all items are removed from the
workspace tab.
There are TCL command line commands for these operations that can be used via the command line window. These
commands are named "open_test_suite" and "close_test_suite".
You can also close a test suite from the workspace window pop-up menu.
16.3
Editing a test suite
Once your test suite has been created the next step is to add some tests. This operation allows you to access the Modify
Test Suite dialog box and will allow you to add tests which will then be executable.
To edit a test suite
1.
Select [Test -> Edit Test Suite]. The Modify Test Suite dialog box is displayed.
The Modify Test Suite dialog box displays the currently defined test cases. Each test case has a name and can have a
detailed description that you have defined to explain the tests purpose.
Clicking the Add button on this dialog box displays the Add New Test dialog box, this is shown below.
REJ10J2169-0100 Rev.1.00
Jul 01, 2010
Page 288 of 523
High-performance Embedded Workshop V.4.08
16. Test Support Facility
Selecting the test and clicking modify allows you to edit currently defined details for the selected test. These details are
also shown in the same dialog as that used for "Add new test". If you click Remove the test is removed.
The Add New Test dialog box allows you to configure tests for execution later. This is discussed in "Adding tests to the
test suite".
You can also edit a test suite from the workspace window pop-up menu.
16.4
Adding tests to the test suite
Once your test suite has been created the next step is to add some tests. This operation allows you to access the Modify
Test Suite dialog box and will allow you to add tests which will then be executable.
To add tests to a test suite
1.
Select [Test -> Edit Test Suite]. The Modify Test Suite is then displayed.
2.
Click Add. The Add New Test dialog box is displayed.
REJ10J2169-0100 Rev.1.00
Jul 01, 2010
Page 289 of 523
High-performance Embedded Workshop V.4.08
16. Test Support Facility
To add a new test you should setup the following data
1.
Enter the test name. There can be no spaces in this name.
2.
Enter the test description. This should describe the test in a verbose way so you will understand it at a later date.
3.
To setup the actual tests to execute you should click the Add button.
4.
The Add New Test Script dialog box is displayed (See below).
5.
The Script type box allows you to select a High-performance Embedded Workshop macro ("HEW macro") or a
High-performance Embedded Workshop command line batch file ("TCL command line batch file").
6.
Selecting HEW Macro in the Script type drop-down list shows all of the registered macro in the Select macros
to add to test list.
7.
You can select multiple macro files to be executed for each test. This is achieved by selecting the checkbox
next to the macro names you wish to use.
8.
Selecting "TCL command line batch file" in the drop-down list changes the Add Test Script dialog box so you
can define the file to execute when the test is executed.
9.
Clicking OK stores the results and adds it to the Add New Test dialog box.
10. Finally you must set the Debug system for test image comparison file. This file stores the comparison data for
the system to be compared to after the tests have executed. This file can be created by using [Test -> Create
Test Image File].
11. Clicking OK adds the test to the Modify Test Suite dialog box.
REJ10J2169-0100 Rev.1.00
Jul 01, 2010
Page 290 of 523
High-performance Embedded Workshop V.4.08
16.5
16. Test Support Facility
Creating a test image file
The test image data is what is used for any comparison in the test system. Only items that are saved in the test file can be
compared.
For example you may only be interested in comparing data that is located in a small area memory not the memory for the
entire device. The more items that you compare for each test will slow down the comparison and this can make a big
difference if you are executing many tests.
To create test image data to be saved into a test image file
1.
Select the [Test -> Create New Test Image File]. The Create New Test Image dialog box is then displayed.
REJ10J2169-0100 Rev.1.00
Jul 01, 2010
Page 291 of 523
High-performance Embedded Workshop V.4.08
16. Test Support Facility
2.
Clicking the Check All button selects all checkboxes, while clicking the Uncheck All button deselects all
checkboxes.
3.
Click the Import button to open the Import the Test Image File dialog box. Browse to the HIF file location.
The settings of an existing test image file are imported.
4.
Each component is listed in the dialog box. Check the checkbox next to the component name to save data for
that component.
5.
Select the component in the dialog and then click the Settings button. A dialog box will be displayed that is
dependent on the selected component. This will allow you to customize the data that is saved to the file. For
details, see section 16.6, Functions that can be saved as test-image data into test-image files.
6.
Clicking OK will dismiss the dialog and store the changes that you have set up.
7.
The Save Test Image File dialog box opens.
8.
Save the data into the High-performance Embedded Workshop test-image file selected in the Add New Test
dialog box or a new High-performance Embedded Workshop test-image file. Only test-image data of the
selected test items (with tick marks in checkboxes) will be saved into the file.
You can also edit a test image file from the workspace window pop-up menu.
16.6
Functions that can be saved as test-image data into test-image files
REJ10J2169-0100 Rev.1.00
Jul 01, 2010
Page 292 of 523
High-performance Embedded Workshop V.4.08
16. Test Support Facility
High-performance Embedded Workshop is not capable of saving all High-performance Embedded Workshop functions
as test-image data. For details on the functions that can be saved into test-image files, see the topics below. These topics
also include information about failed test items (FAIL) shown after test or at comparison of test-image files.
•
Functions that can be saved into test-image files (common to all High-performance Embedded Workshop products)
•
Functions that can be saved into test-image files (dependent on the debugger)
In some cases it is necessary to make detailed setting specific to each of the test items before saving test-image data. If
you double-click on a test item in the Create New Test Image dialog box, a further dialog box for detailed setting opens.
When a test item has any detailed setting, it is possible to customize test-image data of this test item before saving. On
the other hand, when a test item does not allow detailed setting and the checkbox for this test item is selected, all testimage data of this item will be saved into the file.
A save file icon ( ) in the "Saving into Test-Image File" column of an item listed in the View menu indicates that this
data can be saved into a test-image file.
16.6.1
Functions that can be saved into test-image files (common to all High-performance
Embedded Workshop products)
Among the functions common to all High-performance Embedded Workshop products, test-image data of the test items
listed below can be saved into test-image files.
The following table shows the test items in the Create New Test Image dialog box and the corresponding windows from
which the data will be saved into test-image files.
For more information on the test-image data to be saved into test-image files, how to make detailed setting, and test
results, see the descriptions of test items for the corresponding windows.
Create New Test Image Dialog Box
Window (Tab) Name
Opened by
Build Output Window
Build tab of the Output window
[View -> Output]
Debug Output Window
Debug tab of the Output window
Register *
Register
[View -> CPU -> Registers]
IO *
IO
[View -> CPU -> IO]
Status *
Status
[View -> CPU -> Status]
Memory *
Memory
[View -> CPU -> Memory]
StackTrace *
StackTrace
[View -> Code -> Stack Trace]
Test Group Name
Test Item Name
Output
CPU
Code
Note:
*. Test items cannot be selected when the High-performance Embedded Workshop is not connected to any target.
REJ10J2169-0100 Rev.1.00
Jul 01, 2010
Page 293 of 523
High-performance Embedded Workshop V.4.08
16. Test Support Facility
16.6.1.1 Output-Build/Debug (Output window)
The following table shows information on the test-image data to be saved into test-image files and test results (not
matched).
Test group name
Output
Test item name
Build Output Window
Test-image data to be
All information in the Build tab of the output window.
saved into test-image files
Test result details
Original
Content of the test-image file
New
Data in the current High-performance Embedded Workshop system or in
another test-image file to be compared with
Example
Original:
New:
Building - New - Debug
Test group name
Output
Test item name
Debug Output Window
Test-image data to be
All information in the Debug tab of the output window.
saved into test-image files
Test result details
Original
Content of the test-image file
New
Data in the current High-performance Embedded Workshop system or in
another test-image file to be compared with
Example
Original:
Connected
New:
Step Normal End
No detailed setting specific to the test item can be made.
16.6.1.2 CPU-Register (Register window)
The following table shows information on the test-image data to be saved into test-image files and test results (not
matched).
Test group name
CPU
Test item name
Register
Test-image data to be
All information in the Register window.
saved into test-image files
Test result details
Failed at register
Name of the unmatched register
Src
Content of the test-image file
Dest
Data in the current High-performance Embedded Workshop system
or in another test-image file to be compared with
Example
Failed at register R11, Src = 0x00000000, Dest = 0x00000fff
No detailed setting specific to the test item can be made.
REJ10J2169-0100 Rev.1.00
Jul 01, 2010
Page 294 of 523
High-performance Embedded Workshop V.4.08
16. Test Support Facility
16.6.1.3 CPU-IO (IO window)
The following table shows information on the test-image data to be saved into test-image files and test results (not
matched).
Test group name
CPU
Test item name
IO
Test-image data to be
Values set as detailed information and the range of data in the IO window acquired with
saved into test-image files this setting. No I/O register is specified by default.
Test result details
Failed at
Name of the unmatched I/O register
Src
Content of the test-image file
Dest
Data in the current High-performance Embedded Workshop system
or in another test-image file to be compared with
Example
Failed at IPRC, register value is different: Src = 0000, Dest = FFFF
To make detailed setting
If you double-click on a test item in the Create New Test Image dialog box, a further dialog box for detailed setting
opens.
1.
Selecting the checkbox for an I/O register in the Compared I/O registers list allows this I/O register to be
saved into the test-image file. These check boxes are not selected by default. The selected I/O register is shown
in Current Setting.
2.
If you do not wish to compare the address of the selected register, select the Ignore address checkbox. This
checkbox is not selected by default.
3.
Click OK.
REJ10J2169-0100 Rev.1.00
Jul 01, 2010
Page 295 of 523
High-performance Embedded Workshop V.4.08
16. Test Support Facility
16.6.1.4 CPU-Status (Status window)
The following table shows information on the test-image data to be saved into test-image files and test results (not
matched).
Test group name
CPU
Test item name
Status
Test-image data to be
Values set as detailed information and all data in the Status window. No sheet is specified
saved into test-image files by default.
Test result details
Sheet
Name of the unmatched sheet
Line
Unmatched line number
Src
Content of the test-image file
Dest
Data in the current High-performance Embedded Workshop system or in
another test-image file to be compared with
Example
Status differs.
Sheet = Platform
Line = 6
Src = Execute From, Pipeline Reset
Dest = Execute From, EX Stage
To make detailed setting
If you double-click on a test item in the Create New Test Image dialog box, a further dialog box for detailed setting
opens.
1.
To specify the sheet to be compared in the test-image file, select the Memory, Platform, or Events checkbox.
These checkboxes are not selected by default.
2.
Click OK.
REJ10J2169-0100 Rev.1.00
Jul 01, 2010
Page 296 of 523
High-performance Embedded Workshop V.4.08
16. Test Support Facility
16.6.1.5 CPU-Memory (Memory window)
The following table shows information on the test-image data to be saved into test-image files and test results (not
matched).
Test group name
CPU
Test item name
Memory
Test-image data to be
Values set as detailed information and the range of data in the Memory window acquired
saved into test-image files with this setting. No memory range is specified by default.
Test result details
Failed at
address
Unmatched address
Src
Content of the test-image file
Dest
Data in the current High-performance Embedded Workshop system or in
another test-image file to be compared with
Example
Failed at address 0x70000014, Src = 0x00002f5a, Dest = 0x00002704
To make detailed setting
If you double-click on a test item in the Create New Test Image dialog box, a further dialog box for detailed setting
opens.
•
To add a memory range
1.
Click on the Add button on the Edit Test Memory Ranges dialog box to open the Add Memory Range dialog
box.
REJ10J2169-0100 Rev.1.00
Jul 01, 2010
Page 297 of 523
High-performance Embedded Workshop V.4.08
•
•
16. Test Support Facility
2.
Specify Start address, End address, and Access size to set a memory range to be saved into a test-image file.
3.
Click OK.
To modify a memory range
1.
Click on the Modify button on the Edit Test Memory Ranges dialog box. The memory range selected in the
Memory ranges list will be modified. Only one variable is selectable in the list. The Modify Memory Range
dialog box opens.
2.
Specify Start address, End address, and Access size to set a memory range to be saved into a test-image file.
3.
Click OK.
To remove a memory range
1.
Click on the Remove button on the Edit Test Memory Ranges dialog box. The memory range selected in the
Memory ranges list will be deleted. Only one trace range is selectable in the list.
Then click OK.
REJ10J2169-0100 Rev.1.00
Jul 01, 2010
Page 298 of 523
High-performance Embedded Workshop V.4.08
16. Test Support Facility
16.6.1.6 Code-StackTrace (StackTrace window)
The following table shows information on the test-image data to be saved into test-image files and test results (not
matched).
Test group name
Code
Test item name
StackTrace
Test-image data to be
Values set as detailed information and data within nested function calls in the StackTrace
saved into test-image files window. The default value in Nest level is 10.
Test result details
Src
Content of the test-image file
Dest
Data in the current HEW system or in another test-image file to be
compared with
Example
Value differs.
Src = F, PowerON_Reset_PC(), { 0000080E }
Dest = F, PowerON_Reset_PC(), { 0000081C }
To make detailed setting
If you double-click on a test item in the Create New Test Image dialog box, a further dialog box for detailed setting
opens.
1.
The range of stack trace information to be saved into the test-image file is determined by the number of nest
levels specified in Nest level.
2.
To compare parameters or local variables, select checkbox Parameter or Local Variable. These checkbox are
not selected by default.
3.
If you do not wish to compare the address of the selected register, select the Ignore address checkbox. This
checkbox is not selected by default.
4.
Click OK.
REJ10J2169-0100 Rev.1.00
Jul 01, 2010
Page 299 of 523
High-performance Embedded Workshop V.4.08
16.6.2
16. Test Support Facility
Functions that can be saved into test-image files (dependent on the debugger)
Among the High-performance Embedded Workshop functions dependent on the debugger, test-image data of the test
items listed below can be saved into test-image files.
The following table shows the test items in the Create New Test Image dialog box and the corresponding windows from
which the data will be saved into test-image files.
For more information on the test-image data to be saved into test-image files, how to make detailed setting, and test
results, see the descriptions of test items for the corresponding windows.
Create New Test Image Dialog Box Window Name Opened by
Supported Debugger
Test Group Name Test Item Name
Symbol
Watch
Watch
[View -> Symbol •
•
-> Watch]
Locals
Locals
[View -> Symbol •
> Locals]
•
•
ASMWatch
ASMWatch
CWatch
CWatch
•
•
•
[View -> Symbol • Simulator Debuggers for M16C Family
-> ASMWatch] • Simulator Debuggers for 740 Family
[View -> Symbol • Emulator Debuggers for M16C Family
-> CWatch]
•
•
CPU
Simulated I/O
Simulated I/O
[View -> CPU -> •
•
Simulated I/O]
Code
Coverage
Coverage
[View -> Code ->
•
Coverage]
Trace
Trace
[View -> Code -> •
•
Trace]
•
•
•
REJ10J2169-0100 Rev.1.00
Jul 01, 2010
Simulator Debugger for SuperH Family
Simulator Debugger for H8SX, H8S, H8
Family
Simulator Debugger for RX Family
Emulator Debuggers for SuperH Family
Emulator Debuggers for H8SX, H8S, H8
Family
Exclude the following debugger:
- H8/300H Tiny Compact Emulator
Debugger
E100 Emulator Software
E8 Emulator Software
E8a Emulator Software
Exclude the following debuggers:
- E100 Emulator Software
- E8 Emulator Software
- E8a Emulator Software
Emulator Debuggers for 740 Family
Exclude the following debugger:
- E8a Emulator Software
H8/300H Tiny Compact Emulator
Debugger
Simulator Debugger for SuperH Family
Simulator Debugger for H8SX, H8S, H8
Family
Simulator Debugger for RX Family
Simulator Debugger for SuperH Family
Simulator Debugger for H8SX, H8S, H8
Family
Simulator Debugger for RX Family
Emulator Debuggers for SuperH Family
Emulator Debuggers for H8SX, H8S, H8
Family
Page 300 of 523
High-performance Embedded Workshop V.4.08
16. Test Support Facility
Test items cannot be selected when the High-performance Embedded Workshop is not connected to a target.
Support of this function depends on the debugger in use. For details, refer to the user’s manual, help information, and
release notes for the emulator or simulator debugger.
16.6.2.1 Symbol-Watch (Watch window)
The following table shows information on the test-image data to be saved into test-image files and test results (not
matched).
Test group name
Symbol
Test item name
Watch
Test-image data to be
Values set as detailed information and the range of data in the Watch window acquired
saved into test-image files with this setting. Check boxes for all symbols are blank by default.
Test result details
Failed at symbol
Name of the unmatched symbol
Src
Content of the test-image file
Dest
Data in the current High-performance Embedded Workshop system
or in another test-image file to be compared with
Example
Failed at symbol a[6], Src = (long)H'00002704{70000018}, Dest =
(long)H'00000daa{70000018}
To make detailed setting
If you double-click on a test item in the Create New Test Image dialog box, a further dialog box for detailed setting
opens.
The scope for all watch items to be tested must be Current Scope. If any other scope has been selected, the items are not
shown in the Symbols list.
REJ10J2169-0100 Rev.1.00
Jul 01, 2010
Page 301 of 523
High-performance Embedded Workshop V.4.08
16. Test Support Facility
1.
The Watch Sheet drop-down list contains "Watch1", "Watch2", "Watch3", and "Watch4". Symbols shown in
the Symbols list depend on the selection made in the Watch Sheet drop-down list.
2.
Each of the symbols in the Symbols list has a check box. By default, the check boxes are not selected. Select a
watch sheet and check the boxes for symbols as required. The selected symbol is shown in Current Setting.
3.
Select the Ignore address check box to disable comparison of the addresses of watch points. The check box is
not selected by default.
4.
Click OK.
16.6.2.2 Symbol-Locals (Locals window)
The following table shows information on the test-image data to be saved into test-image files and test results (not
matched).
Test group name
Symbol
Test item name
Locals
Test-image data to be
Values set as detailed information and the range of data in the Locals window acquired
saved into test-image files with this setting. Checkboxes for all symbols are blank by default.
Test result details
REJ10J2169-0100 Rev.1.00
Jul 01, 2010
Failed at symbol
Name of the unmatched symbol
Src
Content of the test-image file
Dest
Data in the current High-performance Embedded Workshop system
or in another test-image file to be compared with
Example
Failed at symbol i, Src = (int)H'00000001{R14}, Dest =
(int)H'00000000{R14}
Page 302 of 523
High-performance Embedded Workshop V.4.08
16. Test Support Facility
To make detailed setting
If you double-click on a test item in the Create New Test Image dialog box, a further dialog box for detailed setting
opens.
1.
To specify a symbol to be saved into the test-image file, select the checkbox for that symbol. The selected
symbol is shown in Current Setting.
2.
Click OK.
REJ10J2169-0100 Rev.1.00
Jul 01, 2010
Page 303 of 523
High-performance Embedded Workshop V.4.08
16. Test Support Facility
16.6.2.3 Symbol-ASMWatch (ASMWatch window)
The following table shows information on the test-image data to be saved into test-image files and test results (not
matched).
Test group name
Symbol
Test item name
ASMWatch
Test-image data to be
Values set as detailed information and the range of data in the ASMWatch window
saved into test-image files acquired with this setting. Checkboxes for all watch points are blank by default.
Test result details
Failed at xxx , data Name of the unmatched watch point
value is different:
Src
Content of the test-image file
Dest
Data in the current High-performance Embedded Workshop system
or in another test-image file to be compared with
Example
Failed at 414, data value is different: Src = 0000, Dest = 0001
To make detailed setting
If you double-click on a test item in the Create New Test Image dialog box, a further dialog box for detailed setting
opens.
•
To add a watch point
1.
Click on the Add button on the Edit Test ASM Watch Points dialog box to open the Add dialog box.
REJ10J2169-0100 Rev.1.00
Jul 01, 2010
Page 304 of 523
High-performance Embedded Workshop V.4.08
•
•
16. Test Support Facility
2.
Specify Address, Size, and Radix to set a watch point to be saved into a test-image file.
3.
Click OK.
To add a bit-level watch point
1.
Click on the Add Bit button on the Edit Test ASM Watch Points dialog box to open the BitAdd dialog box.
2.
Specify BitSymbol, Address, Size, and Bit to set a bit-level watch point to be saved into the test-image file.
3.
Click OK.
To delete a watch point
1.
Click on the Delete button on the Edit Test ASM Watch Points dialog box. The watch point selected in the
Compared watch list will be deleted. Only one point is selectable in the list.
REJ10J2169-0100 Rev.1.00
Jul 01, 2010
Page 305 of 523
High-performance Embedded Workshop V.4.08
•
16. Test Support Facility
To disable comparison of the addresses of watch points
1.
Select the Ignore address for labels and symbols check box on the Edit Test ASM Watch Points dialog box.
The check box is not selected by default.
Then click OK.
16.6.2.4 Symbol-CWatch (CWatch window)
The following table shows information on the test-image data to be saved into test-image files and test results (not
matched).
Test group name
Symbol
Test item name
CWatch
Test-image data to be
Values set as detailed information and the range of data in the CWatch window acquired
saved into test-image files with this setting. Checkboxes for all variables are blank by default.
Test result details
Failed at xxx , data
value is different:
Name of the unmatched variable
Src
Content of the test-image file
Dest
Data in the current High-performance Embedded Workshop
system or in another test-image file to be compared with
Example
Failed at (a)[0] ([Global]), data value is different: Src = 1783,
Dest = 0
To make detailed setting
If you double-click on a test item in the Create New Test Image dialog box, a further dialog box for detailed setting
opens.
REJ10J2169-0100 Rev.1.00
Jul 01, 2010
Page 306 of 523
High-performance Embedded Workshop V.4.08
•
16. Test Support Facility
To add a variable
1.
Click on the Add button on the Edit Test C Variables dialog box to open the Add Variables dialog box, in
which variables can be added in units of scopes.
2.
The Scope drop-down list contains Global, Local, and file names. Variables shown in the Name list depend on
the selection made in the Scope drop-down list. The Name list shows global variables when Global has been
selected, and local variables that can be viewed in the current scope (at the position of the program counter)
when Local has been selected. When you have selected a file name, the Name list shows the file local variables
included in the compilation unit to which the selected file belongs.
3.
Each of the variables in the Name list has a check box. By default, the check boxes are not selected. A ‘+’ sign
shown next to a variable in the Name list indicates that the variable can be expanded by double-clicking.
However, double-clicking on a ‘-’ sign does not collapse the expanded variable. Even if the check box for a
variable with ‘+’ is selected, the boxes for its elements are still blank.
4.
Select a scope and check the boxes for variables as required.
REJ10J2169-0100 Rev.1.00
Jul 01, 2010
Page 307 of 523
High-performance Embedded Workshop V.4.08
5.
•
16. Test Support Facility
Click OK.
To delete a variable
1.
Click on the Delete button on the Edit Test C Variables dialog box. The variable selected in the Compared list
will be deleted. Only one variable is selectable in the list.
Then click OK.
16.6.2.5 CPU-Simulated I/O (Simulated I/O window)
The following table shows information on the test-image data to be saved into test-image files and test results (not
matched).
Test group name
CPU
Test item name
Simulated I/O
Test-image data to be
Values set as detailed information and the range of data in the Simulated I/O window
saved into test-image files acquired with this setting. No I/O simulation range is specified by default.
Test result details
Failed at Line
Unmatched line number
Src
Content of the test-image file
Dest
Data in the current High-performance Embedded Workshop system or in
another test-image file to be compared with
Example
Failed at Line 1: Src = ### Data Input ### Dest = a[1]=21468
To make detailed setting
If you double-click on a test item in the Create New Test Image dialog box, a further dialog box for detailed setting
opens.
REJ10J2169-0100 Rev.1.00
Jul 01, 2010
Page 308 of 523
High-performance Embedded Workshop V.4.08
•
•
16. Test Support Facility
To add a simulated I/O range
1.
Click on the Add button on the Edit Test Simulated I/O dialog box to open the Add Simulated I/O dialog
box.
2.
Specify All or Line No to set a I/O simulation range to be saved into a test-image file.
3.
Click OK.
To modify a simulated I/O range
1.
Click on the Modify button on the Edit Test Simulated I/O dialog box. The simulated I/O range selected in the
Simulated I/O list will be modified. Only one variable is selectable in the list. The Modify Simulated I/O
dialog box opens.
REJ10J2169-0100 Rev.1.00
Jul 01, 2010
Page 309 of 523
High-performance Embedded Workshop V.4.08
•
16. Test Support Facility
2.
Specify All or Line No to set the I/O simulation range to be saved into a test-image file.
3.
Click OK.
To remove a simulated I/O range
1.
Click the Remove button on the Edit Test Simulated I/O dialog box. The simulated I/O range selected in the
Simulated I/O list will be removed. Only one simulated I/O range is selectable in the list.
Then click OK.
16.6.2.6 Code-Coverage (Coverage window)
The following table shows information on the test-image data to be saved into test-image files and test results (not
matched).
Test group name
Code
Test item name
Coverage
Test-image data to be
Values set as detailed information and the range of data in the Coverage window acquired
saved into test-image files with this setting. No test range is specified by default.
Test result details
Range
Coverage range
Instruction
Execution
Unmatched test option
mismatch at
Unmatched address
Image
Content of the test-image file
System
Data in the current High-performance Embedded Workshop system or in
another test-image file to be compared with
Example
Range DemoSH4.c:
Instruction Execution Time mismatch at 0x20E4 -- Image: 1 System: 0
To make detailed setting
If you double-click on a test item in the Create New Test Image dialog box, a further dialog box for detailed setting
opens.
REJ10J2169-0100 Rev.1.00
Jul 01, 2010
Page 310 of 523
High-performance Embedded Workshop V.4.08
16. Test Support Facility
1.
The Available Ranges list shows the coverage ranges that are currently available.
2.
If you select coverage ranges in the Available Ranges list and click the ">>" button, these coverage ranges then
appear in the Ranges to be tested list.
3.
The Address checkbox among test options is always ON because addresses must be saved whenever coverage
ranges are saved into test-image files (users cannot control this selection). To set other test options Execution
Path, Execution Times, and Pass, select the check boxes for these options. The Execution Path checkbox is
selected by default. Other check boxes are not selected by default.
4.
Click OK.
16.6.2.7 Code-Trace (Trace window)
The following table shows information on the test-image data to be saved into test-image files and test results (not
matched).
Test group name
Code
Test item name
Trace
Test-image data to be
Values set as detailed information and the range of data in the Trace window acquired
saved into test-image files with this setting. No trace range is specified by default.
Test result details
REJ10J2169-0100 Rev.1.00
Jul 01, 2010
Comparing PTR
Compared trace range
Trace type
Trace type
Trace data is not
matching. PTR
Unmatched trace range
Src
Content of the test-image file
Dest
Data in the current High-performance Embedded Workshop system or
in another test-image file to be compared with
Example
Comparing PTR -3 to -1. Trace type : Trace.
Trace data is not matching. PTR:-3 to PTR:-1
Trace data at the beginning of difference. PTR:-3
Src : 0000001879 0000107C F->DEMMW MOV.L @R15+, R1 R1<00000010
Dest: 0000001887 00000818 FD<E JSR @R5 PC<-00001000
Page 311 of 523
High-performance Embedded Workshop V.4.08
16. Test Support Facility
To make detailed setting (with one trace type)
If you double-click on a test item in the Create New Test Image dialog box, a further dialog box for detailed setting
opens.
•
•
To add a trace range
1.
Click on the Add button on the Edit Test Trace Ranges dialog box to open the Add Trace Range dialog box.
2.
Specify Start PTR, and End PTR to set a trace range to be saved into a test-image file.
3.
Click OK.
To modify a trace range
1.
Click on the Modify button on the Edit Test Trace Ranges dialog box. The trace range selected in the Trace
ranges list will be modified. Only one trace range is selectable in the list.
2.
The Modify Trace Range dialog box opens.
REJ10J2169-0100 Rev.1.00
Jul 01, 2010
Page 312 of 523
High-performance Embedded Workshop V.4.08
•
16. Test Support Facility
2.
Specify Start PTR, and End PTR to set a trace range to be saved into a test-image file.
3.
Click OK.
To remove a trace range
1.
Click on the Remove button on the Edit Test Trace Ranges dialog box. The trace range selected in the Trace
ranges list will be deleted. Only one trace range is selectable in the list.
Then click OK.
To make detailed setting (with two or more trace types)
If you double-click on a test item in the Create New Test Image dialog box, a further dialog box for detailed setting
opens.
•
To add a trace range
1.
Click on the Add button in the Edit Test Trace Ranges dialog box to open the Add Trace Range dialog box.
REJ10J2169-0100 Rev.1.00
Jul 01, 2010
Page 313 of 523
High-performance Embedded Workshop V.4.08
•
•
16. Test Support Facility
2.
Specify Trace type, Start PTR, and End PTR to set a trace range to be saved into a test-image file.
3.
Click OK.
To change a trace range
1.
Click on the Modify button on the Edit Test Trace Ranges dialog box. The trace range selected in the Trace
ranges list will be modified. Only one trace range is selectable in the list. The Modify Trace Range dialog box
opens.
2.
Specify Trace type, Start PTR, and End PTR to set a trace range to be saved into a test-image file.
3.
Click OK.
To remove a trace range
1.
Click on the Remove button on the Edit Test Trace Ranges dialog box. The trace range selected in the Trace
ranges list will be deleted. Only one trace range is selectable in the list.
Then click OK.
REJ10J2169-0100 Rev.1.00
Jul 01, 2010
Page 314 of 523
High-performance Embedded Workshop V.4.08
16.7
16. Test Support Facility
Comparing a test image file
To compare a test image file
1.
Select [Test -> Compare Test Image File]. The Compare dialog box opens.
2.
Enter the test file location that you want to compare in Test image file field. This is a "*.HIF" (Highperformance Embedded Workshop test image file) file and contains details about the test image data.
3.
Then select what you want to compare the file you have selected with. You can choose either the Current system
or another previously saved test image file. The Current system option is useful if you have manually executed
a script and want to check the current test image data with some you saved previously.
4.
Click OK.
5.
The results will be loaded into the test browser.
It is possible to compare test image file separately to test execution. This allows you to compare manually the current
system or two test image files at a later date to when the tests were actually executed.
You can also compare test image file from the workspace window pop-up menu.
16.8
Running tests
This allows you to select tests and automate their execution.
To run tests
1.
Select [Test -> Run Tests]. The Run Tests dialog box opens.
REJ10J2169-0100 Rev.1.00
Jul 01, 2010
Page 315 of 523
High-performance Embedded Workshop V.4.08
16. Test Support Facility
2.
All tests currently defined in the High-performance Embedded Workshop test system are listed in the Test cases
list.
3.
Clicking the check box selects the test for execution in this test run.
4.
It is also possible to modify the order a test is executed in by selecting the test and clicking the Move up and
Move down buttons.
5.
When one or more tests have been selected the Run button is enabled. Clicking this Run button starts the test
run. Information will be shown in Test tab of the output window as the tests are executed.
6.
Once completed the test browser will be displayed and will show the test results for all tests executed.
The Action after test case execution drop-down list allows you two options.
The "Compare system against saved test image file" is the normal operation and allows the current High-performance
Embedded Workshop system to be compared with the test image file (*.HIF) file that was attached to the relevant test
case. These results will then be added to the test browser and will give pass, fail and failure details information to you.
The "Refresh test image file" option simply runs all of the test cases and updates the test image file (*.HIF) file with the
system image after each test.
The Automatically save test results check box allows you to automatically save the results of each test execution to a
text file in the same directory as the test suite. The filename used is made up from the current test suite and the date of
time of the test execution.
The Stop at first failure will stop the automated test execution when the first test failure is met. This avoids running
many tests when perhaps the first test causes all others to fail anyway.
REJ10J2169-0100 Rev.1.00
Jul 01, 2010
Page 316 of 523
High-performance Embedded Workshop V.4.08
16. Test Support Facility
The Test time out is for use when you may be executing user code. In some cases if there is a bug the code many
execute and never finish during the tests execution. If any one test takes longer than the number of seconds in this box
the test is terminated and is flagged as a failure.
You can also run test from the workspace window pop-up menu.
16.9
Using the test browser
The test browser displays the results of the last test execution.
The test browser can be easily opened by selecting [Test -> Test Results Browser].
The top pane of the test browser lists all of the tests that were executed during the last test run. A green icon to the left of
the test name indicates the test was successful. A red icon indicates the test failed.
Selecting a test in the top pane shows the test details in the pane below. The bottom pane of the test browser lists all of
the components that were checked. A green icon to the left of the component name indicates the test was successful. A
red icon indicates the test failed. If a test fails the details are shown in this window.
Double clicking on the component displays more information on why the test data comparison failed. This can also be
viewed by selecting the test and then clicking the details button on the toolbar.
The results of the tests can be exported to file. The two options are Export and Export All, Export only saves the
results of the currently selected test. Export All saves the results of all the tests executed.
The results can be saved as text or as a comma delimited file for importing into other tools for analysis.
You can also display Test Browser from the workspace window pop-up menu.
REJ10J2169-0100 Rev.1.00
Jul 01, 2010
Page 317 of 523
High-performance Embedded Workshop V.4.08
•
16. Test Support Facility
Tests (top pane)
Right-clicking displays a pop-up menu containing available options.
Pop-up Menu Option
Toolbar Button
Export
Exports the result.
Export All
Exports all results.
Clear
•
Function
-
Clears all results.
Test items (bottom pane)
Right-clicking displays a pop-up menu containing available options.
Pop-up Menu Option
Toolbar Button
Details
Function
Displays the details of the result.
16.10 Configuring the Test tab of the Workspace window
The Test tab was created to allow fast access to the tests in your test suite.
When the test suite is opened the test suite is added to the Test tab of the workspace window and the tests in the test suite
are added underneath them. This is shown below.
Right-clicking on either the test suite name or the test gives fast access to the test facilities features.
Right-clicking on the test suite icon (
) allows you the following options:
Pop-up Menu Option
Function
Edit Test Suite
Edits the current test suite. Allows you to add and remove tests to the High-performance
Embedded Workshop test system.
Close Test Suite
Closes the current test suite.
Compare Test Image File
Compares test image file allows you to compare a test image file with the current Highperformance Embedded Workshop system or with another test image file already on
your disk. The results are then displayed in the test browser.
Run Tests
Runs tests allows you to run multiple tests that you have defined in the test suite and
see the results of the comparisons in the test browser. There are various options to
configure the test run execution. You can also use this option to refresh the test image
files automatically if you make a minor modification and they need to be updated.
REJ10J2169-0100 Rev.1.00
Jul 01, 2010
Page 318 of 523
High-performance Embedded Workshop V.4.08
16. Test Support Facility
Pop-up Menu Option
Function
Test Results Browser
This menu displays the test results for one or more test executions. It shows the pass
and fail results and the detailed reason why the test failed.
Properties
The Test Suite Properties dialog box is displayed. It displays the test suite name, test
suite description, test suite location and the last modified date.
Right-clicking on a test icon (
) allows you the following options:
Pop-up Menu Option
Function
Run Test Case
Executes the selected test case.
Edit Test Case
Modifies the selected test case.
Remove Test Case
Deletes the selected test case.
Create New Test Image File
Creates a test-image file for the selected test case.
Compare Test Image File
Compares the test-image file with data in the current system.
Edit Test Image File
Modifies the test-image file.
Save Test Image File
Saves the current setting in the High-performance Embedded Workshop system into the
test image file.
Save Test Image File As
Saves the current setting in the High-performance Embedded Workshop system as
another test image file.
Properties
The Test properties dialog box opens. It displays the test name, test description, test
location and the last modified date.
16.11 Configuring the Test tab of the Output window
The Test tab of the output window displays the results and progress of the current test execution. The test execution
progress shows the current test being executed and the number of tests remaining. If errors occur then these are
displayed in this window.
Starting tests, test suite <Test Suite Name>, <Compare Conditions>, <Save Conditions>, continue on failure,
timeout=10
Running test <Test Name>, (X of Y)
Running batch file/macro <Macro Name>, (X of Y)
Classification
Item
Run Tests dialog box
Starting tests,
test suite
<Test Suite Name>
-
-
'TestSuite'
<Compare Conditions>
Action after test
execution dropdown list box
Compare system against
saved test image file
comparing results
Refresh test image file
refreshing results
<Save Conditions>
Automatically save
test results
<Error Condition>
Stop at first failure
(Default)
REJ10J2169-0100 Rev.1.00
Jul 01, 2010
Test timeout
saving results
not saving results
stop on failure
(Default)
<Time out>
Example (Figure below)
Optional (Default = 10)
continue on failure
timeout=10
Page 319 of 523
High-performance Embedded Workshop V.4.08
Classification
Item
Running test
<Test Name>
Running batch
file/macro
16. Test Support Facility
Run Tests dialog box
Example (Figure below)
-
-
'Test_01'
'Test_02'
(X of Y)
X is the current test
number and Y is the total
number of tests.
-
(1 of 2)
(2 of 2)
<Macro Name>
-
-
'Macro_01'
'Macro_02'
(X of Y)
X is the current test
number and Y is the total
number of tests.
-
(1 of 2)
(2 of 2)
Right-clicking displays a pop-up menu containing available options.
A basic operation is allocated to the toolbar.
The Toolbar display and Customize toolbar options are also included in the pop-up menu opened by right-clicking on
the toolbar.
Pop-up Menu Option
Toolbar Button
Function
Clear Window
Clears the contents of the window.
Save
Saves the contents of the window into a text file.
Copy
Copies the selected contents onto the Windows® clipboard.
Toolbar display
-
Shows or hides the toolbar.
Customize toolbar
-
Customizes toolbar buttons.
REJ10J2169-0100 Rev.1.00
Jul 01, 2010
Page 320 of 523
High-performance Embedded Workshop V.4.08
17. Debugging Facility
17. Debugging Facility
This chapter describes the debugging operations and their related windows and dialog boxes.
See Chapter 1, Overview, for the fundamental concepts of the High-performance Embedded Workshop (Highperformance Embedded Workshop).
For details on the functions available with the debugger in use, refer to the user’s manual or help of the emulator or
simulator.
17.1
Preparations for debugging
This section describes the preparations for debugging your program. You will learn how to select and configure a
debugger with which to debug, how to load the user program, and what the debugger sessions are.
17.1.1
Compiling for debug
In order to be able to debug your program at C/C++ source level, your C/C++ program must be compiled and linked with
the Debug option enabled. When this option is enabled, the compiler puts all the information necessary for debugging
your C/C++ code into the absolute file or management information file, which are usually called Debug Object Files.
When you create your project the initial setup will normally be configured for debug.
Notes:
•
Make sure you have the debug option enabled on your compiler and linker when you generate an object file for
debugging.
•
If your debug object file does not contain any debugging information (for example, the S-Record format), then
you can still load it into the debugger, but you will only be able to debug at the assembly language level.
17.1.2
Selecting a debugger
Selecting the debugger is very dependent on the installation of the High-performance Embedded Workshop. If the Highperformance Embedded Workshop has a toolchain installed then the application project generator will be able to set up
both the toolchain and the debugger targets simultaneously. This allows the options for targets and toolchain to be
matched closely so that no inconsistencies occur. If there is no toolchain installed you will only be able to select debugonly project types. By default, High-performance Embedded Workshop will display a debug-only project generation type
for each CPU family in the New Project Workspace dialog box.
Note:
The project generator in the High-performance Embedded Workshop automatically generates sample source files for the
microcomputer in use (for some project types, however, no files are generated). These files contain sample code and this
does not indicate that the operations of all programs based on that code are guaranteed. Please read the hardware manual
for the microcomputer to check if the generated source code is applicable and modify the code as required.
REJ10J2169-0100 Rev.1.00
Jul 01, 2010
Page 321 of 523
High-performance Embedded Workshop V.4.08
17. Debugging Facility
The New Project Workspace dialog box allows you to select a project type for generation, which matches your CPU
target.
Project Type
Description
Application
Project for generating an execution program that includes the initial routine file
written in the C/C++ language.
Assembly Application
Project for generating an execution program that includes the initial routine file
written in the assembly language.
Demonstration
Project for generating a demonstration program written in the C language.
C source startup Application
Project for generating a startup program written in the C language.
Empty Application
Project for only setting the toolchain environment (no generation file).
Import Makefile
A project to create an executable program by importing an existing makefile.
Library
Project for generating a library file (no generation file).
Debugger only - xxxxxx
A debug-only project (no generation file).
In the example below, the SH-4 simulator/debugger is assumed. For details on the functions available with the debugger
in use, refer to the user’s manual or help of the debugger.
REJ10J2169-0100 Rev.1.00
Jul 01, 2010
Page 322 of 523
High-performance Embedded Workshop V.4.08
1.
17. Debugging Facility
Select the CPU and Toolchain version in Step 1. The CPU types (CPU Type) are classified according to the CPU
series (CPU Series). Select the CPU corresponding to the program to be developed because the generation file
differs according to the CPU Series and CPU Type settings. If there is no corresponding CPU, select a CPU with
similar hardware specifications or Other.
The following buttons at the bottom of the dialog box are the same as those in the New Project wizard dialog box.
Next>
<Back
Finish
Cancel
Moves to the next display.
Returns to the previous display.
Opens the Summary dialog box (selections followed by this button are default).
Returns to the New Project Workspace dialog box.
To move to Step 2, click the Next> button in Step 1.
REJ10J2169-0100 Rev.1.00
Jul 01, 2010
Page 323 of 523
High-performance Embedded Workshop V.4.08
2.
17. Debugging Facility
Specify the options common to all project files in Step 2. The specifiable items depend on the CPU selected in Step
1.
To move to Step 3, click the Next> button in Step 2.
REJ10J2169-0100 Rev.1.00
Jul 01, 2010
Page 324 of 523
High-performance Embedded Workshop V.4.08
3.
17. Debugging Facility
Specify the generation file in Step 3.
Use I/O Library:
Number of I/O Streams:
Use Heap Memory:
Heap Size:
Generate main() Function:
I/O Register Definition Files:
Generate Hardware Setup Function:
Checking enables use of standard I/O libraries.
Specifies the number of I/O streams that can be used
simultaneously.
Checking enables use of the heap area management function
sbrk().
Specifies the unit of the size of the heap area to be managed.
Selects generation of a model main function. Generates a main
function file (Project name).c(cpp).
Checking generates an I/O register definition file (iodefine.h)
written in the C language.
Selects generation of a model I/O register initial setting program.
Generates a hardware setting file (hwsetup.c(cpp) or hwsetup.src).
Note:
To include a main function that has already been made, select None in Generate main() Function and after making the
project, add the file containing the main function to the project. Note that if the name of the function to be included is
different, the function calling section in resetprg.c must be modified. Be sure to refer to the hardware manual of the CPU
for actual values of the sample file contents, such as the vector table definition and I/O register definition, which are
generated by the project generator.
To move to Step 4, click the Next> button in Step 3.
REJ10J2169-0100 Rev.1.00
Jul 01, 2010
Page 325 of 523
High-performance Embedded Workshop V.4.08
4.
17. Debugging Facility
Specify the configuration of the standard libraries used by the C/C++ compiler in Step 4.
The functions defined in the checked items and the runtime functions are included.
Enable all:
Disable all:
Selects all standard library functions.
Does not select all standard library functions. Note that only the minimum required
functions, runtime and new, are selected.
To move to Step 5, click the Next> button in Step 4.
REJ10J2169-0100 Rev.1.00
Jul 01, 2010
Page 326 of 523
High-performance Embedded Workshop V.4.08
5.
17. Debugging Facility
Specify the stack area in Step 5. This is done by setting the initial value of the stack pointer and the stack size. The
initial value of the stack areas depends on the CPU selected in Step 1.
Note:
The stack area is defined by stacksct.h which is generated by the High-performance Embedded Workshop. If stacksct.h
has been modified by an editor, it cannot be modified from [Project -> Edit Project Configuration] in the Highperformance Embedded Workshop.
To move to Step 6, click the Next> button in Step 5.
REJ10J2169-0100 Rev.1.00
Jul 01, 2010
Page 327 of 523
High-performance Embedded Workshop V.4.08
6.
17. Debugging Facility
Specify the vector in Step 6.
Vector Definition Files:
Vector Handlers:
Checking generates a vector definition file and a vector table setting function
definition file.
Handler:
Displays the handler program name of the reset vector. To modify the
handler program, after selecting the handler program name by
clicking on it, enter the new handler program name. Note that if the
handler program is modified, a reset program (resetprg.c) is not
generated.
Vector:
Displays a description of the vector.
Note:
Since the generated reset program, interrupt functions, reset vector handlers, and interrupt source register definitions are
samples, be sure to refer to the CPU hardware manual.
To move to Step 7, click the Next> button in Step 6.
REJ10J2169-0100 Rev.1.00
Jul 01, 2010
Page 328 of 523
High-performance Embedded Workshop V.4.08
7.
17. Debugging Facility
Specify the debugger targets in Step 7.
Targets:
Target type:
Target CPU:
Sets the debugger targets. Select (by checking) the debugger targets. No selection or a
selection of more than one target is possible.
Specifies the type of the targets displayed in Targets.
Specifies the CPU of the targets displayed in Targets.
Note:
The endian type selected in step 2 will be applied to the compiler settings. This is separate from the endian type of the
debugger target selected in step 7.
To move to Step 8, click the Next> button in Step 7.
REJ10J2169-0100 Rev.1.00
Jul 01, 2010
Page 329 of 523
High-performance Embedded Workshop V.4.08
8.
17. Debugging Facility
Set the options for the debugger targets selected in Step 8.
Core:
Configuration name:
Detail options:
Specifies the target core.
By default, the High-performance Embedded Workshop generates two configurations:
Release and Debug. If a debugger target is selected, a configuration for the selected
target is also generated (an abbreviation including the target name). This configuration
name can be changed in Configuration name.
Sets the debugger target options. To modify an option, select Item and click Modify. If
the selected item cannot be modified, Modify remains gray even when Item is
selected.
Simulator I/O:
System call for standard I/O or file I/O from the user
program is enabled (Enable) or disabled (Disable).
Simulator I/O addr.:
Address for above system call.
Bus mode:
Currently cannot be used by the simulator/debugger.
Initial session:
If Initial session is checked, this session becomes an initial
session.
To move to Step 9, click the Next> button in Step 8.
REJ10J2169-0100 Rev.1.00
Jul 01, 2010
Page 330 of 523
High-performance Embedded Workshop V.4.08
9.
17. Debugging Facility
The files to be generated by the High-performance Embedded Workshop based on the settings made so far are
displayed as a list in Step 9.
File Name:
Extension:
Description:
File name
To change a file name, after selecting the file name by clicking on it, enter the new file
name.
File extension
Description of the file
Clicking the Finish button in Step 9 displays the Summary dialog box.
REJ10J2169-0100 Rev.1.00
Jul 01, 2010
Page 331 of 523
High-performance Embedded Workshop V.4.08
17. Debugging Facility
10. The project generator displays information on the project to be generated in the Summary dialog box. After
confirming the display contents, click the OK button. Clicking Cancel returns to the New Project wizard dialog box.
Checking Generate Readme.txt as a summary file in the project directory will save the project information
displayed in the Summary dialog box as a text file named Readme.txt in the project directory.
17.1.2.1 To create a new project having information from makefile
High-performance Embedded Workshop can analyze GNU make format and Hmake format (High-performance
Embedded Workshop generated) and create a workspace which has file information from makefile.
Open the New Project Workspace dialog box and select the Import Makefile as project type. After supplying some
fields (e.g.: Workspace Name) and pressing OK button, New Project - Import Makefile dialog box opens.
REJ10J2169-0100 Rev.1.00
Jul 01, 2010
Page 332 of 523
High-performance Embedded Workshop V.4.08
17. Debugging Facility
When a makefile is selected by Makefile path, Source files shows source files in the makefile. To view the source files
in the makefile again, click Start.
To apply toolchain options such as the compiler, select the Import options check box.
If you want to remove a file from the project, you can remove it by selecting the file and pressing Remove button. And if
you want to add a file to the project, you can add it by pressing Add button.
Selecting the Show file path check box shows the full path of the file.
17.1.3
Editing project configuration
If you are using the SuperH or H8SX, H8S, and H8 family toolchains then it is possible to configure the simulator again
using the project generator. This feature is not enabled for the demonstration project type.
1.
Select [Project -> Edit Project Configuration]. The Edit Project Configuration dialog box opens.
2.
Click on the Target tab.
3.
Select the target you wish to use and then click OK.
REJ10J2169-0100 Rev.1.00
Jul 01, 2010
Page 333 of 523
High-performance Embedded Workshop V.4.08
17.1.4
17. Debugging Facility
Configuring the debugger
Before you can load a program into your debugger you must set it up to match your application's system. The items that
must be set-up are typically device type, operating mode, clock speed and the memory map. It is particularly important to
set-up the memory map, as you must have memory in the debugger, into which your user code will be loaded.
In the High-performance Embedded Workshop, the project generation process will have completed much of this work.
However if you are using a different configuration of board from the standard types then some customization will be
essential.
17.1.4.1 Setup
To set-up the debugger configuration choose [Setup -> Simulator] or [Setup -> Emulator]. Under this sub menu will
be the menus which can be used to configure your debug platform.
In the case of the SuperH family Simulator the available menus are the System and Memory resource. These options
both allow the simulator to be customized and setup to your requirements.
You will be presented with a set-up dialog specific to the debugger that you chose in the Debug Settings dialog.
For a detailed description of the features available in your debugger, please refer to the separate Debugger User Manual.
17.1.4.2 Memory mapping
For the debugger to correctly represent your user system, the memory map must be set up. It needs to know which areas
in the device's address space are RAM, ROM, on-chip registers or areas where there is no memory.
When you select the device type and mode in the project generator, the High-performance Embedded Workshop will
automatically set up the map for that device and the mode in which the processor is operating. For example, in a device
with internal ROM and RAM, the areas where these are located in the device's memory map will be set by default.
If you are using a device that does not have internal memory, or a device with external memory instead of (or in addition
to) the internal memory, then you must tell the debugger that you have memory there.
Tip:
If you are trying to debug code with an emulator and need some memory available that does not exist either on-chip or
externally (in your hardware), then you can map some emulation memory from the emulator to the address space for your
application to use.
The details will be specific to the debugger that you chose in the new project.
Additional information about the memory mapping can be viewed in the System Status view's Memory pane. The
Device Configuration area shows how the memory in the device's address space.
Note:
Due to page length limitations in some emulators, the range addresses may not exactly match the entered addresses.
REJ10J2169-0100 Rev.1.00
Jul 01, 2010
Page 334 of 523
High-performance Embedded Workshop V.4.08
17. Debugging Facility
17.1.4.3 Editing debug settings
Normal operation of the High-performance Embedded Workshop debugger means that your target and download
modules will be automatically configured in the project generation process. However in some cases it may be necessary
for you to manually configure your debug session. This is often the case when using old toolchains and project
generators that do not support the latest High-performance Embedded Workshop interfaces.
To check your debug session setup display the Debug Settings dialog box. Select one of the following operations
•
Select [Debug -> Debug Settings], OR
•
Right-click on the download module or within the Download modules folder on the Projects tab of the
workspace window and select Debug Settings from the pop-up menu.
Target, Core, Debug format, or Download modules can be selected on the Target tab of the Debug Settings dialog
box. Note that Core can be specified by using Synchronized Debugging facility.
REJ10J2169-0100 Rev.1.00
Jul 01, 2010
Page 335 of 523
High-performance Embedded Workshop V.4.08
17. Debugging Facility
To change the target the following operations is necessary
1.
Select the project that needs to be changed in the tree on the left of the dialog. It defaults to the current project.
2.
Select the session which is to be modified in the drop list above the tree.
3.
Change the target using the target drop list control. This removes any target specific setup options that have
been previously been set.
Moreover, the Options tab of the Debug Settings dialog box provides the following options.
(1)
•
Configuring the automatic command line batch file execution
•
Not executing a batch file when a module containing only debug information is downloaded
•
Downloading modules after build
•
Removing breakpoints on download
•
Disabling memory access until after target connection command file execution
•
Limiting disassembly memory access
•
Not performing automatic target connection
•
Resetting CPU after download module
•
Disabling memory access by GUI when target is executing
Configuring the automatic command line batch file execution
The High-performance Embedded Workshop debugger is tightly integrated with the TCL command line facilities. This
means that it is possible to write batch files for the High-performance Embedded Workshop debugger which can be
executed automatically at certain times. The Command batch file load timing list displays the order in which the files
will be executed. It is possible to Add, Modify, Remove, Up and Down the files in this list.
To configure the automatic command line batch file execution
1.
Select [Debug -> Debug Settings]. The Debug Settings dialog box opens.
2.
Select the Options tab.
3.
Select the Command batch file load timing. This can be the following values, "At target connection", "Before
download of modules", "After download of modules", and "After reset".
REJ10J2169-0100 Rev.1.00
Jul 01, 2010
Page 336 of 523
High-performance Embedded Workshop V.4.08
17. Debugging Facility
4.
Then click Add. The debugger will then display the add Command Line File dialog box.
5.
Enter the command-batch file name in the Filename field. If you wish to insert a placeholder into the Filename
field, click the placeholder button ( ) and select the placeholder from the pop-up menu. To browse a file,
click the Browse button.
6.
In the Initial Directory field, enter the name of the directory where you wish to execute the command batch
file. By this setting, you can also use command batch files that have relative paths. If you wish to insert a
placeholder into the Initial Directory field, click the placeholder button ( ) and select the placeholder from
the pop-up menu. To browse a directory, click the Browse button.
7.
Selecting the Apply to all timings check box adds the batch file to every timing. ("At target connection",
"Before download of modules", "After download of modules", and "After reset".)
8.
Click OK to add the batch file.
9.
Once added it can moved into the correct place in the order by using the Up and Down buttons. This is only
valid if you are adding multiple command line batch files.
10. Click OK.
Notes:
•
If you use the FILE_LOAD or FILE_LOAD_ALL command to download a module, the command batch file
specified for "Before download of modules" or "After download of modules" is not executed.
•
If you use the RESET command to reset the CPU, the RESET command written in the command batch file specified
for "After reset" is not executed.
REJ10J2169-0100 Rev.1.00
Jul 01, 2010
Page 337 of 523
High-performance Embedded Workshop V.4.08
(2)
17. Debugging Facility
Not executing a batch file when a module containing only debug information is downloaded
If this checkbox is selected, a batch file will not be executed when Download (Debug Data Only) is selected in the popup menu displayed by right-clicking the module in the workspace window even in cases where Before download of
modules or After download of modules has been selected for Command batch file load timing and a command batch
file has been specified.
To not execute a batch file when a program containing only debug information is downloaded
(3)
1.
Select [Debug -> Debug Settings]. The Debug Settings dialog box opens.
2.
Select the Options tab.
3.
Select the Disable batch file execution when downloading debug information. By default, this checkbox is
selected.
4.
Click OK.
Downloading modules after build
If this checkbox is selected, the user program will be automatically downloaded after a build.
To download modules after build
(4)
1.
Select [Debug -> Debug Settings]. The Debug Settings dialog box opens.
2.
Select the Options tab.
3.
Select the Download modules after build. By default, this checkbox is selected.
4.
Click OK.
Removing breakpoints on download
If this checkbox is selected, the breakpoints will be automatically removed after downloading the user program.
To remove breakpoints on download
1.
Select [Debug -> Debug Settings]. The Debug Settings dialog box opens.
2.
Select the Options tab.
3.
Select the Remove breakpoints on download. Default for this checkbox depends on the target.
4.
Click OK.
REJ10J2169-0100 Rev.1.00
Jul 01, 2010
Page 338 of 523
High-performance Embedded Workshop V.4.08
(5)
17. Debugging Facility
Disabling memory access until after target connection command file execution
When this checkbox is selected, if a command batch file to be automatically executed at connection to the target has been
specified, the memory in the target will not be accessed until execution of the command batch file is finished.
To disable memory access until after target connection command file execution
(6)
1.
Select [Debug -> Debug Settings]. The Debug Settings dialog box opens.
2.
Select the Options tab.
3.
Select the Disable memory access until after target connection command file execution. This option is
useful when initial setting of memory is necessary at connection to the target. By default, this checkbox is not
selected.
4.
Click OK.
Limiting disassembly memory access
Disables reading data from memory outside the displayed range in disassembly mode.
To limit disassembly memory access
(7)
1.
Select [Debug -> Debug Settings]. The Debug Settings dialog box opens.
2.
Select the Options tab.
3.
Select the Limit disassembly memory access. Default for this checkbox depends on the target.
4.
Click OK.
Not performing automatic target connection
If this checkbox is selected, the target is not connected until you select [Debug->Connect]. Support for this function
depends on the debugger.
To not perform automatic target connection
1.
Select [Debug -> Debug Settings]. The Debug Settings dialog box opens.
2.
Select the Options tab.
3.
Select the Do not perform automatic target connection. This checkbox is only enabled if the feature is
supported by the selected target. Selecting a new target will reset this option to the default setting for the target.
Default for this checkbox depends on the target.
4.
Click OK.
REJ10J2169-0100 Rev.1.00
Jul 01, 2010
Page 339 of 523
High-performance Embedded Workshop V.4.08
(8)
17. Debugging Facility
Resetting CPU after download module
If this checkbox is selected, the target will be automatically reset after downloading the user program. Support for this
function depends on the debugger.
To reset CPU after download module
1.
Select [Debug -> Debug Settings]. The Debug Settings dialog box opens.
2.
Select the Options tab.
3.
Select the Reset CPU after download module. This checkbox is only enabled if the feature is supported by the
selected target. Selecting a new target will reset this option to the default setting for the target. Default for this
checkbox depends on the target.
4.
Click OK.
(9)
Disabling memory access by GUI when target is executing
By setting this option, the user can limit memory accesses from the High-performance Embedded Workshop components
during execution. This prevents the target being overloaded providing memory data and degrading execution. Support for
this function depends on the debugger.
To disable memory access by GUI when target is executing
1.
Select [Debug -> Debug Settings]. The Debug Settings dialog box opens.
2.
Select the Options tab.
3.
Select the Disable memory access by GUI when target is executing. This checkbox is only enabled if the
feature is supported by the selected target. Selecting a new target will reset this option to the default setting for
the target. Default for this checkbox depends on the target.
4.
Click OK.
It does not completely prevent memory access.
•
Operations in which memory accesses are prevented
In the following operations, handling of memory is disabled or no data will actually be read from or written to
memory in the target if attempted. Values to be shown are dummy values (‘FF’).
o
Viewing tooltip watch information in the Editor or Disassembly window in the source mode
o
Viewing or modifying the disassembly code in the Editor or Disassembly window in the mixed or
disassembly mode
o
Viewing or modifying the memory values in the Memory, IO, or MR window *
REJ10J2169-0100 Rev.1.00
Jul 01, 2010
Page 340 of 523
High-performance Embedded Workshop V.4.08
•
17. Debugging Facility
Operations in which memory accesses are not prevented
Memory accesses are not prevented in the following operations.
o
Executing commands in the Command Line window or command files
o
Viewing or modifying the memory values in the Watch window with real-time update enabled *
o
Viewing the memory values in the Monitor, Image, or Waveform window with real-time update
enabled *
o
Viewing or modifying the memory values in the CWatch or ASMWatch window with real-time RAM
monitor function *
o
Viewing the memory values in the RAM Monitor or MR window with real-time RAM monitor
function *
o
Viewing or modifying the memory values in the CWatch or ASMWatch window *
o
Viewing the memory values in the GUI I/O, Image, or Waveform window *
Note:
*. Support for this function depends on the debugger.
17.1.5
Downloading modules
17.1.5.1 Setting the downloading a program
Once you have made sure that there is memory in your system in which to download your code, you can then proceed to
download a program to debug. The initial selection of download module is automatic with regard to an application
generator, as it is the output from the linker. However, with regard to the debug-only project generator, it is possible for
you to browse to the module that you wish to download. This is outlined in the section 17.1.2, Selecting a debugger.
REJ10J2169-0100 Rev.1.00
Jul 01, 2010
Page 341 of 523
High-performance Embedded Workshop V.4.08
17. Debugging Facility
It is also possible to manually choose download modules after the project creation. This is achieved via the Debug
Settings dialog box. This dialog box allows you to control the debug settings throughout your workspace. The tree on the
left of the dialog contains all of the current projects. Selecting a session in this tree will then show you the settings for
that project and the session selection in the session drop-down list. In this list box, it is possible to select multiple
sessions or all sessions. If you select multiple configurations you can choose to modify the settings for one or more
configurations at once. The Debug Settings dialog box displays the following debug options:
•
Current debug target for the current project and configuration selection.
•
Download modules for the current project and configuration selection.
Select the debug format in the Debug format list. You can only debug modules that match the format specified here.
Even if there is a mixture of file formats in the Download modules list below only the one chosen here can be viewed.
The Download modules list displays the order in which the files will be downloaded to the target. It is possible to Add,
Modify, Remove, Up and Down modules in this list.
To add a new download module
1.
Select one of the following operations to open the Debug Settings dialog box:
•
Select [Debug -> Debug Settings], OR
•
Right-click on a module or within the Download modules folder on the Projects tab of the workspace window to
display a pop-up menu. Select Debug Settings.
REJ10J2169-0100 Rev.1.00
Jul 01, 2010
Page 342 of 523
High-performance Embedded Workshop V.4.08
17. Debugging Facility
2.
In the project tree, select the project and configurations to which you want to add a download module.
3.
Click the Add button. The Download Module dialog box is displayed. All fields must be setup for the
download module to be configured correctly.
4.
The Offset field specifies the memory address offset the module will be loaded at. It defaults to 0. After the
module has been added, the offset value is shown on the right of the module name in the [Debug -> Build]
submenu, the Download modules folder on the Projects tab of the workspace window, and the [File ->
Recently Download Module] submenu.
5.
The File format drop-down list box contains a list of supported object format. The file format of the download
module is selected here. So this does not have to match the debug format on the Debug Settings dialog box.
However, the Stack Trace window will be supported for instance depending on the format specified in the
Debug format field.
6.
The Filenames field can be specified with placeholders or as an absolute setting. It is recommended to use
placeholders.
7.
The Access size field specifies the access size when the memory is accessed. If the memory needs to be
accessed by a specific access size, specify the access size by using this option.
8.
The Download debug information only checkbox will download the debug information only without
downloading the code.
9.
The Perform memory verify during download checkbox can be used to do additional checks when
downloading the module to ensure it was correctly downloaded to the target device.
10. The Download automatically on target connection checkbox can be used to automatically download the
module when the target is being connected.
11. When you click the OK button, the debug download module is added to the bottom of the list.
For automatically downloading an existing module to the target when adding it to the Download modules list, see section
17.1.5.2, Downloading modules.
REJ10J2169-0100 Rev.1.00
Jul 01, 2010
Page 343 of 523
High-performance Embedded Workshop V.4.08
17. Debugging Facility
To change the setting of a download module
1.
Select one of the following operations to open the Download Module dialog box:
•
Open the Debug Settings dialog box and select a module, for which you wish to modify the setting, in the
Download modules list and click the Modify button, OR
•
Right-click on the download module or within the Download modules folder on the Projects tab of the
workspace window and select Properties from the pop-up menu.
2.
Change the setting and click the OK button.
To remove download modules
1.
Open the Debug Settings dialog box.
2.
Select a module, which you wish to remove, in the Download modules list and click the Remove button.
To remove selected download modules using the Projects tab of the Workspace window
1.
Select the download modules that you want to remove in the Projects tab of the Workspace window. Multiple
download modules can be selected by holding down the SHIFT or CTRL key.
2.
Select one of the following operations:
•
Select Remove from the pop-up menu opened by right-clicking, OR
•
Press Delete key.
3.
A confirmation dialog box opens for you to select whether or not to remove the selected download modules
from the project. To delete the selected download modules, select Yes. Otherwise select No or Cancel.
If you do not wish to open this confirmation dialog box, select the Don't ask this question again checkbox. To
open this dialog box again, select [Setup -> Options] to open the Options dialog box. Select the Remove
download module(s) from project checkbox on the Confirmation tab. By default, this checkbox is selected.
To change the order of a module to be downloaded to the target
1.
Open the Debug Settings dialog box.
2.
Select a module in the Download modules list and click the Up or Down button.
Any changes made in the Debug Settings dialog box are only changed when you click OK.
REJ10J2169-0100 Rev.1.00
Jul 01, 2010
Page 344 of 523
High-performance Embedded Workshop V.4.08
17. Debugging Facility
17.1.5.2 Downloading modules
Download the object program to be debugged.
To download modules
Select one of the following operations:
•
Select the module, which you wish to download, from the [Debug -> Download Modules] submenu, OR
•
Double-click the module in the Download modules folder on the Projects tab of the workspace window, OR
•
Right-click on the module in the Download modules folder on the Projects tab of the workspace window to
display a pop-up menu. Select Download or Download (Debug Data Only).
The High-performance Embedded Workshop shows the most recently downloaded modules on the submenu of [File ->
Recently Download Modules]. This is useful when you wish to download a module that you recently used.
To download all modules
Select one of the following operations:
•
Select [Debug -> Download Modules -> All Download Modules], OR
•
Right-click within the Download folder on the Projects tab of the workspace window to display a pop-up menu.
Select Download all modules.
Select the [Debug -> Debug Settings] menu option. The Debug Settings dialog box opens. The files will be downloaded
to the target in order of the Download modules list.
An existing module, which is not yet added to the Download modules list, can be automatically downloaded to the target
when it is added to the Download modules list.
To automatically download an existing module to the target when adding it to the Download modules list
1.
Select one of the following operations to open the Download Module dialog box:
•
Select [File -> Download A New Module], OR
•
Right-click on a module or within the Download modules folder on the Projects tab of the workspace window to
display a pop-up menu. Select Download A New Module.
All fields must be setup for the download module to be configured correctly.
REJ10J2169-0100 Rev.1.00
Jul 01, 2010
Page 345 of 523
High-performance Embedded Workshop V.4.08
17. Debugging Facility
2.
The Offset field specifies the memory address offset the module will be loaded at. It defaults to 0. After the
module has been added, the offset value is shown on the right of the module name in the [Debug -> Build]
submenu, the Download modules folder on the Projects tab of the workspace window, and the [File ->
Recently Downloaded Modules] submenu.
3.
The File format drop-down list box contains a list of supported object format. The file format of the download
module is selected here. So this does not have to match the debug format on the Debug Settings dialog box.
However, the Stack Trace window will be supported for instance depending on the format specified in the
Debug format field.
4.
The Filename field can be specified with placeholders or as an absolute setting. It is recommended to use
placeholders.
5.
The Access size field specifies the access size when the memory is accessed. If the memory needs to be
accessed by a specific access size, specify the access size by using this option.
6.
The Download debug information only checkbox will download the debug information only without
downloading the code.
7.
The Perform memory verify during download checkbox can be used to do additional checks when
downloading the module to ensure it was correctly downloaded to the target device.
8.
The Download automatically on target connection checkbox can be used to automatically download the
module when the target is being connected.
9.
Click the OK button.
Select [Debug -> Debug Settings]. The Debug Settings dialog box will be invoked. The module is added to the bottom
of the Download modules list on the Target tab.
If a module previously downloaded is modified outside the High-performance Embedded Workshop, a confirmation
dialog box appears asking if you wish to download this module again. To download the module again, select Yes.
Otherwise select No or Cancel.
REJ10J2169-0100 Rev.1.00
Jul 01, 2010
Page 346 of 523
High-performance Embedded Workshop V.4.08
17. Debugging Facility
If you do not wish to open this confirmation dialog box, select the Don't ask this question again checkbox.
To open the confirmation dialog box again
1.
Select [Setup -> Options]. The Options dialog box will be displayed.
2.
Select the Confirmation tab.
3.
Select the Reload out-of-date download modules checkbox. This checkbox is selected by default.
4.
Click OK.
17.1.5.3 Check for changed source files before download
The High-performance Embedded Workshop can check to see if any of the source files have changed before the
download module is downloaded in the current project. If files have been modified then a confirmation is launched which
asks the user if they wish to rebuild the code before the download takes place. To rebuild the code before the download
again, select Yes. To not rebuild the code before the download again, select No.
If you do not wish to open this confirmation dialog box, select the Don't ask this question again checkbox.
REJ10J2169-0100 Rev.1.00
Jul 01, 2010
Page 347 of 523
High-performance Embedded Workshop V.4.08
17. Debugging Facility
To open the confirmation dialog box again
1.
Select [Setup -> Options]. The Options dialog box will be displayed.
2.
Select the Confirmation tab.
3.
Select the Build out-of-date download modules checkbox. This checkbox is selected by default.
4.
Click OK.
17.1.5.4 Showing a source tree on download (debug-only project)
While a debug-only project (i.e., "Debugger only - xxxxxx") is in use, a tree of source files for a download module are
automatically shown in the Projects tab of the workspace window once the module has been downloaded.
The files for a download module are retrieved when the module is downloaded.
If the files are not full paths and are relative or short file names, they will automatically be searched for relative to the
download module directory.
Files that cannot be found after the initial search will be shown to you in the Locate Files dialog box.
However, you can choose not to open the Locate Files dialog box at downloading.
To prevent opening of the Locate Files dialog box at downloading
•
1.
Select [Setup -> Options]. The Options dialog box will be displayed.
2.
Select the Confirmation tab.
3.
Select the Do not show Debug only workspace browse dialog on download checkbox. This checkbox is not
selected by default.
4.
Click OK.
Debuggers supporting the feature of showing a source tree
This feature is only supported by the debuggers that can create debug-only projects. The condition of the support,
however, depends on the debugger as shown below.
Debugger
Condition of the Support
SuperH family emulator debugger
The High-performance Embedded Workshop has become V.4.02 or later
due to an update.
H8SX, H8S, H8 family emulator debugger
M16C family emulator debugger
REJ10J2169-0100 Rev.1.00
Jul 01, 2010
The High-performance Embedded Workshop included in the product
package is V.4.02 or later.
Page 348 of 523
High-performance Embedded Workshop V.4.08
(1)
17. Debugging Facility
Locating files
Files that cannot be found or do not exist after the initial search will be shown to the user in the Locate Files dialog box
(in the Files to find list).
To locate files
1.
The Last searched directory holds the last directory that was searched for these module files.
2.
The Search status field shows the number of files that were found against the number that have not - this is
only relevant to the files in the dialog and do not account for any previous searches.
3.
The Files to find list holds a list of all the files that could not be found, they will appear in short filename
format, and will be searched for in this manner.
4.
The Browse section allows the user to select a directory in which to search the remaining files for.
5.
The Look in subdirectories check box will look for the files in all sub-directories for the chosen directory.
6.
The Do not show on download check box will not bring up this dialog box on download if there are files that
can not be located. This checkbox is also present in the Confirmation tab of the Options dialog box, and can be
turned off and on here.
7.
Pressing Search will look for the files in the Browse list in the chosen directory, files that have been found will
be removed from the Files to find list.
Any searched directories in the Browse section will be shown by a folder and magnifying glass icon ( ).
Once the user has selected Search this button will be changed to a STOP button allowing the user to cancel a
search. Any files that had been found before the search was cancelled will return to the unlocated state.
REJ10J2169-0100 Rev.1.00
Jul 01, 2010
Page 349 of 523
High-performance Embedded Workshop V.4.08
17. Debugging Facility
8.
Clicking OK, then the files that were searched for and found will be located to that directory, accept all
searches, and close the dialog box.
9.
Clicking Cancel completely cancel all searches that have been done, and close the dialog without changing
anything.
If you had done some searches and they clicked on cancel a confirmation box will appear as below;
If you select Yes this will invoke the Locate Files dialog box and close the dialog box. If you select No the dialog box
will remain open allowing you to select OK. If the confirmation is selected not to be shown again, the default behavior
will be Yes.
To open the confirmation dialog box again
1.
Select [Setup -> Options]. The Options dialog box will be displayed.
2.
Select the Confirmation tab.
3.
Select the Show dialog to search on OK for directory browse dialog checkbox. This checkbox is selected by
default.
4.
Click OK.
If you select the OK button after selecting a directory, and not selecting search, a confirmation box will be shown, as
below.
REJ10J2169-0100 Rev.1.00
Jul 01, 2010
Page 350 of 523
High-performance Embedded Workshop V.4.08
17. Debugging Facility
If you select Yes a search will be made, and the Locate Files dialog box will remain open, allowing you to stop the search
if needed.
Selecting No will invoke the message box and close the Locate Files dialog box.
If the confirmation is ticked not to be shown again, the default behavior will be No.
To open the confirmation dialog box again
(2)
1.
Select [Setup -> Options]. The Options dialog box will be displayed.
2.
Select the Confirmation tab.
3.
Select the Show message when canceling for directory browse dialog checkbox. This checkbox is selected by
default.
4.
Click OK.
Showing a source tree
Files retrieved from the download module will be shown in the workspace window. The files will be shown under the
download module.
Files will be grouped according to file type and shown under their relevant folder. If no file type for that file exists they
will be grouped under their extension folder. When you double-click on a file, the external editor is launched with the
file. If you wish to open the file in the editor window, see section 2.5, File extensions and file groups.
Files that could be located will be shown under the download module, shown in a normal icon (
REJ10J2169-0100 Rev.1.00
Jul 01, 2010
).
Page 351 of 523
High-performance Embedded Workshop V.4.08
17. Debugging Facility
Files that could not be located will be shown under the download module but will have a red icon (
).
To distinguish these files, you can view the full path of the file.
To view the full paths of all files
1.
Right-click anywhere inside the Projects tab of the Workspace window.
2.
Select the Configure View menu option. The Configure View dialog box will be displayed.
3.
Select the Show file paths check box.
4.
Click OK.
REJ10J2169-0100 Rev.1.00
Jul 01, 2010
Page 352 of 523
High-performance Embedded Workshop V.4.08
17. Debugging Facility
If you wish to relocate files in the download module to a different directory this is possible via pop-up menu.
(3)
Relocating files to a different directory
If you wish to relocate the whole module i.e. want to relocate all files in the module to a different directory this is
possible via the download module pop-up menu.
To relocate all files in the module to a different directory
1.
Right-click on a download module in the Projects tab of the workspace window.
2.
Select the Relocate Module menu option. Selecting this will bring up a standard Windows® directory open
dialog box.
REJ10J2169-0100 Rev.1.00
Jul 01, 2010
Page 353 of 523
High-performance Embedded Workshop V.4.08
3.
17. Debugging Facility
Select a directory, and then click the Open button.
Any files that could not be found in this directory will invoke the Locate Files dialog box, allowing you to search for the
unlocated files.
You can also relocate files, via the pop-up menu option shown for files.
To relocate a file to a different directory
1.
Right-click on a file in the Projects tab of the workspace window.
2.
Select the Relocate file(s) menu option. Selecting this will bring up a standard Windows® file open dialog box.
REJ10J2169-0100 Rev.1.00
Jul 01, 2010
Page 354 of 523
High-performance Embedded Workshop V.4.08
3.
This dialog will only allow you to select a file of the same name.
4.
Select a file, and then click the Open button.
17. Debugging Facility
You can select multiple files to be relocated, this will bring up the Locate Files dialog box with the files to be relocated
in the files to find section.
17.1.5.5 Displaying main functions on download
The High-performance Embedded Workshop automatically displays the source file including main functions in source
mode within the High-performance Embedded Workshop editor after downloading modules.
To display main functions on download
1.
Select [Setup -> Options] to open the Options dialog box.
2.
Select Debug tab.
3.
Select the Display main function on download checkbox. By default, this checkbox is not selected.
4.
Click OK.
5.
Download a module. For details on download, see section 17.1.5.2, Downloading modules.
17.1.5.6 Unloading of modules
It is possible to manually unload downloaded modules.
When a module is unloaded, its symbols are erased from the High-performance Embedded Workshop debugging system,
but the memory contents of the target remains unmodified. After a module has been unloaded, it cannot be debugged
unless it is reloaded.
To unload modules
Select one of the following operations:
Select the module, which you wish to unload, from the [Debug -> Unload Modules] submenu, OR
Right-click on the module in the Download modules folder on the Projects tab of the workspace window to display a
pop-up menu. Select Unload. It is possible to select two or more modules.
To unload all modules
Select [Debug -> Unload Modules -> All Downloaded Modules].
REJ10J2169-0100 Rev.1.00
Jul 01, 2010
Page 355 of 523
High-performance Embedded Workshop V.4.08
17. Debugging Facility
Select [Debug -> Debug Settings]. The Debug Settings dialog box opens. This will unload the modules from the target
in the order specified in Download modules list on the Target tab.
17.1.6
Debugger sessions
The High-performance Embedded Workshop allows you to store all of your builder options into a configuration. This
means that you can “freeze” all of the options and give them a name. In a similar way, High-performance Embedded
Workshop allows the user to store his debugger options in a session. Later on, you can select the session and all of the
debugger options will be restored. These sessions allow the user to specify target, download modules and debug options.
This means that potentially each session can be targeted at a different debugger.
This facility can allow you to have many different sessions, each with different debugger options defined. For example, it
is possible to have each session using the same target but with slight variations in the session options. This can mean it is
very easy for the user to switch session and modify such things as register values, or target settings such as clock speed.
The figure below shows this principle. The five sessions share the same target but the sessions can be slightly different,
with regard to the options defined. This means that both sessions can share the same download module and avoid an
unnecessary rebuild. This is because sessions are not directly related to the build configuration data.
Each session’s data is stored in a separate file to the High-performance Embedded Workshop project. You can then
manipulate the data to share or modify as is required in the project.
17.1.6.1 Selecting a session
To select a session
1.
Select [Debug -> Debug Sessions]. The Debug Sessions dialog box opens.
2.
Select the session that you want to use from the Current session drop-down list box.
3.
Click the OK button.
You can also select a different debug session by selecting it from the Current Session drop-down list on the Standard
toolbar.
REJ10J2169-0100 Rev.1.00
Jul 01, 2010
Page 356 of 523
High-performance Embedded Workshop V.4.08
17. Debugging Facility
17.1.6.2 Adding a session
You can now create a session with a target attached and setup ready for use. This session can be given a name and the
target chosen.
To create a new session, with a target attached and setup
1.
Select [File -> New Session]. The New Session dialog box opens.
2.
Enter the name of a new session into the Session name field. This can be up to 32 characters in length and
contain letters, numbers, and the underscore character. Especially, do not use a minus sign, or a space.
3.
Select the target you wish to use in the Create a new session on list.
4.
Select the core in the Using internal core list. This item is only available when a synchronized debugging
facility has been used.
5.
Select the generator in the Session generator to use list. This should default to the correct selection. However
sometimes there may be multiple generators that support the same target.
6.
Click the OK button. This should launch the generation process, the process depends on the generator that was
selected. At this point an additional dialog box may be displayed for target setup options.
7.
When finished, a new session is added to the current project. It should be available in the sessions drop-down
list box on the main toolbar.
You can create a new empty session in the project directory. The session will use the session name as its new file name.
If the file name already exists then an error is displayed.
To add a new empty session
1.
Select [Debug -> Debug Sessions]. The Debug Sessions dialog box opens.
2.
Click the Add button. The Add Session dialog box opens.
REJ10J2169-0100 Rev.1.00
Jul 01, 2010
Page 357 of 523
High-performance Embedded Workshop V.4.08
3.
Click the Add New Session radio button.
4.
Enter a name for the session.
5.
Click the OK button.
17. Debugging Facility
You can import session data from another file and create a new session file in the project directory. All information is an
exact copy of the file the data was imported from.
To import an existing session into a new session file
1.
Select [Debug -> Debug Sessions]. The Debug Sessions dialog box opens.
2.
Click the Add button. The Add Session dialog box opens.
3.
Click the Use an existing session file radio button.
4.
Enter a name for the session.
5.
Browse to an existing session file location, which you would like to import into the current project.
6.
Click the OK button.
This operation can also be achieved by using the [File -> Import session].
To import an existing session using [File -> Import Session]
1.
Select [File -> Import Session]. The Session Name dialog box opens.
REJ10J2169-0100 Rev.1.00
Jul 01, 2010
Page 358 of 523
High-performance Embedded Workshop V.4.08
17. Debugging Facility
2.
Enter the new session name.
3.
Select the session file you wish to import into the new session.
4.
Click OK. A new session is added with the same settings as the file you browsed to but with the new name.
17.1.6.3 Importing a link to a session
You can add a new session to the High-performance Embedded Workshop system but link to the session file in its
location rather than importing or copying the file to the project directory. This is useful when sharing debugger
information with other users in a network environment.
To import a link to an existing session file
1.
Select [Debug -> Debug Sessions]. The Debug Sessions dialog box opens.
2.
Click the Add button. The Add new session dialog box opens.
3.
Click the Use an existing session file radio button.
4.
Enter a name for the session.
5.
Browse to an existing session file location, which you would like to import into the current project.
6.
Click the Open and maintain link to session file checkbox. This means the session will not be imported into
the project directory but instead the High-performance Embedded Workshop will link to the session location.
This file location was entered in step 5 and it will save all of the session data in this location.
7.
Click the OK button to close the Debug Sessions dialog box.
It is possible to make the link to session file read-only. This is useful if you are sharing debugger-setting files and you do
not want data to be modified accidentally.
To import a link to an existing session file and make it read-only
1.
Select [Debug -> Debug Sessions]. The Debug Sessions dialog box opens.
2.
Click the Add button. The Add new session dialog box opens.
3.
Click the Use an existing session file radio button.
4.
Enter a name for the session.
5.
Browse to an existing session file location, which you would like to import into the current project.
6.
Click the Open and maintain link to session file checkbox.
REJ10J2169-0100 Rev.1.00
Jul 01, 2010
Page 359 of 523
High-performance Embedded Workshop V.4.08
7.
17. Debugging Facility
Click the Make session file link read only checkbox. This means that the High-performance Embedded
Workshop will be unable to save changes to this session and will only be able to read the data when the session
is opened.
17.1.6.4 Removing a session
To remove a session
1.
Select [Debug -> Debug Sessions]. The Debug Sessions dialog box opens.
2.
Select the session you would like to remove.
3.
Click the Remove button.
4.
Click the OK button to close the Debug Sessions dialog box.
It is not possible to remove the current session.
17.1.6.5 Making a session read-only
To make a session read only
1.
Select [Debug -> Debug Sessions]. The Debug Sessions dialog box opens.
2.
Select the session you would like to view the properties for.
3.
Click the Properties button. The properties dialog is displayed.
4.
Click the Read only checkbox. This makes the link read only. This is useful if you are sharing debugger-setting
files and you do not want data to be modified accidentally.
5.
Click the OK button to close the Debug Sessions dialog box.
REJ10J2169-0100 Rev.1.00
Jul 01, 2010
Page 360 of 523
High-performance Embedded Workshop V.4.08
17. Debugging Facility
17.1.6.6 Saving session information
To save a session
Select [File -> Save Session].
If you have the Prompt before saving session checkbox checked, a dialog box is displayed which asks you whether you
wish to save the information. Clicking No loses the changes you made in the session. This checkbox is located in the
[Setup -> Options] dialog box on the Workspace tab.
To save a session with a different name
1.
Select [Debug -> Debug Sessions]. The Debug Sessions dialog box opens.
2.
Select the session you would like to save.
3.
Click the Save as button. The Save Session dialog box opens.
4.
Browse to the new file location.
5.
If you only want to export the session file to another location then leave the Maintain link checkbox
unchecked. If you would like High-performance Embedded Workshop to use this location instead of the current
session location then check the Maintain link checkbox.
6.
Click the OK button.
To save a session with a different name using [File -> Save Sessions As]
1.
Select [File -> Save Sessions As]. The Session Name dialog box opens.
2.
Enter the new session name.
3.
Click the OK button.
REJ10J2169-0100 Rev.1.00
Jul 01, 2010
Page 361 of 523
High-performance Embedded Workshop V.4.08
17. Debugging Facility
17.1.6.7 Reloading session information
To reload a session
Select [File -> Refresh Session].
Clicking this will lose any changes to your session currently and the reload the current session into High-performance
Embedded Workshop.
17.2
Viewing a program
This section describes how to look at your program as source code and assembly language mnemonics.
The source code will be shown in the source mode in two types of windows. The main features are:
Editor Window
•
A source file opened in the editor window can be edited.
•
When debugging and stepping through source code, each source file (which contains the current PC address) will be
opened in a separate window as you step through code from one file to another. When stepping into an area of
disassembly that has no associated source-code line, the source-mode will switch to disassembly mode.
Disassembly Window
•
Any source file opened in the Disassembly window is read-only and cannot be edited. The Disassembly window popup menu will contain a menu-item to open the current file for editing.
•
When debugging and stepping through source code, the Disassembly window will automatically switch to the
relevant source file (which contains the current PC address) making this simple for you when debugging. Whilst the
Disassembly window is open there will be no standard editor windows opened, the source files will be opened within
the Disassembly window view as necessary. When stepping into an area of disassembly that has no associated
source-code line, the source-mode will switch to disassembly mode.
•
You can use disassembly source-mode as primary debug view. If this facility is available, the following actions will
be performed:
•
If the Disassembly window is open and in Disassembly mode, then when a break occurs at a known source
address, the Disassembly window will switch to source-mode.
•
If the Disassembly window is open, then when a break occurs, no other editor windows are opened.
•
When a break occurs, the window order will not be changed automatically.
•
The position of the source file in the editor window is fixed.
If you wish to continue step in Disassembly mode of the Disassembly window, select the [Debug -> Step
mode -> Assembly].
REJ10J2169-0100 Rev.1.00
Jul 01, 2010
Page 362 of 523
High-performance Embedded Workshop V.4.08
17. Debugging Facility
Note:
After a break occurs, the High-performance Embedded Workshop displays the location of the program counter (PC). In
some cases, for example if a project has been moved from its original path, the source files may not be automatically
found. In this case the High-performance Embedded Workshop will open a source file browser dialog to allow you to
manually locate the file - this path will then be used to update any other source files in this debug project.
17.2.1
Opening the Editor window
To view a source file’s code, double-click on its icon in the file tree, or right-click on the source file and click the Open
option on the pop-up menu. The High-performance Embedded Workshop opens the file in the editor.
Toolbar
The editor in version 4.00 onwards has been enhanced to include an integrated disassembly view. This integrated view
has a toolbar which allows the switching of mode. When each mode is available it is possible to click the button and
change to the new view.
Three different modes are possible these are listed below:
Mode
Function
Source mode
This mode is the standard High-performance Embedded Workshop editor. It allows source file
editing and keywords are highlighted correctly if you are viewing source files.
This view allows line numbers, addresses, breakpoints, bookmarks, and source codes to be viewed.
Mixed mode
The mixed mode facility in a source file is different to the disassembly window mixed mode. Instead
of showing the continuous disassembly it shows the disassembly that is related to each line of
source code.
This view cannot be edited and is only available when the module is downloaded.
This view allows line numbers, breakpoints, address, object codes, labels, and mixed codes (for
showing both source and disassembly) to be viewed.
Disassembly mode The disassembly mode shows the true continuous disassembly code in address order. This is the
same as clicking [View -> Disassembly].
This view is only available when a target is attached to the session.
This view allows breakpoints, address, object codes, labels, and disassembled codes to be viewed.
REJ10J2169-0100 Rev.1.00
Jul 01, 2010
Page 363 of 523
High-performance Embedded Workshop V.4.08
17. Debugging Facility
Notes:
It is not possible to switch from the source view to the mixed display under the following conditions.
1.
The target is not connected to the current session.
2.
No download modules have been downloaded.
3.
No debug information is available for the current project.
4.
The currently displayed file has been edited and the changes not saved.
If an address included in the address range of a source file is then shifted to be in the range of another source file in View
Disassembly mode, selecting View Source mode or View mixed mode displays the Confirmation Request dialog box
shown below.
To open the new source file for the address, click Yes.
To view the source code in the previous mode, click No.
If you do not wish to select View Source mode or View mixed mode, click Cancel.
If you do not wish to open this confirmation dialog box, select the Don't ask this question again checkbox.
To open the confirmation dialog box again
1.
Select [Setup -> Options]. The Options dialog box opens.
2.
Select the Confirmation tab.
3.
Select the Switch from disassembly to new source checkbox. This checkbox is selected by default.
4.
Click OK.
REJ10J2169-0100 Rev.1.00
Jul 01, 2010
Page 364 of 523
High-performance Embedded Workshop V.4.08
17. Debugging Facility
17.2.1.1 Viewing the code
To view a source file’s code, click the View Source button.
Window configuration
•
Clicking another toolbar button switches the display mode. To view disassembly codes in mixed mode, click the
"View mixed mode" button. To view disassembly codes in disassembly mode, click the "View Disassembly"
button.
•
The columns listed in the table below are on the left of the "Source" field.
Column Name
Line
Source Address
•
Description
Displays the line number for the source file.
After your program has been downloaded, the editor window displays the
addresses for the current source file.
S/W Breakpoints
Display the PC location ( ), breakpoints ( ) and bookmark ( ). Setting PC
breakpoint by double-click.
The "Source" field includes codes highlighting the syntax.
Options
Right-clicking within the "Source" field opens a pop-up menu containing available options.
Pop-up Menu Option
Macro Recording Function
Build File "<File Name>"
Builds the selected files.
Open '<File Name>'
-
Opens a file shown in the editor window.
Cut
-
Removes highlighted text and places it on the Windows® clipboard.
Copy
-
Places a copy of the highlighted text into the Windows® clipboard.
Paste
-
Copies the contents of the Windows® clipboard into the active
window at the position of the insertion cursor.
REJ10J2169-0100 Rev.1.00
Jul 01, 2010
Page 365 of 523
High-performance Embedded Workshop V.4.08
17. Debugging Facility
Pop-up Menu Option
Macro Recording Function
Add File To Project
-
Adds the file to a project.
Go To Definition Of '<Navigation Item>'
Shows the positions where navigation items of #defines, C
functions, or C++ classes are defined.
List Members
-
While the smart editor function is enabled, selecting this option
displays an alphabetical list of C #defines, C functions, or C++
classes as a pop-up window. Double-clicking on an item copies this
character string and pastes it to the current cursor position.
Find
-
Finds text in the current file.
Replace
-
Replaces text in the current file.
Goto Line
-
Jumps to a line in a file.
Match Braces
-
Finds a matching brace.
Bookmarks Toggle Bookmark
-
Sets a bookmark at the current line or clears a bookmark at the
current line.
Next Bookmark
-
Jumps to the next bookmark in the current file from the current line.
Previous Bookmark -
Jumps to the previous bookmark in the current file from the current
line.
Clear All Bookmarks -
Clears all bookmarks in the current file.
Templates Define Templates
Insert Template
-
Defines a template.
Inserts a template.
Toggle Breakpoint
Sets or clears a software breakpoint at the line showing the address.
Enable/Disable Breakpoint
Enables or disables the current software breakpoint.
Define Column Format
-
Sets the status of editor and disassembly columns.
Columns
-
Sets the status of editor and disassembly columns.
Turn Header On/Off
-
Shows or hides the column header.
Instant Watch *
-
Launches the Instant Watch dialog box with the name extracted
from the view at the current text cursor (not mouse cursor) position.
Add Watch *
-
Adds the selected variable to the Watch window.
Column name
Go To Cursor
Starts executing the user program at the current PC and continues
until the PC equals the address indicated by the current text cursor
(not mouse cursor) position.
Set PC Here
Changes the value of the Program Counter (PC) to the address at
the row of the text cursor (not mouse cursor).
Display PC
-
Opens the source file or disassembly at the address of the PC.
View Disassembly
-
Opens a Disassembly window at the address mating the current
source line.
Properties
-
Displays file properties.
Note:
*. Support for this function depends on the debugger.
17.2.1.2 Viewing assembly-language code
The Disassembly mode shows at the same address of the cursor line as the Source mode. You can view assemblylanguage codes only when the debugger is connected
REJ10J2169-0100 Rev.1.00
Jul 01, 2010
Page 366 of 523
High-performance Embedded Workshop V.4.08
17. Debugging Facility
Window configuration
•
Clicking another toolbar button switches the display mode. To view disassembly codes in mixed mode, click the
"View mixed mode" button. To view source codes in source mode, click the "View Source" button.
•
The columns listed in the table below are on the left of the "Disassembly" field.
Column Name
S/W Breakpoints - ASM
•
Description
Display the PC location ( ), breakpoints ( ). Setting PC breakpoint by
double-click.
Disassembly Address
Display the disassembly address. Open the Set Address dialog box by
double-click. Enter the address to jump to.
Obj code
Display the object codes.
Label
Display the Labels. This column is not available if no module has been
downloaded.
Double-clicking the "Disassembly" field (in disassembly mode) opens the Assembler dialog box. Enter
assembly-language codes.
Options
Right-clicking within the "Disassembly" field opens a pop-up menu containing available options.
Pop-up Menu Option
Macro Recording Function
Refresh
-
Acquires the latest disassembly information to update the contents of
the window.
Lock Refresh
-
It is possible to lock a memory range in the disassembly (in disassembly
mode) so that it does not refresh.
View Source
-
Launches editor at location in source.
Set Address
-
Enters a new start address.
Go To Cursor
Display PC
Commences to execute the user program starting from the current PC
address. The program will continue to run until the PC reaches the
address indicated by the text cursor (not the mouse cursor) or another
break condition is satisfied.
-
Set PC Here
Edit
Changes the value of the PC to the address indicated by the text cursor
(not the mouse cursor).
-
REJ10J2169-0100 Rev.1.00
Jul 01, 2010
Displays the disassembled codes at the PC location.
Modifies the instruction at that address.
Page 367 of 523
High-performance Embedded Workshop V.4.08
17. Debugging Facility
Pop-up Menu Option
Macro Recording Function
Find in Range
-
Searches the range for the specified text string.
Copy
-
Places a copy of the highlighted text into the Windows® clipboard.
Define Column Format
-
Sets the status of editor and disassembly columns.
Turn Header On/Off
-
Shows or hides the column header.
Save Disassembly Text
-
Saves the specific range.
Print
-
Prints the specific range.
Toggle Breakpoint
Sets or clears a software breakpoint at the line showing the address.
Enable/Disable Breakpoint
Enables or disables the current software breakpoint.
17.2.1.3 Refreshing the disassembly view
Even if some external operation changes the memory contents shown in the Disassembly view, the High-performance
Embedded Workshop cannot detect the change. For example, if you use the external flash utility to program the range of
memory being displayed, the Disassembly view will not be reflected.
Right-click on the Disassembly filed (in disassembly mode) and select Refresh.
This acquires the latest information of the data being displayed and updates the contents of the view.
17.2.1.4 Disassembly lock refresh
It is possible to lock a memory range in the disassembly view so that it does not refresh. This function is called the
disassembly "lock refresh".
Right-click on the Disassembly field (in disassembly mode) and select Lock Refresh. The Lock Refresh dialog box will
be displayed.
Check the Locked check box. The controls should now enable.
Select the start and end address that should be locked and cached so that no updates are displayed. Click OK. The view
refreshes to only show the locked area.
17.2.1.5 Looking at a specific address
When you are looking at your program in a Disassembly view, you may want to look at another area of your program's
code. Rather than scrolling through a lot of code in the program, you can go directly to a specific address.
REJ10J2169-0100 Rev.1.00
Jul 01, 2010
Page 368 of 523
High-performance Embedded Workshop V.4.08
17. Debugging Facility
Right-click on the Disassembly field (in disassembly mode) and select the Set Address option. The Set Address dialog
box will be displayed.
Enter the address or label name in the edit box and either click the OK button or press the Enter key. The Disassembly
view updates to show the code at the new address. When an overloaded function or a class name is entered, the Select
Function dialog box opens for you to select a function (Support for this function depends on the debugger.).
17.2.1.6 Modifying assembly-language code
You can modify the assembly-language code in the disassembly view (in disassembly mode) by double-clicking on the
instruction that you wish to change. The Assembler dialog box will be displayed.
The address, machine code and disassembled instructions are shown. Type the new instruction or edit the old instruction
in the Mnemonic field. Pressing Enter will assemble the instruction into memory and move on to the next instruction.
Clicking the OK button will assemble the instruction into memory and close the dialog box. Clicking the Cancel button
or pressing ESC will close the dialog box.
Note:
The assembly-language display is disassembled from the actual machine code in the debugger's memory. If the memory
contents are changed the dialog box (and Disassembly view) will show the new assembly-language code, but the source
view will be unchanged. This is true even if the source file contains assembler.
17.2.1.7 Disassembly find in range
The disassembly find in range can be used to find a certain text string in the disassembly view between two addresses.
Right-click on the Disassembly field (in disassembly mode) and select Find in Range. The Find in Range dialog box
opens.
REJ10J2169-0100 Rev.1.00
Jul 01, 2010
Page 369 of 523
High-performance Embedded Workshop V.4.08
17. Debugging Facility
Enter your search string, the start and end address that should be searched. Click OK. The view then selects the first
instance of that string in the range.
Note:
Subsequent find operations will find strings only in the paged disassembly area not the complete range.
17.2.1.8 Saving disassembly text
The contents of the disassembly view can be saved by using the Save Disassembly Text menu from the Disassembly
field (in disassembly mode) pop-up menu.
When Save Disassembly Text is selected the Save Disassembly Text dialog box is displayed that asks you the range of
addresses to save.
Both a start and end address should be supplied. You also need to specify the full filename to save the information to. If
needed you can browse to the file to use. Click OK.
17.2.1.9 Printing the disassembly view
The disassembly view can be printed by using [File -> Print] or the Print toolbar button (
using the menu Print on the Disassembly field (in disassembly mode) pop-up menu.
) when it is in focus or by
When Print is selected the Disassembly Print Range dialog box is displayed that asks you the range of addresses to
print.
REJ10J2169-0100 Rev.1.00
Jul 01, 2010
Page 370 of 523
High-performance Embedded Workshop V.4.08
17. Debugging Facility
Both a start and end address should be supplied.
Clicking OK on this dialog box then passes the print selection to the standard print formatting and selection dialog box.
From here you can choose your printer and page setup options.
17.2.2
Opening the Disassembly window
If you wish to view code at assembly-language level, then select one of the following operations:
•
Choose [View -> Disassembly], OR
•
Press CTRL+D, OR
•
Click on the View Disassembly toolbar button (
).
The Disassembly window opens at the current program counter (PC) location.
Toolbar
The disassembly window in version 4.02 onwards has been enhanced to include a source view.
This integrated view has a toolbar which allows the switching of mode. When each mode is available it is possible to
click the button and change to the new view.
REJ10J2169-0100 Rev.1.00
Jul 01, 2010
Page 371 of 523
High-performance Embedded Workshop V.4.08
17. Debugging Facility
Three different modes are possible these are listed below:
Mode
Function
Source mode
The source file relating to the current PC address will be opened if available.
It allows keywords are highlighted correctly if you are viewing source files.
This view is read-only and cannot be edited.
This view is only available when the module is downloaded.
This view allows line numbers, address, breakpoints, and source codes to be viewed.
Mixed mode
The mixed mode facility in the disassembly window is different to a source file mixed mode. Instead
of showing the continuous disassembly it shows the disassembly that is related to each line of
source code.
This view can be edited the assembly-language code and is only available when the module is
downloaded.
This view allows breakpoints, address, object codes, labels, and disassembled codes to be viewed.
Disassembly mode The disassembly mode shows the true continuous disassembly code in address order.
This view can be the assembly-language code and is only available when a target is attached to
the session.
This view allows breakpoints, address, object codes, labels, and disassembled codes to be viewed.
17.2.2.1 Viewing the code
When switching to the source mode from within the disassembly window, the source file relating to the current PC
address will be opened if available. Otherwise either the most recently open disassembly window source file will be reopened where possible or a prompt will be given to select a source file to be opened.
Any text-based files may be opened in the disassembly window and not just project source files. Any source file opened
in the disassembly window is read-only and cannot be edited; it is only intended for the viewing and debugging of source
files.
This view is only available when the module is downloaded.
Window configuration
REJ10J2169-0100 Rev.1.00
Jul 01, 2010
Page 372 of 523
High-performance Embedded Workshop V.4.08
17. Debugging Facility
•
Clicking another toolbar button switches the display mode. To view disassembly codes in mixed mode, click the
"View mixed mode" button. To view disassembly codes in disassembly mode, click the "View Disassembly"
button.
•
The columns listed in the table below are on the left of the "Source" field.
Column Name
Line
Source Address
•
Description
Displays the line number for the source file.
After your program has been downloaded, the source view displays the addresses
for the current source file.
S/W Breakpoints
Display the PC location ( ), and breakpoints ( ). Setting PC breakpoint by
double-click.
The "Source" field includes codes highlighting the syntax.
Options
Right-clicking within the "Source" field opens a pop-up menu containing available options.
Pop-up Menu Option
Macro Recording Function
Open Source File For Editing -
Opens an editor window containing the file for editing.
Open File in Source Mode
-
Opens a file shown in the disassembly window.
Copy
-
Places a copy of the highlighted text into the Windows® clipboard.
Go To Definition Of
'<Navigation Item>'
-
Shows the positions where navigation items of #defines, C functions,
or C++ classes are defined.
Find
-
Finds text in the current file.
Goto Line
-
Jumps to a line in a file.
Toggle Breakpoint
Sets or clears a software breakpoint at the line showing the address.
Enable/Disable Breakpoint
Enables or disables the current software breakpoint.
Turn Header On/Off
Shows or hides the column header.
Define Column Format
-
Sets the status of editor and disassembly columns.
Columns Column name
-
Sets the status of editor and disassembly columns.
Instant Watch *
-
Launches the Instant Watch dialog box with the name extracted from
the view at the current text cursor (not mouse cursor) position.
Add Watch *
-
Adds the selected variable to the Watch window.
Set Address
-
Enters a new start address.
Go To Cursor
Starts executing the user program at the current PC and continues
until the PC equals the address indicated by the current text cursor
(not mouse cursor) position.
Set PC Here
Changes the value of the PC to the address at the row of the text
cursor (not mouse cursor).
Display PC
-
Opens the source file or disassembly at the address of the PC.
Properties
-
Displays file properties.
Note:
Support for this function depends on the debugger.
REJ10J2169-0100 Rev.1.00
Jul 01, 2010
Page 373 of 523
High-performance Embedded Workshop V.4.08
17. Debugging Facility
17.2.2.2 Opening a source file for editing
The Disassembly source-mode allows only to view and debug source files, and no editing is permitted from within this
view.
To edit a source file that is currently open in the Disassembly source-mode view, the pop-up menu option Open Source
File for Editing must be selected. This will open an editor window containing the file for editing.
Alternatively you may open the file for editing manually via the Workspace Window or by the main menu [File ->
Open].
17.2.2.3 Opening a source file in the Disassembly window
Opening a source file is possible by selecting Open File in Source Mode from the pop-up menu in Disassembly
window. This menu option is available on the pop-up menu in all view-modes within the Disassembly window.
Upon selecting this menu option a file-browse dialog will be displayed prompting for the source file to be opened. Any
text-based file may be selected and not just source files.
17.2.2.4 Using disassembly source-mode as primary debug view
It is possible to use disassembly source-mode as primary debug view.
To use disassembly source-mode as primary debug view
1.
Select [Setup -> Options]. The Options dialog box opens.
2.
Select the Debug tab.
3.
Select the Use disassembly source-mode as primary debug view checkbox. By default, this checkbox is not
selected.
4.
Click OK.
If this option is set, the following actions will be performed:
•
If the Disassembly window is open and in Disassembly mode, then when a break occurs at a known source
address, the Disassembly window will switch to source-mode.
•
If the Disassembly window is open, then when a break occurs, no other editor windows are opened.
•
When a break occurs, the window order will not be changed automatically.
•
The position of the source file in the editor window is fixed.
If you wish to continue step in Disassembly mode of the Disassembly window, select [Debug -> Step mode ->
Assembly].
REJ10J2169-0100 Rev.1.00
Jul 01, 2010
Page 374 of 523
High-performance Embedded Workshop V.4.08
17. Debugging Facility
17.2.2.5 Viewing assembly-language code
The Disassembly mode shows at the current PC location. You can view assembly-language codes only when the
debugger is connected.
Window configuration
•
Clicking another toolbar button switches the display mode. To view disassembly codes in mixed mode, click the
"View mixed mode" button. To view source codes in source mode, click the "View Source" button.
•
The columns listed in the table below are on the left of the "Disassembly" field.
Column Name
S/W Breakpoints - ASM
•
Description
Display the PC location ( ), breakpoints ( ). Setting PC breakpoint by
double-click.
Disassembly Address
Display the disassembly address. Open the Set Address dialog box by
double-click. Enter the address to jump to.
Obj code
Display the object codes.
Label
Display the Labels. This column is not available if no module has been
downloaded.
Double-clicking the "Disassembly" field opens the Assembler dialog box. Enter assembly-language codes.
Options
Right-clicking within the "Disassembly" field opens a pop-up menu containing available options.
Pop-up Menu Option
Macro Recording Function
Open File in Source Mode
-
Opens a file shown in the disassembly window.
Refresh
-
Acquires the latest disassembly information to update the contents of
the window.
Lock Refresh
-
It is possible to lock a memory range in the disassembly so that it does
not refresh.
View Source
-
Launches editor at location in source.
Set Address
-
Enters a new start address.
REJ10J2169-0100 Rev.1.00
Jul 01, 2010
Page 375 of 523
High-performance Embedded Workshop V.4.08
Pop-up Menu Option
Macro Recording Function
Go To Cursor
Display PC
17. Debugging Facility
Commences to execute the user program starting from the current PC
address. The program will continue to run until the PC reaches the
address indicated by the text cursor (not the mouse cursor) or another
break condition is satisfied.
-
Set PC Here
Displays the disassembled codes at the PC location.
Changes the value of the PC to the address indicated by the text cursor
(not the mouse cursor).
Edit
-
Modifies the instruction at that address.
Find in Range
-
Searches the range for the specified text string.
Copy
-
Places a copy of the highlighted text into the Windows® clipboard.
Define Column Format
-
Sets the status of editor and disassembly columns.
Turn Header On/Off
-
Shows or hides the column header.
Save Disassembly Text
-
Saves the specific range.
Print
-
Prints the specific range.
Toggle Breakpoint
Sets or clears a software breakpoint at the line showing the address.
Enable/Disable Breakpoint
Enables or disables the current software breakpoint.
17.2.2.6 Refreshing the disassembly view
Even if some external operation changes the memory contents shown in the Disassembly view, the High-performance
Embedded Workshop cannot detect the change. For example, if you use the external flash utility to program the range of
memory being displayed, the Disassembly view will not be reflected.
Right-click on the Disassembly filed (in disassembly mode or mixed mode) and select Refresh.
This acquires the latest information of the data being displayed and updates the contents of the view.
17.2.2.7 Disassembly lock refresh
It is possible to lock a memory range in the disassembly view so that it does not refresh. This function is called the
disassembly "lock refresh".
Right-click on the Disassembly field (in disassembly mode or mixed mode) and select Lock Refresh. The Lock Refresh
dialog box will be displayed.
Check the Locked check box. The controls should now enable.
REJ10J2169-0100 Rev.1.00
Jul 01, 2010
Page 376 of 523
High-performance Embedded Workshop V.4.08
17. Debugging Facility
Select the start and end address that should be locked and cached so that no updates are displayed. Click OK. The view
refreshes to only show the locked area.
17.2.2.8 Looking at a specific address
When you are looking at your program in a Disassembly window, you may want to look at another area of your
program's code. Rather than scrolling through a lot of code in the program, you can go directly to a specific address.
Right-click on the Source field or the Disassembly field and select the Set Address option. The Set Address dialog box
will be displayed.
Enter the address or label name in the edit box and either click the OK button or press the Enter key. The Disassembly
view updates to show the code at the new address. When an overloaded function or a class name is entered, the Select
Function dialog box opens for you to select a function (Support for this function depends on the debugger.).
When the Disassembly window is in source-mode, and an address is entered which is source-related but not in the
currently open source file, the related source file will automatically be opened in the source-mode. If an address is
specified which is not source-related, Disassembly view will switch mode to disassembly mode in order to view the
specified address.
17.2.2.9 Modifying assembly-language code
You can modify the assembly-language code in the disassembly view (in disassembly mode or mixed mode) by doubleclicking on the instruction that you wish to change. The Assembler dialog box will be displayed.
The address, machine code and disassembled instructions are shown. Type the new instruction or edit the old instruction
in the Mnemonic field. Pressing Enter will assemble the instruction into memory and move on to the next instruction.
Clicking the OK button will assemble the instruction into memory and close the dialog box. Clicking the Cancel button
or pressing ESC will close the dialog box.
REJ10J2169-0100 Rev.1.00
Jul 01, 2010
Page 377 of 523
High-performance Embedded Workshop V.4.08
17. Debugging Facility
Note:
The assembly-language display is disassembled from the actual machine code in the debugger's memory. If the memory
contents are changed the dialog box (and Disassembly view) will show the new assembly-language code, but the source
view will be unchanged. This is true even if the source file contains assembler.
17.2.2.10
Disassembly find in range
The disassembly find in range can be used to find a certain text string in the disassembly view between two addresses.
Right-click on the Disassembly field (in disassembly mode or mixed mode) and select Find in Range. The Find in
Range dialog box opens.
Enter your search string, the start and end address that should be searched. Click OK. The view then selects the first
instance of that string in the range.
Note:
Subsequent find operations will find strings only in the paged disassembly area not the complete range.
17.2.2.11
Saving disassembly text
The contents of the disassembly view can be saved by using the Save Disassembly Text menu from the Disassembly
field (in disassembly mode or mixed mode) pop-up menu.
When Save Disassembly Text is selected the Save Disassembly Text dialog box is displayed that asks you the range of
addresses to save.
REJ10J2169-0100 Rev.1.00
Jul 01, 2010
Page 378 of 523
High-performance Embedded Workshop V.4.08
17. Debugging Facility
Both a start and end address should be supplied. You also need to specify the full filename to save the information to. If
needed you can browse to the file to use. Click OK.
17.2.2.12
Printing the disassembly view
The disassembly view can be printed by using [File -> Print] or the Print toolbar button ( ) when it is in focus or by
using the menu Print on the Disassembly field (in disassembly mode or mixed mode) pop-up menu.
When Print is selected the Disassembly Print Range dialog box is displayed that asks you the range of addresses to
print.
Both a start and end address should be supplied.
Clicking OK on this dialog box then passes the print selection to the standard print formatting and selection dialog box.
From here you can choose your printer and page setup options.
17.2.3
Looking at the current PC position
To automatically display the program counter (PC) click the Display PC toolbar button (
Display PC]. This will open the editor or disassembly at the current PC.
17.2.4
), or select [Debug ->
Highlighting the line at the PC
In the Editor and Disassembly windows, an icon in the S/W Breakpoints column indicates the PC location. The source
or assembly-language code at the PC can be highlighted.
To highlight the line at the PC location
1.
Select [Setup -> Options]. The Options dialog box opens.
2.
Select the Debug tab.
3.
Select the Enable line highlight for PC position checkbox. By default, this checkbox is selected.
4.
Click OK.
REJ10J2169-0100 Rev.1.00
Jul 01, 2010
Page 379 of 523
High-performance Embedded Workshop V.4.08
17. Debugging Facility
The color of the line can be customized in the Format Views dialog box. The text (foreground) is in black and the
background color is yellow by default.
To change the colors of the line at the PC
1.
Select [Setup -> Format Views]. The Format Views dialog box opens.
2.
Select an item, for which you wish to change the color, from the left-hand tree in the dialog box and expand it.
•
If you are opening the editor window or disassembly window in source mode, select Source and expand it.
•
If you are opening the editor window or disassembly window in mixed mode or disassembly mode, select
Disassembly and expand it.
3.
Select the PC Line Highlight category.
4.
Change the selection in the Foreground and Background lists of the Color tab.
5.
Click OK.
17.3
Operating memory
This section describes how to look at memory areas in the CPU's address space. How to look at a memory area in
different formats, how to fill and move a memory block, and how to load and verify a memory area with a disk file are
described.
17.3.1
Opening the Memory window
The Memory window displays the contents of contiguous memory areas.
To open the Memory window, choose [View -> CPU -> Memory], or click the Memory toolbar button (
).
You can specify the display start address and the scroll range at opening. The Display Address dialog box opens. Enter
the Display Address, Scroll Start Address and Scroll End Address.
REJ10J2169-0100 Rev.1.00
Jul 01, 2010
Page 380 of 523
High-performance Embedded Workshop V.4.08
17. Debugging Facility
Click the OK button or press the Enter key, and the dialog box closes and the Memory window opens. The display can
be scrolled within the range of the entered display scroll start and end addresses.
Window configuration
•
The Label and Register columns are hidden by default.
•
The Label column shows the name of the label allocated to the first address of the memory data displayed on
this row.
•
The Register column shows the name of the register allocated to the first address of the memory data displayed
on this row.
•
'+n' in the column header of the Data column means the offset value from the first address of the row.
•
The column header of the Code column shows the code name.
•
Double-clicking the Address or Label column opens a dialog box, which allows you to change first address to
be displayed..
•
Double-clicking on the Data or Code column opens a dialog box, which allows you to change the memory data
at the selected address. Changing of the value can be recorded in a macro (Macro Recording).
•
Values in the Address, Data, and Code columns can be changed by in-place editing. (Macro Recording)
Options
Right-clicking displays a pop-up menu containing available options.
A basic operation is allocated to the toolbar.
The Toolbar display and Customize toolbar options are also included in the pop-up menu opened by right-clicking on the
toolbar.
Pop-up Menu Option
Toolbar Macro
Function
Button Recording
Set
Sets data at specified address.
Fill
Fills specified memory block with data.
REJ10J2169-0100 Rev.1.00
Jul 01, 2010
Page 381 of 523
High-performance Embedded Workshop V.4.08
Pop-up Menu Option
17. Debugging Facility
Toolbar Macro
Function
Button Recording
Move
Moves specified memory block to.
Compare *1
Compares the contents of two memory blocks.
Test *1
-
Tests an area of memory.
Save Memory contents
-
Saves memory contents in a text file.
Search *1
-
Finds a value in memory.
Search Next *1
-
Finds a next value in memory.
Address
-
Specifies the display start address.
-
Specifies scroll range.
-
Starts address to value of the register.
Followed Stack Pointer *1
-
Keeps tracking of the stack pointer position.
Set Start Up Symbol
-
Changes the program display position immediately after
downloading.
Refresh
-
Refreshes the Memory window.
-
Disables refresh of the Memory window.
Auto Refresh *2
-
Regularly refreshes the Memory window.
Refresh Interval *2
-
Specifies the refresh interval.
Data
Length
1byte
-
Data is displayed in 1 byte unit.
2bytes
-
Data is displayed in 2-bytes units.
4bytes
-
Data is displayed in 4-bytes units.
8bytes
-
Data is displayed in 8-bytes units.
Hex
-
Data is displayed in hexadecimal.
Dec
-
Data is displayed in decimal.
Signed Dec
-
Data is displayed in signed decimal.
Oct
-
Data is displayed in octal.
Bin
-
Data is displayed in binary.
ASCII
-
Displays memory data as ASCII characters (default).
Not supported.
Scroll Area
Register *1
(xxxxx)
-
Lock Refresh
Radix
Code
-
SJIS
-
-
JIS
-
-
-
-
-
-
-
-
UNICODE UTF-8
UTF-16
EUC
Float
Complex
Float
-
Displays memory data as single-precision floating-point
values.
Double
-
Displays memory data as double-precision floating-point
values.
Float Complex
-
Displays complex numbers as single-precision floating-point
values.
Double
Complex
-
Displays complex numbers as double-precision floatingpoint values.
Float
Imaginary
-
Displays imaginary numbers as single-precision floatingpoint values.
Double
Imaginary
-
Displays imaginary numbers as double-precision floatingpoint values.
REJ10J2169-0100 Rev.1.00
Jul 01, 2010
Page 382 of 523
High-performance Embedded Workshop V.4.08
Pop-up Menu Option
Fixed
Layout
Toolbar Macro
Function
Button Recording
16bit Fixed
-
Displays memory data as 16 bit fixed.
32bit Fixed
-
Displays memory data as 32 bit fixed.
24bit Accum
-
-
Displays memory data as 24 bit accumulate.
40bit Accum
-
-
Displays memory data as 40 bit accumulate.
Label
-
Switches display or non-display of Label area.
Register
-
Switches display or non-display of Register area.
Code
-
Switches display or non-display of Code area.
-
Changes the number of digits displayed.
-
Switches display or non-display of measurement result.
Column
Coverage
*1
17. Debugging Facility
Enable
Save
Saves memory contents in a file.
Load
Loads a memory area contents from a file.
Split
-
-
Splits up the window display.
Toolbar display
-
-
Shows or hides the toolbar.
Customize toolbar
-
-
Customizes toolbar buttons.
Note:
*1. Support for this function depends on the debugger.
*2. Available only when the debugger supports this function.
17.3.2
Setting data at a desired address in the Memory window
To set data at a desired address in the Memory window, follow the procedure below.
•
In-place edit in the Data column.
•
In-place edit in the Code column.
•
To change the contents of memory, open the Set dialog box by selecting one of the following operations:
o
Double-click the Data column you want to change, OR
o
Double-click the Code column you want to change, OR
REJ10J2169-0100 Rev.1.00
Jul 01, 2010
Page 383 of 523
High-performance Embedded Workshop V.4.08
o
17. Debugging Facility
Select the data you want to change and choose Set from the pop-up menu.
Enter the value (value or character) to be set in the Data field. Select the Verify check box. Support for verify
function depends on the debugger.
When setting the value
Click the Value button in the Data Type group. Specify the data length in the Length field.
When setting the character
Click the String button in the Data Type group.
17.3.3
Selecting a memory range
If the memory address range is in the Memory view, you can select the range by clicking on the first memory unit
(depending on your Memory view display choice) and dragging the mouse to the last unit. The selected range is
highlighted.
REJ10J2169-0100 Rev.1.00
Jul 01, 2010
Page 384 of 523
High-performance Embedded Workshop V.4.08
17.3.4
17. Debugging Facility
Filling an area of memory with constant data
You can set the contents of a range of memory addresses to a value using the memory fill feature. Select an address range
to fill in the Memory window by dragging the mouse. Choose Fill from the pop-up menu of the memory window. The
Fill dialog box opens.
Enter the data (value or character) to be filled in the Data field.
Select the Verify check box. Support for verify function depends on the debugger.
If you did not drag the address range to be filled, you must enter the start/end address. The end address can also be
prefixed by a plus (+); the end address will become the (start address) + (entered value).
When specifying the value
Click the Value button in the Data Type group. Specify the data length in the Length field.
When setting the character
Click the String button in the Data Type group.
When the display data length is two bytes, two bytes' worth of a character can be specified.
Please use the Set dialog box to specify the character string. (Select menu Set)
REJ10J2169-0100 Rev.1.00
Jul 01, 2010
Page 385 of 523
High-performance Embedded Workshop V.4.08
17.3.5
17. Debugging Facility
Copying an area of memory
You can copy an area of memory using the memory copy feature. Select a copy-source address range in the Memory
window by dragging the mouse. Choose Move from the pop-up menu of the memory window. The Move dialog box
opens.
Enter the copy destination start address in the Move Address field.
Select the Verify check box. Support for verify function depends on the debugger.
If you did not drag the copy-source address range, you must enter the start/end address. The end address can also be
prefixed by a plus (+); the end address will become the (start address) + (entered value).
Drag and Drop
Type of dropped data
Operation
Selected range on the Memory Window's Data column Copy the contents of a selected range of data to an area
starting from the dropped position.
17.3.6
Comparing the memory contents
The contents of two memory blocks can be compared. Select a source address range in the Memory window by dragging
the mouse. Choose Compare from the pop-up menu of the memory window. The Compare Memory dialog box opens.
REJ10J2169-0100 Rev.1.00
Jul 01, 2010
Page 386 of 523
High-performance Embedded Workshop V.4.08
17. Debugging Facility
Enter the start address of the destination memory area in the Compare Address field and the data length in the Data
Length field. If you did not drag the comparison-source address range, you must enter the start/end address. The end
address can also be prefixed by a plus (+); the end address will become the (start address) + (entered value).
If there is a mismatch, the address where it was found is displayed in a message box.
When the contents of the two memory areas match at comparison, the message "Comparison successful." appears.
Support for this function depends on the debugger.
17.3.7
Testing an area of memory
You can test an area of memory in the address space using the Memory Test feature. Select an address range to test in
the Memory window by dragging the mouse. Choose the Test option from the pop-up menu of the memory window. The
Test Memory dialog box opens.
If you did not drag the address range to be tested, you must enter the start/end address. The end address can also be
prefixed by a plus (+); the end address will become the (start address) + (entered value).
Support for this function depends on the debugger.
Note:
The exact test is target dependent. However, in all cases the current contents of the memory will be overwritten - YOUR
PROGRAM OR DATA WILL BE ERASED.
17.3.8
Saving memory contents in a text file
You can save an area of memory in the address space to a text file using the Save Memory Contents feature. Select an
address range to save in the Memory window by dragging the mouse. Choose Save Memory contents from the pop-up
menu of the memory window. The Save memory contents dialog box opens.
Select the output range in Memory Save Area, data format in Data Length, number of digits in Column, radix in
Radix. It is possible to select showing/hiding of the Label column and Register column by Output the label column and
Output the register column, respectively.
If you did not drag the address range to be saved, you must enter the output range.
REJ10J2169-0100 Rev.1.00
Jul 01, 2010
Page 387 of 523
High-performance Embedded Workshop V.4.08
17.3.9
17. Debugging Facility
Finding a value in memory
You can find a value in memory using the Search Memory feature. Select an address range to search in the Memory
window by dragging the mouse. Choose Search from the pop-up menu of the memory window. The Search memory
dialog box opens.
Enter a value you want to find in Data and select the data format in Search Data As.
If "pattern" is selected as the Search Data As, a byte string of up to 256 bytes or less (512 characters or less) can be
searched for. Specify the data for each byte with two characters.
Search conditions other than pattern search are data match/mismatch and search direction. Note that only data match and
forward direction can be selected with pattern search.
If you did not drag the address range to be found, you must enter the start/end address.
The end address can also be prefixed by a plus sign (+), which will use the entered value as a range.
If the data is found, the data which has been found is highlighted in the Memory window. If Search Next is selected
from the pop-up menu in the state where data has been found, the search will continue from the next address.
Support for this function depends on the debugger.
REJ10J2169-0100 Rev.1.00
Jul 01, 2010
Page 388 of 523
High-performance Embedded Workshop V.4.08
17. Debugging Facility
17.3.10 Changing the display address
Use the scroll bar, Page Up/Page Down key and Up/Down key to change the display position.
To change the display address directly, follow the procedure below.
1.
In-place edit in the Address column.
2.
To change the display address, open the Display Address dialog box by selecting one of the following
operations:
•
Double-click the Address column you want to change, OR
•
Choose Address from the pop-up menu.
Specify the displaying address in the Address field.
Drag and Drop
Manipulation
Operation
Select address on Memory Window's Address area and
drop it into another Memory Window's Address column
Changes the window's display start address to that address.
Select variable name (text string) and drop it into Memory Changes the window's display start address to that address.
Window's Address column
17.3.11 Changing the scroll area
Select Scroll Area from the pop-up menu of the memory window. The Scroll Area dialog box opens.
REJ10J2169-0100 Rev.1.00
Jul 01, 2010
Page 389 of 523
High-performance Embedded Workshop V.4.08
17. Debugging Facility
Specify the scroll range to be displayed. By default, the scroll range is set to 0 to the maximum address of MCU.
17.3.12 Starting address to value of the register
Select the register from the followings in the pop-up menu Register of the memory window.
Support for this function depends on the debugger.
17.3.13 Tracking the stack pointer position
The memory window has a function that alters the display address while tracking the stack pointer position (By default,
the display does not track the stack pointer position.). To track the stack pointer position, choose Followed Stack
Pointer from the pop-up menu of the memory window. The Followed Stack Pointer dialog box opens.
Select the stack pointer to track from the drop-down list box. The Memory Window has its display addresses
automatically altered by tracking the selected stack pointer position. Selecting "Not Following" in the Followed Stack
Pointer dialog box causes the debugger to stop tracking the stack pointer position.
Support for this function depends on the debugger.
17.3.14 Changing the program display position immediately after downloading
To specify the source file position, select Set Start Up Symbol option from pop-up menu of the memory window. The
Set start up symbol dialog box opens.
Input start up symbol to drop-down list box.
REJ10J2169-0100 Rev.1.00
Jul 01, 2010
Page 390 of 523
High-performance Embedded Workshop V.4.08
17. Debugging Facility
17.3.15 Refreshing the Memory window
The Memory window contents can be forcibly refreshed. Selecting Refresh from the pop-up menu of the Memory
window.
17.3.16 Disabling refresh of the Memory window
Automatic refresh of the Memory window, which is performed when user program execution stops and in other cases,
can be disabled.
Select Lock Refresh from the pop-up menu of the Memory window. While Lock Refresh is active, the contents of the
Memory window are grayed-out.
Auto Refresh in the Memory window cannot be used with Lock Refresh.
17.3.17 Regularly refreshing the Memory window
If you select Auto Refresh from the pop-up menu of the Memory window, the Memory window will regularly be
refreshed while the user program is running.
The actual refresh interval is shown on the leftmost column header in the Memory window.
Support for this function depends on the debugger.
To specify the refresh interval, select Refresh Interval from the pop-up menu. This item is only selectable when it is
supported by the debugger.
Lock Refresh in the Memory window cannot be used with Auto Refresh.
17.3.18 Specifying the refresh interval
You can specify the interval to refresh the Memory window while the user program is running.
Support for this function depends on the debugger.
REJ10J2169-0100 Rev.1.00
Jul 01, 2010
Page 391 of 523
High-performance Embedded Workshop V.4.08
17. Debugging Facility
To specify the refresh interval
1.
Right-click within the window to open a pop-up menu.
2.
Select Refresh Interval. The Auto Refresh Interval dialog box opens.
3.
Specify the refresh interval in 10-ms units. The default value and valid range vary depending on the debugger.
The refresh interval can be specified for each Memory window.
After Auto Refresh is activated, the actual refresh interval is shown on the leftmost column header in the Memory
window during execution of the user program.
The actual refresh interval may be longer than the specified value depending on the state of execution.
17.3.19 Changing the data length
Select the data length from the followings in the pop-up menu Data Length of the memory window.
Either the following can be specified.
1byte
2bytes
4bytes
8bytes
Displays in 1-byte units (default).
Displays in 2-bytes units.
Displays in 4-bytes units.
Displays in 8-bytes units.
17.3.20 Changing the radix
Select the data radix from the followings in the pop-up menu Radix of the memory window.
Either the following can be specified.
Hex
Dec
Signed Dec
Oct
Bin
Displays in hexadecimal (default).
Displays in decimal.
Displays in signed decimal.
Displays in octal.
Displays in binary.
REJ10J2169-0100 Rev.1.00
Jul 01, 2010
Page 392 of 523
High-performance Embedded Workshop V.4.08
17. Debugging Facility
17.3.21 Changing the code
Select the code from the followings in the pop-up menu Code of the memory window.
Either the following can be specified.
ASCII
SJIS
JIS
UNICODE
EUC
Float
Complex
Fixed
Displays memory data as ASCII characters (default).
Not supported.
Not supported.
UTF-8
Not supported.
UTF-16
Not supported.
Not supported.
Float
Displays memory data as single-precision floating-point values.
Double
Displays memory data as double-precision floating-point values.
Float Complex
Displays complex numbers as single-precision floating-point values.
Double Complex
Displays complex numbers as double-precision floating-point values.
Float Imaginary
Displays imaginary numbers as single-precision floating-point values.
Double Imaginary
Displays imaginary numbers as double-precision floating-point values.
16bit Fixed
Displays memory data as 16bit fixed.
32bit Fixed
Displays memory data as 32bit fixed.
24bit Accum
Displays memory data as 24bit accumulate.
40bit Accum
Displays memory data as 40bit accumulate.
17.3.22 Setting the layout
Select the layout from the followings in the pop-up menu Layout of the memory window.
The followings can be selected:
Label
Register
Code
Switches display or non-display of the Label column.
Switches display or non-display of the Register column.
Switches display or non-display of the Code column.
When the label, register or code is shown, the option is checked.
When the Label, Register and Code columns are hidden:
REJ10J2169-0100 Rev.1.00
Jul 01, 2010
Page 393 of 523
High-performance Embedded Workshop V.4.08
17. Debugging Facility
17.3.23 Changing the number of digits displayed
Choose Column from the pop-up menu of the memory window. The Set Column dialog box opens.
Specify the number of digits in which you want data to be displayed (1-256).
17.3.24 Switching display or non-display of measurement result
In the memory window, a display of coverage measurement is set to "Disable" by default. To enable the display, select
[Coverage -> Enable] from the pop-up menu of the memory window. In the Memory window, the background of the
executed lines is displayed in sky blue, and the background of the unexecuted lines is displayed in gray.
During coverage measurement, the default foreground and background colors of the executed codes are black and light
blue, respectively, while those of the codes not executed are black and gray. The colors in both cases can be customized
in the Format Views dialog box.
For detail, see section 17.3.29, Changing text colors.
Support for this function depends on the debugger.
17.3.25 Saving an area of memory
You can save an area of memory in the address space to a disk file using the Save Memory feature. Select an address
range to save in the Memory window by dragging the mouse. Choose Save from the pop-up menu of the memory
window. The Save Memory As dialog box opens
(This operation can also be achieved by selecting [Debug -> Save Memory].)
REJ10J2169-0100 Rev.1.00
Jul 01, 2010
Page 394 of 523
High-performance Embedded Workshop V.4.08
17. Debugging Facility
If you did not drag the address range to be saved, you must enter the start/end address. The end address can also be
prefixed by a plus sign (+), which will use the entered value as a range.
Enter the file format in File format, file name in Filename, and access size in Access size. The File name drop-down
list contains the last four filenames used for saving memory. Alternatively, click the "..." button to launch a standard Save
As dialog box. The access size for saving data can be selected from the Access size drop-down list. When the data is
saved in memory with little endian, the order of data depends on the access size.
When the file save is complete a confirmation message box will be displayed.
17.3.26 Loading a memory area from a file
A file can be loaded to the debugger’s memory. Choose Load from the pop-up menu of the memory window. The Load
Program dialog box opens.
REJ10J2169-0100 Rev.1.00
Jul 01, 2010
Page 395 of 523
High-performance Embedded Workshop V.4.08
17. Debugging Facility
Enter the file format in File format, file name in Filename, offset address in Offset address, and access size in Access
size. To verify memory, check Perform memory verify during download. If the load address value is to be changed,
enter the offset value in the Offset field, otherwise enter 0.
17.3.27 Splitting up the window display
To vertically divide the Memory window display into two, select Split from the pop-up menu and move the split-up bar.
To cancel the split-up display, select Split from the pop-up menu again.
17.3.28 Verifying a memory area
A memory area in the address space can be verified using the memory verify function. Choose [Debug -> Verify
Memory]. The Verify Memory dialog box opens.
Enter the file format in File format, file name in Filename, offset address in Offset address, and access size in Access
size.
The message “File verified OK” appears when verification is successful. If the verification failed, “Verify failed”
appears.
Support for this function depends on the debugger.
17.3.29 Changing text colors
The color and font of the data or codes shown in the Memory window can be customized in the Format Views dialog
box (in the same manner as the color and font in other windows). Now it is also possible to customize the color of the
changed values or accessed memory, which are shown in the data or code field of the Memory window, in the Format
Views dialog box.
REJ10J2169-0100 Rev.1.00
Jul 01, 2010
Page 396 of 523
High-performance Embedded Workshop V.4.08
17. Debugging Facility
To change the look of the Memory window
1.
Select [Setup -> Format Views]. The Format Views dialog box opens.
2.
Select the Memory item in the tree and expand it.
3.
Select the category of objects to be customized.
Category
Objects to be Customized
Foreground
Background
color (default) color (default)
Normal
Text shown in the windows
Black
White
Accessed *
During coverage measurement: Executed codes
Black
Sky blue
Not Accessed *
During coverage measurement: Codes not executed
Black
Gray
Unknown *
During coverage measurement: The outside in coverage area Black
White
No Memory *
The outside in memory area
Gray
Gray
Modified
Changed values
Red
White
Note:
*. Support for this function depends on the debugger.
4.
Modify the Foreground and Background color selection on the Color tabbed page as desired.
5.
Click OK.
17.4
Displaying memory contents as an Image
The memory contents can be displayed as an image in the Image window.
Support for this function depends on the debugger.
17.4.1
Opening the Image window
Choose [View -> Graphic -> Image] or click the Image toolbar button (
REJ10J2169-0100 Rev.1.00
Jul 01, 2010
) to open the Image Properties dialog box.
Page 397 of 523
High-performance Embedded Workshop V.4.08
17. Debugging Facility
The Image Properties dialog box is used to specify the display method of the Image window.
The following items are to be specified:
Color
Specifies the color information of the image to be displayed.
Information Mode
Specifies the format.
MONOCHROME Black and white.
RGB
R (red), G (green), and B (blue)
BGR
B (blue), G (green), and R (red)
YCbCr
Y (luminance), Cb (color difference for blue), and Cr (color
difference for red)
Bit/Pixel
Specifies bits/pixel according to the selected mode (valid when RGB or BGR is
selected).
REJ10J2169-0100 Rev.1.00
Jul 01, 2010
Page 398 of 523
High-performance Embedded Workshop V.4.08
Sampling
17. Debugging Facility
Specifies the format of sampling (valid when YCbCr is selected).
An example is shown below.
Sampling Ratio Original Data
Sampling Data
Size of an Image (4*4 pixels)
4:4:4
11,12,13,14
21,22,23,24
31,32,33,34
41,42,43,44
16 bytes
4:2:2
11,11,13,13
21,21,23,23
31,31,33,33
41,41,43,43
8 bytes
4:1:1
11,11,13,13
11,11,13,13
31,31,33,33
31,31,33,33
4 bytes
4:2:0
11,11,11,11
21,21,21,21
31,31,31,31
41,41,41,41
4 bytes
11,12,13,14
21,22,23,24
31,32,33,34
41,42,43,44
Format
Specifies chunky/planar (valid when YCbCr is selected).
Format
Order of data
Chunky(invalid when 4:2:0 is selected) Y,Cb,Cr,Y,Cb,Cr,Y,Cb,Cr,...,Y,Cb,Cr
planar
Y,Y,Y,...,Y,Cb,Cb,Cb,...,Cb,Cr.Cr.Cr,...,Cr
planar2
Y,Y,Y,...,Y,Cb,Cr,Cb,Cr,Cb,Cr,...,Cb,Cr
Buffer
Specifies the area to store data, size, and the address of the palette.
Information Data Address
Specifies the first address in memory of the area for display as image data (in
hexadecimal notation).
Palette Address
Specifies the first address in memory of the color-palette data (in hexadecimal
notation; valid when “8Bit” has been selected for RGB or BGR).
Width/Height Size Specifies the width and height of the image.
Width (Pixel)
Specifies the width of the image (unless a prefix is included,
values are treated as decimal numbers).
Height (Pixel)
Specifies the height of the image (unless a prefix is included,
values are treated as decimal numbers).
Buffer Size (Hex) Displays the size of the buffer required for image display as
obtained from the width and height (in hexadecimal notation).
Enable Redraw
Specifies the redraw continuously function has been enabled.
Continuously
Image Data
Specifies the number of frames to be redrawn image continuously.
Frame Count
Specifies the number of frames (2 or more).
Buffer Full Size
Displays the size of the buffer required for images display as
(Hex)
obtained from the width and height, and the number of frames
(in hexadecimal notation).
REJ10J2169-0100 Rev.1.00
Jul 01, 2010
Page 399 of 523
High-performance Embedded Workshop V.4.08
17. Debugging Facility
View
Specifies whether display is on all or part of the screen (in hexadecimal notation; valid when “8Bit” has
Information been selected for RGB or BGR).
View Mode
Specifies the entire/part to be displayed in the image.
Full Size
The image is displayed on the whole screen.
Part Size
The image is displayed on part of the screen.
Specifies where the display of data is to start.
Start Position
Top
Display of data starts at the upper-left position.
Bottom
Display of data starts at the lower-left position.
Position
Specifies the start position of the image where part of the image is to be displayed.
(Valid when "Part Size" is selected)
X Position
Specifies the X-coordinate of the start position (unless a prefix
is included, values are treated as decimal numbers).
Y Position
Specifies the Y-coordinate of the start position (unless a prefix
is included, values are treated as decimal numbers).
Width/Height Size Specifies the height and width of an image to be displayed on part of the screen.
Width (Pixel)
Specifies the width of the display (unless a prefix is included,
values are treated as decimal numbers).
Height (Pixel)
Specifies the height of the display (unless a prefix is included,
values are treated as decimal numbers).
After the settings have been made in the Image Properties dialog box, clicking the OK button opens the Image window.
Even after the Image window is displayed, the display contents can be modified by opening this dialog box by choosing
Properties from the pop-up menu.
The Image window shows the memory contents as an image.
Double-clicking within the window displays information on the pixel on which the mouse pointer is located in the Pixel
Information dialog box.
REJ10J2169-0100 Rev.1.00
Jul 01, 2010
Page 400 of 523
High-performance Embedded Workshop V.4.08
17. Debugging Facility
Options
Right-clicking displays a pop-up menu containing available options.
A basic operation is allocated to the toolbar.
The Toolbar display and Customize toolbar options are also included in the pop-up menu opened by right-clicking on
the toolbar.
Pop-up Menu Option
Auto
Refresh
Toolbar Button
Macro Recording Function
Nonrefresh
-
Disables refresh of the Image window.
Stop
-
Automatically refreshes the Image window when user
program execution stops.
Real time
-
Regularly refreshes the Image window.
Refresh Now
-
Refreshes the Image window.
Update Interval *
-
Specifies the refresh interval.
Next Image
-
Redraws the next image.
Previous Image
-
Redraws the previous image.
Top Image
-
Redraws the top image.
Last Image
-
Redraws the last image.
0.5s
-
The image is redrawn continuously every 0.5 seconds.
1.0s
-
The image is redrawn continuously every 1.0 seconds.
2.0s
-
The image is redrawn continuously every 2.0 seconds.
4.0s
-
The image is redrawn continuously every 4.0 seconds.
Redraw Continuously
-
Starts redrawing continuously.
Stop
-
Stops redrawing continuously.
Redraw
Interval
Properties
-
Opens the Image Properties dialog box.
Toolbar display
-
-
Shows or hides the toolbar.
Customize toolbar
-
-
Customizes toolbar buttons.
Note:
*. Available only when the debugger supports this function.
17.4.2
Regularly refreshing the Image window
Selecting [Auto Refresh -> Nonrefresh] from the pop-up menu will not refresh the window.
Selecting [Auto Refresh -> Stop] from the pop-up menu will allow the window contents to be automatically refreshed
when user program execution stops.
Selecting [Auto Refresh -> Real time] from the pop-up menu will allow the window contents to be refreshed while the
user program is running.
To specify the refresh interval, select Update Interval from the pop-up menu. This item is only selectable when it is
supported by the debugger.
REJ10J2169-0100 Rev.1.00
Jul 01, 2010
Page 401 of 523
High-performance Embedded Workshop V.4.08
17.4.3
17. Debugging Facility
Refreshing the Image window
Selecting Refresh Now from the pop-up menu immediately refreshes the window contents.
17.4.4
Specifying the refresh interval
You can specify the interval to refresh the Image window while the user program is running.
Support for this function depends on the debugger.
To specify the refresh interval
1.
Right-click within the window to open a pop-up menu.
2.
Select Update Interval. The Update Interval dialog box opens.
3.
Specify the refresh interval in 10-ms units. The refresh interval is specifiable in the range from 10 to 10000 ms
and the default value is 1000 ms.
The specified refresh interval is applied to all Image windows.
The actual refresh interval may be longer than the specified value depending on the state of execution.
17.4.5
Viewing Images as Consecutive Frames
The Image window can also show images as consecutive frames. This allows you to view multiple images easily because
it is not necessary to set addresses for all images.
After images have been loaded into consecutive addresses in memory as equal-sized frames, you can view the images by
switching the frames in order.
REJ10J2169-0100 Rev.1.00
Jul 01, 2010
Page 402 of 523
High-performance Embedded Workshop V.4.08
17. Debugging Facility
To enable the function to show images as consecutive frames
1.
Take either of the following ways to open the Image Properties dialog box.
•
When the Image window is currently open, right-click on the window and select Properties from the pop-up
menu.
•
When no Image window is open, select [View -> Graphic -> Image] or click on the Image toolbar button (
2.
Select the Enable Redraw Continuously checkbox in the Image Properties dialog box.
3.
In the Frame Count edit box, enter the number of frames (2 or more) that you wish to view.
4.
Click on the OK button.
).
After this function has been enabled, you can view the images by either manually or automatically switching the frames.
17.4.5.1 Manually switching the frames
While the function to show images as consecutive frames is enabled, the pop-up menu options and toolbar buttons listed
in the table below are available for manually switching the frames.
Pop-up Menu Option
Toolbar Button
Function
Next Image
Redraws the next image.
Previous Image
Redraws the previous image.
Top Image
Redraws the top image.
Last Image
Redraws the last image.
Whether the pop-up menu options and toolbar buttons are active or not depends on which frame is currently displayed.
To manually switch the frames
Clicking on Next Image goes to the next frame. If you wish to view three consecutive frames, for example, the operation
will be as follows.
REJ10J2169-0100 Rev.1.00
Jul 01, 2010
Page 403 of 523
High-performance Embedded Workshop V.4.08
17. Debugging Facility
1.
Click on the Next Image toolbar button to view the second frame.
2.
Click on the Next Image toolbar button to view the third frame.
17.4.5.2 Regularly switching the frames
While the function to show images as consecutive frames is enabled, the pop-up menu and toolbar items listed in the
table below are available for regularly switching the frames.
Pop-up Menu Option
Redraw Interval *
Toolbar Button Function
0.5s
The image is redrawn continuously every 0.5 seconds.
1.0s
The image is redrawn continuously every 1.0 seconds.
2.0s
The image is redrawn continuously every 2.0 seconds.
4.0s
The image is redrawn continuously every 4.0 seconds.
Redraw Continuously
Starts redrawing continuously.
Stop
Stops redrawing continuously.
Note:
*. Images may not be updated in the defined interval depending on the debugger in use and the image size.
Whether the pop-up menu and toolbar items are active or not depends on which frame is currently displayed.
REJ10J2169-0100 Rev.1.00
Jul 01, 2010
Page 404 of 523
High-performance Embedded Workshop V.4.08
17. Debugging Facility
To regularly switch the frames
While Redraw Continuously is enabled, the frames are regularly switched. If you wish to view three consecutive
frames, for example, the operation will be as follows.
1.
On the first frame, select an update interval from the Redraw Interval drop-down list box and click on the
Redraw Continuously toolbar button.
2.
When the specified time has elapsed, the second frame is automatically displayed.
3.
When the specified time has elapsed, the third frame is automatically displayed. The automatic switching of
frames has ended.
REJ10J2169-0100 Rev.1.00
Jul 01, 2010
Page 405 of 523
High-performance Embedded Workshop V.4.08
17.4.6
17. Debugging Facility
Displaying the pixel information
Double-clicking within the window displays information on the pixel on which the mouse pointer is located in the Pixel
Information dialog box.
This dialog box displays pixel information on the cursor location.
Color Mode
Pixel
Position
Buffer Size
Image Size
17.5
Displays the format of the image.
Displays color information of the cursor location. (Displayed in decimal)
Displays the cursor location in X and Y coordinate. (Displayed in decimal)
X
Displays the X-coordinate of the cursor location.
Y
Displays the Y-coordinate of the cursor location.
Displays the buffer size. (Displayed in decimal)
Width
Displays the buffer width.
Height
Displays the buffer height.
Displays the width and height of the display. (Displayed in decimal)
Width
Displays the width.
Height
Displays the height.
Displaying memory contents as Waveforms
Memory contents can be displayed as wave forms in the Waveform window.
Support for this function depends on the debugger.
17.5.1
Opening the Waveform window
Choose [View -> Graphic -> Waveform] or click the Waveform toolbar button (
dialog box.
REJ10J2169-0100 Rev.1.00
Jul 01, 2010
) to open the Waveform Properties
Page 406 of 523
High-performance Embedded Workshop V.4.08
17. Debugging Facility
Specifies the waveform format. The following items can be specified.
Data Address
Data Size
Channel
Buffer Size (Hex)
Specifies the start address of data in memory. (Displayed in hexadecimal)
Selects 8bit or 16bit.
Specifies Mono or Stereo.
Specifies the buffer size of data. (Displayed in hexadecimal)
After the settings have been made in the Waveform Properties dialog box, clicking the OK button opens the Waveform
window.
Even after the Waveform window is displayed, the display contents can be modified by opening this dialog box by
choosing Properties from the pop-up menu.
Displays the memory contents as waveforms. The X-coordinate shows the number of sampling data and the Y-coordinate
shows the sampling value.
•
If you double-click the coordinate where you wish to view the sampling information, the Sample Information
dialog box appears.
REJ10J2169-0100 Rev.1.00
Jul 01, 2010
Page 407 of 523
High-performance Embedded Workshop V.4.08
17. Debugging Facility
Options
Right-clicking displays a pop-up menu containing available options.
Pop-up Menu Option
Macro Recording
Function
Nonrefresh
-
Disables refresh of the Waveform window.
Stop
-
Automatically refreshes the Waveform window when user
program execution stops.
Real time
-
Regularly refreshes the Waveform window.
Refresh Now
-
Refreshes the Waveform window.
Update Interval *
-
Specifies the refresh interval.
Zoom In
-
Zoom-in display.
Zoom Out
-
Zoom-out display.
Auto Refresh
Reset Zoom
Zoom Magnification
Scale
-
Resets the zoom display.
X2
-
The zoom magnification is 2.
X4
-
The zoom magnification is 4.
X8
-
The zoom magnification is 8.
128
-
The size of the X-coordinate is 128 pixels.
256
-
The size of the X-coordinate is 256 pixels.
512
-
The size of the X-coordinate is 512 pixels.
Clear Cursor
-
Hides the cursor display.
Sample Information
-
Displays the sampling information of the cursor location.
Properties
-
Opens the Waveform Properties dialog box.
Note:
*. Available only when the debugger supports this function.
17.5.2
Regularly refreshing the Waveform window
Selecting [Auto Refresh -> Nonrefresh] from the pop-up menu will not refresh the window.
Selecting [Auto Refresh -> Stop] from the pop-up menu will allow the window contents to be automatically refreshed
when user program execution stops.
Selecting [Auto Refresh -> Real time] from the pop-up menu will allow the window contents to be refreshed while the
user program is running.
To specify the refresh interval, select Update Interval from the pop-up menu. This item is only selectable when it is
supported by the debugger.
17.5.3
Refreshing the Waveform window
Selecting Refresh Now from the pop-up menu immediately refreshes the window contents.
REJ10J2169-0100 Rev.1.00
Jul 01, 2010
Page 408 of 523
High-performance Embedded Workshop V.4.08
17.5.4
17. Debugging Facility
Specifying the refresh interval
You can specify the interval to refresh the Waveform window while the user program is running.
Support for this function depends on the debugger.
To specify the refresh interval
1.
Right-click within the window to open a pop-up menu.
2.
Select Update Interval. The Update Interval dialog box opens.
3.
Specify the refresh interval in 10-ms units. The refresh interval is specifiable in the range from 10 to 10000 ms
and the default value is 1000 ms.
The specified refresh interval is applied to all Waveform windows.
The actual refresh interval may be longer than the specified value depending on the state of execution.
17.5.5
Zoom-in display
Selecting Zoom In from the pop-up menu displays the waveforms with the horizontal coordinate enlarged.
17.5.6
Zoom-out display
Selecting Zoom Out from the pop-up menu displays the waveforms with the horizontal coordinate reduced.
17.5.7
Resetting the zoom display
Selecting Reset Zoom from the pop-up menu displays the waveforms in its original size.
REJ10J2169-0100 Rev.1.00
Jul 01, 2010
Page 409 of 523
High-performance Embedded Workshop V.4.08
17.5.8
17. Debugging Facility
Setting the zoom magnification
In the Zoom Magnification submenu of the pop-up menu, the zoom magnification can be selected from 2, 4, or 8.
17.5.9
Setting the horizontal scale
In the Scale submenu of the pop-up menu, the size of the X-coordinate can be selected from 128, 256, or 512 pixels.
17.5.10 Non-display of cursor
Selecting Clear Cursor from the pop-up menu hides the cursor display.
17.5.11 Displaying the sampling information
When anywhere within the graph is clicked, a cursor (green vertical line) appears. The cursor can be moved by pressing
the left or right arrow key. Right-click in the window to display a pop-up menu. Selecting Sample Information from the
pop-up menu displays the Sample Information dialog box.
If you double-click the coordinate where you wish to view the sampling information, the Sample Information dialog
box appears.
Displays the sampling information of the cursor location in the Waveform window. The following information is
displayed.
Data Size
Channel
Value
Displays 8bit or 16bit.
Displays the data channel.
X
Displays the X-coordinate of cursor location.
Y
Displays the Y-coordinate of cursor location (displays Y-coordinate for both the upper and
lower plots when Stereo is selected).
REJ10J2169-0100 Rev.1.00
Jul 01, 2010
Page 410 of 523
High-performance Embedded Workshop V.4.08
17.6
17. Debugging Facility
Looking at I/O memory
As well as a CPU and ROM/RAM, a micro-controller also contains on-chip peripheral modules. The exact number and
type of peripheral modules differ between devices but typical modules are DMA controllers, serial communications
interfaces, A/D converters, integrated timer units, a bus state controller and a watchdog timer. Accessing registers, which
are mapped to the micro-controller’s address space, programs the on-chip peripherals.
Since the setting up and use of these on-chip peripheral registers is usually very important in an embedded microcontroller application, it is useful to be able to look clearly at the contents of these registers. The Memory view only
allows you to look at data in memory as byte, word, long word, single-precision floating-point, double-precision floatingpoint, or ASCII values, so the High-performance Embedded Workshop also provides an IO window to ease the
inspection and setting up of these registers.
17.6.1
Opening the IO window
To open the IO window, choose [View -> CPU -> IO] or click the View IO toolbar button (
on-chip peripheral modules organize the I/O register information.
). Modules that match the
The IO window has two tabs: All Register and Selected Register.
When the IO window is first opened, only a list of module names is shown on the All Register tabbed pane.
Window configuration
Tab
All Register
Selected Register
REJ10J2169-0100 Rev.1.00
Jul 01, 2010
Description
Shows all I/O registers.
Shows selected I/O registers. This page is blank by default.
Page 411 of 523
High-performance Embedded Workshop V.4.08
17. Debugging Facility
•
I/O registers can be expended.
•
If the value of an I/O register is changed, the value is displayed in red.
•
Double-clicking on the line of an I/O register opens a dialog box, in which you can change the value. Changing
of the value can be recorded in a macro (Macro Recording).
•
The values of I/O registers and their bits can be changed in the Value column by in-place editing (Macro
Recording).
Options
Right-clicking displays a pop-up menu containing available options.
A basic operation is allocated to the toolbar.
The Toolbar display and Customize toolbar options are also included in the pop-up menu opened by right-clicking on
the toolbar.
Pop-up Menu Option Toolbar Button Macro Recording Function
Refresh
-
Refreshes the IO window.
Lock Refresh
-
Disables refresh of the IO window.
Load IO File
-
Manually loads an I/O file.
Selected IO Register
-
Selects the I/O register(s) to be shown on the Select
Register tabbed pane.
Print
-
Prints the current data of the window.
Save To File
-
Saves the current data of the window to a text file.
Find
-
Finds an I/O register.
Find Next
-
Finds the next I/O register to match.
Toolbar display
-
-
Shows or hides the toolbar.
Customize toolbar
-
-
Customizes toolbar buttons.
17.6.2
Expanding an I/O register display
To display the names, addresses and values of the I/O registers, double-click on the module name or select the module
name, by clicking on it or using the cursor keys, and press the cursor right key. The module display will expand to show
the individual registers of that peripheral module and their names, addresses and values. Double-clicking (or pressing the
cursor left key) again on the module name will close the I/O register display.
Note:
If you are using an emulator-based debugger, reading data from an I/O register can sometimes affect the operation of
your program. For example, reading a data register can cancel a pending interrupt. Data is only read from I/O modules
that have been expanded in the IO window (so that the register values are displayed). Therefore, as long as I/O modules
are collapsed when they no longer need to be displayed, this will not cause a problem. Also, note that having a Memory
window (or Disassembly window) open on the I/O area can have the same effect.
REJ10J2169-0100 Rev.1.00
Jul 01, 2010
Page 412 of 523
High-performance Embedded Workshop V.4.08
17. Debugging Facility
While Lock Refresh of the IO window is active, no data will be read out even if an I/O register display is expanded.
17.6.3
Modifying the values of I/O registers
The values of I/O registers can be modified in the IO window.
To modify the value of an I/O register
Select either of the following ways.
•
In-place edit in the Value column.
•
Double-click on the line of the I/O register or bit to open a dialog box in which the values can be changed. Enter a
value in New value.
17.6.4
Refreshing the IO window
The IO window contents can be forcibly refreshed. Selecting Refresh from the pop-up menu of the IO window.
17.6.5
Disabling refresh of the IO window
Automatic refresh of the IO window, which is performed when user program execution stops and in other cases, can be
disabled.
Select Lock Refresh from the pop-up menu of the IO window.
REJ10J2169-0100 Rev.1.00
Jul 01, 2010
Page 413 of 523
High-performance Embedded Workshop V.4.08
17. Debugging Facility
The contents of the IO window are grayed-out but the text color of the I/O register for which the value has been changed
remains.
While Lock Refresh is active, you cannot modify the I/O register settings expanded on the All Register and Selected
Register tabbed panes of the IO window.
17.6.6
Selecting the I/O register(s) to view
You can select the I/O register(s) to be shown on the Select Register tabbed pane of the IO window.
To select the I/O register(s) to view
1.
Right-click within the window to open a pop-up menu.
2.
Select Select I/O Register. The Select IO Register dialog box opens. The figure given below is an example of
the Select I/O Register dialog box for the SH-4 simulator debugger.
3.
Each of the items in the Available Registers list has a checkbox that is unselected by default. Clicking on ‘+’
expands the collapsed item while clicking on ‘-’ collapses the expanded item. If you select the checkbox for an
item with ‘+’ or ‘-’, the checkboxes for all of its elements are also selected. Similarly, if you deselect the
checkbox for an item, all of its elements are also deselected. You should select the checkboxes for the I/O
register(s) you wish to view.
4.
Clicking OK closes the Select IO Register dialog box. The selected I/O registers are shown on the Select IO
Register tabbed pane of the IO window.
REJ10J2169-0100 Rev.1.00
Jul 01, 2010
Page 414 of 523
High-performance Embedded Workshop V.4.08
17. Debugging Facility
Note:
This function cannot be used during execution of the user program.
17.6.7
Loading an I/O file
I/O files can be manually loaded to the IO window.
To load an I/O file
1.
Right-click in the IO window to display a pop-up menu.
2.
Select Load IO File. The Set I/O File dialog box opens.
3.
Specify an I/O file you wish to load in the I/O File field. To insert a placeholder in the I/O File field, click the
Placeholder button ( ) and select a placeholder from the pop-up menu. To browse a file, click the Browse
button.
4.
If the Save path name of the I/O file checkbox is not selected, the path name in the I/O File field will not be
saved when you save the session. The next time this session is selected, the contents to be loaded to the IO
window depend on the debugger. When the I/O file has been automatically downloaded, ensure that this
checkbox is not selected. The I/O file dependent on the selected CPU is chosen by the debugger and
automatically loaded.
If the Save path name of the I/O file checkbox is selected, the path name in the I/O File field will be saved
when you save the session. The next time this session is selected, the most recently loaded I/O file will be
loaded to the IO window.
This checkbox is not selected by default.
5.
Click OK.
If the register names in the loaded I/O file and those shown on the Select I/O Register tabbed pane of the IO window do
not match, an
icon appears on the items as shown below.
REJ10J2169-0100 Rev.1.00
Jul 01, 2010
Page 415 of 523
High-performance Embedded Workshop V.4.08
17. Debugging Facility
See Reference 6, I/O File Format, for more information about an I/O file format.
17.6.8
Printing the currently displayed contents
The contents currently displayed on the selected pane of the IO window can be printed in a text file. Select Print from
the pop-up menu.
17.6.9
Saving the currently displayed contents
The contents currently displayed on the selected pane of the IO window can be saved in a text file. Select Save to File
from the pop-up menu.
17.6.10 Finding an I/O register
You can search for an I/O register shown in the IO window.
To find an I/O register
1.
Right-click within the window to open a pop-up menu.
2.
Select Find. The Find dialog box opens.
REJ10J2169-0100 Rev.1.00
Jul 01, 2010
Page 416 of 523
High-performance Embedded Workshop V.4.08
3.
17. Debugging Facility
Select the column in which you wish to search for an I/O register.
Address
Name
Address of the I/O register
Name of the I/O register
4.
In Find, enter the string to be found in the selected column. The characters are not case-sensitive.
5.
To find the I/O register that completely matches the string entered in Find, select the Match whole word
checkbox. When this option is not selected, all I/O registers that partially match the entered string will be found.
6.
Clicking OK starts the search from the first line. When an I/O register is found, this line is highlighted.
To find the next I/O register to match, select Find Next in the pop-up menu.
17.6.11 Finding the next
After an I/O register in the IO window has been found, you can also use Find Next to find the next I/O register that
meets the requirement.
17.7
Looking at registers
If you are debugging at assembly-language level using the Disassembly view, you will probably find it useful to see the
contents of the CPU's general registers. You can do this by using the Register window.
17.7.1
Opening the Register window
The Register window displays the register data and flag data. You can change a register/flag value from the window.
To open the Register window, choose [View -> CPU -> Registers], or click the Registers toolbar button (
Register window opens showing all of the CPU's general registers and values.
). The
Window configuration
Screenshot of the SH-4 debugger
Double-clicking the register display line opens a dialog box, which allows you to change a register value. (Macro
Recording)
REJ10J2169-0100 Rev.1.00
Jul 01, 2010
Page 417 of 523
High-performance Embedded Workshop V.4.08
17. Debugging Facility
The register's contents can be changed by using in-place editing. (Macro Recording)
You can change a flag value by clicking the button corresponding to the flag. (Macro Recording)
The right-click menu allows you to change the display radix point and the register bank (Change of the register bank can
be selected only when the debugger supports this function.).
Options
Right-clicking displays a pop-up menu containing available options.
Pop-up Menu Option
Radix
Macro Recording
Function
Hex
-
Displays in hexadecimal.
Dec
-
Displays in decimal.
Oct
-
Displays in octal.
Bin
-
Displays in binary.
Bank0 *
-
Displays registers of bank 0.
Bank1 *
-
Displays registers of bank 1.
Radix
-
Switches display or non-display of radix.
FLAGs
-
Switches display or non-display of flags display area.
Settings
-
Chooses a register to be displayed.
Layout
Edit
Changes a register's contents.
Refresh
-
Refreshes the Register window.
Lock Refresh
-
Disables refresh of the Register window.
Split
-
Splits up the window display.
Save To File
-
Saves register contents in a text file.
Note:
*. Support for this function depends on the debugger.
17.7.2
Changing the register display radix
You can change the display radix by register.
To do this, click the mouse right button on the register to be changed and select the display radix from the pop-up menu
which is opened.
The followings can be selected.
Hex
Dec
Oct
Bin
Display in hexadecimal.
Display in decimal.
Display in octal.
Display in binary.
REJ10J2169-0100 Rev.1.00
Jul 01, 2010
Page 418 of 523
High-performance Embedded Workshop V.4.08
17.7.3
17. Debugging Facility
Switching Register Bank
Immediately after opening the Register window, the register data for the bank corresponding to the value of flag is
displayed.
To switch the bank, you can also use the pop-up menu which is displayed by clicking the mouse right button on the
register display area in the Register window, or change the value of flag.
(If you change the value of flag, the register bank also changes in response to the value.)
To reference the register data of Bank1, select Bank1 from the pop-up menu with the Register window active.
The register specific to Bank1 is displayed in the gray background.
Screenshot of the M16C family debugger
To reference the register data of Bank0, select Bank0 from the pop-up menu with the Register window active. (Through
the operation of option Bank0 and Bank1, the value of flag does not change.)
Support for this function depends on the debugger.
17.7.4
Setting the layout
To set the layout of the Register Window, choose Layout from the register Window pop-up menu. The followings can be
selected:
Radix
FLAGs
Switch display or non-display of radix.
Switch display or non-display of flags display area.
When the radix or flag is shown, the option is checked.
REJ10J2169-0100 Rev.1.00
Jul 01, 2010
Page 419 of 523
High-performance Embedded Workshop V.4.08
17. Debugging Facility
When the radix and flags are displayed
17.7.5
Choosing a register to be displayed
To choose a register to be displayed in the Register window, choose Settings from the register pop-up menu. This dialog
box is shown in following figure.
REJ10J2169-0100 Rev.1.00
Jul 01, 2010
Page 420 of 523
High-performance Embedded Workshop V.4.08
17.7.6
17. Debugging Facility
Modifying register contents
To change register contents, follow the procedure below.
Enter a value in the Value field of the register you want to change.
To change a register's contents, open the Set Value dialog by selecting one of the following operations
•
Double-click the register you want to change, OR
•
Select the register you want to change and choose the Edit option from the pop-up menu.
You can enter a number or C/C++ expression in the Value field.
You can choose the radix from the Radix drop-down list box.
You can choose whether to modify the entire contents of the register, a masked area, floating bits or flag bits, by
selecting an option from the Set As drop-down list box (the contents of this list depends on the CPU and selected
register).
When you have entered the new number or expression, click the OK button or press Enter. The dialog box closes and the
new value is written into the register.
17.7.7
Setting the flag value
When the flag itself is displayed
Click the button of the flag to be changed. Every time you click the button the flag status (1/0) is switched. If a flag is
composed of multiple bits, a dialog is opened, where you can enter a value to be changed.
REJ10J2169-0100 Rev.1.00
Jul 01, 2010
Page 421 of 523
High-performance Embedded Workshop V.4.08
17. Debugging Facility
Screenshot of the SH-4 debugger
When the flag is displayed in the register
Double-click the FLG line. A dialog opens. Enter the value to be changed.
Screenshot of the SH-4 debugger (FLG line (FPSCR))
17.7.8
Splitting up the window display
To vertically divide the Register window display into two, select Split from the pop-up menu and move the split-up bar.
To cancel the split-up display, select Split from the pop-up menu again.
17.7.9
Saving register contents
To save register contents in a text file, choose Save To File from the register pop-up menu. The Save As dialog box
opens. Specify the file name.
17.7.10 Refreshing the Register window
The Register window contents can be forcibly refreshed. Selecting Refresh from the pop-up menu of the Register
window.
17.7.11 Disabling refresh of the Register window
Automatic refresh of the Register window contents, which is performed when user program execution stops and in other
cases, can be disabled.
Select Lock Refresh from the pop-up menu of the Register window.
The contents of the Register window are grayed-out.
REJ10J2169-0100 Rev.1.00
Jul 01, 2010
Page 422 of 523
High-performance Embedded Workshop V.4.08
17. Debugging Facility
When two windows are open and this function is enabled in either of the windows, values of registers and flags can be
compared.
17.7.12 Using register contents
It can be useful to be able to use the value contained in a CPU register when you are entering a value elsewhere in the
High-performance Embedded Workshop, for example when displaying a specified address in the Disassembly or
Memory views. You can do this by specifying the register name prefixed by the ‘#’ or ‘%’ character, e.g.: ‘#PC’ or
‘%PC’.
The supported prefix depends on the debugger.
17.7.13 Changing text colors
The text color and font of the register or flag values shown in the Register window can be customized in the Format
Views dialog box (in the same manner as the color and font in other windows).
Now it is also possible to customize the color of the changed register or flag values in the Format Views dialog box. The
default foreground and background colors of the changed values are red and white, respectively. The color of the
background will be the same as in cases where the text category is selected.
To change the look of the Register window
1.
Select [Setup -> Format Views]. The Format Views dialog box opens.
2.
Select the Register item in the tree and expand it.
3.
Select the Modified category.
4.
Modify the Foreground color selection on the Color tabbed page as desired.
5.
Click OK.
17.8
Specifying the radix
If no prefix (e.g. "0x") has been added to a numerical value entered in a dialog box, window, or command line, specify
the radix for the value.
Notes:
•
If the dialog box or window has a field for selecting the radix (e.g. a button or column), the radix selected in this
field will be applied.
•
The radix in some dialog boxes, windows, and commands may be fixed.
REJ10J2169-0100 Rev.1.00
Jul 01, 2010
Page 423 of 523
High-performance Embedded Workshop V.4.08
17. Debugging Facility
To specify the radix, select a submenu from [Setup -> Radix] or click on a button on the Debug toolbar.
[Setup -> Radix] Submenu
Debug Toolbar
Description
Hex
Sets the radix to hexadecimal. (default)
Decimal
Sets the radix to decimal.
Octal
Sets the radix to octal.
Binary
Sets the radix to binary.
17.9
Resetting the target MCU
To reset the target MCU, click the Reset CPU toolbar button (
), or select [Debug -> Reset CPU].
Resetting the target MCU initializes the on-chip I/O registers and makes the program counter jump to the address set in
the reset vector.
17.10 Setting PC to the address at cursor
To changes the value of the PC to the address at the row of the text cursor, click the Set PC to cursor toolbar button
( ), or select [Debug -> Set PC to Cursor].
17.11 Initializing the debugger
Select [Debug -> Initialize].
It will close down any open child windows and shut down the link to the debugger. If this is successful, an attempt to reestablish the link to the debugger will be made.
17.12 Connecting/disconnecting the debugger
To connect the debugger
Select one of the following operations:
•
Click the Connect toolbar button (
•
Select [Debug->Connect].
), OR
To disconnect the debugger
Select one of the following operations:
•
Click the Disconnect toolbar button (
•
Select [Debug->Disconnect].
REJ10J2169-0100 Rev.1.00
Jul 01, 2010
), OR
Page 424 of 523
High-performance Embedded Workshop V.4.08
17. Debugging Facility
Support for this function depends on the debugger.
17.13 Executing your program
This section describes how you can execute your program's code. You will learn how to do this by either running your
program continuously or stepping single or multiple instructions at a time.
17.13.1 Continuing run
When your program is stopped, the High-performance Embedded Workshop will display a yellow arrow ( ) in the
gutter of the line in the source and disassembly views that correspond to the CPU's current Program Counter (PC) address
value. This will be the next instruction to be executed if you perform a step or continue running.
To continue running from the current PC address
•
Click the Go toolbar button (
•
Choose [Debug -> Go].
), OR
To continue running from a specified address which is not the stop address, change the PC value in one of the following
ways, and click the Go toolbar button ( ) or choose [Debug -> Go].
•
Change the PC value in the Register window.
•
Place the text cursor (not the mouse cursor) to a target line in the editor or disassembly window, and choose Set
PC Here from the pop-up menu.
17.13.2 Running from reset
To reset your user system and run your program from the Reset Vector address, click the Reset Go toolbar button ( )
or choose [Debug->Reset Go]. The program will run until it hits a breakpoint or a break condition is met. You can stop
the program manually at any time by clicking the Halt toolbar button ( ) or by choosing [Debug -> Halt Program].
Note:
The program will start running from whatever address is stored in the Reset Vector location. Therefore it is important to
make sure that this location contains the address of your startup code.
REJ10J2169-0100 Rev.1.00
Jul 01, 2010
Page 425 of 523
High-performance Embedded Workshop V.4.08
17. Debugging Facility
17.13.3 Running program, ignoring any breakpoints
Sometimes when you are debugging your application you may need to start running continuously but have breakpoints
configured. Instead of disabling all the breakpoints, you can quickly execute the code using the Free Go feature.
To run from the current PC address, but ignore any (both software and hardware) breakpoints
•
Click the Free Go toolbar button (
•
Choose [Debug -> Free Go].
), OR
Note:
Support for this function depends on the debugger.
17.13.4 Running to cursor
Sometimes as you are going through your application you may only want to run a small section of code, that would
require many single steps to execute. In this case it would be useful to be able to run to a particular point. You can do this
by using the Go To Cursor feature.
How to use the Go To Cursor feature
1.
Make sure that an editor or disassembly view is open, showing the address at which you wish to stop.
2.
Position the cursor on the line containing the address at which you wish to stop.
3.
Choose Go To Cursor from the pop-up menu.
The debugger will run your code from the current PC value until it reaches the address indicated by the cursor's position.
Notes:
•
If your program never executes the code at this address, the program will not stop. If this happens, you can stop
code execution by pressing ESC, choosing [Debug -> Halt Program], or clicking the Halt toolbar button ( ).
•
The Go To Cursor feature requires a temporary breakpoint - if you have already used all those available then
the feature will not work.
REJ10J2169-0100 Rev.1.00
Jul 01, 2010
Page 426 of 523
High-performance Embedded Workshop V.4.08
17. Debugging Facility
17.13.5 Running from a specified address
The Run Program dialog box allows the user to run the program from any address. Choose [Debug -> Run] to open the
Run Program dialog box.
The following execution conditions can be specified in this dialog box:
Program counter
Temporary PC Breakpoints
Instruction address to start execution. The initial value is the current PC value.
A temporary PC breakpoint. When execution started by this dialog box stops, this
breakpoint is cleared.
Clicking the Go button starts execution according to the settings. Clicking the Reset Go button starts execution from the
reset vector. Clicking the Cancel button closes this dialog box without executing instructions.
Note:
The Temporary PC Breakpoints feature requires a temporary breakpoint - if you have already used all those available
then the feature will not work.
17.13.6 Continuing execution to a main function at a reset
The High-performance Embedded Workshop has a function to continue execution of the program at a reset until it
reaches the top of a main function. Then the High-performance Embedded Workshop sets a temporary software
breakpoint at the main function. When execution of the program is stopped, this breakpoint is deleted.
To continue execution of the program to the top of a main function at a reset
1.
Select [Setup -> Options] to open the Options dialog box.
2.
Select the Debug tab.
3.
Select the Run to main function on reset checkbox. By default, this box is not selected.
4.
Reset the target microcomputer. Select one of the following operations:
REJ10J2169-0100 Rev.1.00
Jul 01, 2010
Page 427 of 523
High-performance Embedded Workshop V.4.08
•
Click Reset CPU toolbar button (
•
Select [Debug -> Reset CPU].
17. Debugging Facility
), OR
Note:
The Run to main function on reset feature requires a temporary breakpoint - if you have already used all those available
then the feature will not work.
17.13.7 Single step
When you are debugging your code it is very useful to be able to step a single line or instruction at a time and examine
the effect of that instruction on the system. In the source view, a step operation will step a single source line. In the
disassembly view, a step operation will step a single assembly-language instruction. If the instruction calls another
function or subroutine, you have the option to either step into or step over the function. If the instruction does not
perform a call, then either option will cause the debugger to execute the instruction and stop at the next instruction.
If you choose to step into the function, the debugger will execute the call and stop at the first line or instruction of the
function.
To step into the function
•
Click the Step In toolbar button (
•
Select [Debug -> Step In].
), OR
If you choose to step over the function the debugger will execute the call and all of the code in the function (and any
function calls that function may make) and stop at the next line or instruction of the calling function.
To step over the function
•
Click the Step Over toolbar button (
•
Select [Debug -> Step Over].
), OR
During debugging, there are occasions when you may have entered a function, finished stepping through the instructions
that you want to examine and would like to return to the calling function without tediously stepping through all the
remaining code in the function. Alternatively you may have stepped into a function by accident, when you meant to step
over it and so want to return to the calling function without stepping all the way through the current function. You can do
this with the Step Out feature.
REJ10J2169-0100 Rev.1.00
Jul 01, 2010
Page 428 of 523
High-performance Embedded Workshop V.4.08
17. Debugging Facility
To step out of the current function
•
Click the Step Out toolbar button (
•
Select [Debug -> Step Out].
), OR
To choose the step mode to use while stepping
Select [Debug -> Step Mode].
Sub-menu
Function
Auto (default)
Automatically chooses the step mode
Assembly
Steps through assembly instructions
Source
Steps through source code
While performing Step In in source mode within the High-performance Embedded Workshop editor, you may wish to
keep the source mode display of the library functions (e.g. printf) containing no debugging information. By default, the
execution jumps to the Disassembly window and steps every assembly-language instruction.
You can select not to actually step in addresses where no debugging information exists even when the Step In execution
reaches such addresses.
To select not to step into addresses where no debugging information exists
1.
Select [Setup -> Options]. The Options dialog box opens.
2.
Select the Debug tab.
3.
Select the Only step in when debug information is available checkbox. By default, this checkbox is not
selected.
Note:
Support for this function depends on the debugger.
17.13.8 Multiple steps
Sometimes you may find it useful to step through several instructions at a time. You can do this by using the Step
Program dialog box. The dialog box also provides an automated step with a selectable delay between steps. Open it by
choosing [Debug -> Step]. The Step Program dialog box opens.
REJ10J2169-0100 Rev.1.00
Jul 01, 2010
Page 429 of 523
High-performance Embedded Workshop V.4.08
Steps
Delay
Step over calls
Source level step
17. Debugging Facility
Number of steps to be executed. By default, this value is 1.
Delay between steps when the program is automatically stepped.
"No Refresh" (Prevents the update of the windows) or 0 to 3 seconds can be selected in 0.5
second units. By default, this value is 2.5 seconds.
Selecting this box steps over function calls. By default, this checkbox is not selected.
Selecting this box steps the program at the source level. By default, this checkbox is selected.
Click the OK button or press Enter to start stepping.
17.14 Stopping your program
This section describes how you can halt execution of your application's code. This section describes how to do this
directly by using the Halt toolbar button ( ) and by setting breakpoints at specific locations in your code.
17.14.1 Stopping the program by the Halt toolbar button
When your program is running, the Halt toolbar button is enabled (
( ).
), and when the program has stopped it is disabled
To stop the program
•
Click on the Halt toolbar button (
•
Choose [Debug -> Halt Program].
), OR
When the program has been stopped, a information including the cause of a stop is displayed in the Debug pane of the
Output window.
17.14.2 Standard breakpoints (PC breakpoints)
When you are trying to debug your program, you will want to be able to stop the program running when it reaches
specific points in your code. You can do this by setting a program counter (PC) breakpoint on the line or instruction at
which to want the execution to stop. The following instructions will show you how to quickly set and clear simple PC
breakpoints.
REJ10J2169-0100 Rev.1.00
Jul 01, 2010
Page 430 of 523
High-performance Embedded Workshop V.4.08
17. Debugging Facility
To set a PC breakpoint in the Editor window
1.
Make sure that the source or disassembly view is open at the place at which you want to set a PC breakpoint.
2.
Select the Toggle Breakpoint pop-up menu option, or press F9, at the line showing the address at which you
want the program to stop. You will see a red circle ( ) appear in the gutter to indicate that a PC breakpoint has
been set.
3.
It is possible to enable or disable the current breakpoint by selecting [Enable/Disable Breakpoint] from the
pop-up menu.
4.
Now when you run your program and it reaches the address at which you set the PC breakpoint, execution halts
with the message ‘PC Breakpoint’ displayed in the Debug pane, and the source or disassembly view is updated
with the PC breakpoint line highlighted.
Additional information:
When there are two or more instances of a template function, breakpoints can even be set at the addresses corresponding
to a single line of source code.
template <typename T> T1 tempfunc(T t1)
{
g_iVal += t1;
-> A breakpoint set here is also applied to tempfunc(c) and tempfunc(s).
return g_iVal;
}
void main(void)
char c;
short s;
...
tempfunc(c);
tempfunc(s);
}
When you set a breakpoint, a dialog box appears to ask if you wish to apply this breakpoint to all addresses. To apply the
breakpoint to all addresses, select Yes. Otherwise select No.
If you do not wish to open this confirmation dialog box, select the Don't ask this question again checkbox.
To open the confirmation dialog box again
1.
Select [Setup -> Options]. The Options dialog box will be displayed.
2.
Select the Confirmation tab.
3.
Select the Set multiple breakpoints checkbox. This checkbox is selected by default.
4.
Click OK.
REJ10J2169-0100 Rev.1.00
Jul 01, 2010
Page 431 of 523
High-performance Embedded Workshop V.4.08
17. Debugging Facility
Note:
The line or instruction at which you set a PC breakpoint is not actually executed - the program stops just before it is about
to execute it. If you choose to Go or Step after stopping at the PC breakpoint, then the highlighted line will be the next
instruction to be executed.
To change the PC breakpoint setting by using the Breakpoints dialog box
The breakpoint dialog can be displayed by selecting [Edit -> Source Breakpoints]. It allows you to view the current
breakpoints set in the workspace and view the code associated with each one. From this dialog it is also possible to
remove one or all breakpoints.
To toggle PC breakpoints
It is possible to toggle PC Breakpoints either by double-clicking in the breakpoint (BP) column of the line at which the
PC breakpoint is set, or by placing the caret on the line and using the F9 key. The display will cycle through the available
standard breakpoint types - a red circle ( ) will be shown in the gutter.
17.15 Viewing the current status
To check the configuration and status of the debugger in the Status window, choose [View -> CPU -> Status], or click
the View Status button ( ).
The Status window has three tabs.
Window configuration
REJ10J2169-0100 Rev.1.00
Jul 01, 2010
Page 432 of 523
High-performance Embedded Workshop V.4.08
Tab
Memory
Platform
Events
17. Debugging Facility
Description
Contains information about the current memory status including the memory mapping resources
and the areas used by the currently loaded object file.
Contains information about the current status of the debugger, typically including CPU series and
mode, run status and timing information.
Contains information about the current event (breakpoint) status, including resource information.
17.16 Viewing the function call history
The Stack Trace window shows the function call history.
17.16.1 Opening the Stack Trace window
To open the Stack Trace window, choose [View -> Code -> Stack Trace] or click the Stack Trace toolbar button (
Window configuration
The following items are displayed.
Kind
Name
Value
Indicates the type of the symbol.
F: Function
P: Function parameter *
L: Local variable *
Indicates the symbol name.
Indicates the value, address, and type of the symbol.
Note:
*. Support for this function depends on the debugger.
REJ10J2169-0100 Rev.1.00
Jul 01, 2010
Page 433 of 523
).
High-performance Embedded Workshop V.4.08
17. Debugging Facility
Options
Right-clicking displays a pop-up menu containing available options.
Pop-up Menu Option
Macro Recording
Function
Go to Source
-
Go to the associated source line.
View Setting
-
Specifying the Stack Trace window settings.
Copy
-
Places a copy of the highlighted text into the Windows® clipboard.
17.16.2 Viewing the source program
Select a function and choose Go to Source from the pop-up menu to display, then the source program corresponding to
the function, which has been selected by opening the editor window, is displayed.
17.16.3 Specifying the view
Choose View Setting from the pop-up menu to open the Stack Trace Setting dialog box, which allows the user to
specify the Stack Trace window settings.
Nest level
Display symbol *
Display Radix *
Specifies the level of function call nesting to be displayed in the Stack Trace window.
Specifies the symbol types to be displayed in addition to functions.
Specifies the radix for displays in the Stack Trace window.
Note:
*. Support for this function depends on the debugger.
REJ10J2169-0100 Rev.1.00
Jul 01, 2010
Page 434 of 523
High-performance Embedded Workshop V.4.08
17. Debugging Facility
17.16.4 Selecting an encoding format
If the values of variables are characters or strings and they should be displayed as UTF-8 code, select [Setup -> Options]
to open the Options dialog box. Click on the Debug tab and select UTF-8 for Encoding Format.
The Watch window now shows the values of variables as UTF-8 code. If Local Code Page (default) has been selected for
Encoding Format, the values are displayed as ASCII code.
Note:
The default font for display in the Watch window is Courier New, which is not supported by UTF-8. Select another font
compatible with UTF-8 in the Format Views dialog box in advance.
17.17 Using an external debugger
The High-performance Embedded Workshop can launch an external debugger tool. If you want to use another debugger
then you must add it to the Tools menu.
The Debugger tab of the Setup Customize dialog box is where the external debugger related information is configured.
You may wish to use an older version of the debugger if certain targets are not currently supported in the new
environment. Invoke it by selecting [Setup -> Customize] and then selecting the Debugger tab.
The first choice to make is which debug tool you would like to use.
Once this has been selected the external debugger must be configured.
Hitachi Debugger Interface (version 4.x or greater)
Renesas PD debugger
Other external debugger
Non selected
Click the Launch External Debugger toolbar button (
Configuring the Hitachi Debugging Interface to integrate
with High-performance Embedded Workshop
Configuring the PD debugger to integrate with Highperformance Embedded Workshop
Configuring an external debugger to integrate with Highperformance Embedded Workshop
Not use the external debugger
) to invoke the debugger with the specified session file.
After a build, if the download module has been updated, the High-performance Embedded Workshop will switch back to
the debugger to enable immediate debugging. Whilst using an external debugger, double-clicking in any editor window
will switch back to the High-performance Embedded Workshop with the source file open at the line that was doubleclicked.
17.17.1 Configuring the Hitachi Debugging Interface to integrate with High-performance Embedded
Workshop
The following details the information required to setup the Hitachi Debugging Interface to integrate with Highperformance Embedded Workshop and launch from the external debugger option in High-performance Embedded
Workshop.
REJ10J2169-0100 Rev.1.00
Jul 01, 2010
Page 435 of 523
High-performance Embedded Workshop V.4.08
17. Debugging Facility
To configuring the Hitachi Debugging Interface to integrate with High-performance Embedded Workshop
1.
Firstly, the location of the debugger executable must be specified. This must be version Hitachi Debugging
Interface 4.0 or greater, otherwise its behavior is not guaranteed. This may have been configured by the
installation program or a project generation utility.
2.
The second item of data is the session file. This tells the debugger which session to load when it is launched.
3.
Finally, the location of the download module is required. This allows the High-performance Embedded
Workshop to automatically switch to the debugger when the download module changes after a build.
17.17.2 Configuring the PD debugger to integrate with High-performance Embedded Workshop
The following details the information required to setup the PD debugger to integrate with High-performance Embedded
Workshop and launch from the external debugger option in High-performance Embedded Workshop.
REJ10J2169-0100 Rev.1.00
Jul 01, 2010
Page 436 of 523
High-performance Embedded Workshop V.4.08
17. Debugging Facility
To configure the PD debugger to integrate with High-performance Embedded Workshop
1.
Firstly, the location of the debugger executable must be specified. This may have been configured by the
installation program or a project generation utility.
2.
The second item of data is the profile file. This tells the debugger which profile file to load when it is launched.
This file stores the debug setup information.
3.
The third item of data is the command line options. This field allows additional options to be specified which
can modify the behavior of the external debugger.
4.
Finally, the location of the download module is required. This allows the High-performance Embedded
Workshop to automatically switch to the debugger when the download module changes after a build.
17.17.3 Configuring an external debugger to integrate with High-performance Embedded Workshop
The following details the information required to setup an external debugger which is not Hitachi Debugging Interface or
the PD debugger to integrate with High-performance Embedded Workshop and launch from the external debugger option
in High-performance Embedded Workshop.
To configure an external debugger to integrate with High-performance Embedded Workshop
1.
Firstly, the location of the debugger executable must be specified. This may have been configured by the
installation program or a project generation utility.
2.
The second item of data is the command line options. This field allows additional options to be specified which
can modify the behavior of the external debugger.
3.
Finally, the location of the download module is required. This allows the High-performance Embedded
Workshop to automatically switch to the debugger when the download module changes after a build.
REJ10J2169-0100 Rev.1.00
Jul 01, 2010
Page 437 of 523
High-performance Embedded Workshop V.4.08
17. Debugging Facility
17.18 Debugging functions dependent on the debugger
The debugging functions listed in this section are not common to all High-performance Embedded Workshop products
included in tool packages. (User’s manual and help information just include descriptions of these debugging functions as
the previous version did.)
For details on the functions available with the debugger in use, refer to the user’s manual or help of the emulator or
simulator.
17.18.1 Looking at labels
When the user program that includes the debugging information is loaded, the labels are registered at that time.
The Disassembly window shows the first eight characters of each label instead of the corresponding address or as a part
of an instruction operand.
Note:
When a label value matches an operand, the corresponding instruction operand is replaced by the label. If two or more
labels have the same value, the one that comes first in alphabetical order is displayed.
When an address or a value can be entered in the dialog box, the labels can also be used.
17.18.1.1
Listing labels
To see a list of all the labels defined in the current debugger session, choose [View -> Symbol -> Labels] or click the
View Labels toolbar button ( ).
Window configuration
•
You can view symbols, sorted either alphabetically (by ASCII code) or by address value, by clicking on the
respective column heading.
•
You can quickly toggle a software break at the entry point of a function by double clicking in the BP
(breakpoint) column. Alternatively, right-click to show the pop-up menu and select Break.
REJ10J2169-0100 Rev.1.00
Jul 01, 2010
Page 438 of 523
High-performance Embedded Workshop V.4.08
17. Debugging Facility
Options
Right-clicking displays a pop-up menu containing available options.
A basic operation is allocated to the toolbar.
The Toolbar display and Customize toolbar options are also included in the pop-up menu opened by right-clicking on
the toolbar.
Pop-up Menu Option
Toolbar Button
Macro Recording Function
Add
Adds a label.
Edit
-
Edits a label.
Delete
Deletes a label.
Delete All
Deletes all labels.
Load
Loads labels from a file.
Save
-
Saves labels into a file.
Save As
-
Saves labels into a file.
Find
-
Finds a label.
Fine Next
-
Finds the next label to match.
View Source
-
Views the source corresponding to a label.
Print
-
Prints the currently displayed contents.
Toolbar display
-
-
Shows or hides the toolbar.
Customize toolbar
-
-
Customizes toolbar buttons.
17.18.1.2
Adding a label
Choose Add from the pop-up menu and open the Add Label dialog box to add a label:
Enter the new label name into the Name field and the corresponding value into the Address field and press OK. The
Add Label dialog box closes and the label list is updated to show the new label. When an overloaded function or a class
name is entered in the Address field, the Select Function dialog box opens for you to select a function. For details, see
section 17.18.2.3, Supporting duplicate labels.
17.18.1.3
Editing a label
Choose Edit from the pop-up menu and open the Edit Label dialog box to edit a label:
REJ10J2169-0100 Rev.1.00
Jul 01, 2010
Page 439 of 523
High-performance Embedded Workshop V.4.08
17. Debugging Facility
Edit the label name and value as required and then press OK to save the modified version in the label list. The list display
is updated to show the new label details. When an overloaded function or a class name is entered in the Address field,
the Select Function dialog box opens for you to select a function. For details, see section 17.18.2.3, Supporting duplicate
labels.
17.18.1.4
Deleting a label
To delete a label, select the label and choose Delete from the pop-up menu. A confirmation message box appears:
If you click OK, the label is removed from the list and the window display is updated. If the message box is not necessary
then check the Don’t ask this question again check box.
17.18.1.5
Deleting all labels
To delete all the labels from the list, choose Delete All from the pop-up menu. A confirmation message box appears:
If you click OK, all the labels are removed from the High-performance Embedded Workshop system’s symbol table and
the list display will be cleared. If the message box is not necessary then check the Don’t ask this question again check
box.
REJ10J2169-0100 Rev.1.00
Jul 01, 2010
Page 440 of 523
High-performance Embedded Workshop V.4.08
17.18.1.6
17. Debugging Facility
Loading labels from a file
A symbol file can be loaded and merged into the High-performance Embedded Workshop's current symbol table. Choose
Load from the pop-up menu to open the load symbols dialog box:
The dialog box operates like a standard Windows® Open file dialog box; select the file and click Open to start loading.
The standard file extension for symbol files is “.sym”.
17.18.1.7
Saving labels into a file
Choose Save As from the pop-up menu to open the save symbols dialog box. The save symbols dialog box operates like
a standard Windows® Save As dialog box. Enter the name for the file in the File name field and click Save to save the
High-performance Embedded Workshop's current label list to a symbol file. The standard file extension for symbol files
is “.sym”.
See Reference 7, Symbol File Format, for symbol file format.
Once a file is specified by the Save As menu, the current symbol table can be saved in the same symbol file just by
choosing Save from the pop-up menu.
17.18.1.8
Searching for a label
Choose Find from the pop-up menu to open the Find Label dialog box.
1.
Enter the label name that you wish to find into the Name field or select a label name that you have searched
before from the drop-down list box.
2.
Enter the address of the label that you wish to find into the Address field or select an address that you have
searched before from the drop-down list box.
3.
To find the label having the name entered in the Name field, select the Match whole word only check box.
When this option is not selected, the High-performance Embedded Workshop searches for any labels that partly
match the name entered in the Name field (the Address field cannot be used).
4.
When the label name must be case sensitive, select the Match case check box.
5.
Click the OK button to start the search.
REJ10J2169-0100 Rev.1.00
Jul 01, 2010
Page 441 of 523
High-performance Embedded Workshop V.4.08
17. Debugging Facility
Note:
Only the label is stored by 1024 characters of the start, therefore the label name must not overlap mutually in 1024
characters or less.
17.18.1.9
Searching for the next label
Choose Find Next from the pop-up menu to find the next occurrence of the label containing the text that you entered.
17.18.1.10
Viewing the source code corresponding to a label
Select a label and choose View Source from the pop-up menu to open the source file containing the address
corresponding to the label.
17.18.2 Elf/Dwarf2 support
The High-performance Embedded Workshop supports the Elf/Dwarf2 object file format for debugging applications
written in C/C++ and assembly language for Renesas microcomputers.
Key Features:
•
Source level debugging
•
C/C++ operators
•
C/C99*/C++ expression (casting, pointers, references, etc.)
•
Ambiguous function names
•
Overlay memory loading
•
Watch - locals and user defined
•
Stack trace
Note:
*. It is only possible when a compiler that supports C99 specifications is in use.
REJ10J2169-0100 Rev.1.00
Jul 01, 2010
Page 442 of 523
High-performance Embedded Workshop V.4.08
17.18.2.1
17. Debugging Facility
C/C++ operators
The C/C++ language operators are available:
+, -, *, /, &, |, ^, ~, !, >>, <<, %, (, ), <, >, <=, >=, ==, !=, &&, ||
Buffer_start + 0x1000
#R1 | B'10001101
((pointer + (2 * increment_size)) & H'FFFF0000) >> D'15
!(flag ^ #ER4)
17.18.2.2
C/C99/C++ expressions
Expression examples:
Object.value
Specifies direct reference of a member (C/C++)
p_Object->value
Specifies indirect reference of a member (C/C++)
Class::value
Specifies reference of a member with class (C++)
*value
Specifies a pointer (C/C++)
&value
Specifies a reference (C/C++)
array[0]
Specifies an array (C/C++)
Object.*value
Specifies reference of a member with pointer (C++)
::g_value
Specifies reference of a global variable (C/C++)
Class::function(short)
Specifies a member function (C++)
(struct STR) *value
Specifies a cast operation (C/C++)
[+|-] floating-point constant (+|-) Specifies a complex or imaginary number. Hexadecimal floating-point constants are
floating-point constant *I
also supported as the floating-point constants in this expression (only when a compiler
that supports C99 specifications is in use).
17.18.2.3
Supporting duplicate labels
In some languages, for example in C++ overloaded functions, a label may represent more than one address. Just entering
the label name is ambiguous, so the High-performance Embedded Workshop will display the Select Function dialog box
to display overloaded functions and member functions.
REJ10J2169-0100 Rev.1.00
Jul 01, 2010
Page 443 of 523
High-performance Embedded Workshop V.4.08
17. Debugging Facility
Select overloaded functions or member functions in the Select Function dialog box. Generally, only one function can be
selected at one time (except for setting breakpoints, as multiple functions can be selected). This dialog box has three
areas:
Select Function Name
Set Function Name
Counter
(1)
Displays the same-name functions or member functions and their detailed information.
Name
Displays the names of the functions
Address
Displays the addresses of the functions
Displays the function to be set and their detailed information.
Name
Displays the names of the functions
Address
Displays the addresses of the functions
Displays the number of the functions having the same name.
All Function
Displays the number of same-name functions or member functions.
Select Function
Displays the number of functions displayed in the Select Function
Name list box.
Set Function
Displays the number of functions displayed in the Set Function
Name list box.
Selecting a function
Click the function you wish to select in the Select Function Name list box, and click the > button. You will see the
selected function in the Set Function Name list box. To select all functions in the Select Function Name list box, click
the >> button.
(2)
Deselecting a function
Click the function you wish to deselect from the Set Function Name list box, and click the < button. To deselect all
functions, click the << button. The deselected function(s) will be moved from the Set Function Name list box back to the
Select Function Name list box.
REJ10J2169-0100 Rev.1.00
Jul 01, 2010
Page 444 of 523
High-performance Embedded Workshop V.4.08
(3)
17. Debugging Facility
Setting a function
Click the OK button to set the functions displayed in the Set Function Name list box. The functions are set and the
Select Function dialog box closes.
Click the Cancel button to close the dialog box without setting the functions.
17.18.2.4
Debugging an overlay program
Programs making use of the Overlay function can be debugged. This section explains the settings for using the Overlay
function.
(1)
Displaying section group
When the Overlay function is used (i.e. when several section groups are assigned to the same address range), the address
ranges and section groups are displayed in the Overlay dialog box.
Open the Overlay dialog box by choosing [Debug -> Overlay]. This dialog box has two areas: the Address list box and
the Section Name list box.
The Address list box displays the address ranges used by the Overlay function. Click to select one of the address ranges
in the Address list box.
The Section Name list box displays the section groups assigned to the selected address range.
REJ10J2169-0100 Rev.1.00
Jul 01, 2010
Page 445 of 523
High-performance Embedded Workshop V.4.08
(2)
17. Debugging Facility
Setting section group
When using the Overlay function, the highest-priority section group must be selected in the Overlay dialog box,
otherwise the High-performance Embedded Workshop will operate incorrectly.
Firstly, click one of the address ranges displayed in the Address list box. The section groups assigned to the selected
address range will then be displayed in the Section Name list box. Click to select the section group with the highestpriority among the displayed section groups.
After selecting a section group, clicking the OK button stores the priority setting and closes the dialog box. Clicking the
Cancel button closes the dialog box without storing the priority setting.
Note:
Within the address range used by the Overlay function, the debugging information for the section specified in the
Overlay dialog box is referred to. Therefore, the same section of the currently loaded program must be selected in the
Overlay dialog box.
17.18.3 Looking at variables
This section describes how you can look at variables in the source program.
If you are debugging ELF/DWARF2 load modules, static member variables can be displayed together with other member
variables when structures are expanded in the Watch or Locals window. However, it will take time to display the
variables if the window contains a large amount of debugging information.
To select not to display static member variables when structures are expanded in the Watch or Locals window
1.
Select [Setup -> Options] to open the Options dialog box.
2.
Select the Confirmation tab.
3.
Select the Display static member on the variable expansion in the Watch/Locals checkbox. By default, this
checkbox is not selected.
REJ10J2169-0100 Rev.1.00
Jul 01, 2010
Page 446 of 523
High-performance Embedded Workshop V.4.08
4.
17. Debugging Facility
A confirmation dialog box appears. Select No.
The static member variables are hidden even when structures are expanded and this will save time taken for display.
(Even after you have selected No, it is still possible to view the static member variables by adding them to the Watch
window.)
17.18.3.1
Tooltip watch
Use this function to know the value of a variable defined in the source program. Open the editor window or disassembly
window (in source mode) to view the source program and rest the mouse cursor over the variable name that you want to
examine. A tooltip (pop-up window) will appear showing the watch information.
To use Tooltip watch
1.
Select [Setup -> Options]. The Options dialog box opens.
2.
Select the Editor tab.
3.
Check the Enable tooltip watch check box.
4.
Click OK.
To view a tooltip watch on the editor window or disassembly window (in source mode)
1.
Open the editor window or disassembly window (in source mode) showing the variable that you want to
examine.
2.
Rest the mouse cursor over the variable name that you want to examine. A tooltip will appear near the variable
containing basic watch information for that variable.
REJ10J2169-0100 Rev.1.00
Jul 01, 2010
Page 447 of 523
High-performance Embedded Workshop V.4.08
17.18.3.2
17. Debugging Facility
Instant watch
Display the source file containing the variable that you want to examine on the editor window or disassembly window (in
source mode).
Rest the mouse cursor over the variable name that you want to examine and choose Instant Watch from the pop-up
menu; the Instant Watch dialog box will appear and display the variable at the cursor location.
‘+’ shown to the left of the variable name indicates that the information may be expanded by clicking on the variable
name, and ‘-’ indicates that the information may be collapsed. Clicking Add registers the variable in the Watch window.
Clicking Close closes the window without registering the variable in the Watch window.
17.18.3.3
Watch window
The High-performance Embedded Workshop allows you to open Watch windows, which contain a list of variables and
their values.
(1)
Opening the Watch window
To open a Watch window, choose [View -> Symbol -> Watch] or click on the Watch toolbar button (
visible. A Watch window opens.
REJ10J2169-0100 Rev.1.00
Jul 01, 2010
) if it is
Page 448 of 523
High-performance Embedded Workshop V.4.08
17. Debugging Facility
Window configuration
•
This window shows data only when the debugging information available in the load module (*.abs) includes the
information on the C/C++ source program. No data is shown in the window if information on the source
program is excluded from the debugging information due to optimization by the compiler. No variables declared
as macros also can be displayed.
•
Each variable can be dragged from the Editor or Disassembly window and dropped into the Watch window.
You can also use the Add Watch menu option in the Editor or Disassembly window in the source mode to add
a variable.
•
The order of the variables can be changed by dragging and dropping items onto desired positions.
•
If you drag an item in the Watch window and drop it into the Address column of the Memory window, the
address of the variable will be the first address shown in the Memory window.
•
The R mark indicates that the value of the variable can be updated while the user program is running. When a
value is marked with a bold R, this value will be updated in real-time.
•
Double-clicking within the Name column opens the Edit Name dialog box, in which you can change the name
of the variable. Changing of the name can be recorded in a macro (Macro Recording).
•
Double-clicking within the Value column opens the Edit Value dialog box, in which you can change the value
of the variable. Changing of the value can be recorded in a macro (Macro Recording).
•
In the Value column, the values of variables can be changed by in-place editing (Macro Recording).
•
Clicking on the Name or Address column header sorts the variables by name or address.
•
You can also watch variables in the selected scope. The following choices are available: Current Scope (valid
variables within the current scope), Global (global variables), and scope specific to each file (static variables
within the file scope).
•
Double-clicking on the Scope column opens the Set Scope dialog box.
•
In the Scope column, the scope can be changed by in-place editing.
REJ10J2169-0100 Rev.1.00
Jul 01, 2010
Page 449 of 523
High-performance Embedded Workshop V.4.08
17. Debugging Facility
Options
Right-clicking displays a pop-up menu containing available options.
A basic operation is allocated to the toolbar.
The Toolbar display and Customize toolbar options are also included in the pop-up menu opened by right-clicking on
the toolbar.
Pop-up Menu Option
Toolbar Macro
Description
Button Recording
Enable Auto Update
Marks the selected variable with a bold R and updates the variable
in real-time.
Enable Auto Update All
Marks all variables with bold Rs and updates all variables in realtime.
Disable Auto Update
Marks the selected variable with an outlined R and cancels realtime update.
Disable Auto Update All
Marks all variables with outlined Rs and cancels real-time update.
Update Interval *
-
Record
Start Recording
Update Value
Sets an update interval.
Opens the Recording Settings dialog box and starts recording
the history of updating of values.
Stop Recording
Stops recording the history of updating of values.
Add Watch
Launches the Add Watch dialog box, allowing the user to enter a
variable or expression to be watched.
Edit Name
Launches the Edit Name dialog box, allowing the user to change
the variable's name.
Edit Value
Launches the Edit Value dialog box, allowing the user to change
the variable's value.
Set Scope
-
Delete
Removes the variable indicated by the text cursor from the Watch
window.
Delete All
Radix
Sets the scope for the selected symbol.
Removes all the variables from the Watch window.
Hexadecimal
Displays in hexadecimal.
Decimal
Displays in decimal.
Octal
Displays in octal.
Binary
Displays in binary.
-
Sets the default radix for newly added variables.
Copy
-
Places a copy of the highlighted text into the Windows® clipboard.
Save As
-
Saves the currently displayed contents.
Go To Memory
-
Opens a Memory window for the address.
Set Initial
Toolbar display
-
-
Shows or hides the toolbar.
Customize toolbar
-
-
Customizes toolbar buttons.
Note:
*. Available only when the debugger supports this function.
REJ10J2169-0100 Rev.1.00
Jul 01, 2010
Page 450 of 523
High-performance Embedded Workshop V.4.08
(2)
17. Debugging Facility
Adding a variable
You can add variables to the Watch window.
To add a variable to a Watch window
•
Editor or Disassembly window (in source mode)
o
Right-click on a variable in the window and select Add Watch from the pop-up menu.
o
Right-click on a variable in the window and select Instant Watch from the pop-up menu. Then click on the
Add button in the Instant Watch dialog box (this is the instant watch feature).
o
Drag and drop a variable into the Watch window.
The default scope applies to the added variable but the selection depends on whether the program is running or not.
State of the Program
Scope
Stopped
[Current Scope]
Running
[Global]
•
Watch window
1.
Open the Add Watch dialog box in either of the following ways.
o
Select the window and press the Insert key.
o
Right-click within the window and select Add Watch from the pop-up menu.
REJ10J2169-0100 Rev.1.00
Jul 01, 2010
Page 451 of 523
High-performance Embedded Workshop V.4.08
2.
3.
17. Debugging Facility
Enter the name of the variable that you wish to watch in the Variable or expression field.
The element number for an array entered in the Variable or expression field can be binary, octal, decimal, or
hexadecimal.
Note, however, that there are the following rules on the prefix.
Element Number of the Array
Rule
Binary
The prefix must be "0b" or "0B".
Octal
The prefix must be "0".
Decimal
No prefixes are required.
Hexadecimal
The prefix must be "0x" or "0X".
Select the scope for the variable from the Scope drop-down list. Even when there are two or more variables with the
same name, scope can be separately specified to distinguish them.
The available types of scope are listed below.
Scope
Description
[Current Scope]
This scope covers all variables that can be watched from the address
indicated by the program counter.
This scope is not displayed while the program is running.
[Global]
This scope covers global variables in all load modules. Global variables
declared as static cannot be watched.
File scope name: Load module name
This scope covers static variables within the specified file scope. Static
variables declared within functions and global variables watched in the
Global scope cannot be watched.
The default scope for newly added variables will be as follows depending on whether the program is running or not.
4.
State of the Program
Scope
Stopped
[Current Scope]
Running
[Global]
Clicking on the Detail button opens the Set Scope dialog box, in which scope for newly added variables can be
selected in the same way as in the Scope drop-down list of the Add Watch dialog box. Before selecting a desired file
scope name in the Set Scope dialog box, you can also check full paths to source files or filter file scope names by the
string entered in the Filter box. The full file paths, however, may not be displayable for some toolchains.
Variables that you have set in the Watch window are saved in the session file.
REJ10J2169-0100 Rev.1.00
Jul 01, 2010
Page 452 of 523
High-performance Embedded Workshop V.4.08
17. Debugging Facility
Note:
If the variable that you have added is a local variable that is not currently in scope, the High-performance Embedded
Workshop will add it to the Watch window but its value will be ‘Not available now’.
(3)
Editing the name of a variable
You can change the name of a variable. Even if variables can be expanded (e.g. structures or pointers), however, the
names of their sub items are not changeable.
To edit the name of a variable
Open the Edit Name dialog box in either of the following ways.
•
Double-click within the Name column.
•
Right-click on the line of a variable and select Edit Name from the pop-up menu.
Enter the new name in the Value or expression field and click OK.
The Watch window is updated to show the new name.
REJ10J2169-0100 Rev.1.00
Jul 01, 2010
Page 453 of 523
High-performance Embedded Workshop V.4.08
17. Debugging Facility
Note:
Names of variables cannot be changed in the following cases.
•
The user program is running.
•
Two or more variables are selected.
(4)
Expanding a variable
If a variable is a pointer, array, or structure, then you will see a plus sign (+) expansion indicator to left of its name, this
means that you can expand the variable. To expand a variable, click on it. The item expands to show the elements (in the
case of structures and arrays) or data value (in the case of pointers) indented by one tab stop, and the plus sign changes to
a minus sign (-). If the elements of the variable also contain pointers, structures, or arrays then they will also have
expansion indicators next to them.
To collapse an expanded variable, click on the item again. The item's elements will collapse back to the single item and
the minus sign changes back to a plus sign.
The variable can be expanded for the number of levels when a numerical key from 1 to 9 is pressed while a variable is
selected.
(5)
Editing the value of a variable
You can change the value of a variable.
To edit the value of a variable
Select either of the following ways.
REJ10J2169-0100 Rev.1.00
Jul 01, 2010
Page 454 of 523
High-performance Embedded Workshop V.4.08
•
In-place edit in the Value column.
•
Open the Edit Value dialog box in one of the following ways.
o
Double-click within the Value column.
o
Press the Enter key on the line of a variable.
o
Right-click on the line of a variable and select Edit Value from the pop-up menu.
17. Debugging Facility
Enter the new value in the New Value field and click OK.
The Watch window is updated to show the new value.
(6)
Setting the scope of variables
The Watch window has the Scope column that shows the scope for registered variables.
The scope for sub items is the same as that for their root item and is not shown in the window.
In the Scope column, you can select the scope for each of the variables that have been registered. Even when there are
two or more variables with the same name, scope can be separately specified to distinguish them.
REJ10J2169-0100 Rev.1.00
Jul 01, 2010
Page 455 of 523
High-performance Embedded Workshop V.4.08
17. Debugging Facility
The available types of scope are listed below.
Scope
Description
[Current Scope]
This scope covers all variables that can be watched from the address
indicated by the program counter.
This scope is not displayed while the program is running.
[Global]
This scope covers global variables in all load modules. Global variables
declared as static cannot be watched.
File scope name: Load module name
This scope covers static variables within the specified file scope. Static
variables declared within functions and global variables watched in the Global
scope cannot be watched.
To set scope of a variable
Select either of the following ways.
•
In-place edit in the Scope column. Click on the button on the right edge of the list box and select scope from the list.
•
Open the Set Scope dialog box in either of the following ways.
o
Double-click within the Scope column.
o
Right-click on the line of a variable and select Set Scope from the pop-up menu.
REJ10J2169-0100 Rev.1.00
Jul 01, 2010
Page 456 of 523
High-performance Embedded Workshop V.4.08
17. Debugging Facility
1.
Select scope for the variable shown in the Expression field.
2.
If you have selected a load module name in Scope, select the corresponding file scope from the list in the File
Scope section. You can also filter scope names by the string (not case-sensitive) entered in the Filter box before
selecting a desired scope name.
Note:
If the scope for a variable selected in the Watch window does not match the download module, the Scope column on the
line of the variable is highlighted. Set the correct scope for the variable.
(7)
Deleting a variable
To delete a variable, select it from the Watch view and choose Delete from the pop-up menu. The variable is deleted and
the Watch view is updated.
To delete all variables, choose Delete All from the pop-up menu. The all variable s are deleted and the Watch view is
updated.
REJ10J2169-0100 Rev.1.00
Jul 01, 2010
Page 457 of 523
High-performance Embedded Workshop V.4.08
(8)
17. Debugging Facility
Modifying the radix
The radix for the selected variable display can be modified by choosing Radix from the pop-up menu.
The followings can be selected.
Hexadecimal
Decimal
Octal
Binary
(9)
Display in hexadecimal. (Default)
Display in decimal.
Display in octal.
Display in binary.
Specifying the default radix
If you select a variable and click on [Radix -> Set Initial], the Initial Radix dialog box opens.
Select a radix from the list box. This will be applied as the default radix for newly added variables.
(10) Saving the Watch window contents in a file
To save the contents of the Watch window, choose Save As from the pop-up menu; the Save As dialog box opens. It
allows the user to specify the name of a file and to save the contents of the Watch window in the file. If the Append
check box is selected, the window contents are appended to the existing file, and if it is not selected, the existing file is
overwritten.
(11) Opening a Memory window
The contents of the memory area to which the selected variable is assigned can be displayed in the Memory window.
Choosing Go To Memory from the pop-up menu opens the Memory window.
If you drag an item in the Watch window and drop it into the Address column of the Memory window, the address of
the variable will be the first address shown in the Memory window.
REJ10J2169-0100 Rev.1.00
Jul 01, 2010
Page 458 of 523
High-performance Embedded Workshop V.4.08
17. Debugging Facility
If two or more variables with the same name are assigned to different scope, the Memory window shows the memory
area that can be watched from the address indicated by the program counter.
(12) Setting real-time update
The R mark shown to the left of each variable indicates whether the variable is updated in real-time.
A pop-up menu containing the following options is available in the Watch window:
Enable Auto Update
Enable Auto Update All
Disable Auto Update
Disable Auto Update All
Marks the selected variable with a bold R and updates the variable in real-time.
Marks all variables with bold Rs and updates all variables in real-time.
Marks the selected variable with an outlined R and cancels real-time update.
Marks all variables with outlined Rs and cancels real-time update.
The values of variables for which real-time update has been enabled can be modified during execution of the program.
(13) Setting an update interval
The interval to update the display contents of the Watch window during execution of the user program can be changed.
Support for this function depends on the debugger.
To set an update interval
1.
Right-click within the window to open a pop-up menu.
2.
Select Update Interval. The Update Interval Setting dialog box opens.
REJ10J2169-0100 Rev.1.00
Jul 01, 2010
Page 459 of 523
High-performance Embedded Workshop V.4.08
17. Debugging Facility
3.
Specify an update interval in 10-ms units for Interval. The default value is 100 ms. The valid range of values
depends on the debugger in use.
4.
Click OK.
The specified update interval is applied to all panes of the Watch window.
The actual update interval may be longer than the specified value depending on the state of execution.
(14) Recording the history of updating of values
The history of updating of the values of variables, to which automatic update has been applied in the Watch window, can
be recorded into a file.
To start recording the history of updating of values
1.
Right-click within the window to open a pop-up menu.
2.
Select Record Update Value and then Start Recording from submenus. The Recording Settings dialog box
opens.
3.
In the Recording Settings dialog box, specify how to record the history.
4.
Select a sheet that you wish to record the history in Recording Sheet. Only one sheet can be used for recording
at one time.
Recording Sheet only lists the names of the sheets that include variables to which automatic update has been
applied.
REJ10J2169-0100 Rev.1.00
Jul 01, 2010
Page 460 of 523
High-performance Embedded Workshop V.4.08
17. Debugging Facility
5.
Enter the file name in File name. To insert a placeholder in File name, click the Placeholder button and select
Placeholder from the pop-up menu. To browse a file, click the Browse button.
6.
To append data to the specified file, select the Append checkbox.
7.
Select the Timestamp checkbox to record timestamps (ms) in the file. This checkbox is not selected by default.
8.
Clicking the OK button starts recording except in the following case:
•
The Append checkbox is selected but the watched variables recorded in the file selected in File name and those
to be recorded contained in the sheet selected in Recording Sheet do not match or the radixes are different.
Once recording is started, the values of variables are recorded into the file when:
•
Values are automatically updated (in real-time) during execution
•
Values are updated with the stop of execution
•
Values are changed
•
Display is refreshed by an operation in the window
To stop recording the history of automatically updated values
1.
Right-click within the window to open a pop-up menu.
2.
Select Record Update Value and then Stop Recording from submenus.
Recording is automatically stopped when:
•
A program is downloaded or unloaded
•
Expansion of watched variables to be recorded is collapsed
•
The radix for watched variables to be recorded is changed
•
A new variable to be watched is added to the sheet selected for recording
•
The order of watched variables to be recorded is changed
•
Automatic update of watched variables to be recorded is canceled
(15) Changing text colors
You can customize the font and text coloring for the Watch window through the Format Views dialog box (the Text
category in the table below).
It is also possible to use the Format Views dialog box to specify the color for memory with a specific attribute or
changed values shown in the Value column of the Watch window.
REJ10J2169-0100 Rev.1.00
Jul 01, 2010
Page 461 of 523
High-performance Embedded Workshop V.4.08
17. Debugging Facility
To change the look of the Watch window
1.
Select [Setup -> Format Views]. The Format Views dialog box opens.
2.
Select the Watch item in the tree and expand it.
3.
Select the category of objects to be customized.
Category
Objects to be Customized
Foreground color (default) Background color (default)
Text
Text shown in the window
Black
White
Read *
Memory that has been read
Black
Green
Write *
Memory that has been written to
Black
Red
Modified
Variables whose value or position
has been changed
Red
White
Note:
*. Support for this function depends on the debugger.
4.
Modify the Foreground and Background color selection on the Color tabbed page as desired.
5.
Click OK.
(16) Selecting an encoding format
If the values of variables are characters or strings and they should be displayed as UTF-8 code, select [Setup -> Options]
to open the Options dialog box. Click on the Debug tab and select UTF-8 for Encoding Format.
The Watch window now shows the values of variables as UTF-8 code. If Local Code Page (default) has been selected
for Encoding Format, the values are displayed as ASCII code.
Note:
The default font for display in the Watch window is Courier New, which is not supported by UTF-8. Select another font
compatible with UTF-8 in the Format Views dialog box in advance.
(17) Sorting variables
Clicking on the Name or Address column header sorts the variables by name or address. Every time you click on the
column headers, the variables are alternately sorted in ascending and descending order.
REJ10J2169-0100 Rev.1.00
Jul 01, 2010
Page 462 of 523
High-performance Embedded Workshop V.4.08
17.18.3.4
17. Debugging Facility
Locals window
The local variables and their values can be displayed in the Locals window.
(1)
Opening the Locals window
To open the Locals window, choose [View -> Symbol -> Locals] or click the Locals toolbar button (
).
Window configuration
•
The local variables and their values can be displayed. As you debug your program, the Locals window will be
updated. If a local variable is not initialized when defined, then the value in the Locals window will be
undefined until a value is assigned to the local variable.
•
The contents of this window are blank unless the current PC can be associated to a function containing local
variables in the source files via the debugging information available in the absolute file (*.abs).
•
Double-clicking the Value column opens a dialog box, which allows you to change the value of a local variable.
(Macro Recording)
•
The value of a local variable can be changed by using in-place editing. (Macro Recording)
REJ10J2169-0100 Rev.1.00
Jul 01, 2010
Page 463 of 523
High-performance Embedded Workshop V.4.08
17. Debugging Facility
Options
Right-clicking displays a pop-up menu containing available options.
A basic operation is allocated to the toolbar.
The Toolbar display and Customize toolbar options are also included in the pop-up menu opened by right-clicking on
the toolbar.
Pop-up Menu Option Toolbar Button Macro Recording Function
Edit Value
Radix
Launches a dialog box to modify the selected variable's
value.
Hexadecimal
-
Displays in hexadecimal.
Decimal
-
Displays in decimal.
Octal
-
Displays in octal.
Binary
-
Displays in binary.
-
Places a copy of the highlighted text into the Windows®
clipboard.
Copy
Toolbar display
-
-
Shows or hides the toolbar.
Customize toolbar
-
-
Customizes toolbar buttons.
(2)
Editing the value of a local variable
You can change the value of a local variable in the Locals window.
To edit the value of a local variable
Select either of the following ways.
•
In-place edit in the Value column.
•
Open the Edit Value dialog box in one of the following ways.
o
Double-click within the Value column.
o
Right-click on the line of a variable and select Edit Value from the pop-up menu.
REJ10J2169-0100 Rev.1.00
Jul 01, 2010
Page 464 of 523
High-performance Embedded Workshop V.4.08
17. Debugging Facility
Enter the new value in the New Value field and click OK.
The Locals window is updated to show the new value.
(3)
Modifying the radix
The radix for the selected variable display can be modified by choosing Radix from the pop-up menu.
The followings can be selected.
Hexadecimal
Decimal
Octal
Binary
(4)
Display in hexadecimal. (Default)
Display in decimal.
Display in octal.
Display in binary.
Selecting an encoding format
If the values of variables are characters or strings and they should be displayed as UTF-8 code, select [Setup -> Options]
to open the Options dialog box. Click on the Debug tab and select UTF-8 for Encoding Format.
The Locals window now shows the values of variables as UTF-8 code. If Local Code Page (default) has been selected
for Encoding Format, the values are displayed as ASCII code.
Note:
The default font for display in the Locals window is Courier New, which is not supported by UTF-8. Select another font
compatible with UTF-8 in the Format Views dialog box in advance.
REJ10J2169-0100 Rev.1.00
Jul 01, 2010
Page 465 of 523
High-performance Embedded Workshop V.4.08
18. Synchronized Debugging
18. Synchronized Debugging
The synchronized debugging system is designed to help with debugging multi-core devices.
It allows you to run programs on multiple CPU cores and synchronize common debug operations (Go, step, halt etc.)
between the cores. The Synchronized Debug dialog box is the main entry point for configuring and initiating the
synchronized debugging system.
Options related to synchronized debugging are saved in “SDO” files. These are always located in the “Sync” directory.
This is defined as:
“<Local settings directory>\Renesas\HEW\hew_001\Sync”
The local settings directory is set by Windows® and is normally:
Window® 2000 or Windows® XP operating system:
“C:\Documents and Settings\<user name>\Local Settings\Application Data”
Window Vista® or Window® 7 operating system:
“C:\Users\<user name>\AppData\Local”
18.1
The Synchronized Debug dialog box
Select Synchronized Debugging from the Debug menu to open the Synchronized Debug dialog box.
This can be done when High-performance Embedded Workshop initially starts up or when there is a workspace open.
There is also an option to open the dialog from the High-performance Embedded Workshop Welcome! dialog box.
REJ10J2169-0100 Rev.1.00
Jul 01, 2010
Page 466 of 523
High-performance Embedded Workshop V.4.08
18.1.1
18. Synchronized Debugging
Managing configurations
The Current configuration drop list
The drop list at the top of the Synchronized debug dialog will have an entry for each configuration file in the Sync
directory. In order to change the settings on the dialog to a previously saved configuration you should select the
configuration in the drop list. When you select a configuration the current settings will automatically be saved to the file
of the previously selected configuration.
To create new configurations
To create a new empty configuration use the following method.
1.
Click the New button.
REJ10J2169-0100 Rev.1.00
Jul 01, 2010
Page 467 of 523
High-performance Embedded Workshop V.4.08
18. Synchronized Debugging
2.
Enter a name for the configuration. You can only enter characters which are valid in a file name. You are limited
to 100 characters.
3.
Click OK.
A “.SDO” file will automatically be created for the new configuration and stored in the “Sync” directory. The new
configuration will be added to the configuration drop list and become selected as the current configuration. All other
controls on the dialog will be reset to the default state.
To save an existing configuration to a different filename
This is the equivalent of a “Save As” file operation. To save the current dialog settings to a new configuration use the
following method:
1.
Click the Save as button.
2.
Enter a new unique name for the configuration file.
3.
Click Save.
If the configuration was saved to the Sync directory then the configuration will be added to the drop list and selected
exactly as it would for a completely new configuration, except that the dialogs controls will not be reset to default.
However the file can also be saved to a different location (for example a network drive so that it can be shared with other
High-performance Embedded Workshop users) in which case the configuration will not be added to the drop list.
To import configurations
In order to import a configuration into High-performance Embedded Workshop, copy the configuration’s SDO file into
the Sync directory (before opening the Synchronized Debug dialog box) or follow the following method on the dialog
box:
1.
Click the Import button.
2.
Browse to the configuration file you want to import.
3.
Click Import.
The file will be copied to the Sync directory and the configuration will be added to the drop list where it will be selected
and then loaded.
REJ10J2169-0100 Rev.1.00
Jul 01, 2010
Page 468 of 523
High-performance Embedded Workshop V.4.08
18. Synchronized Debugging
To delete configurations
In order to delete a configuration, delete the configuration’s file from the Sync directory (before opening the
Synchronized Debug dialog box) or follow the following method:
1.
Select the configuration you want to delete from the drop list.
2.
Click the Delete button.
The configuration will be removed from the drop list. The file will be deleted from the Sync directory. The next
(alphabetically) configuration in the drop list will be selected and then loaded.
18.1.2
Defining the synchronized Debuggers
The Debuggers list
The list box in the middle of the dialog shows information on the synchronized Debuggers (essentially a debug session
within a High-performance Embedded Workshop workspace).
When the dialog is first opened the list will be set to contain details of all debug sessions open in any High-performance
Embedded Workshop application running on the local PC. The same also occurs when you change your configuration
selection or create a new empty configuration. This is to help with multi-core configuration setup. For example, it is
possible to open several sessions in separate High-performance Embedded Workshop applications, open the
Synchronized Debug dialog in one of the applications and then proceed with synchronized Debugging without having to
individually add each session to the Debuggers list.
A platform (or a core on a multi-core platform) cannot be synchronized without first creating a High-performance
Embedded Workshop debug session for it.
Note:
If any Debugger in the Debuggers list is currently connected to its platform then the Debuggers list will be read only. It
will not be possible to add, modify or remove any Debugger. Also Debuggers that are already connected to a platform
will not be automatically added to the list.
REJ10J2169-0100 Rev.1.00
Jul 01, 2010
Page 469 of 523
High-performance Embedded Workshop V.4.08
18. Synchronized Debugging
Each entry in the list contains the following information:
Debugger ID:
Status:
Options:
Type:
Workspace:
Session:
A unique ID. This should be set to something that identifies the Debugger.
Will be one of the following:
Not open:
The Debugger is not currently open in a High-performance Embedded
Workshop application. It will be opened when the “Sync” button is clicked.
Not connected:
The Debugger is currently not connected to a platform.
Break:
The Debugger is connected to a platform and it is not running.
Running:
The Debugger is connected to a platform and it is running.
Platform specific option on how the Debugger will be used when synchronized debugging starts.
Select “Debug” for normal debugging.
Type of platform associated with the Debugger. Will be one of the following:
Single core:
Normal single core platform.
Multi core:
Multi-core platform.
The full name of the workspace file that contains the Debugger’s session.
The name of the Debugger’s session within the workspace.
Adding a Debugger to the list
1.
Click the Add button.
2.
Enter, or browse to, a valid High-performance Embedded Workshop workspace file.
3.
Select a project within the workspace.
4.
Select a session within the project.
5.
Click OK.
The combination of workspace, project and session specifies a Debugger. This is added to the list on the main dialog. The
Debugger is given an initial ID based on its platform name (normal single core platform), or core name (multi-core
platform).
REJ10J2169-0100 Rev.1.00
Jul 01, 2010
Page 470 of 523
High-performance Embedded Workshop V.4.08
18. Synchronized Debugging
Note:
The specified workspace must be up to date with the current version of High-performance Embedded Workshop and not
have been copied to a new location after it was last opened in High-performance Embedded Workshop. Any such
workspace must be opened and closed normally in High-performance Embedded Workshop (so that the workspace files
are updated) before it can be specified on this dialog.
Changing a Debugger’s ID
1.
Select the Debugger to be changed in the list.
2.
Click the Modify button.
3.
Enter a new unique ID for the Debugger.
4.
Click OK.
The Debugger’s ID will be updated in the list.
It is not possible to modify Debugger IDs when synchronized.
Changing a Debugger’s options
There are two methods of changing a Debugger’s options.
First method:
1.
Select the Debugger in the list.
2.
Click the Modify button.
3.
Select the new options from the drop list.
4.
Click OK.
REJ10J2169-0100 Rev.1.00
Jul 01, 2010
Page 471 of 523
High-performance Embedded Workshop V.4.08
18. Synchronized Debugging
Second method:
1.
Select the Debugger in the list.
2.
Click the Debugger’s Options entry. This will display a drop list.
3.
Select the new options from the drop list.
It is not possible to modify options when synchronized.
Removing a Debugger from the list
1.
Select the Debugger you want to remove.
2.
Click the Remove button.
The Debugger will be removed from the list.
18.1.3
Setting the synchronization options
Overview
In this context “synchronization” refers to a virtual link from one Debugger/core to another Debugger/core for a specific
debug operation (e.g. Go). While debugging is synchronized, these virtual links are examined whenever a debug
operation is executed. If a synchronization exists for the operation from the Debugger where the operation is executed to
another Debugger then the operation will be executed on both Debuggers. The synchronizations are followed through
multiple Debuggers to find out which Debuggers the operation needs to be executed on. Synchronizations can be one
way or two way.
Example 1:
Two Debuggers are synchronized with IDs “CORE0” and “CORE1”. Only one synchronization exists and it is one way
for the Go debug operation from “CORE0” to “CORE1”. When a Go is executed in the “CORE0” Debugger the Go will
occur on both Debuggers. When a Go is executed in the “CORE1” the Go will only occur on “CORE1”.
REJ10J2169-0100 Rev.1.00
Jul 01, 2010
Page 472 of 523
High-performance Embedded Workshop V.4.08
18. Synchronized Debugging
Example 2:
Four Debuggers are synchronized with IDs “CORE0”, “CORE1”, “CORE2” and “CORE3”. Two way synchronizations
exist for the Go debug operation between each Debugger and every other Debugger. When a Go is executed in any
Debugger the Go will occur on all Debuggers.
By changing the configuration (SDO) file in a text editor (see <html link>) many synchronizations can be setup in as
complex a pattern as required, however the GUI only allows the most commonly required styles of synchronizations to
be specified.
Synchronization style
Three basic styles of synchronization can be set using the dialog:
None:
All debuggers synchronized:
Master debugger:
No synchronizations.
Two way synchronizations between each Debugger and every other Debugger
for the checked operations.
One way synchronizations from the specified master Debugger to every other
Debugger for the checked operations. The drop-list next to this option
specifies which Debugger will be the master Debugger.
Synchronization options
The check boxes here show the debug operations which can be synchronized. The state of the following operations can
be synchronized as required: Reset, Go, Break/Halt and Step. The following operations can also be synchronized but
their state is always set by the platform being debugged: Connection, Download and Initialize. For non multi-core
platforms they will always be off.
Platform settings
When debugging a multi-core platform some synchronizations that are normally user configurable may be automatically
enabled. If an option check box is checked and grayed out this means that the platform has specified that the operation
must always be synchronized.
REJ10J2169-0100 Rev.1.00
Jul 01, 2010
Page 473 of 523
High-performance Embedded Workshop V.4.08
18. Synchronized Debugging
Notes:
•
Platform settings cannot be overridden by editing the SDO (configuration) file.
•
Platform settings override your style selection. These operations will always be synchronized between all Debuggers
even when “None” or “Master debugger” is selected.
18.1.4
Setting the memory update option
When this option is checked all High-performance Embedded Workshop views which display memory data (e.g. the
memory view, the watch view etc.) in all Debuggers will update (i.e. read memory from the platform) whenever the
memory is changed in any synchronized Debugger.
If the option is not set then only the memory views in the local Debugger will update when memory is changed. If
memory is shared between Debuggers, a manual refresh will need to be performed in the memory related windows of the
other Debuggers in order for them to display the correct memory.
Memory is usually only shared between Debuggers when debugging a multi-core platform. If memory is not shared
between Debuggers (e.g. when debugging several single core platforms) then actions in one Debugger cannot change the
memory in another so the state of this check box is not important.
18.1.5
Synchronized debugging mode
Select the mode to be used while Debugging:
Internal:
Parallel:
The specified Debuggers will be opened in one High-performance Embedded Workshop application.
This mode is only available when all the Debugger’s Session’s are in the same High-performance
Embedded Workshop workspace.
The specified Debuggers will be opened in separate High-performance Embedded Workshop
applications.
Note:
The “Internal” mode option will only be available if all the sessions in the Available Debuggers list are from the same
workspace. It is not possible to use the Internal mode option when sessions from separate workspaces are selected.
REJ10J2169-0100 Rev.1.00
Jul 01, 2010
Page 474 of 523
High-performance Embedded Workshop V.4.08
18.1.6
18. Synchronized Debugging
Start synchronized debugging
Once the synchronized debug configuration has been set up click the Sync button to begin debugging. If Parallel mode
has been selected one Debugger will be opened in the High-performance Embedded Workshop application from which
the Synchronized Debug dialog box was launched and new High-performance Embedded Workshop applications will be
opened for the remaining Debuggers. If Internal mode was selected the workspace that is common to all the Debuggers
will be opened in the High-performance Embedded Workshop application from which the Synchronized Debug dialog
box was launched.
See section 18.2, Using High-performance Embedded Workshop when synchronized for details on how to use Highperformance Embedded Workshop while synchronized.
18.1.7
Update synchronized debugging
If synchronized debug mode was already running when the Synchronized Debug dialog was opened, there will be an
Update button instead of a Sync button. After the Update button is clicked the system will update according to the new
settings that have been specified since opening the Synchronized Debug. This might include opening additional Highperformance Embedded Workshop applications when using Parallel mode.
See section 18.2, Using High-performance Embedded Workshop when synchronized for details on how to use Highperformance Embedded Workshop while synchronized.
18.1.8
Stop synchronized debugging
If already running in synchronized debug mode when the Synchronized Debug dialog was opened, the Unsync button
will be enabled. In order to stop using synchronized debugging click the Unsync button. Any synchronized Highperformance Embedded Workshop applications will disconnect from their platform and function independently again.
The Debugger’s tab will be removed form the Workspace Window. Debugger operations will no longer be synchronized.
No High-performance Embedded Workshop applications will be closed down.
18.2
Using High-performance Embedded Workshop while synchronized
The main purpose of using High-performance Embedded Workshop in synchronized debugging mode is to have the main
Debugger options synchronized between different High-performance Embedded Workshop debugging sessions, usually
connected to a multi-core platform.
Many aspects of High-performance Embedded Workshop functionality are the same when using Parallel or Internal
mode however some things will be different.
REJ10J2169-0100 Rev.1.00
Jul 01, 2010
Page 475 of 523
High-performance Embedded Workshop V.4.08
18.2.1
18. Synchronized Debugging
Common functionality
Debuggers tab
This tab is added to the Workspace Window when synchronized debugging begins. It contains a separate item for each
synchronized Debugger. The text of each item will be the display ID specified on the Synchronized debug dialog. The
icon of each item indicates the current status of the Debugger. The following status icons are possible:
The Debugger is not connected to a platform.
The Debugger is connected to a platform which is currently stopped (i.e. not running).
The Debugger is connected to a platform which is currently running.
When you right click on a Debugger ID the following menu will be displayed:
Reset CPU
Go
Reset Go
Step In
Step Out
Step Over
Halt Program
Allow Docking
Hide
Properties
When an operation is selected it will be executed on the selected Debugger(s) only. All synchronizations are ignored
when an operation is executed from the Debuggers tab. When debugging a multi-core platform, some operations will be
disabled. These are operations that are always synchronized by the hardware which means that the operation cannot be
executed on the platform’s cores separately.
Menu items will also be disabled if the operation is not possible on the selected Debugger. For example, if you right click
on a Debugger which is running, only the “Halt Program” menu item will be enabled.
The “Properties” menu item is used to find out information on a Debugger. When selected, a dialog will be displayed
containing the following items: Workspace file, workspace name, project name and session name.
The “Activate” menu item is only enabled when debugging in Internal mode. When selected this will make the selected
Debugger the currently active one. See section 18.2.3, Internal mode functionality for more information.
REJ10J2169-0100 Rev.1.00
Jul 01, 2010
Page 476 of 523
High-performance Embedded Workshop V.4.08
18. Synchronized Debugging
Debugger operations
The following table describes the operations that can be synchronized. The synchronized operations are determined by
the selections on the Synchronized Debug dialog box. The table columns contain the following data:
Operation:
Option(s):
Name of the operation.
The check box option (or options) that must be checked on the Synchronized Debug dialog for
the operation to be synchronized.
How the operation is executed in High-performance Embedded Workshop.
The effect (in all synchronized Debuggers) of executing the operation.
Method:
Effect:
“initial platform” means the platform connected to the Debugger where the operation was started. Sometimes the effect
in this Debugger can be different from the others, depending on the operation executed.
Operation Option(s)
Method
Effect
Reset CPU Reset
“Debug->Reset CPU” menu.
Reset CPU toolbar button.
“reset” command.
After download when “Reset CPU after
download” option is enabled.
Resets all synchronized platforms.
Go
Go
“Debug->Go” menu.
Go toolbar button.
“go” command.
Runs all synchronized platforms.
Go Until
Go
“Debug->Run” menu.
After reset when “Run to main on reset” option
is enabled.
Editor pop-up “Go to Cursor” menu.
Runs initial platform with a specific set of
temporary breakpoints.
Runs all other synchronized platforms
normally.
Reset Go
Reset and Go
“Debug->Reset Go” menu.
Reset Go toolbar button.
“go_reset” command.
Resets and then Runs all synchronized
platforms (Note: This may not be the same
as performing a reset and go separately,
depending on your platform)
Break
Break/Halt
Breakpoint is reached.
Stops all synchronized platforms running.
Halt
Break/Halt
“Debug->Halt” Program menu.
Halt toolbar button.
“halt” command.
Stops all synchronized platforms running.
Step In
Step
“Debug->Step In” menu.
Step In toolbar button.
“step” command.
Performs step in on all synchronized
platforms.
Step Over Step
“Debug->Step Over” menu.
Step Over toolbar button.
“step_over” command.
Performs step over on all synchronized
platforms.
Step Out
Step
“Debug->Step Out” menu.
Step Out toolbar button.
“step_out” command.
Performs step out on all synchronized
platforms.
Connect
Connection
“Debug->Connect” menu.
Connect toolbar button.
“connect” command or platform specific
command.
Connects to the platform in all
synchronized Debuggers.
REJ10J2169-0100 Rev.1.00
Jul 01, 2010
Page 477 of 523
High-performance Embedded Workshop V.4.08
18. Synchronized Debugging
Operation Option(s)
Method
Download Download
(file load) modules
“Debug->Download Modules” menu item.
Downloads the module to all synchronized
Workspace tab “Download modules” folder.
platforms. The module filename must be
“file_load” command.
the same in each Debugger.
On connection when “Download automatically
on target connection” option is set.
After build when “Download modules after build”
option is set.
When a module is modified externally to Highperformance Embedded Workshop.
Initialize
“Debug->Initialize” menu.
“initialize” command.
Initialize
Effect
All synchronized platforms will be
initialized.
Regarding stepping, the style of step performed (source or instruction) in a synchronized Debugger will be determined by
the program counter, step mode and editor cursor position in that Debugger and not the Debugger where the operation
was initiated. Each individual Debugger will effectively act as if the step operation had been executed locally by the
normal High-performance Embedded Workshop method (e.g. toolbar button).
Regarding download, the operation will only be synchronized with Debuggers that have modules with the same filename
as the module in the initiating Debugger. If a Debugger contains more than one module then only the one with the
matching filename will be downloaded.
Unless specifically mentioned, all other Debugger operations, and other non Debugger High-performance Embedded
Workshop operations, are possible while synchronized debugging. But they will only be executed on the initiating
platform and not synchronized with other platforms.
Debug Settings dialog box
REJ10J2169-0100 Rev.1.00
Jul 01, 2010
Page 478 of 523
High-performance Embedded Workshop V.4.08
18. Synchronized Debugging
While synchronized debugging the functionality of the Debug Settings dialog is different. Instead of being able to set all
the normally available options it is only possible to change the Download modules which are set in each Debugger’s
session. It is possible to use multi select on the left side of the dialog to change the setup of multiple sessions at the same
time. This allows the same module to be added easily to several sessions ready for a synchronized download.
For each module in each session you can use the “Modify” button to specify that debug information only should be
downloaded. If a multi-core target is being used, with all cores sharing the same memory, it is recommended that the full
memory image is downloaded in one session and debug information only is downloaded in the others.
The functionality of the buttons on the dialog are the same as when debugging normally. See section 17.1.4.3, Editing
debug settings for details.
18.2.2
Parallel mode functionality
General operation
When running in parallel mode each Debugger is a separate High-performance Embedded Workshop application. These
can be used independently exactly like when debugging normally, just with the debugger operations synchronized.
High-performance Embedded Workshop window title
The High-performance Embedded Workshop window title will start with the display ID of the Debugger open in the
application. This will not change while the application is Synchronized.
Automatic un-sync
If an operation is performed that changes the current debug session the High-performance Embedded Workshop
application will be removed from the synchronized debug system and will no longer be synchronized with the other
High-performance Embedded Workshop applications.
REJ10J2169-0100 Rev.1.00
Jul 01, 2010
Page 479 of 523
High-performance Embedded Workshop V.4.08
18. Synchronized Debugging
The following operations will cause the session to change:
New workspace.
Open workspace.
Close workspace.
Set current project.
Change session.
18.2.3
Internal mode functionality
General operation
When using internal mode all Debuggers are opened in the one High-performance Embedded Workshop application. The
state of the GUI can be switched (by various methods) to debug the different open Debuggers. When the GUI is switched
to a Debugger the debug views will change to show data on that Debugger and any operations executed from then on will
be executed on that Debugger (referred to as the “active Debugger”). This allows you to debug several platforms, or
several cores on a multi-core platform, using one High-performance Embedded Workshop application.
High-performance Embedded Workshop window title
The High-performance Embedded Workshop window title will start with the display ID of the current Debugger. This
will change whenever the active Debugger is changed.
REJ10J2169-0100 Rev.1.00
Jul 01, 2010
Page 480 of 523
High-performance Embedded Workshop V.4.08
18. Synchronized Debugging
Switching the active Debugger
There are several methods of switching the active Debugger.
Debuggers tab:
Application toolbar:
Shortcut key combination:
Right clicking on a Debugger in the tab and selecting “Activate” will make it the
active Debugger.
When debugging in internal mode an extra drop list is added to the application
toolbar. This contains the project/session combination that describes each
synchronized Debugger. The active debugger can be changed to a specific
Debugger by selecting its session in the drop list.
Pressing the Ctrl+Shift+N Key combination will change the active Debugger to
the next one in the Debuggers tab.
The Output Window
When using Internal mode the Output Window displays a separate “Debug” tab for each synchronized Debugger. Each
tab includes the project name and session name of the Debugger it represents so that it can be identified.
Restricted operations
All Debugger operations that change the active session are not allowed when in internal mode and will be disabled. This
includes the following:
Set Current Project
Remove Project
Unload Project
Change Session
Change Configuration
The standard build operations can be used but they will only affect the active configuration in the active project, which
cannot be changed.
If you want to build projects and configurations which are not active then you can use the Build Multiple dialog.
REJ10J2169-0100 Rev.1.00
Jul 01, 2010
Page 481 of 523
High-performance Embedded Workshop V.4.08
18.3
18. Synchronized Debugging
Using the command line window when synchronized
Overview
Two new commands are provided when using synchronized debugging. These allow the Debugger that commands will
be executed on to be changed so a command file executed in one Debugger can execute commands on a different
Debugger.
SET_CORE command
Abbreviation: SMC
Description: Sets the current Debugger from the perspective of the command line ECX. All debugger commands from
now on will be sent to the requested Debugger.
Note: This does not effect operations invoked from the GUI.
Syntax: smc <Debugger ID>
Parameter
Type
Description
<Debugger ID>
String
Debugger ID. If empty the perspective will be changed back to the local Debugger.
Example: smc “SH-X (core 1)”
From now on debugger commands will be directed to the “SH-X (core 1)” Debugger.
SHOW_ALL_CORE command
Abbreviation: SAC
Description: Displays a list of available Debuggers. This command is used to get a list of valid inputs for the previous
command. The list of Debuggers displayed will be the same as is displayed on the Debuggers Tab.
Syntax: sac
Parameter
Type
None
Description
Displays a list of available Debuggers.
Exceptions
Some commands cannot be redirected to a different Debugger and will always be executed in the local Debugger no
matter how the “SET_CORE” command is used. The following commands have this limitation:
“ASSEMBLE”
“CLOSE_TEST_SUITE”
REJ10J2169-0100 Rev.1.00
Jul 01, 2010
Page 482 of 523
High-performance Embedded Workshop V.4.08
18. Synchronized Debugging
“COMPARE_TEST_DATA”
“MEMORY_EDIT”
“OPEN_TEST_SUITE”
“REFRESH_SESSION”
“RUN_TEST”
“SET_CORE”
“SHOW_ALL_CORE”
“SUBMIT”
Note:
If the parameter of a command to be executed on a Debugger specified with the SET_CORE command includes a
filename, this filename must be enclosed (e.g. by {}) as shown below.
file_load Elf/Dwarf2 {$(CONFIGDIR)\\$(PROJECTNAME).abs} 0x0 p byte
18.4
Glossary of terms
Term
Definition
Core
An individual CPU core on a multi-core platform.
Debugger
A combination of Workspace file, project name and session name that can be opened in a
High-performance Embedded Workshop application to debug a specific target. When running
in synchronized debug mode it is used as a generic term to refer to a synchronized Highperformance Embedded Workshop application (when in parallel mode) or session (when in
internal mode).
Debugger ID
The string ID that uniquely identifies a Debugger within the High-performance Embedded
Workshop GUI.
Internal Debugger ID
The string ID that uniquely identifies a Debugger internally inside High-performance
Embedded Workshop. Only needs to be understood when editing SDO files.
Internal mode
Using synchronized debugging with all Debuggers open in one High-performance Embedded
Workshop application.
Local Debugger
The Debugger that the user is currently interacting with.
Multi-core platform
A hardware or simulator device that has two or more CPU cores. The main purpose of the
synchronized debugging feature is to help the user debug multi-core platforms.
Parallel mode
Using synchronized debugging with each Debugger in a separate High-performance
Embedded Workshop application.
Platform
Hardware or simulator device that is connected to High-performance Embedded Workshop.
Could be a single core platform or an individual core on a multi-core platform.
SDO file
The synchronized debug configuration file. Contains all the information needed by Highperformance Embedded Workshop to start a synchronized debug session. Saved from the
Synchronized Debug dialog.
REJ10J2169-0100 Rev.1.00
Jul 01, 2010
Page 483 of 523
High-performance Embedded Workshop V.4.08
19. Technical Support
19. Technical Support
19.1
Viewing the version information
The version information of the High-performance Embedded Workshop can be viewed.
To view the version information
1.
Select [Help -> About High-performance Embedded Workshop]. The About High-performance
Embedded Workshop dialog box opens. Information including the copyright and version number is shown in
this dialog box.
2.
Clicking the More>> button shows Installed package information, which contains various information on the
Renesas tool packages associated with the High-performance Embedded Workshop installed on your personal
computer (e.g. version number).
3.
Click on the OK button to close the dialog box.
19.2
Check for updates
To check for High-performance Embedded Workshop product updates or service packs
1.
Select [Help -> Technical Support -> Check Website For Updates].
2.
Your default web browser is invoked and defaults to the High-performance Embedded Workshop download
page for your region.
3.
Browse this area for High-performance Embedded Workshop updates to fix bugs or add new features.
REJ10J2169-0100 Rev.1.00
Jul 01, 2010
Page 484 of 523
High-performance Embedded Workshop V.4.08
19.3
19. Technical Support
Creating a bug report
Occasionally you may experience some unforeseen problems with the High-performance Embedded Workshop
application. If a problem does occur that results in an application crash the High-performance Embedded Workshop bug
tracking program will be invoked automatically. This allows you to compile a bug report and this can then be sent to your
technical support contact in a variety of ways. It is also possible to invoke this tracker program manually. This is
described below:
To create and send a High-performance Embedded Workshop bug report
1.
Select [Help -> Technical Support -> Create Bug Report].
2.
Detailed information is generated from your High-performance Embedded Workshop system. This may take
some time. The Submit a Bug Report dialog box is then displayed.
3.
Write the description of your problem in the Please type a description of the problem you wish to report edit
box. (This item must be completed.)
4.
Type your name in the Name edit box.
5.
Type your company URL or purpose of the product being developed in the Company website/Your
application edit box. (This item must be completed.)
6.
Type your country or region in the Country/Region edit box. (This item must be completed.)
7.
Once you are happy with your report, choose the method of sending the report in the How would you like to
submit the report? drop-down list box. You can print it, e-mail it, or save it to a disk. (This selection is
required.)
8.
Then click Submit. This will send the report. When submitting a report via e-mail you will see a confirmation
message after clicking Submit.
Note:
Fields marked with an asterisk (*) are required. You can click the Submit button after these fields are completed.
REJ10J2169-0100 Rev.1.00
Jul 01, 2010
Page 485 of 523
High-performance Embedded Workshop V.4.08
Reference
Reference
REJ10J2169-0100 Rev.1.00
Jul 01, 2010
Page 486 of 523
High-performance Embedded Workshop V.4.08
1. Main Menus
1. Main Menus
1.1
File Menu Options
Menu Menu Option
Shortcut Toolbar Macro
Function
Key
Button Recording *
File
New
CTRL+N
Open
Close
-
Creates a new document.
CTRL+O
-
Opens an existing document.
CTRL+F4 -
-
Closes the active document.
New Workspace
-
-
-
Creates a new workspace.
Open Workspace
-
-
Opens an existing workspace.
Save Workspace
-
-
Saves the current workspace.
Save Workspace As
-
-
Close Workspace
-
-
Closes the current workspace.
New Session
-
-
Creates a new session.
Import Session
-
-
Imports an existing session.
Save Session
-
-
Saves the current session.
Save Session As
-
-
Refresh Session
-
-
Reloads the session file for the current session.
Download A New Module -
-
Downloads a new module.
Save
CTRL+S
Save As
-
Save All
CTRL+
SHIFT+S
Page Setup
-
Print
CTRL+P
Recent Files
-
-
Recent Workspaces
-
-
Recent Test Suites
-
-
Recent Downloaded
Modules
-
-
Exit
-
-
-
-
-
Saves this workspace with a different name, or in an
old format.
-
Saves the current session with a new session name.
-
Saves the active document.
-
Saves the active document with a new file name.
-
Saves all modified documents in the workspace.
-
Changes the printing options.
-
Prints the active document.
-
Opens this document.
-
Opens this test suite.
Opens this workspace.
Downloads this module.
-
Exits High-performance Embedded Workshop.
Note:
*. Operations with some menu options can be recorded as High-performance Embedded Workshop command-line
commands by the macro-recording support facility. A macro record icon ( ) in the "Macro Recording" column of a
menu option indicates that this function can be recorded into a macro file. For details, see section 15.5.1, Recordable
functions (common to all High-performance Embedded Workshop products).
1.2
Edit Menu Options
Menu Menu Option
Shortcut Key
Toolbar Macro
Function
Button Recording *
Edit
Undo
CTRL+Z
-
-
Reverses the last editing operation.
Redo
CTRL+Y
-
-
Repeats the last undone editing operation.
REJ10J2169-0100 Rev.1.00
Jul 01, 2010
Page 487 of 523
High-performance Embedded Workshop V.4.08
Menu Menu Option
Shortcut Key
1. Main Menus
Toolbar Macro
Function
Button Recording *
Cut
CTRL+X
-
Removes highlighted text and places it on
the Windows® clipboard.
Copy
CTRL+C
-
Places a copy of the highlighted text into the
Windows® clipboard.
Paste
CTRL+V
-
Copies the contents of the Windows®
clipboard into the active window at the
position of the insertion cursor.
Clear
Delete
-
-
Removes highlighted text (it is not copied to
the Windows® clipboard)
Select All
CTRL+A
-
-
Selects (i.e. highlights) the entire contents
of the active window.
Find
CTRL+F
-
Finds text in the current file.
Find In Files
F4
-
Finds text in multiple files.
Replace
CTRL+H
-
-
Replaces text in the current file.
Goto Line
CTRL+G
-
-
Jumps to a line in a file.
Match Braces
CTRL+SHIFT+M
-
Finds a matching brace.
Bookmarks Toggle
Bookmark
CTRL+F2
-
Sets a bookmark at the current line or clears
a bookmark at the current line.
Next Bookmark F2
-
Jumps to the next bookmark in the current
file from the current line.
Previous
Bookmark
SHIFT+F2
-
Jumps to the previous bookmark in the
current file from the current line.
Clear All
Bookmarks
-
-
Clears all bookmarks in the current file.
Define
Templates
-
-
Defines a template.
-
Inserts a template.
Templates
Insert Template CTRL+SHIFT+T
Toggle Breakpoint
F9
Sets or clears a software breakpoint at the
line showing the address.
Enable/Disable Breakpoint
CTRL+F9
Enables or disables the current software
breakpoint.
Define Column Format
-
-
-
Sets the status of editor columns.
Source Breakpoints
CTRL+B
-
-
Opens the Breakpoins dialog box.
Evaluate
-
-
-
Evaluates simple and complex expressions.
Note:
*. Operations with some menu options can be recorded as High-performance Embedded Workshop command-line
commands by the macro-recording support facility. A macro record icon ( ) in the "Macro Recording" column of a
menu option indicates that this function can be recorded into a macro file. For details, see section 15.5.1, Recordable
functions (common to all High-performance Embedded Workshop products).
REJ10J2169-0100 Rev.1.00
Jul 01, 2010
Page 488 of 523
High-performance Embedded Workshop V.4.08
1.3
1. Main Menus
View Menu Options
Menu Menu Option
Shortcut Key
Toolbar Macro
Saving into Test- Function
Button Recording *1 Image File *2
View
Differences
-
-
Map *3
-
-
Opens the Difference
window.
-
-
-
Opens the map window.
Command Line
CTRL+L
-
-
Opens the Command Line
window.
TCL Toolkit
CTRL+SHIFT+K
-
-
See the "Tcl/Tk Additional
document".
Workspace
ALT+K
-
Opens the Workspace
window.
Output
ALT+O
-
Status Bar
ALT+A
-
Disassembly
CTRL+D
CPU
Registers
CTRL+R
Opens the Registers window.
Memory
CTRL+M
Opens the Memory window.
IO
CTRL+I
Opens the IO window.
Status
CTRL+U
-
CTRL+SHIFT+G
-
-
Opens the Image window.
Waveform *3 CTRL+SHIFT+V
-
-
Opens the Waveform
window.
Stack Trace CTRL+K
-
Graphic Image *3
Code
*4
Opens the Output window.
-
Toggles the status bar on and
off.
-
Opens the Disassembly
window.
Opens the Status window.
Opens the Stack Trace
window.
Notes:
*1. Operations in some windows can be recorded as High-performance Embedded Workshop command-line commands
by the macro-recording support facility. A macro record icon ( ) in the Macro Recording column of a menu option
indicates that this function can be recorded into a macro file. For details, see section 15.5.1, Recordable functions
(common to all High-performance Embedded Workshop products).
Note that a function of another window dependent on the debugger can also be recorded as a command even though
this window is not included in the list of menus. For details, see section 15.5.2, Recordable functions (dependent on
the debugger).
*2. Data in some windows can be saved as test-image data into test-image files by the test-support facility. A save file
icon ( ) in the Saving into Test-Image File column of a menu option indicates that this data can be saved into a testimage file. For details, see section 16.6.1, Functions that can be saved into test-image files (common to all Highperformance Embedded Workshop products).
Note that some functions of other windows dependent on the debugger can also be saved into test-image files even
though these windows are not included in the list of menus. For details, see section 16.6.2, Functions that can be saved
into test-image files (dependent on the debugger).
*3. Support for this function depends on the debugger.
*4. The data of the Build tab or the Debug can be saved.
REJ10J2169-0100 Rev.1.00
Jul 01, 2010
Page 489 of 523
High-performance Embedded Workshop V.4.08
1. Main Menus
1.4
Project Menu Options
Menu
Menu Option
Shortcut Toolbar Macro
Function
Key
Button Recording *1
Project
Set Current Project
-
-
Sets this project as the current project.
Insert Project
-
-
Inserts a project to the workspace.
Dependent Projects
-
-
Edit Project Configuration *2
-
-
Create Project Type
-
Add Files
-
Shows dependent projects.
-
-
Creates a new project type.
-
-
-
Adds files to project.
Remove Files
-
-
-
Removes files from project.
File Extensions
-
-
-
Displays current project file extensions.
Components
-
-
-
Loads/unloads components.
Edits the project configuration.
Notes:
*1. Operations with some menu options can be recorded as High-performance Embedded Workshop command-line
commands by the macro-recording support facility. A macro record icon ( ) in the "Macro Recording" column of a
menu option indicates that this function can be recorded into a macro file. For details, see section 15.5.1, Recordable
functions (common to all High-performance Embedded Workshop products).
*2. Support for this function depends on the debugger.
1.5
Build Menu Options
Menu
Menu Option
Shortcut
Key
Toolbar Macro
Function
Button Recording *1
Build
*2
Toolchain
-
-
Build File
CTRL+F7
Builds the selected file.
Build
F7
Builds out of date project files.
Build All
-
Builds project files, regardless of whether the
project files are out of date.
Build Multiple
-
-
Builds multiple projects.
Clean Current Project
-
-
Cleans the current configuration in this project.
Clean All Projects
-
Update All Dependencies
-
Stop Tool Execution
CTRL+Break
Include/Exclude Build
-
Build Phase
-
Sets build options.
Cleans all configurations in all projects in this
workspace.
-
Updates a project’s dependencies.
-
Stops tool execution.
-
-
Excludes a file from build or cancels the
exclusion.
-
-
-
Adds, removes and modifies a phase.
Build Configurations
-
-
Linkage Order
-
-
-
Customizes the High-performance Embedded
Workshop linkage order.
Generate Makefile
-
-
-
Generates a makefile.
REJ10J2169-0100 Rev.1.00
Jul 01, 2010
-
Selects the current configuration.
Page 490 of 523
High-performance Embedded Workshop V.4.08
1. Main Menus
Notes:
*1. Operations with some menu options can be recorded as High-performance Embedded Workshop command-line
commands by the macro-recording support facility. A macro record icon ( ) in the "Macro Recording" column of a
menu option indicates that this function can be recorded into a macro file. For details, see section 15.5.1, Recordable
functions (common to all High-performance Embedded Workshop products).
*2. This menu is not displayed while a debug-only project "Debugger only - xxxxxx" created by High-performance
Embedded Workshop V.4.01 or later is in use.
1.6
Debug Menu Options
Menu
Menu Option
Shortcut
Key
Toolbar Macro
Function
Button Recording *1
Debug
Synchronized
Debugging *2
-
-
Debug Sessions
-
-
Debug Settings
-
-
Reset CPU
-
Resets the CPU.
Go
F5
Starts executing the user program at the current PC.
Reset Go
SHIFT+F5
Executes the user program from the reset vector
address.
Free Go *2
-
Runs program, ignoring any breakpoints.
Go to Cursor
-
Starts executing the user program at the current PC
and continues until the PC equals the address
indicated by the current text cursor position.
Set PC to Cursor
-
Changes the value of the Program Counter (PC) to
the address at the row of the text cursor.
Run
-
Display PC
CTRL+
SHIFT+Y
Step In
F11
Executes a block of user program before breaking.
Step Over
F10
Executes a block of user program before breaking. If a
subroutine call is reached, then the subroutine will not
be entered.
Step Out
SHIFT+F11
Executes sufficient user program to reach the end of
the current function.
Step
-
-
Opens the Step Program dialog box allowing the user
to modify the settings for stepping.
Step Auto
Mode
-
-
Steps only one source line when the editor window is
active. When the Disassembly window is active,
stepping is executed in a unit of assembly
instructions.
-
-
Executes stepping in a unit of assembly instructions.
Assembly
REJ10J2169-0100 Rev.1.00
Jul 01, 2010
-
Configures synchronized debugging.
Opens the Debug Sessions dialog box to list, add, or
remove the debug session.
-
-
Opens the Debug Settings dialog box to set the
debugging conditions or download modules.
Opens the Run Program dialog box allowing the user
to enter temporary breakpoints before executing the
user program.
-
Opens the editor or Disassembly window at the
address of the PC.
Page 491 of 523
High-performance Embedded Workshop V.4.08
Menu
Menu Option
Source
1. Main Menus
Shortcut
Key
Toolbar Macro
Function
Button Recording *1
-
-
Steps only one source line.
Halt Program
-
Stops the execution of the user program.
Initialize
-
Connect *2
-
Connects the debugger.
Disconnect *2
-
Disconnects the debugger.
Save Memory
-
-
Saves the specified memory area data to a file.
Verify Memory *2
-
Disconnects the debugger and connects it again.
-
-
Verifies file contents against memory contents.
Download Modules -
-
Downloads the object program.
Unload Modules
-
Unloads the object program.
-
Notes:
*1. Operations with some menu options can be recorded as High-performance Embedded Workshop command-line
commands by the macro-recording support facility. A macro record icon ( ) in the "Macro Recording" column of a
menu option indicates that this function can be recorded into a macro file. For details, see section 15.5.1, Recordable
functions (common to all High-performance Embedded Workshop products).
*2. Support for this function depends on the debugger.
1.7
Setup Menu Options
Menu Menu Option
Shortcut Key Toolbar Button Macro Recording * Function
Setup Customize
-
-
-
Customizes the High-performance
Embedded Workshop application.
Options
-
-
-
Sets option of the High-performance
Embedded Workshop application.
Format Views
-
-
-
Configures fonts, colors, keywords and
so on, for the window.
Radix Hex
-
Sets radix to hexadecimal.
Decimal
-
Sets radix to decimal.
Oct
-
Sets radix to octal.
Bin
-
Sets radix to binary.
Note:
*. Operations with some menu options can be recorded as High-performance Embedded Workshop command-line
commands by the macro-recording support facility. A macro record icon ( ) in the "Macro Recording" column of a
menu option indicates that this function can be recorded into a High-performance Embedded Workshop macro file.
For details, see section 15.5.1, Recordable functions (common to all High-performance Embedded Workshop
products).
REJ10J2169-0100 Rev.1.00
Jul 01, 2010
Page 492 of 523
High-performance Embedded Workshop V.4.08
1.8
1. Main Menus
Tools Menu Options
Menu
Menu Option
Shortcut Toolbar Function
Key
Button
Tools
Administration
-
-
Controls the components.
Change Toolchain Version
-
-
Changes a toolchain version.
Version Select
Control Configure
-
-
Selects a version control system.
-
-
Setups the version control system.
Add to VCS
-
Adds files to Visual SourceSafe.
Remove from VCS
-
Gets a read-only copy of a file from Visual SourceSafe.
Get from VCS
-
Gets a read-only copy of a file from Visual SourceSafe.
Check out from VCS
-
Checks out a writable copy of a file from Visual SourceSafe.
Check in VCS
-
Checks in your edits to a file into Visual SourceSafe.
Get VCS status
-
Views the status of a file in Visual SourceSafe.
Launch External Debugger
-
Launches an external debugger tool.
Macros
-
Record Macro
-
Starts recording of a macro.
Play Macro
-
Plays a macro.
Stop Macro
-
Stops a macro.
System tools
-
Invokes system tools (e.g. Renesas Call Walker).
-
Opens the Macro dialog box.
Notes:
*1. Custom menu options to which recorded macros have been assigned are shown between Stop Macro and system
tools.
*2. Further menu options for external tools added by customizing the Tools menu are shown under the menu options for
system tools.
1.9
Test Menu Options
Menu Menu Option
Shortcut Toolbar Function
Key
Button
Test
Create New Test
Suite
-
-
Creates a new blank test suite so you can begin adding and running tests.
Open Test Suite
-
-
Opens an existing test suite.
Edit Test Suite
-
-
Edits the current test suite. Allows you to add and remove tests to the test
suite.
Close Test Suite
-
-
Closes the current test suite.
Create New Test
Image File
-
-
Setups and customizes the test image data saved to the test image file
(*.HIF).
Compare Test
Image File
-
-
Compares test image file allows you to compare a test image file with the
current High-performance Embedded Workshop system or with another
test image file already on your disk. The results are then displayed in the
test browser.
REJ10J2169-0100 Rev.1.00
Jul 01, 2010
Page 493 of 523
High-performance Embedded Workshop V.4.08
Menu Menu Option
1.10
Menu
Shortcut Toolbar Function
Key
Button
Run Tests
-
-
Runs tests allows you to run multiple tests that you have defined in the
test suite and see the results of the comparisons in the test browser.
There are various options to configure the test run execution.
Test Result
Browser
-
-
Displays the test results for one or more test executions. It shows the
pass and fails results and the detailed reason why the test failed.
Window Menu Options
Menu Option
Window Cascade
Shortcut Key Toolbar Button Function
-
-
Arranges all open windows so that they overlap.
Tile Horizontally
-
-
Arranges all open windows horizontally.
Tile Vertically
-
-
Arranges all open windows vertically.
Arrange Icons
-
-
Lines up all minimized windows.
Close All
-
-
Closes all open windows.
Virtual Desktop
desktop Manager
-
-
Renames your configuration to a more meaningful name.
-
-
Switches desktop configurations.
Default 1-4
1.11
Help Menu Options
Menu Menu Option
Help
1. Main Menus
Help Topic
Shortcut Toolbar Function
Key
Button
-
-
Shows the main High-performance Embedded Workshop help
window.
Technical Create Bug Report Support Check Website For Updates
-
Creates a High-performance Embedded Workshop bug report.
-
Checks for High-performance Embedded Workshop product
updates or service packs.
License
Management
-
Opens the License Management dialog box.
To view the License Management help, double-click
\Tools\Renesas\DebugComp\Ecx\EcxLicMgr\EcxLicMgr.chm
under the High-performance Embedded Workshop installation
directory.
About
High-performance Embedded
Workshop
-
-
Opens the About High-performance Embedded Workshop
dialog box allowing the user to view the version of Highperformance Embedded Workshop.
Debugger Help
-
-
Shows the help window of the emulator or simulator when the
debugger is connected.
REJ10J2169-0100 Rev.1.00
Jul 01, 2010
Page 494 of 523
High-performance Embedded Workshop V.4.08
2. Windows
2. Windows
Window Name
Opened by
Differences
[View -> Difference]
Map Section Information *1
[View -> Map]
Map Symbol Information *1
[View -> Map]
Command Line
[View -> Command Line]
Console *2
[View -> TCL Toolkit]
Workspace
[View -> Workspace]
Output
[View -> Output]
Disassembly
[View -> Disassembly]
Registers
[View -> Registers]
Memory
[View -> Memory]
IO
[View -> CPU -> IO]
Status
[View -> CPU -> Status]
Image *1
[View -> Graphic -> Image]
Waveform *1
[View -> Graphic -> Waveform]
Stack Trace
[View -> Code -> Stack Trace]
Test Browser
[Test -> Test Results Browser]
Notes:
*1. Support for this function depends on the debugger.
*2. See the "Tcl/Tk Additional document".
REJ10J2169-0100 Rev.1.00
Jul 01, 2010
Page 495 of 523
High-performance Embedded Workshop V.4.08
3. Commands
3. Commands
3.1
Command List (Alphabetic Order)
Command Name
Abbreviation Description
!
-
Comment.
ADD_FILE
AF
Adds a file to the current project.
ASSERT
-
Checks if an expression is true or false.
AUTO_COMPLETE
AC
Switches the auto-completion.
BUILD *1
BU
Performs a build on the current project.
BUILD_ALL *1
BL
Performs a build all on the current project.
BUILD_FILE *1
BF
Performs a build on the file.
BUILD_MULTIPLE *1
BM
Performs a build on the multiple projects and configurations.
CACHE *2
-
Sets caching on or off.
CHANGE_CONFIGURATION
CC
Sets the configuration to the specified configuration name.
CHANGE_PROJECT
CP
Sets the specified project file as the current project.
CHANGE_SESSION
CS
Sets the specified session as the current session.
CLEAN
CL
Deletes intermediate and output files produced in building.
CLEAR_OUTPUT_WINDOW
COW
Clears the contents of the specified tab in the output window.
CLOSE_TEST_SUITE
CTS
Closes the current test suite.
CLOSE_WORKSPACE
CW
Closes a workspace.
COMPARE_TEST_DATA
CTD
Compares test data and create results.
CONNECT *2
CN
Connects the debugger.
DEFAULT_OBJECT_FORMAT
DO
Sets the object format to be used by default.
DISCONNECT *2
DN
Disconnects the debugger.
ERASE
ER
Clears the Command Line window.
EVALUATE
EV
Evaluates an expression.
FILE_LOAD
FL
Loads an object (program) file.
FILE_LOAD_ALL
LA
Loads all object (program) files.
FILE_SAVE
FS
Saves memory to a file.
FILE_UNLOAD
FU
Unloads an object (program) file from memory.
FILE_UNLOAD_ALL
UA
Unloads all object (program) files from memory.
FILE_VERIFY *2
FV
Verifies file contents against memory.
FREE_GO *2
FG
Runs program, ignoring any breakpoints.
GENERATE_MAKE_FILE *1
GM
Generates a build makefile for the current workspace.
GO
GO
Runs program.
GO_RESET
GR
Runs program from reset.
GO_TILL
GT
Runs program until specified addresses.
HALT
HA
Halts program.
HELP
HE
Displays help for Command Line or help on a command.
INITIALIZE
IN
Initializes the debugger.
LOG
LO
Controls command output logging.
MEMORY_COMPARE *2
MC
Compares memory contents.
MEMORY_DISPLAY
MD
Displays memory contents.
MEMORY_EDIT
ME
Modifies memory contents.
REJ10J2169-0100 Rev.1.00
Jul 01, 2010
Page 496 of 523
High-performance Embedded Workshop V.4.08
3. Commands
Command Name
Abbreviation Description
MEMORY_FILL
MF
Fills a block of memory.
MEMORY_FIND *2
MI
Finds a string in an area of memory.
MEMORY_MOVE
MV
Moves a block of memory.
MEMORY_TEST *2
MT
Tests a block of memory.
OPEN_TEST_SUITE
OTS
Opens a test suite.
OPEN_WORKSPACE
OW
Opens the specified workspace file.
QUIT
QU
Exits High-performance Embedded Workshop.
RADIX
RA
Sets the radix for the value.
REFRESH_SESSION
RSE
Reloads the session file.
REMOVE_FILE
REM
Removes a file from the current project.
RESET
RE
Resets the microprocessor.
RUN_TEST
RT
Runs a test.
SAVE_SESSION
SE
Saves the current session.
SAVE_WORKSPACE
SW
Saves the current workspace.
SET_DISASSEMBLY_SOFT_BREAK
SDB
Sets or deletes a software breakpoint at the disassembly level.
SET_SOURCE_SOFT_BREAK
SSB
Sets or deletes a software breakpoint at the source level.
SLEEP
-
Delays command execution.
STATE_DISASSEMBLY_SOFT_BREAK TDB
Enables or disables a software breakpoint at the disassembly
level.
STATE_SOURCE_SOFT_BREAK
TSB
Enables or disables a software breakpoint at the source level.
STEP
ST
Steps through program (by instructions or source lines).
STEP_MODE
SM
Sets the step mode.
STEP_OUT
SP
Steps out of the current function.
STEP_OVER
SO
Steps through program without stepping into functions.
STEP_RATE
SR
Sets rate of stepping.
SUBMIT
SU
Executes a file of commands.
TCL
-
Turns TCL commands on or off.
TOOL_INFROMATION
TO
Outputs the tool information.
UPDATE_ALL_DEPENDENCIES *1
UD
Updates the current projects build dependencies.
Notes:
*1. Available only when there is a toolchain installed.
*2. Support for this command depends on the debugger.
For the syntax of each command, refer to the online help.
REJ10J2169-0100 Rev.1.00
Jul 01, 2010
Page 497 of 523
High-performance Embedded Workshop V.4.08
3.2
3. Commands
Command List (Listed by Function)
High-performance Embedded Workshop Application Control Commands
Command Name
Abbreviation Description
ADD_FILE
AF
Adds a file to the current project.
CHANGE_CONFIGURATION
CC
Sets the configuration to the specified configuration name.
CHANGE_PROJECT
CP
Sets the specified project file as the current project.
CHANGE_SESSION
CS
Sets the specified session as the current session.
CLEAR_OUTPUT_WINDOW
COW
Clears the contents of the specified tab in the output window.
CLOSE_WORKSPACE
CW
Closes the specified workspace file.
EVALUATE
EV
Evaluates an expression.
OPEN_WORKSPACE
OW
Opens the specified workspace file.
QUIT
QU
Exits High-performance Embedded Workshop.
RADIX
RA
Sets the radix for the value.
REFRESH_SESSION
RSE
Reloads the session file.
REMOVE_FILE
REM
Removes a file from the current project.
SAVE_SESSION
SE
Saves the current session.
SAVE_WORKSPACE
SW
Saves the current workspace.
TOOL_INFORMATION
TO
Outputs the tool information.
Build Commands (Available only when there is a toolchain installed)
Command Name
Abbreviation Description
BUILD
BU
Performs a build on the current project.
BUILD_ALL
BL
Performs a build all on the current project.
BUILD_FILE
BF
Performs a build on the file.
BUILD_MULTIPLE
BM
Performs a build on the multiple projects and configurations.
CLEAN
CL
Deletes intermediate and output files produced in building.
GENERATE_MAKE_FILE
GM
Generates a build makefile for the current workspace.
UPDATE_ALL_DEPENDENCIES
UD
Updates the current projects build dependencies.
Command Line Operating Commands
Command Name
Abbreviation Description
!
-
Comment.
ASSERT
-
Checks if an expression is true or false.
AUTO_COMPLETE
AC
Switches the auto-completion.
ERASE
ER
Clears the Command Line window.
HELP
HE
Displays help for Command Line or help on a command.
LOG
LO
Controls command output logging.
SLEEP
-
Delays command execution.
SUBMIT
SU
Executes a file of commands.
TCL
-
Turns TCL commands on or off.
REJ10J2169-0100 Rev.1.00
Jul 01, 2010
Page 498 of 523
High-performance Embedded Workshop V.4.08
3. Commands
Test Supporting Facilities Commands
Command Name
Abbreviation Description
CLOSE_TEST_SUITE
CTS
Closes the current test suite.
COMPARE_TEST_DATA
CTD
Compares test data and create results.
OPEN_TEST_SUITE
OTS
Opens a test suite.
RUN_TEST
RT
Runs a test.
Execution Commands (Available when the debugger is connected)
Command Name
Abbreviation Description
FREE_GO *
FG
Runs program, ignoring any breakpoints.
GO
GO
Runs program.
GO_RESET
GR
Runs program from reset.
GO_TILL
GT
Runs program until specified addresses.
HALT
HA
Halts program.
RESET
RE
Resets the microprocessor.
STEP
ST
Steps through program (by instructions or source lines).
STEP_MODE
SM
Sets the step mode
STEP_OUT
SP
Steps out of the current function.
STEP_OVER
SO
Steps through program without stepping into functions.
STEP_RATE
SR
Sets rate of stepping.
Note:
*. Support for this command depends on the debugger.
Memory Operation Commands (Available when the debugger is connected)
Command Name
Abbreviation Description
CACHE *
-
Sets caching on or off.
FILE_LOAD
FL
Loads an object (program) file.
FILE_LOAD_ALL
LA
Loads all object (program) files.
FILE_SAVE
FS
Saves memory to a file.
FILE_UNLOAD
FU
Unloads an object file from memory.
FILE_UNLOAD_ALL
UA
Unloads all object (program) files from memory.
FILE_VERIFY *
FV
Verifies file contents against memory.
MEMORY_COMPARE *
MC
Compares memory contents.
MEMORY_DISPLAY
MD
Displays memory contents.
MEMORY_EDIT
ME
Modifies memory contents.
MEMORY_FILL
MF
Fills a block of memory.
MEMORY_FIND *
MI
Finds a string in an area of memory.
MEMORY_MOVE
MV
Moves a block of memory.
MEMORY_TEST *
MT
Tests a block of memory.
Note:
*. Support for this command depends on the debugger.
REJ10J2169-0100 Rev.1.00
Jul 01, 2010
Page 499 of 523
High-performance Embedded Workshop V.4.08
3. Commands
Software Break Setting Commands (Available when the debugger is connected)
Command Name
Abbreviation Description
SET_DISASSEMBLY_SOFT_BREAK
SDB
Sets or deletes a software breakpoint at the disassembly level.
SET_SOURCE_SOFT_BREAK
SSB
Sets or deletes a software breakpoint at the source level.
STATE_DISASSEMBLY_SOFT_BREAK TDB
Enables or disables a software breakpoint at the disassembly
level.
STATE_SOURCE_SOFT_BREAK
Enables or disables a software breakpoint at the source level.
TSB
Other Debugging Commands (Available when the debugger is connected)
Command Name
Abbreviation Description
CONNECT *
CN
Connects the debugger.
DISCONNECT *
DN
Disconnects the debugger.
INITIALIZE
IN
Initializes the debugger.
Note:
*. Support for this command depends on the debugger.
For the syntax of each command, refer to the online help.
REJ10J2169-0100 Rev.1.00
Jul 01, 2010
Page 500 of 523
High-performance Embedded Workshop V.4.08
4. Regular Expressions
4. Regular Expressions
The High-performance Embedded Workshop editor allows you to include special characters in search strings when
performing a find, replace or find in files operation.
These characters are listed in the table below and explained underneath.
Character Function
?
This character matches any single character, except the newline character.
For example, t?p matches “top”, “tip” but not “trap”.
*
This character matches any number of occurrences (0 or more) of any character except a newline. Thus,
this character will not match across new lines. The * character will match as few occurrences as are
necessary to make the rest of the pattern match.
For example, t*o matches the “to” of “too”, the “tro” of “trowel” and the “ty o” of “sporty orange” but not “smart
orange” because the * character does not match across a new line.
\t
This character matches the tab character.
Example 1: \t8
Finds every occurrence of a tab character followed by an 8.
Example 2: init\t
Finds every occurrence of a tab character following “init”.
[]
This matches any one character or a range of single characters listed within the brackets. Brackets cannot
be nested.
[-] specifies a range of characters e.g. [a-z] or [0-9]. The beginning character in the range must have a lower
ASCII value than the ending character of the range.
[~] matches a single character if it is not any one of the characters between [~ and ]. This pattern also
matches newline characters, unless the newline character is included within the brackets.
Example 1: [AEIOU]
Finds every uppercase vowel.
Example 2: [<>?]
Finds a literal <, > or ?.
Example 3: [A-Za-z0-9_]
Matches an upper or lowercase letter, a digit or an underscore.
Example 4: [~0-9]
Matches any character except a digit.
Example 5: [ \t\n]
Matches a space, a tab or newline.
Example 6: [\]]
Matches a literal ] if ] is placed after \.
\
This is the regular expression override character. If the character following the backslash is a regular
expression character, it is treated as a normal character. The backslash is ignored if it is followed by a
normal (non-regular expression) character.
Example 1: \*
Searches for every occurrence of an asterisk.
Example 2: \\
Searches for every occurrence of a backslash.
REJ10J2169-0100 Rev.1.00
Jul 01, 2010
Page 501 of 523
High-performance Embedded Workshop V.4.08
5. Placeholders
5. Placeholders
This section describes how to use the placeholders, a feature provided by several of the High-performance Embedded
Workshop components.
5.1
What is a placeholder?
A placeholder is a special string, inserted into text, which is replaced at some subsequent time for the actual value. For
example, one of the High-performance Embedded Workshop placeholders is $(FULLFILE) which represents a file with a
full path.
Suppose that you have an editor in c:\myedit\myeditor.exe, which can accept the file to be edited as a parameter. When
invoking the editor (for example, you may want to open the file ‘FILE1.C’ from the directory ‘c:\files’), the following
shortcut could be made:
c:\myedit\myeditor.exe c:\files\FILE1.C
However, what happens if you want to open any file through this editor? The problem is that the command above is
specific to ‘c:\files\file1.c’. What we want to be able to do is to tell the High-performance Embedded Workshop to use the
editor specified but to open the file that we have chosen at that time. To do this, you can substitute the specific name of
the file for a general Placeholder:
c:\myedit\myeditor.exe $(FULLFILE)
Now whenever the High-performance Embedded Workshop launches the editor with a file, it knows that it has to replace
the $(FULLFILE) placeholder with the file you have selected.
5.2
Inserting a placeholder
To insert a placeholder, select in any of the following operations.
Example 1
1.
Place the insertion cursor at the point you would like to insert the placeholder.
2.
Click the placeholder button. A pop-up menu will be displayed which lists all of the placeholders that are valid
for the associated edit box.
3.
Select the desired placeholder from the pop-up menu. The equivalent placeholder will be inserted into the edit
box.
REJ10J2169-0100 Rev.1.00
Jul 01, 2010
Page 502 of 523
High-performance Embedded Workshop V.4.08
5. Placeholders
Example 2
1.
Select the required placeholder other than "Custom directory" from the drop-down list box and specify a subdirectory relative to the directory shown by the placeholder.
2.
If you select "Custom directory", specify an absolute directory path in the Sub-Directory field.
Example 3
1.
Place the insertion cursor at the point you would like to insert the placeholder.
2.
Select the required placeholder from the drop-down list box.
3.
Click Insert.
Example 4
1.
Alternatively, if you know the placeholder already, type it into the field directly. Ensure that you type the
placeholder name in uppercase and that it is preceded by ‘$(’ and followed by ‘)’.
This is correct:
$(FILEDIR)
These are incorrect:
$(Filedir)
$( FILEDIR )
$FILEDIR
REJ10J2169-0100 Rev.1.00
Jul 01, 2010
Page 503 of 523
High-performance Embedded Workshop V.4.08
5.3
5. Placeholders
Available placeholders
The table below lists the available placeholders and their meanings, along with an example of their use.
Placeholder
Meaning
Expanded placeholder (example)
$(FULLFILE)
Filename (including full path)
c:\workspace\project\file.src
$(FILEDIR)
File directory
c:\workspace\project
$(FILENAME)
Filename (excluding path, including extension) file.src
$(FILELEAF)
Filename (excluding path and extension)
file
$(EXTENSION)
File extension
src
$(WORKSPDIR)
Workspace directory
c:\workspace
$(WORKSPNAME)
Workspace name
workspace
$(PROJDIR)
Project directory
c:\workspace\project
$(PROJECTNAME)
Project name
project
$(CONFIGDIR)
Configuration directory
c:\workspace\project\debug
$(CONFIGNAME)
Configuration name
debug
$(HEWDIR)
High-performance Embedded Workshop
installation directory
c:\Program Files\Renesas\Hew
$(TCINSTALL)
Toolchain install directory (on the options
c:\Program
setting dialogs and the New Build Phase dialog Files\Renesas\Hew\Tools\Renesas\Sh\9_0_1_1
(step 3))
$(TOOLDIR)
Tool installation directory (Tools Administration) c:\Program
Files\Renesas\Hew\Tools\Renesas\Sh\9_0_1_1
$(TEMPDIR)
Temp directory
c:\temp
$(WINDIR)
Windows® directory
c:\windows
$(WINSYSDIR)
Windows® system directory
c:\windows\system
$(EXEDIR)
Command directory
v:\vc\win32
$(USERNAME)
User login (Version control)
JHARK
$(PASSWORD)
User password (Version control)
214436
$(VCDIR)
“Virtual” version control directory
“c:\project” is mapped to “x:\vc\project”.
$(COMMENT)
Comment (Version control)
“Please Enter Comment” dialog box opens.
$(LINE)
Line number of an error/warning
12
In the table above, we are assuming that:
•
a file path is “c:\workspace\project\file.src”.
•
a workspace named “workspace” is located at “c:\workspace”.
•
a project named “project” is located at “c:\workspace\project”.
•
a configuration named “debug” has a configuration directory located at “c:\workspace\project\debug”.
•
HEW2.EXE is installed in “c:\Program Files\Renesas\Hew”.
•
a *.HRF file of a toolchain (i.e. compiler, assembler, linker) is located in “c:\Program
Files\Renesas\Hew\Tools\Renesas\Sh\9_0_1_1”. This is referred to as $(TCINSTALL) on the options setting
dialogs and the New Build Phase dialog (step 3) of the Build menu and as $(TOOLDIR) on the Tools
Administration dialog box.
REJ10J2169-0100 Rev.1.00
Jul 01, 2010
Page 504 of 523
High-performance Embedded Workshop V.4.08
5. Placeholders
•
the Windows® operating system is installed in “c:\windows” and the Windows® system directory is located
at “c:\windows\system”.
•
a version control executable path is “v:\vc\win32\ss.exe”; a user name and its password to login to the
version control system are “JHARK” and “214436” respectively; $(COMMENT) is specified in a command
line to the version control executable; “c:\project” is mapped to “x:\vc\project” on the Projects tab of the
Version Control Setup dialog box, which is invoked via [Tools -> Version Control -> Configure].
•
an error of compiler or assembler occurred at line 12.
Note:
Not all of the placeholders are relevant in every field. For example, the $(LINE) placeholder has no meaning when
specifying a dependent file’s location. $(USERNAME), $(PASSWORD), $(VCDIR), and $(COMMENT) placeholders
are acceptable only in version control. If you enter a placeholder into an edit field where it is not acceptable you will be
informed.
5.4
Placeholder tips
Placeholders are there to allow you to create flexible paths to the various files used by the system.
•
If there is a placeholder pop-up menu ( ) next to an edit field into which you are about to enter a path or
file, you should consider how you can use a placeholder to make that path or file definition flexible.
•
If you use several configurations, then the $(CONFIGDIR) placeholder is very useful to ensure that files can
be written to and from the current configuration’s directory.
•
Wherever possible, use a placeholder. They can always be removed or added later so don’t be afraid to
experiment.
REJ10J2169-0100 Rev.1.00
Jul 01, 2010
Page 505 of 523
High-performance Embedded Workshop V.4.08
6. I/O File Format
6. I/O File Format
High-performance Embedded Workshop formats the IO window based on information it finds in an I/O Register
definition file. When you select a debugger, High-performance Embedded Workshop will look for a “<device>.IO” file
corresponding to the selected device and load it if it exists. This file is a formatted text file that describes the I/O modules
and the address and size of their registers. You can edit this file, with a text editor, to add support for memory mapped
registers or peripherals you may have specific to your application e.g. registers in an ASIC device mapped into the
microcomputer's address space.
File format
Each module name must be defined in the Modules definition section and the numbering of each module must be
sequential. Each module corresponds to a register definition section and within the section each entry defines an I/O
register.
The BaseAddress definition is for devices where the location of I/O registers moves in the address space depending on
the CPU mode. In this case, the BaseAddress value is the base address of the I/O registers in one specific mode and the
addresses used in the register definitions are the address locations of the registers in the same mode. When the I/O
register file is actually used, the BaseAddress value is subtracted from the defined register address and the resultant
offset added to the relevant base address for the selected mode.
Each module has a section that defines the registers forming it along with an optional dependency, the dependency is
checked to see if the module is enabled or not. Each register name must be defined in the section and the numbering of
each register must be sequential. The dependency is entered in the section as dep=<reg> <bit> <value>.
1.
<reg> is the register id of the dependency.
2.
<bit> is the bit position within the register.
3.
<value> is the value that the bit must be for the module to be enabled.
The [Register] definition entry is entered in the format id=<name> <address> [<size>
[<absolute>[<format>[<bitfields>]]]].
1.
<name> register name to be displayed.
2.
<address> address of the register.
3.
<size> which may be B, W or L for byte, word, or long word (default is byte).
4.
<absolute> which can be set to A if the register is at an absolute address. This is only relevant if the I/O area
address range moves about on the CPU in different modes. In this case, if a register is defined as absolute the
base address offset calculation is not performed and the specified address is used directly.
5.
<format> Format for register output. Valid values are H for Hexadecimal, D for decimal, and B for binary.
6.
<bitfields> section defining the bits within the register.
Bitfield sections define the bits within a register each entry is of the type bit<no>=<name>.
REJ10J2169-0100 Rev.1.00
Jul 01, 2010
Page 506 of 523
High-performance Embedded Workshop V.4.08
1.
<no> is the bit number.
2.
<name> is a symbolic name of the bit.
6. I/O File Format
Comment lines are allowed and must start with a “;” character.
REJ10J2169-0100 Rev.1.00
Jul 01, 2010
Page 507 of 523
High-performance Embedded Workshop V.4.08
7. Symbol File Format
7. Symbol File Format
In order for High-performance Embedded Workshop to be able to understand and decode the symbol file correctly, the
file must be formatted as a Pentica-B file:
1.
The file must be a plain ASCII text file.
2.
The file must start with the word “BEGIN”.
3.
Each symbol must be on a separate line with the value first, in hexadecimal terminated by an “H”, followed by a
space then the symbol text.
4.
The file must end with the word “END”.
Example:
BEGIN
11FAH Symbol_name_1
11FCH Symbol_name_2
11FEH Symbol_name_3
1200H Symbol_name_4
END
Note:
Support for this function depends on the debugger.
REJ10J2169-0100 Rev.1.00
Jul 01, 2010
Page 508 of 523
High-performance Embedded Workshop V.4.08
8. Keyboard Shortcuts
8. Keyboard Shortcuts
All major commands in the High-performance Embedded Workshop application can be driven by the keyboard. Below
is a list of all keyboard commands in the application.
Function key
Key
Function
ALT
0-9
Play a macro assigned to keyboard shortcut.
ALT
A
Toggle status bar.
ALT
K
Open the workspace window.
ALT
O
Open the output window.
ALT
F4
Exit the application.
ALT
BACKSPACE
Undo (alternative in the editor to CTRL+Z)
CTRL
0-9
Reserved for use for template insertion.
CTRL
A
Select all in the editor. May also work in other windows.
CTRL
B
Open the Breakpoints dialog box.
CTRL
C
Copy the .selected items to the clipboard.
CTRL
D
Open the disassembly window.
CTRL
F
Open the Find dialog box.
CTRL
G
Go to source line.
CTRL
H
Open the Replace dialog box.
CTRL
I
Open the IO window.
CTRL
K
Open the stack trace window.
CTRL
L
Open the command line window.
CTRL
M
Open the memory window.
CTRL
N
Create a new source file in the editor.
CTRL
O
Open the open file dialog box.
CTRL
P
Print the document.
CTRL
R
Open the registers window.
CTRL
S
Save the current file.
CTRL
U
Open the status window.
CTRL
V
Paste the clipboard contents.
CTRL
X
Cut the selection.
CTRL
Y
Redo the action.
CTRL
Z
Undo the last action.
CTRL
F2
Toggle bookmark.
CTRL
F3
Search for the next occurrence of the text chosen in the editor or open the
Find dialog box.
CTRL
F4
Close the editor window.
CTRL
F6
Switch windows in the editor.
CTRL
F7
Build an individual file.
CTRL
F9
Enable or disable a breakpoint on the current line.
CTRL
SPACEBAR
Re-shown list members as a pop-up window in the editor.
CTRL
BACKSPACE
Delete current word.
CTRL
BREAK
Stop tool execution.
CTRL
INSERT
Copy the selection to the clipboard.
CTRL
TAB
Switch windows in the editor.
REJ10J2169-0100 Rev.1.00
Jul 01, 2010
Page 509 of 523
High-performance Embedded Workshop V.4.08
8. Keyboard Shortcuts
Function key
Key
Function
CTRL
HOME
Return the cursor in the editor to the beginning of the current file.
CTRL
END
Send the cursor in the editor to the end of the current file.
CTRL
UP ARROW
Scroll window up and leave the cursor in the same place in the editor.
CTRL
DOWN ARROW
Scroll window down and leave the cursor in the same place in the editor.
CTRL
LEFT ARROW
Move the cursor to the previous word in the editor.
CTRL
RIGHT ARROW
Move the cursor to the next word in the editor.
CTRL+ALT
1-4
Switch virtual desktop.
CTRL+ALT
PAGE UP
Move to next tab. For example, the output or workspace window.
CTRL+ALT
PAGE DOWN
Move to previous tab. For example, the output or workspace window.
CTRL+SHIFT
8
Show white space and tab characters in the editor.
CTRL+SHIFT
G
Open the Image window.
CTRL+SHIFT
K
Open TCL toolkit.
CTRL+SHIFT
L
Line deletion in editor.
CTRL+SHIFT
M
Find a matching brace.
CTRL+SHIFT
N
Change the active Debugger to the next one in the Debuggers tab of the
Workspace window. (Synchronized Debugging Facility)
CTRL+SHIFT
S
Save all modified documents in the workspace.
CTRL+SHIFT
T
Insert a template.
CTRL+SHIFT
U
Change into a uppercase letter all the texts chosen in the editor.
CTRL+SHIFT
V
Open the Waveform window.
CTRL+SHIFT
Y
Display PC position.
CTRL+SHIFT
F3
Search for the previous occurrence of the text chosen in the editor or open the
Find dialog box.
CTRL+SHIFT
SPACEBAR
Re-shown the function name and parameter as a pop-up window when the
first open bracket is entered in the editor.
CTRL+SHIFT
TAB
Switch windows in the editor.
CTRL+SHIFT
HOME
Select from the cursor to the beginning of the file.
CTRL+SHIFT
END
Select from the cursor to the end of the file.
CTRL+SHIFT
LEFT ARROW
Select the previous word in the editor.
CTRL+SHIFT
RIGHT ARROW
Select the next word in the editor.
SHIFT
F1
Display context-sensitive help.
SHIFT
F2
Previous bookmark.
SHIFT
F3
Search for the previous occurrence of the specified text.
SHIFT
F5
Run from reset.
SHIFT
F8
Displays the editor that generated the previous build error or warning.
SHIFT
F10
Show context menu. Same as right-click pop-up menu.
SHIFT
F11
Step out of the current function.
SHIFT
F12
Refresh all windows.
SHIFT
DELETE
Cut the selection in the editor. (alternative in the editor to CTRL+X)
SHIFT
ESC
Hide the output window.
SHIFT
TAB
Move the tab back in the editor.
SHIFT
HOME
Selects from the cursor to the beginning of the current line in the editor.
SHIFT
END
Selects from the cursor to the end of the current line in the editor.
SHIFT
UP ARROW
Select the next line up.
SHIFT
DOWN ARROW
Select the next line down.
REJ10J2169-0100 Rev.1.00
Jul 01, 2010
Page 510 of 523
High-performance Embedded Workshop V.4.08
8. Keyboard Shortcuts
Function key
Key
Function
SHIFT+ALT
BACKSPACE
Redo the action (alternative in the editor to CTRL+Y)
None
F1
Display context sensitive help.
None
F2
Jump to the next bookmark.
None
F3
Search for the next of the specified text.
None
F4
Find text in multiple files.
None
F5
Start or continue the program.
None
F7
Build the project.
None
F8
Display the editor that generated the next build error or warning.
None
F9
Set or remove a breakpoint on the current line.
None
F10
Step over the next statement..
None
F11
Step into the next statement.
None
F12
Refresh the contents of the window.
None
DELETE
Clear.
None
INSERT
Toggle insert and overwrite mode.
None
ENTER
Carriage return in the editor.
None
TAB
Insert a tab in the editor.
None
ESC
Stop running the program.
None
HOME
Move the cursor to the beginning of the current line in the editor.
None
END
Move cursor to the end of the current line in the editor.
None
PAGE UP
Move the page in the editor up.
None
PAGE DOWN
Move the page in the editor down.
None
UP ARROW
Move cursor up in the editor.
None
DOWN ARROW
Move cursor down in the editor.
None
LEFT ARROW
Move cursor left in the editor.
None
RIGHT ARROW
Move cursor right in the editor.
None
ALT + Mouse select
Select column in the editor.
Note:
Support for this function depends on the debugger.
REJ10J2169-0100 Rev.1.00
Jul 01, 2010
Page 511 of 523
High-performance Embedded Workshop V.4.08
9. Drag and Drop in the Debugger
9. Drag and Drop in the Debugger
When using the High-performance Embedded Workshop debugger it is possible for each debug component to interact
with the others. This can be achieved simply by dragging objects from one view to another.
Some examples are listed below
1.
It is possible to drag a label from the labels view onto other debug views. So for example if you drag a label
onto the disassembly window it will scroll to the address that the label is located at.
2.
It is possible to drag a watch variable from the editor into the watch window. This adds the watch variable to
the window.
3.
Dragging a function name from the editor into the disassembly should jump the disassembly view to the label
location.
REJ10J2169-0100 Rev.1.00
Jul 01, 2010
Page 512 of 523
High-performance Embedded Workshop V.4.08
10. Using Labels to View Your Code
10. Using Labels to View Your Code
Labels are a useful way of navigating through your debug module. It is possible to use labels in any edit field that allows
addresses. If you enter a label in such a field then the built in evaluator will check the label and then convert it to an
address. This allows you to enter evaluations such as "_main+100" or "_MyFunction+100".
This means that any times that labels are used the addresses which will be evaluated are not fixed. This is especially
useful if you are using a command line batch file to set a number of breakpoints. The command line batch file might
always need to set a breakpoint on a certain function and this can be achieved by using a label.
Using the label allows the code to change without affecting the batch file contents.
High-performance Embedded Workshop V.3.1 onwards also supports a number of easy ways to use label completion.
The dialog box above also shows an example of a label pick list. This store the last twenty entries made into address
fields throughout the entire High-performance Embedded Workshop application. This means if you are entering a label
multiple times it should be much faster and efficient if you use this recently used address field list. This control is
available for all instances of the address edit field where the input is evaluated.
There is the browse button (
) right next to the edit field where an address can be entered.
If you click this button, the Select Label dialog box will be displayed. A label can be selected from the current list of
labels in this dialog box.
REJ10J2169-0100 Rev.1.00
Jul 01, 2010
Page 513 of 523
High-performance Embedded Workshop V.4.08
10. Using Labels to View Your Code
In this dialog box, the labels are initially listed in alphabetical order and their addresses are displayed on the right. If you
click a column header (of names or addresses), the labels will be sorted by the label name or the address value.
The Filter edit box can be used to help you search for a specific label in the list. When the contents of the edit box are
changed the label list is updated to display only the labels that contain the string entered (not case sensitive). So, in the
above dialog example, if you entered “conv6” as the filter the list box would be set to only contain “__conv64i” and
“__conv64u”. This is a useful feature for when you have a large number of labels in your project.
REJ10J2169-0100 Rev.1.00
Jul 01, 2010
Page 514 of 523
High-performance Embedded Workshop V.4.08
11. Integrated Toolbars in a Components View
11. Integrated Toolbars in a Components View
The High-performance Embedded Workshop V.4.0 onwards has the capability to include a toolbar in a views client area.
This toolbar allows the views functionality to be accessed quickly from this integrated toolbar.
Various views in the High-performance Embedded Workshop system have this functionality. One example is the
Difference view. This is shown below:
The toolbar allows access to key Difference view features.
It is also possible to customize the toolbar further. This can be achieved via the pop-up menu of the toolbar or the
component itself. If you right click on the toolbar itself the following menu is displayed:
The top menu option named "Toolbar" switches showing/hiding of the toolbar (the toolbar is hidden in the figure below).
REJ10J2169-0100 Rev.1.00
Jul 01, 2010
Page 515 of 523
High-performance Embedded Workshop V.4.08
11. Integrated Toolbars in a Components View
The final menu option named "Customize" launches the Customize Toolbar dialog box. This is shown below:
This dialog box allows you to modify the displayed buttons and change the ordering. The list on the left named
Available toolbar buttons displays all toolbar buttons not currently in use on the toolbar. The list named Current
toolbar buttons displays all of the toolbars currently added to the components' toolbar.
To add the currently selected buttons to a toolbar
1.
Select the toolbar button you wish to add from the Available toolbar buttons list.
2.
Press the Add button.
3.
Click OK.
REJ10J2169-0100 Rev.1.00
Jul 01, 2010
Page 516 of 523
High-performance Embedded Workshop V.4.08
11. Integrated Toolbars in a Components View
To move the currently selected buttons
1.
Select the toolbar you wish to move in the Current toolbar buttons list.
2.
Click Move Up or Move Down until it is in the desired position.
3.
Click OK.
To remove the currently selected buttons from a toolbar
1.
Select the toolbar button you wish to remove from the Current toolbar buttons list.
2.
Press the Remove button. The toolbar is added to the Available toolbar buttons list.
3.
Click OK.
REJ10J2169-0100 Rev.1.00
Jul 01, 2010
Page 517 of 523
High-performance Embedded Workshop V.4.08
12. To Build in Toolchain for HEW V.1.x
12. To Build in Toolchain for High-performance Embedded
Workshop V.1.x
When a project created in High-performance Embedded Workshop V.1.x is used without upgrading to new toolchain that
has been registered in High-performance Embedded Workshop V.2.x onwards, the toolchain for the old version must be
registered. Select the ‘HRF’ file for the old toolchain with the Register button by selecting [Tools -> Administration].
Build can be executed on High-performance Embedded Workshop V.2.x onwards by using the old toolchain.
However, note that a workspace which has been opened in High-performance Embedded Workshop V.2.x onwards
cannot be opened in High-performance Embedded Workshop V.1.x.
In High-performance Embedded Workshop V.2.x onwards, a new project for the old version cannot be created. When a
project for the old version in High-performance Embedded Workshop V.1.x is created, use High-performance Embedded
Workshop V.1.x.
REJ10J2169-0100 Rev.1.00
Jul 01, 2010
Page 518 of 523
High-performance Embedded Workshop V.4.08
13. HMAKE User Guide
13. HMAKE User Guide
13.1
Command line
The following section describes the command line that should be used to execute the hmake program on a file using none
or more of the available options.
Basic structure
The command line must be of the following syntax:
hmake <make file you wish to execute> <parameter list>
If a file is specified without an extension then “.mak” will be appended to it. The parameter list may include none or
more of the parameters listed in the following section. The parameters list may appear before the make file name if you
wish. Each parameter must be separated by at least one white space character. Parameters are not case sensitive. If no
parameters are given and no file is given then help information will be displayed.
Exit codes
If there are any syntax errors in the make file being executed or if any process executed whilst running the make file
returns an invalid error code then hmake will exit with code 1. Otherwise hmake will exit with code 0 (See below for file
syntax and how to specify exit code conditions).
Parameters
The following table shows the available parameters and their function:
Parameter
/A
/N
/?
13.2
Function
Execute all commands regardless of input/output file status. Equivalent to a Build All.
Use status of input/output files to calculate what commands need to be executed (as normal) and
then display the commands but do not execute them.
Displays help info.
File syntax
There are four basic types of statement used in a hmake file, the variable declaration the description block, the comment
and the message command. These can be combined in any order to produce a hmake file but a variable must be declared
in a variable declaration before it is used in a description block or other variable declaration. The first “all” statement
used in nmake files is not required in a hmake file. Commands are executed in order, as they appear in the make file.
Note: the “→” character is used to show were a tab character must be used in order to keep the make file syntactically
correct.
REJ10J2169-0100 Rev.1.00
Jul 01, 2010
Page 519 of 523
High-performance Embedded Workshop V.4.08
13. HMAKE User Guide
Variable declarations
A variable declaration declares a variable which can then be used in any statement throughout the rest of the hmake file.
A declaration has the following syntax:
<variable name> = <value>
Any number of white space characters are allowed between the variable name and the ‘=’ sign and the value and the ‘=’
sign. The value may be split over several lines using a ‘\’ character. If the value contains ‘\’ characters within the main
text then these are taken literally. Only ‘\’ characters followed by a new line are considered to indicate a value wrapping
over more than one line.
There follows some examples of valid variable declarations:
EXECUTABLE = c:\dir\prog.exe
OUTPUT = c:\dir2\file1.out
INPUT = c:\dir2\file1.c
DEPEND = c:\dir2\file2.h \
c:\dir2\file3.h \
c:\dir2\file4.h
In order to use a variable later in the hmake file write the variable name with “$(“ added to the front and “)” added to the
back. The variable name (along with the “$()” characters) will be substituted with the variables value. For examples of
this see later under description blocks. Only alphanumeric characters and underscore characters are allowed in variable
names. It is possible to use a variable inside the declaration of a different variable but all variables must be declared
before they are used.
13.3
Description blocks
Basic outline
A description block specifies one or more targets, zero or more dependants and a list of commands which should be
executed if the newest dependent is newer than the newest target. If none of the targets exist and/or none of the
dependants exist then the commands will always be executed. It is not necessary to specify any dependants if you wish
the commands to always be executed. A description block has the following syntax:
<target1> <target2> … : <dependant1> <dependant2> …
→ <command1>
→ <command2>
→ …
→ <commandn>
REJ10J2169-0100 Rev.1.00
Jul 01, 2010
Page 520 of 523
High-performance Embedded Workshop V.4.08
13. HMAKE User Guide
Any number of white space characters are allowed between the last target and the ‘:’ character and the first dependant
and the ‘:’ character. No white space is allowed before the first target. Each target and each dependant must be separated
by at least one white space character. A tab character must be present at the start of a line containing a command.
Variables may be used in a description block using the syntax specified above under variable declarations.
There follows some examples of valid description blocks (one of which uses the variable specified above under variable
declarations):
c:\dir1\file1.obj : c:\dir1\file1.c c:\dir1\file1.h
→ gcc c:\dir1\file1.c
$(OUTPUT) : $(INPUT) $(DEPEND)
→ $(EXECUTABLE) $(INPUT)
Special commands
There are two special commands which can be used in a description block. The "cd" command changes the current
directory and the "set" command sets an environment variable which will then be in use for the duration of the make file
execution. Both are used in the same way as the DOS equivalents.
There follows some examples of valid description blocks which use these commands:
CHANGEDIR :
→ cd c:\dir1\dir2
SETENV:
→ set VAR1=value1
→ set VAR2=value2
→ set VAR3=value3
It does not matter that CHANGEDIR and SETENV are not file names. They will be treated as files that do not exist and
so the commands will always be executed.
Sub command files
If you wish hmake to generate a sub command file for you then the command part of the description block should be
specified as follows (this replaces <commandn> above):
REJ10J2169-0100 Rev.1.00
Jul 01, 2010
Page 521 of 523
High-performance Embedded Workshop V.4.08
13. HMAKE User Guide
→ <command start> <<
→ <sub command1>,
→ <sub command2>,
→ …
→ <sub commandn>
<<<command end>
This will generate a sub command file, in the Windows® temporary directory, which will contain the lines <sub
command1>, <sub command2> etc. This command file will be deleted once the make process has completed. The name
of the command file will be substituted for all the text between the two “<<“’s. You do not have to worry about the name
of the sub command file. This is generated by hmake.
For example:
c:\dir1\file1.obj : c:\dir1\file1.c c:\dir1\file1.h
→ gcc @”<<
→ -c -o c:\dir1\file1.obj c:\dir1\file1.c
<<“
If the sub command file generated has the name “c:\temp\hmk111.cmd” then the following would be executed by hmake
(assuming c:\dir1\file1.obj is out of date):
gcc @”c:\temp\hmk111.cmd”
The command file (c:\temp\hmk111.cmd) would contain:
-c -o c:\dir1\file1.obj c:\dir1\file1.c
It is possible to include more than one command in the description block and to use combinations of the standard, and
sub command file commands.
REJ10J2169-0100 Rev.1.00
Jul 01, 2010
Page 522 of 523
High-performance Embedded Workshop V.4.08
13.4
13. HMAKE User Guide
Comments
A ‘#’ character signifies a comment. When this character appears as the first character on a line the rest of the line (up
until the next new line character) is ignored. There follows examples of valid comments:
# My hmake file
# Variable declaration
OUTPUT= c:\dir1\file1.obj
# Descriptor
$(OUTPUT) : c:\dir1\file1.c c:\dir1\file1.h
→ set VAR1=value1
→ gcc c:\dir1\file1.c
A comment must occupy its own line in the hmake file. It is not possible to put comments on the end of other statements.
13.5
Message commands
The message command is used to output a line of text to standard out whilst a make file is executing. These text lines will
be output in the order they appear in the make file, in amongst output from any executables being executed as
appropriate. No buffering of output text will take place. A message command has the following syntax:
!MESSAGE <text to output>
A new line character is assumed to come after the last character in <text to output>. Any white space between
!MESSAGE and <text to output> will be ignored. There follows an example of a valid message command:
!MESSAGE Executing C Compiler
REJ10J2169-0100 Rev.1.00
Jul 01, 2010
Page 523 of 523
High-performance Embedded Workshop V.4.08
User’s Manual
Publication Date:
Jul 01, 2010
Rev.1.00
Published by:
Renesas Electronics Corporation
Edited by:
Microcomputer Tool Development Department 1
Renesas Solutions Corp.
http://www.renesas.com
SALES OFFICES
Refer to "http://www.renesas.com/" for the latest and detailed information.
Renesas Electronics America Inc.
2880 Scott Boulevard Santa Clara, CA 95050-2554, U.S.A.
Tel: +1-408-588-6000, Fax: +1-408-588-6130
Renesas Electronics Canada Limited
1101 Nicholson Road, Newmarket, Ontario L3Y 9C3, Canada
Tel: +1-905-898-5441, Fax: +1-905-898-3220
Renesas Electronics Europe Limited
Dukes Meadow, Millboard Road, Bourne End, Buckinghamshire, SL8 5FH, U.K
Tel: +44-1628-585-100, Fax: +44-1628-585-900
Renesas Electronics Europe GmbH
Arcadiastrasse 10, 40472 Düsseldorf, Germany
Tel: +49-211-65030, Fax: +49-211-6503-1327
Renesas Electronics (China) Co., Ltd.
7th Floor, Quantum Plaza, No.27 ZhiChunLu Haidian District, Beijing 100083, P.R.China
Tel: +86-10-8235-1155, Fax: +86-10-8235-7679
Renesas Electronics (Shanghai) Co., Ltd.
Unit 204, 205, AZIA Center, No.1233 Lujiazui Ring Rd., Pudong District, Shanghai 200120, China
Tel: +86-21-5877-1818, Fax: +86-21-6887-7858 / -7898
Renesas Electronics Hong Kong Limited
Unit 1601-1613, 16/F., Tower 2, Grand Century Place, 193 Prince Edward Road West, Mongkok, Kowloon, Hong Kong
Tel: +852-2886-9318, Fax: +852 2886-9022/9044
Renesas Electronics Taiwan Co., Ltd.
7F, No. 363 Fu Shing North Road Taipei, Taiwan
Tel: +886-2-8175-9600, Fax: +886 2-8175-9670
Renesas Electronics Singapore Pte. Ltd.
1 harbourFront Avenue, #06-10, keppel Bay Tower, Singapore 098632
Tel: +65-6213-0200, Fax: +65-6278-8001
Renesas Electronics Malaysia Sdn.Bhd.
Unit 906, Block B, Menara Amcorp, Amcorp Trade Centre, No. 18, Jln Persiaran Barat, 46050 Petaling Jaya, Selangor Darul Ehsan, Malaysia
Tel: +60-3-7955-9390, Fax: +60-3-7955-9510
Renesas Electronics Korea Co., Ltd.
11F., Samik Lavied' or Bldg., 720-2 Yeoksam-Dong, Kangnam-Ku, Seoul 135-080, Korea
Tel: +82-2-558-3737, Fax: +82-2-558-5141
© 2010 Renesas Electronics Corporation and Renesas Solutions Corp. All rights reserved.
Colophon 1.0
High-performance Embedded Workshop V.4.08
User’s Manual
REJ10J2169-0100