1
PC-Duo Enterprise Diagnostics
User Manual
This book explains how to use PC-Duo Enterprise Diagnostics version 2.0.
Copyright © Vector Networks Ltd and MetaQuest Software Inc. All rights reserved.
The information in this document is subject to change without notice and should not be construed as a commitment by Vector Networks Limited,
Vector Networks Inc. or MetaQuest Software Inc.
Vector Networks Limited, Vector Networks Inc. and MetaQuest Software Inc. assume no responsibility for errors in this document.
The software described in this document is supplied under a license and may be used or copied only in accordance with the terms of such license.
PC-Duo, and its logos, are trademarks of Vector Networks Limited. MetaQuest is a trademark of MetaQuest Software Inc. All other trademarks
are the property of their respective owners.
PART NUMBER: DD20/00
i
Contents
Chapter 1
Deploying Enterprise Diagnostics . . . . . . . . . . . . . . . . . . . . . . . . . . . . . . . . . . . . 1
Enterprise Diagnostics Components . . . . . . . . . . . . . . . . . . . . . . . 1
Setting Up Enterprise Diagnostics . . . . . . . . . . . . . . . . . . . . . . . . . 1
Installing Enterprise Diagnostics . . . . . . . . . . . . . . . . . . . . . . . . . . . 2
Installing Diagnostics Agents . . . . . . . . . . . . . . . . . . . . . . . . . . . . . . 2
Installing Additional Consoles . . . . . . . . . . . . . . . . . . . . . . . . . . . . . 3
Chapter 2
Getting Started . . . . . . . . . . . . . . . . . . . . . . . . . . . . . . . . . . . . . . . . . . . . . . . . . . . . . . . . . . . 5
Understanding Enterprise Diagnostics . . . . . . . . . . . . . . . . . . . . . 5
Working With the Diagnostics Console . . . . . . . . . . . . . . . . . . . . . 6
QuickStart . . . . . . . . . . . . . . . . . . . . . . . . . . . . . . . . . . . . . . . . . . . . . . 10
Chapter 3
Protecting and Repairing Applications
. . . . . . . . . . . . . . . . . . . . . . . . . . . . . 13
Overview . . . . . . . . . . . . . . . . . . . . . . . . . . . . . . . . . . . . . . . . . . . . . . . 13
Profiling Applications . . . . . . . . . . . . . . . . . . . . . . . . . . . . . . . . . . . . 13
Protecting Applications . . . . . . . . . . . . . . . . . . . . . . . . . . . . . . . . . . 18
More About Snapshots . . . . . . . . . . . . . . . . . . . . . . . . . . . . . . . . . . 19
Restoring Applications to Working Order . . . . . . . . . . . . . . . . . . 19
Self-Healing . . . . . . . . . . . . . . . . . . . . . . . . . . . . . . . . . . . . . . . . . . . . 20
Handling Versioning Problems . . . . . . . . . . . . . . . . . . . . . . . . . . . 21
Chapter 4
Performing Change Analysis . . . . . . . . . . . . . . . . . . . . . . . . . . . . . . . . . . . . . . . . . 23
Manually Building a Profile . . . . . . . . . . . . . . . . . . . . . . . . . . . . . . . 23
Auditing PCs. . . . . . . . . . . . . . . . . . . . . . . . . . . . . . . . . . . . . . . . . . . . 24
Adding Audit Reports to Diagnostics Console. . . . . . . . . . . . . . 25
Viewing Audit Reports . . . . . . . . . . . . . . . . . . . . . . . . . . . . . . . . . . . 26
Comparing Audit Reports . . . . . . . . . . . . . . . . . . . . . . . . . . . . . . . . 27
Printing Audit and Diagnostic Reports . . . . . . . . . . . . . . . . . . . . . 29
ii
Chapter 5
Collecting Information . . . . . . . . . . . . . . . . . . . . . . . . . . . . . . . . . . . . . . . . . . . . . . . . . 31
Defining Variables. . . . . . . . . . . . . . . . . . . . . . . . . . . . . . . . . . . . . . . 31
Using Regular Expressions . . . . . . . . . . . . . . . . . . . . . . . . . . . . . . 35
System Resources . . . . . . . . . . . . . . . . . . . . . . . . . . . . . . . . . . . . . . 36
Auditing Files . . . . . . . . . . . . . . . . . . . . . . . . . . . . . . . . . . . . . . . . . . . 37
Auditing ActiveX Controls . . . . . . . . . . . . . . . . . . . . . . . . . . . . . . . . 38
Auditing Registry Keys and Entries . . . . . . . . . . . . . . . . . . . . . . . 39
Auditing Shortcuts. . . . . . . . . . . . . . . . . . . . . . . . . . . . . . . . . . . . . . . 40
Copying Files . . . . . . . . . . . . . . . . . . . . . . . . . . . . . . . . . . . . . . . . . . . 40
Auditing with Windows Management Instrumentation. . . . . . . 41
Auditing Database Information . . . . . . . . . . . . . . . . . . . . . . . . . . . 43
Collecting Diagnostics for IIS . . . . . . . . . . . . . . . . . . . . . . . . . . . . . 44
Collecting Security Information . . . . . . . . . . . . . . . . . . . . . . . . . . . 45
Chapter 6
Customizing Application Protection
. . . . . . . . . . . . . . . . . . . . . . . . . . . . . . . . 47
Overview . . . . . . . . . . . . . . . . . . . . . . . . . . . . . . . . . . . . . . . . . . . . . . . 47
What Can You Customize? . . . . . . . . . . . . . . . . . . . . . . . . . . . . . . 47
How to Customize. . . . . . . . . . . . . . . . . . . . . . . . . . . . . . . . . . . . . . . 47
Assigning Problem Priorities . . . . . . . . . . . . . . . . . . . . . . . . . . . . . 48
Customizing Problem Descriptions . . . . . . . . . . . . . . . . . . . . . . . 48
Creating Self-Healing Items . . . . . . . . . . . . . . . . . . . . . . . . . . . . . . 48
Customizing Repair Rules . . . . . . . . . . . . . . . . . . . . . . . . . . . . . . . 48
Chapter 7
Scheduling Jobs. . . . . . . . . . . . . . . . . . . . . . . . . . . . . . . . . . . . . . . . . . . . . . . . . . . . . . . . 53
Defining Jobs . . . . . . . . . . . . . . . . . . . . . . . . . . . . . . . . . . . . . . . . . . . 53
Running Jobs . . . . . . . . . . . . . . . . . . . . . . . . . . . . . . . . . . . . . . . . . . . 54
Checking the Status of Jobs . . . . . . . . . . . . . . . . . . . . . . . . . . . . . 54
Checking for Notifications . . . . . . . . . . . . . . . . . . . . . . . . . . . . . . . . 54
Scheduling Jobs . . . . . . . . . . . . . . . . . . . . . . . . . . . . . . . . . . . . . . . . 55
Chapter 8
Requests . . . . . . . . . . . . . . . . . . . . . . . . . . . . . . . . . . . . . . . . . . . . . . . . . . . . . . . . . . . . . . . . . 57
Working with Requests . . . . . . . . . . . . . . . . . . . . . . . . . . . . . . . . . . 57
Troubleshooting Pending Requests . . . . . . . . . . . . . . . . . . . . . . . 57
iii
Chapter 9
Configuring Enterprise Diagnostics . . . . . . . . . . . . . . . . . . . . . . . . . . . . . . . . . 59
Configuring the Support Site . . . . . . . . . . . . . . . . . . . . . . . . . . . . . 59
Setting Options . . . . . . . . . . . . . . . . . . . . . . . . . . . . . . . . . . . . . . . . . 60
Logging Events . . . . . . . . . . . . . . . . . . . . . . . . . . . . . . . . . . . . . . . . . 62
Maintaining Audits and Snapshots . . . . . . . . . . . . . . . . . . . . . . . . 62
Revoking Licenses . . . . . . . . . . . . . . . . . . . . . . . . . . . . . . . . . . . . . . 63
Customizing Remote Control . . . . . . . . . . . . . . . . . . . . . . . . . . . . . 63
Configuring Notifications . . . . . . . . . . . . . . . . . . . . . . . . . . . . . . . . . 63
Appendix A
Audit Preferences . . . . . . . . . . . . . . . . . . . . . . . . . . . . . . . . . . . . . . . . . . . . . . . . . . . . . . 65
Audit Preferences . . . . . . . . . . . . . . . . . . . . . . . . . . . . . . . . . . . . . . . 65
Security Preferences . . . . . . . . . . . . . . . . . . . . . . . . . . . . . . . . . . . . 66
Self Repair Preferences . . . . . . . . . . . . . . . . . . . . . . . . . . . . . . . . . 66
Product Information . . . . . . . . . . . . . . . . . . . . . . . . . . . . . . . . . . . . . 66
Index
. . . . . . . . . . . . . . . . . . . . . . . . . . . . . . . . . . . . . . . . . . . . . . . . . . . . . . . . . . . . . . . . . . . . . 67
iv
1
Chapter 1: Deploying Enterprise
Diagnostics
Enterprise Diagnostics
Components
Enterprise Diagnostics consists of a central,
administrative console, agents that run on remote
computers, and a shared data folder called the
Support Site.
•
It enables peer-to-peer communication
between the consoles and agents.
•
It stores the public profiles, all audit reports, and
the licensing information.
•
It includes the setup programs for consoles and
agents. After the first console is installed and
configured, all other copies of the console are
installed from Support Site.
Diagnostics Console
You use the console to profile, protect, and audit
applications, and to diagnose and fix problems.
The console is a Microsoft Management Console
(MMC) snap-in that you can start from the PC-Duo
Enterprise Console or run as a standalone application. MMC is a feature of the Windows 2000, NT,
and XP operating systems, but MMC can also run
on the Windows 95, 98, and Me operating
systems.
You can add the Diagnostics Console snap-in to
other MMC consoles.
Setting Up Enterprise
Diagnostics
Setting up Enterprise Diagnostics involves
installing at least one copy of the Diagnostics
Console, and a copy of Diagnostics Agent on each
computer where you want to protect applications
or collect diagnostics.
To set up Enterprise Diagnostics on your
network:
1 Install a copy of Enterprise Diagnostics from the
Diagnostics Agents
Agents are installed on each computer on the
network, and are responsible for auditing and
protecting the computers.
CD. In addition to installing a copy of
Diagnostics Console and Diagnostics Agent,
the Setup program allows you to:
• Set up the Support Site, the shared folder
used by all agents and consoles.
• Set the event logging options.
Support Site
2 Install Diagnostics Agent on all computers.
Support Site is a shared folder that has the
following functionality:
3 Install additional copies of Diagnostics Console
as required.
2 CHAPTER 1
Deploying Enterprise Diagnostics
Installing Enterprise
Diagnostics
You can install a copy of Enterprise Diagnostics
from the CD. After you install Enterprise
Diagnostics, the Setup program allows you to set
options shared by all agents and consoles (such
as the Support Site location and event logging
options).
By default, the Setup program installs all features
in a default location. To select the features to
install or to select a different location, choose the
Custom setup type.
Select Features The Custom setup type allows
you to select the features to install. You must
install both Diagnostics Agent and Enterprise
Diagnostics. If you don’t want to diagnose ODBC
database problems, you don’t need to install
Diagnostics/db.
Setting Up the Support Site The Support Site is
a shared folder on a network server. All agents and
consoles must be able to access the Support Site
subfolder in the Offline Area.
Setting the Support Site User Account The
Support Site user account is used by all agents
and consoles to:
• Audit and protect computers.
• Access the Support Site shared folder.
• Run jobs.
• Run the Enterprise Diagnostics service (named
MQ Message Broker).
The Support Site user account must be a domain
Administrator that has local Administrative privileges on each computer.
Do not add any other shares for the Support Site
folder. For example, do not create a second share
so that the Support Site folder is shared both as
//nanp/Support Site and //nanp/Diagnostics.
Setting the Event Logging Options By default,
agents and consoles log events on the local
computer. On Windows NT, 2000, and XP, events
are logged to the Event Log. On Windows 95, 98,
and Me, events are logged to a text file.
On Windows NT, 2000, and XP, you can log all
events to the Event Log on a central server. See
“Logging Events” on page 62 for more information.
Installing Diagnostics
Agents
Diagnostics Agent must be installed on every
computer where you want to protect or audit applications.
To install the agent manually:
1 Connect to the Support Site shared folder.
2 Run the setup program in Setup\Agent.
3 If you want to diagnose ODBC database
problems, Diagnostics/db must be installed on
each computer. The Setup program automatically gets the required Diagnostics/db licenses.
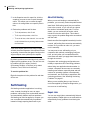
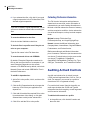
To configure the agent on a computer with no
console, right-click the agent icon in the system
tray (the area to the right of the taskbar) and click
Options.
Agent icon in the system tray
3
Access to the agent options can be disabled. See
“Preventing Users From Editing Options” on
page 61.
Installing Additional
Consoles
You can also install the Diagnostics Agent across
the network using LANdeploy. If you use this
method, you must use the Diagnostics Agent
Package Definition, and you must also specify the
UNC path of the Offline Area as the location of the
installable kit.
You can install any number of additional consoles,
but each copy requires a separate license.
You do not need to specify the location of the
SupportSite subfolder. This location is included in
the Diagnostics package definition.
To install additional consoles:
1 Connect to the Support Site shared folder.
2 Run the setup program in Setup\Console.
3 If you want to diagnose ODBC database
problems, install the Diagnostics/db product.
The Setup program automatically gets the
required Diagnostics/db licenses.
SILENT AGENT INSTALLS Silent installations run with no user intervention. There are two ways to launch a silent
installation of the Diagnostics Agent.
Use setup.exe to launch the silent install:
\\server\supportsite\setup\agent\setup.exe /s /V"/q /l*v \"c:\msi.log\""
/s hides all InstallShield dialogs.
/q runs the Windows Installer in silent mode.
Use the Windows installer (msiexec.exe):
msiexec /i "\\server\supportsite\setup\PC-Duo Diagnostics.msi" MQINSTALLOPTIONS=AGENT /l*v c:\msi.log
You can use MS-DOS batch files, Windows .CMD files, or the Windows Scripting Host and a Visual
Basic Script (VBS) file to automate a silent installation. For example, the following .VBS file launches
a silent installation using msiexec.exe:
Set shell = CreateObject("WScript.Shell")
Shell.Run " msiexec /i "\\server\supportsite\setup\PC-Duo Diagnostics.msi" MQINSTALLOPTIONS=AGENT /l*v
c:\msi.log "
4 CHAPTER 1
Deploying Enterprise Diagnostics
5
Chapter 2: Getting Started
Understanding Enterprise
Diagnostics
Enterprise Diagnostics allows you to protect and
restore applications by taking snapshots of the
applications on your networked PCs. From small
utilities to business-critical applications, you can
protect any number of applications across your
entire network.
Enterprise Diagnostics also provides change
analysis capabilities to help determine root
causes. By comparing application and PC settings
against a baseline or at different points in time, you
can quickly identify and correct the configuration
changes that cause problems.
Protecting Applications
To protect an application, you first build an application profile that describes a working configuration of the application: files, registry entries,
ActiveX controls, self-registered files (DLLs),
shortcuts, and environment variables.
After you have a profile, you can then protect the
application on any computer in your network.
When you protect an application, Enterprise
Diagnostics takes a snapshot of the application
configuration on the computer. The profile drives
this process, because it specifies what items make
up the application configuration.
The snapshot contains everything needed to
restore the application to working order, including
repair rules for detecting and fixing problems, and
an archive of application files.
Repairing Applications
To repair a protected application, you run an audit.
The audit detects potential problems, which you
can then review in the console and fix with a single
click.
Self-Healing Applications
Self-healing reduces support calls and increases
user productivity by guaranteeing the availability of
critical applications. Self-healing automatically
detects and fixes common application problems,
before users are even aware of the problems.
For example, if a user somehow overwrites a key
application DLL with an older version (perhaps by
installing a non-critical application), self-healing
automatically restores the required DLL. The user
never has to call the help desk.
You implement self-healing for protected applications with repair jobs. Repair jobs are scheduled
audits that automatically fix any problems they
detect.
Performing Change Analysis
Change analysis is a basic technique for troubleshooting system and application problems. It is the
process of tracking down configuration changes
on a computer.
With Enterprise Diagnostics, you can build profiles
to collect application diagnostics and system
configuration information such as services and
printers. Then you can audit computers and
analyze the collected diagnostic data. Enterprise
Diagnostics automatically compares application or
6 CHAPTER 2
Getting Started
system settings against a baseline, at different
points in time, or on different computers. This
allows you to quickly identify and correct the
changes that caused the problem.
Enterprise Diagnostics Components
you click a profile in the console tree, the Details
view allows you to view and edit the details of the
profile.
A
B
C
D
Enterprise Diagnostics consists of a central,
administrative console, agents that run on remote
computers, and a shared data folder called the
Support Site.
Diagnostics Console You use the Diagnostics
Console to profile, protect, and audit applications,
and to diagnose and fix problems.
Diagnostics Agents Diagnostics Agents are
installed on each computer on the network, and
are responsible for auditing, protecting, and
repairing the computers.
Support Site Support Site is a shared folder that
stores the public profiles, all audit reports, and
licensing information. Consoles and agents use
the Support Site to share information and to
communicate.
A Standard Menus The Action menu lists the available
tasks, which depend on what is selected in the console
tree. The View menu allows you to customize the
display of the Details pane.
B Console Toolbars The console includes a standard
toolbar and a diagnostics toolbar.
Standard toolbar
Jump back to the previous contents of the
Details view
Jump forward in the previously viewed contents
of the Details view.
Move up one level in the console tree.
Show/hide the console tree.
Delete the item selected in the Details view.
Working With the
Diagnostics Console
The Diagnostics Console consists of a window
divided into two panes. The left pane contains the
console tree, which shows the items available in
the console.
The right pane contains the Details view. The
Details view shows information about the item
selected in the console tree. For example, when
Get help for Microsoft Management Console
(MMC) and for Enterprise Diagnostics.
Diagnostics toolbar
Create a profile that can be used to protect and
audit applications.
Create and schedule an audit, protect, or repair
job.
Open an audit report or profile and add it to the
console tree.
Audit a computer.
7
Protect a computer.
Edit the event logging and maintenance
options.
C Console tree Lists the items available in the console.
This includes profiles, computers, protected applications, snapshots, job definitions and results, and audit
reports.
From the console you can access the local computer,
the entire network, and PC-Duo Enterprise groups.
D Details view Displays information (such as dialog
boxes and HTML pages) for the item selected from the
console tree. For example, in the Details view you can
edit profiles, define jobs, view audit reports, and
review problem diagnostics.
Action Menu
Most tasks in Diagnostics Console, such as
protecting applications and running audits, can be
accomplished from the Action menu.
The available commands on the Action menu
depend on what type of item you select in the
console tree. Right-clicking an item in the console
tree opens a shortcut menu with the same
commands.
SupportSite Configuration Configures the
Support Site. This action is available only for the
PC-Duo Enterprise Diagnostics node in the
console tree.
Options Sets options that apply to all agents and
consoles.
If the Action menu contains only the Help
command, click in the console tree and open the
Action menu again.
The Action menu uses the console tree to
determine what to do. For example, if you select a
computer in the console tree, then the actions
apply to that computer. If the console tree does not
provide enough information for the action, then the
console prompts you for the missing information
(by opening Select Machines and Select
Application dialog boxes).
For example, you can protect an application in any
of the following ways:
•
Right-click a computer, click Protect, and then
select an application in the Select Applications
dialog box.
Audit Collects configuration and diagnostic information from a computer. Automatically detects
problems with protected applications.
•
Right-click a profile, click Protect, then select
one or computers in the Select Machines dialog
box.
Protect Takes a snapshot of an application.
•
Remote Control Connects to a remote computer
and takes control of the display and keyboard.
Uses PC-Duo Remote Control.
Right-click a protected application (to specify
the computer and the application) and then
click Protect.
•
Right-click a domain, group, or network, click
Protect, select one or more computers, and
then select an application in the Select Applications dialog box.
Agent Options Configures the agent program
running on a remote computer.
8 CHAPTER 2
Getting Started
Console Tree
From the console tree, you can access any
computer on your network to protect applications
and run audits (collect diagnostics). You can also
create and edit profiles, diagnose problems,
analyze configuration changes, and schedule jobs.
Profiles For application protection, a profile
specifies the application items to protect. You can
protect files, registry entries, ActiveX controls and
self-registered files, shortcuts, and environment
variables.
For change analysis, a profile specifies what
configuration information to collect. In addition to
files, registry entries, ActiveX controls, shortcuts,
and environment variables, a profile can include
lists of files to retrieve and system resource information (such as services, startup applications, and
printers) to collect.
Public Public items are stored on a central
server (in the SupportSite shared folder) and
shared by all console users. For example, if you
create a new profile you can share it with all other
users by saving it in the SupportSite folder.
Private Private items are stored outside of the
SupportSite folder, for example on your local hard
disk.
To audit and protect computers, a profile must be
public. Private profiles can be used only on My
Computer.
My Computer The local computer.
Entire Network Provides access to all computers
on the network.
Groups Fixed and dynamic groups of computers
defined in the PC-Duo Enterprise console.
Protected Applications All audits and snapshots
are stored under Protected Applications.
Audits An audit is the configuration information
and diagnostic data collected from a computer. An
audit report is created whenever you audit or
protect an application. Audit reports are stored in
the Support Site.
If Enterprise Diagnostics detects potential
problems during an audit, a Problems were
detected node appears under the audit report.
Snapshots A snapshot is an archive of the application files listed in the profile. A snapshot is
created when you protect an application. By
default, snapshots are stored on the local
computer, but you can move them to the Support
Site.
Requests Requests are audit and protect
commands (repair jobs are listed as audit
commands). Pending requests are waiting to be
picked up by agents. In Progress requests are
being processed by the agents.
A job request must finish before any another
request is processed, while requests from the
Action menu in the console are processed
independently in separate threads. While a job
request is In Progress, all requests from consoles
are Pending.
Jobs Jobs are audit, protect, and repair
commands that are scheduled to run at specific
times.
Notifications Notifications are posted when a job
detects problems, fixes problems, or cannot fix
some problems. For example, if a self-healing
repair job fixes some problems, the job posts a
“Fixed problems” notification.
9
Audit Reports Stores audit reports that are not
associated with a specific computer. For example,
you can use Audit Reports to store audits that you
want to keep around for later change analyses.
Details View
The Details view displays the details of an item
selected in the console tree. For example, you can
view the details of a profile, an audit report, or of
the problems found during an audit.
Profile View Allows you to create and edit
profiles. The left pane of the profile view is the
profile tree, which lists the different sections of a
profile.
Profile View
Change Analysis View Allows you to compare
two audit reports. Differences between the two
reports are visually highlighted, so you can quickly
view problems such as missing files, wrong file
versions, invalid registry entries, and invalid OS
settings.
Change Analysis View
Problem Diagnosis View Allows you to review
and fix the problems detected for a protected application.
Problem Diagnosis View
Audit Report View Allows you to review the
contents of an audit report.
Audit Report View
Requests View Allows you to check the status of
requests (such as audit, protect, repair, and undo),
and to delete pending requests if necessary. Note
that repair jobs appear as audit requests.
Requests View
Job View Allows you to define and schedule
audit, protect, and repair actions. You can also use
jobs to batch audit, protect, or repair multiple applicationS on multiple computers.
10 CHAPTER 2
Getting Started
Job View
items such as files and registry keys. Audit jobs
post notifications when they detect problems. Selfhealing (repair jobs) post notifications when they
fix problems.
Notification View
QuickStart
This section walks you through the processes of
profiling and protecting an application, and then
fixing it when something goes wrong.
Job Results View Allows you to check the results
of a job.
Job Results View
Profiling
To profile an application:
1 In the Action menu, click New and then click
Profile.
You can also create a new profile by clicking
New Profile
in the console toolbar.
2 In the profile toolbar, click Auto Profile
Notifications View Allows you to review notifications for problems found by jobs while auditing,
protecting applications, or self-healing. Protect
jobs post notifications when they detect missing
.
3 In the Auto Profile dialog box, click Application.
11
Enterprise Diagnostics displays a list of applications found on your computer.
4 In the Installed Applications dialog box, click an
application and click OK.
Diagnose the problem and repair the
application:
1 In the console tree, right-click My Computer
and then click Audit.
2 In the Select Application dialog box, doubleEnterprise Diagnostics starts the application,
audits your computer, and generates the
profile.
5 Save the profile. In the toolbar, click Save
Profile
.
click the protected application to start the audit.
3 When the audit is finished, expand the audit
and click Problems were detected.
The Details View displays a list of the problems
detected during the audit. Note that if you
renamed an executable, the shortcuts may also
be broken.
4 Click Fix All to fix the problems and restore the
application to working order. Enterprise
Diagnostics restores the file you renamed.
Protecting
To protect an application:
1 In the console tree, right-click My Computer
and click Protect.
2 In the Select Application dialog box, doubleclick the application profile you just created.
After the application is protected, a snapshot
and an audit are added under the computer in
the console tree.
Diagnosing and Repairing
You can now diagnose and repair problems. To
test this, open the application installation folder,
and rename one of the files (for example, the main
executable).
12 CHAPTER 2
Getting Started
13
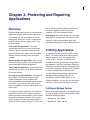
Chapter 3: Protecting and Repairing
Applications
Overview
Enterprise Diagnostics allows you to automatically
diagnose and repair problems with applications.
For example, you can fix problems caused by
missing files, wrong DLL versions, unregistered
ActiveX controls, missing registry entries, and
broken shortcuts.
First, profile the application. The profile
specifies what items (such as files and registry
entries) to protect. Enterprise Diagnostics can
protect and repair files, registry keys and values,
ActiveX controls, shortcuts, and environment
variables.
Second, protect the application. After an application is protected, problems with that application
can be fixed with Enterprise Diagnostics.
Third, audit the application. Audits allow you to
detect problems, which you can then automatically
fix from the console.
How often to protect and audit? It depends on
the computer. Computers that have a stable
system configuration and a constant set of
installed applications do not need regular protects
and audits. You can wait for the users of these
types of computers to report problems before you
run an audit.
For computers where applications are frequently
installed and removed (for example, computers
used by developers and QA testers) you may need
to regularly update the protection. You may also
want to regularly audit the computers instead of
waiting for users to report problems. You can use
jobs to schedule regular protects and audits on
individual computers, entire domains and
networks, or PC-Duo Enterprise groups.
Self-Healing Self-healing allows you to maintain
applications in working order. To implement selfhealing, you define and schedule repair jobs,
which automatically repair any problems they find.
Profiling Applications
An application profile is used to protect an application. The profile lists the files, registry entries,
ActiveX controls (.OCX), self-registered files
(.OCX or .DLL), shortcuts, and environment
variables that make up a working configuration of
the application. Using this information, Enterprise
Diagnostics can take a snapshot of the application
on a specific computer, and later use this snapshot
to restore the application to working order.
You can automatically generate a profile from a
Windows Installer package (.MSI) file, an
InstallShield or Wise Installer project, or an
existing installation. You can also use Diagnostics
Console to manually edit the details of a profile.
Profiling and Windows Versions
When you profile an application, it is important that
you test the profile on the two main families of the
Windows operating systems:
•
Windows 95, 98, and Me.
•
Windows NT, 2000, and XP.
14 CHAPTER 3
Protecting and Repairing Applications
Depending on the version of Windows, some
setup programs install different files and create
different registry entries. Therefore, you may need
two profiles, one for each of the main families of
Windows.
You may also need separate profiles within a
family (for example, separate profiles for Windows
XP and 2000).
You can use the Operating System audit
preference to build profiles for specific versions of
Windows. See page 65.
For applications, building profiles manually
requires considerable, detailed knowledge of the
application.
Auto-profiling Applications
Specifying What to Include The Files, Registry
Entries, Self-registered files (for example, OCXs),
and Shortcuts check boxes control what items are
included in the generated profile.
Building Profiles
Filtering Out Files and Registry Keys As a
general guideline, a profile should not exceed 1
megabyte in size. To control the size of a profile,
use:
Enterprise Diagnostics provides several methods
for building profiles:
• File extensions to ignore to specify which files
you do not want to include in the profile.
Import a Windows Installer package (*.MSI)
file This is the recommended way to build a
profile.
Import the project file for a install package If
you use InstallShield (5.x, 6.x), InstallShield
Express, or Wise Installer to develop install
programs for your applications, you can import the
project files. You can also import Visual Basic
projects.
Generate the profile from an application installation When an application doesn’t use Windows
Installer and you don’t have the source files for the
setup, you can use an existing installation of the
application.
Build the profile manually This method is ideal
for collecting configuration information so you can
perform system change analysis. For example, to
troubleshoot problems with hardware components
such as printers and video cards that have
associated software.
• Registry keys to ignore to specify which registry
keys (for example, HKEY_CLASSES_ROOT)
you do not want to include in the profile.
Filters are specified as a comma-separated list.
You can include one or more spaces between
commas to make the list more readable.
Copying Files When you generate a profile
automatically, you can generate a list of files
(ASCII or binary) to retrieve from the remote
computer. For example, you can retrieve .INI and
other configuration files from a user’s computer.
The File extensions to process as Copy Files box
is a comma-separated list of file extensions. When
the profile is generated, all files with these extensions are added to the list of files to copy.
While copied files are not used to protect an application, they can be useful for performing change
analysis.
15
If the install path is found in the registry, Auto
Profile creates a variable for the application install
directory.
Importing Windows Installer Packages
Microsoft Windows Installer is a component of the
Windows operating system that manages the
installation and removal of applications. A package
(.MSI) file stores information regarding the application setup and installations and is distributed to
end users.
Generating a profile from an MSI file is more
reliable than reverse engineering an existing
installation of the application. Whenever an application uses Windows Installer, you should use its
MSI file to create its profile.
To import an MSI package:
1 In the console tree, right-click Profiles, click
New, and then click Profile.
This creates a public profile (a profile that is
available to all users running a Diagnostics
Console). To create a private profile, expand
Profiles, right-click Private, click New, and then
click Profile.
2 In the profile toolbar, click Auto Profile
.
3 Click MSI. Enterprise Diagnostics displays a list
of the MSI packages found on your system (in
the Installer subfolder of your Windows System
folder, for example, C:\WinNT\Installer).
4 If you don’t see the package you want, click
Browse to locate it.
MSI files typically have unfriendly names such as
4499fdf.MSI. To find the MSI file you want, point to
the file until the tooltip appears, or add the Title
column to the Details view of the dialog (right click
a column header, click More, and select the Title
check box.
5 Click a package and click OK.
6 Select the features you want to import into the
profile and click OK.
7 If necessary, set the advanced MSI import
options:
• To import ActiveX controls from the MSI
package, Enterprise Diagnostics needs to
scan HKEY_CLASSES_ROOT.
• To ignore files, OCXs, registry entries, and
shortcuts that are listed in the MSI package
but not found on the local computer, select
the Import items only if found on this
computer check box.
• If necessary, type the correct installation
folder or click
to locate the installation
folder.
• To ignore components based on the install
conditions specified in the .msi file, type the
install conditions in the Install conditions to
ignore box. Use a semi-colon to separate
each install condition.
Avoid building large profiles, which slow down
auditing, protecting, and change analysis.
Selecting features allows you to build smaller
profiles. For example, the top-level features of
Microsoft Office are Word, Excel, Power Point, and
so on. By selecting features, you can create
separate profiles for each Office program instead
of one large profile for all of Microsoft Office.
16 CHAPTER 3
Protecting and Repairing Applications
For each top-level feature, you may also want to
create profiles with and without optional features
that some users may not install. For example, you
may want a profile for an installation of Microsoft
Word without the spell checker, so that all the
profile items related to the spell checker won’t be
protected and identified as problems.
For complicated MSI packages, you may need to
select shared components as well as the application. For example, to build a profile for Microsoft
Outlook, you may need to select shared Office
Tools components such as the Spell Checker.
Otherwise you won’t be able to diagnose spell
checker-related problems with Outlook.
When you import an MSI file, the self-registered
DLLs are not listed in the ActiveX Controls section
of the profile. Instead, the Registry section includes
all the registry entries required by the DLLs.
Install Package
What you can import
InstallShield 5.x, 6.x
Files, Self-registered
files, Registry keys,
Shortcuts
InstallShield 5.x, 6.x Log
File
Wise Installer
InstallShield Express
Files, Self-registered
files, Registry keys
Visual Basic Project (vbp)
Files, Self-registered
files
To import an install package:
1 In the console tree, right-click Profiles, click
New, and then click Profile.
This creates a public profile (a profile that is
available to all users running a Diagnostics
Console). To create a private profile, expand
Profiles, right-click Private, click New, and then
click Profile.
2 In the profile toolbar, click Auto Profile
.
3 Click Package.
MSI Files and Self-Registered DLLs
4 In the Files of type box, select the type of install
package you want to import.
When you import an MSI file, the self-registered
5 Click an install package and click OK.
DLLs are not listed in the ActiveX Controls section
To import an InstallShield 5.x log file:
of the profile. Instead, the Registry section
includes all the registry entries required by the
DLLs.
1 Load the log (ISU) file in the InstallShield 5.x
log file viewer.
2 Save it as a text file. Diagnostics Console can
read only the text version of the log file.
Importing Install Packages
If you have the source for an install package, you
can use it to build a profile. Enterprise Diagnostics
can automatically import items from the following
common install packages:
Installed Applications
Enterprise Diagnostics can generate a profile from
an existing installation of an application. After you
select an installed application, Enterprise
Diagnostics scans your system for information
17
about the application (such as files, registry
entries, and shortcuts), starts the application to
determine what ActiveX controls it uses, and then
generates the profile.
the standard Windows directories (for example,
c:\temp). Generally, you can remove such files
from the profile.
To auto-profile an installed application:
After You Auto Profile
1 In the console tree, right-click Profiles, click
•
Because not all applications follow standard
rules for installations, profiles for installed applications may not be complete. Visually inspect
the profile and verify that the files, registry
entries, shortcuts, and so on make sense.
•
If the profile includes keys or values under
HKEY_CURRENT_USER, the user must be
logged on when you audit, protect, or repair the
user’s computer. Otherwise, if no one is logged
on, the current user will be the default user and
the audited values will not reflect the user’s
environment.
•
Make sure all paths to files, ActiveX controls,
and shortcuts use variables. If the path to an
item does not use a variable, then the item
cannot be protected.
•
If the application depends on environment
variables, you must add them by hand.
•
Check the Product preferences. The product
name is used as the profile file name, and the
product name and version are used to identify
the profile in the console tree.
New, and then click Profile.
This creates a public profile (a profile that is
available to all users running a Diagnostics
Console). To create a private profile, expand
Profiles, right-click Private, click New, and then
click Profile.
2 In the profile toolbar, click Auto Profile
.
3 Click Application. Enterprise Diagnostics
displays a list of applications found on the local
computer.
If you do not see the application you want to
profile in the Installed Applications dialog, click
Browse and locate the application executable
on your computer.
4 Click an application and click OK.
ActiveX Controls Enterprise Diagnostics can
determine only the ActiveX controls loaded at
startup. ActiveX controls loaded on demand by the
application are not included in the generated
profile. If you are familiar with the application, you
can manually add the missing ActiveX controls.
Too Many Files? If the generated list of files is
too large, add some file extensions to the File
extensions to ignore filter and generate a new
profile.
Files with No Path If a file is listed with no path, it
was probably found somewhere on your hard disk
outside of the application installation directory and
Collecting Information for Change
Analysis
If you cannot restore a protected application to
working order using automated repairs, you may
need to perform a change analysis. Enterprise
Diagnostics can quickly identify changes in system
and application configuration that may be the
cause of the problem.
18 CHAPTER 3
Protecting and Repairing Applications
For example, you can easily collect configuration
information on the operating system, system
resources such as services, running applications,
and memory, and hardware components. For
details, see Chapter 5, “Collecting Information” on
page 31.
To protect an application on multiple
computers:
1 In the console tree, right-click anything except a
computer or a node under a computer, and then
click Protect.
2 In the Select Machines dialog box, select one or
Protecting Applications
Protecting an application on a computer creates
an audit and a snapshot. The audit represents the
configuration of the application on a specific
computer at a specific point in time. For example,
the audit specifies the location and version of each
file listed in the profile, the values of the registry
entries, along with information on any ActiveX
controls and shortcuts.
more computers, groups, domains, or
networks.
3 In the Select Application dialog box, doubleclick an application. (If you right-click a profile in
step 1, you can skip this step.)
After the application is protected, an audit and a
snapshot are added under the computer in the
console tree. You can now view the audit details or
the contents of the snapshot by clicking the audit
or the snapshot in the console tree.
The snapshot is an archive of the files and ActiveX
controls at that point in time, and is used to restore
the application to a working configuration when a
problem occurs.
While Enterprise Diagnostics protects the
computer, you can perform other tasks in the
Diagnostics Console. For example, you can protect
the application on other computers.
Audits and Snapshots
If the protect request seems to be taking a long
time to finish, check the Requests. If the request is
listed as pending, it means that the agent running
on the target computer never picked up the
request.
To batch-protect multiple applications on
multiple computers:
To protect an application on a single computer:
1 In the console tree, expand the Entire Network
and locate the computer.
1 On the Action menu, click New and then click
Job.
2 In the box beside the unscheduled task icon
, type a name for the job.
2 Right-click the computer and click Protect.
3 In the Command list, click Protect.
3 In the Select Application dialog box, double-
4 In the Select Machines box, select one or more
click an application.
computers, domains, groups, or networks.
19
5 In the Select Product box, select the check
boxes for the products you want to protect.
6 In the Job view toolbar, click
to save the job.
7 In the Job view toolbar, click
to run the job.
When you audit the protected application,
Enterprise Diagnostics uses the snapshot profile.
The repair rules in the profile allow Enterprise
Diagnostics to detect and repair potential
problems.
For more information on jobs, see Chapter 7,
“Scheduling Jobs” on page 53.
To unprotect an application:
In the console tree, right-click a protected application, then click Delete. This deletes all audit
reports and snapshots.
More About Snapshots
When you protect an application on a computer,
Enterprise Diagnostics creates a snapshot, which
consists of a file archive and a copy of the profile.
The snapshot profile includes computer-specific
repair rules. For example, registry repair rules are
based on the values found in the registry.
To turn on the repair capabilities, the preference
Enable Self-Repair is set to True in the snapshot
profile. The Enable Self-Repair and Target
Directory repair rule attributes are also set for each
protected item.
By default, the snapshot and the updated profile
are stored on the local computer. For example, a
snapshot for WinZip would be stored in:
C:\Program Files\
PC-Duo Enterprise\Diagnostics\
Data\Snapshots\
WinZip
Restoring Applications to
Working Order
When a user reports a problem with a protected
application, you can automatically diagnose the
problem and fix the application. All you have to do
is use the application profile to audit the user’s
computer. If any problems are detected during the
audit, you can fix them by clicking a button.
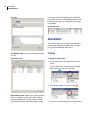
Problem Diagnostics for a Protected Application
To diagnose and fix a problem:
1 In the console tree, right-click a protected application and then click Audit.
2 When the audit is finished, click Problems were
detected.
If snapshots are stored on the Support Site, they
are stored in the Snapshots folder:
Support Site\Snapshots\<domain>\<app>
See “Storing Snapshots on the Support Site” on
page 62.
The Details view displays a list of the problems
detected during the audit.
20 CHAPTER 3
Protecting and Repairing Applications
3 In the Snapshot used for repair list, click the
snapshot you want to use to repair the application. This allows you to restore the application to its configuration at a specific point in
time.
4 Review the problems and fix them:
•
To fix all problems, click Fix All.
•
To fix a specific problem, click Fix It.
•
To undo all fixes, click Undo All. You can also
undo individual fixes by clicking Undo beside
the fixed item.
If the audit request seems to be taking a long time
to finish, check the Requests. If the request is listed
as pending, it means that the agent running on the
target computer never picked up the request.
By default, problems are sorted by priority, with the
highest priority problems at top. You can also sort
by problem type (file, registry, ActiveX,
environment variable, or shortcut) or by status
(Problem, Fixed, Failed to fix this item).
To sort the problem list:
Right click anywhere in the problem list and then
click a sort.
Self-Healing
Self-healing maintains applications in working
order. Instead of waiting for users to report
problems, self-healing runs at scheduled intervals
and automatically detects and fixes problems.
Self-healing can also be applied on request: you
can run audits that automatically fix problems
instead of simply reporting them back to you.
About Self-Healing
When you use self-healing to automatically fix
problems, you can easily review the problems that
were fixed. Self-healing repair jobs post notifications to the console, so you can see at a glance
the results of scheduled repair jobs. For more
details, you can review the job results, which
include a link to the audit report. This makes it
easy to get to the problem diagnostics associated
with the audit.
Note that unlike fixes applied interactively from the
console, self-healing fixes cannot be automatically
undone. So if you want to undo a fix, you must
undo it manually.
You may want to use self-healing only on
computers with relatively unchanging configurations, and only after you are satisfied that the
same fixes work when you apply them interactively
through the console.
Computers with unchanging configurations are
unlikely to experience DLL versioning problems,
where fixing one application breaks another. In
contrast, computers where users are constantly
installing new software, especially beta and test
versions of operating systems or development
environments, are more likely to experience DLL
versioning problems. See “Handling Versioning
Problems” on page 21.
When you are satisfied that you won’t have to
undo fixes applied by Enterprise Diagnostics, you
can move on to self-healing.
Repair Jobs
You can use repair jobs to automatically find and
repair problems. Repair jobs run an audit and then
automatically fix any problems found during the
audit.
21
You can schedule repair jobs or run them
whenever necessary. After a repair job is finished,
you can review the job results and the problems
that were fixed.
To automatically fix selected items during an
audit:
1 In the console tree, click a profile.
2 Find the items you want to automatically repair
To review the results of a repair job:
1 In the console tree, expand the repair job node
and click on a job.
(for example, in the profile tree click Files and
then click a file).
3 Set the Auto Execute Action attribute to True.
To edit repair rule attributes, click Self-Repair
and then click Build Condition.
4 Save the profile and protect the application.
Each time you audit, the items will be automatically
repaired, if necessary.
2 Review the job status displayed in the Details
view.
The Problems column indicates whether the
repair job found any problems when it audited
the computers.
3 To view the audit and the problems, click the job
status and then click View Audit (at the bottom
of the page).
Audits
Repair jobs try to fix all the problems they detect. If
you want to fix selected problems only, you can
customize the profile so that only selected items
are automatically repaired when you audit.
Problems with other items must be fixed manually
from the console.
Handling Versioning
Problems
Sometimes fixing a problem with one application
can break another application. This usually
happens because the two applications depend on
incompatible versions of a common DLL (or VBX
or OCX). This type of situation is commonly
referred to as “DLL Hell”.
Problems Caused By Newer DLLs
Suppose App A needs a more recent version of a
common DLL, but App B needs an older version
because a side-effect of the newer DLL breaks
App B. When a user installs App A, the install
program installs the newer version of the common
DLL, thereby breaking App B.
By default, Enterprise Diagnostics never
overwrites DLLs (or OCXs or VBXs) with older
versions. So Enterprise Diagnostics does not
detect this type of problem (for App B).
22 CHAPTER 3
Protecting and Repairing Applications
However, if you fix the problem with App B, then
Enterprise Diagnostics will detect a problem for
App A, which requires the more recent DLL. When
Enterprise Diagnostics fixes the problem with App
A, App B will break.
You can also collect a list of DLLs loaded by an
application (see page 38). For example, you may
want to compare the version of MFC42.DLL
loaded by the application with the version found in
the Windows system folder.
Copy files to the application installation folder
Problems Caused By Older DLLs
Another cause of DLL Hell problems are install
programs that overwrite common DLLs with older
versions, thereby breaking all applications that
depend on functionality found only in the newer
version.
By default, Enterprise Diagnostics can detect and
fix these types of problems, by upgrading the old
DLLs. However, this may break applications that
require the older version.
Windows File Protection
Windows 98SE, 2000, and XP implement
Windows File Protection (WFP), which prevents
applications and install programs from replacing
Windows system files.
Enterprise Diagnostics does not try to repair
system files protected by WFP.
What Can You Do?
Use change analysis to diagnose versioning
problems You can build profiles to collect version
information for application or system DLLs, and
then compare working and non-working
computers. To get a list of the loaded DLLs on a
computer, select Loaded Modules in the System
Resources section of the profile.
On systems without WFP, you may want to avoid
overwriting system files by customizing the Target
Directory repair rule attribute. If you set Target
Directory to the application installation folder,
Enterprise Diagnostics copies the file to the target
directory instead of to the Windows system folder.
Activate DLL/COM Redirection On Windows
98SE, 2000, and XP systems, you can use
DLL/COM redirection to force Windows to look first
for a DLL or OCX in the folder where the application's .exe file is installed. To activate DLL/COM
redirection, create a zero-byte file named
<app>.exe.local in your application installation
folder.
23
Chapter 4: Performing Change Analysis
Change analysis is a basic technique for troubleshooting system and application problems. It’s the
process of tracking down configuration changes
on a computer.
With Enterprise Diagnostics, you can build profiles
to collect application and system configuration
information. Then you can audit computers and
analyze the collected diagnostic data.
Enterprise Diagnostics automatically compares
application or system settings against a baseline,
at different points in time, or on different
computers. This allows you to quickly identify and
correct the changes that caused the problem.
Manually Building a Profile
To manually build a profile, you have to decide
what information you want to collect. For example:
•
Do you want to collect information on files?
Which files? DLLs, ActiveX controls, shortcuts,
or other types of files? Do you want to retrieve
copies of files?
•
Do you want to check the registry for specific
keys and values?
•
What kind of system configuration information
do you want to collect? Installed applications?
Running services? Loaded modules? Memory
usage? Hardware components?
Adding Items
Diagnostics Console includes tools for building
lists of items to audit, such as files, ActiveX
controls, registry keys, registry values, shortcuts,
and environment variables. To simplify the
process, you can use regular expressions to select
groups of files based on their names (for example,
all the DLLs in a folder). You can also define
variables to represent computer-specific values
such as paths.
See Chapter 5, “Collecting Information” on
page 31 for more information on adding items to a
profile.
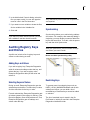
Collecting System Resource Information
Setting up a profile to collect system resource
information is straightforward. Just check off the
items you want to collect.
System Resources
24 CHAPTER 4
Performing Change Analysis
System resource information can include:
Adding Files with Variables
• Operating system information.
• System configuration information such as the
amount of free disk space, what DLLs are
loaded into memory, and what applications are
running.
• Hardware component and configuration information.
Defining Variables
You use variables to represent paths that can vary
from computer to computer, such as the location of
the Windows system folder or the installation
folder of an application.
Variable Definitions
If you want to collect information on files and
shortcuts, or retrieve copies of file, you can use
variables to locate the files on each computer.
If you want to protect application items or build your
own repair rules, you must use variables when you
add files, shortcuts, and ActiveX controls
Auditing PCs
Auditing is the process of collecting diagnostic and
configuration information from a computer. For
basic change analysis, you can simply audit a
computer to see if anything listed in the profile
(such as a file) is missing.
For more detailed change analysis, you need at
least one baseline audit of a working configuration
on a computer. Then when a problem occurs, you
can audit the non-working configuration and
compare it against the baseline audit.
For example, you can use predefined variables to
represent the location of the Windows system
folder, the installation folder of an application, or
the location of the shortcuts on the Start menu.
You can keep just a baseline audit, or you can
periodically audit a computer to track configuration
changes over time (for example: original configuration, configuration after a operating system
upgrade, and so on).
For application files, you can define a variable that
extracts the application install path from the
registry, or use a predefined variable such as
$(Common Files), which stores the location of the
Program Files\Common Files folder.
Audits are saved on the Support Site, so after you
audit you do not have to connect to the computer
again to diagnose the problem. All the collected
diagnostics and configuration information is
available from the Support Site.
25
To audit a computer:
1 In the console tree, right-click a computer and
Adding Audit Reports to
Diagnostics Console
then click Audit.
2 In the Select Application dialog box, doubleclick a profile to start the audit.
The Audit Reports node in the console tree
provides a general-purpose storage area for audit
reports.
To batch audit computers:
1 On the Action menu, click New and then click
Job.
2 In the box beside the unscheduled task icon
, type a name for the job.
3 In the Command list, click Audit.
To add an audit report to the console tree:
4 In the Select Machines box, select the
1 In the console tree, right click Audit Reports and
computers, domains, networks, or PC-Duo
Enterprise groups you want to audit.
5 In the Select Products box, select the check
boxes for the products you want to audit.
6 In the Job view toolbar, click
to save the job.
7 In the Job view toolbar, click
to run the job.
You can limit the maximum number of audit reports
saved for each application. When the limit is
exceeded, the oldest audit is deleted. To set the
limit: on the Action menu click Options, and then
click the Maintenance tab.
If the audit request seems to be taking a long time
to finish, check the Requests. If the audit request is
listed as pending, it means that the Diagnostics
Agent running on the target computer never picked
up the request.
click Open File. Locate the audit report (.zip or
.tra) you want to open and double-click it.
2 Click Yes to add the audit report to the public
audit reports, or click No to add the audit report
as a private report.
Public audit reports are stored in the Support Site
(in \\server\SupportSite\AuditReports) and are
available to all users running a copy of Diagnostics
Console.
Private audit reports are stored outside of the
SupportSite\AuditReports folder, for example on
your local hard disk.
You can add public audit reports by copying .tra or
.zip files to the SupportSite\AuditReports folder.
You may need to refresh the console tree (rightclick Public and then click Refresh).
26 CHAPTER 4
Performing Change Analysis
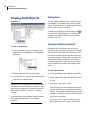
Viewing Audit Reports
Deleting Items
Audit Report
You can delete individual items or entire sections
(for example, the Product section) from an audit
report. To delete an item or section, right-click the
item or section, then click Delete.
To save your changes to the audit report, click
and then click Save Reference. To discard your
changes, click another node in the console tree
and then click Yes.
Opening and Editing Copied Files
To view an audit report:
1 In the console tree, expand a computer, then
expand Protected Applications and expand an
application.
By default, ASCII and binary files are always
attached to the audit report, and opened or edited
with their associated applications. However, ASCII
files can be included in the body of the audit report,
and viewed directly in Diagnostics Console (if the
Attach Copied Files preference is set to False).
Including copied files in audit reports also allows
you to compare the contents and highlight differences.
To view attached files:
2 Expand Audits and click an audit report.
1 In the Audit Report view, expand Copied Files.
3 In the Details view, expand the sections of the
2 Under Copied Files, right-click the file you want
audit report you want to view.
If a section name is highlighted in a different color,
that means an item is missing or different in the
audit report (for example, a file was not found on
the audited computer, or a file is in a different
location).
In an audit report, the Variables section contains
the values of the variables on the audited
computer.
to view.
3 Click Open, Open With, or Edit.
The command you choose depends on the type
of file and what actions are associated with that
file type. For example, on some systems, Open
executes a javascript (.JS) file, while Edit loads
the file into a text editor.
If you are not sure, click Open With and click
the program you want to use to open the file.
27
To view included files:
1 In the Audit Report view, expand Copied Files.
2 Under Copied Files, expand the file you want to
The reference report is in the left pane, and the
audit report is in the right pane.
view.
3 Expand Contents.
To compare audit reports:
To copy content from included files:
1 In the console tree, click the audit report you
1 Expand Contents.
2 Right-click the line you want to copy and click
Properties.
3 Highlight the text you want to copy.
4 Right-click the highlighted text and click Copy.
want to use as a baseline for the comparison.
This audit report is called the reference report,
and it is displayed in the left hand side of the
Details view.
2 In the Details view toolbar, click Compare Audit
Reports
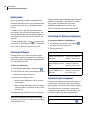
Comparing Audit Reports
When you compare two audit reports, Enterprise
Diagnostics automatically highlights any differences between the two reports. This allows you to
review configuration changes and quickly spot bad
or missing files, wrong file versions, missing
registry entries, invalid OS settings, and more.
.
3 In the right pane, click a computer in the list
(this allows you to compare the configuration of
one computer against another), then click an
audit report in the list of available audits.
Changes Visually Highlighted
4 Review the differences:
• By default, the console shows only the differences between the audit report. Click
display all items. Click
You can compare a computer’s configuration:
•
Against a baseline.
•
At two different points in time.
•
Against the configuration of another computer.
to
to return to the
differences-only view.
• Click
to display the next difference, and
to display the previous difference.
28 CHAPTER 4
Performing Change Analysis
Deleting Items
As you go through the differences between the
reference and audit reports, you can delete items
from the audit report as you eliminate possible
causes.
To delete an item, right-click the item and then
click Delete. Until you save the audit report, you
are only deleting items from the display. When you
are finished, you can either save or discard your
changes.
To save the audit report, click
and then click
Save Audit. To discard your changes, click another
node in the console tree and then click Yes.
Filtered items are never highlighted when they are
different. For example, if you choose to always
apply a filter, the filtered items are never
highlighted as different, even if they are.
Filters are ignored if you load a single report.
Customizing the Difference Highlighting
To customize difference highlighting:
1 In the Details view toolbar, click Options
and then click the General tab.
2 Change the colors.
Filtering Audit Reports
To change the color of Do this
Filtering allows you to filter out irrelevant differences when comparing audit reports. Use filters to
reduce the number of differences displayed when
you view differences only.
To filter out differences:
1 In the Details view toolbar, click Options
.
2 In the Filters tab, clear the check boxes for the
Items that are different in
each report.
In the Color of different
items list, click a color.
Items missing in the audit In the Color of items
report displayed in the left missing in reference
pane
report list, click a color.
Items missing in the audit In the Color of items
report displayed in the
missing in audit report
right pane
list, click a color.
audit items you want to filter out.
3 Select when to apply the filter:
•
When viewing differences only or all items,
click Always.
•
When viewing differences only, but not when
viewing all items, click When viewing “Differences Only”.
To disable filtering, click Never on the Filters tab.
Enterprise Diagnostics saves the filter settings, so
each time you compare two audit reports the same
items are filtered out.
Synchronizing the Comparison
By default, the display of the two audit reports is
synchronized, so that both reports scroll up and
down together, and expand and collapse together.
This makes it easier to perform a side-by-side
comparison of the reports. Turn this feature off if
you want to view each report independently.
To turn off
Synchronized vertical scrolling
Click
29
To turn off
Click
Synchronized horizontal scrolling
Synchronized expanding and collapsing of report sections
2 In the Details toolbar, click
and then click
Print Reference.
If you are comparing audit reports, Print
Reference prints the audit in the left pane, and
Print Audit prints the audit in the right pane.
To print a diagnostic report:
Click Synchronize Item
to display the same
item in both reports when display synchronization
is turned off.
1 Compare two audit reports.
2 In the Details toolbar, click
and then click
Print Diagnostic.
Hiding Files from Non-Active Operating
Systems
When more than one operating system is installed
on a computer, an audit report contains information for each operating system. You can filter
out the non-active operating system when viewing
the audit report.
To filter out files from the non-active OS:
1 In the Details view toolbar, click Options
then click the General tab.
2 Click Ignore files in the non-active operating
system.
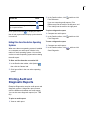
Printing Audit and
Diagnostic Reports
Enterprise Diagnostics can print audit reports and
diagnostic reports. A diagnostic report summarizes the differences between two audit reports.
You can also save diagnostic reports (in a .TRD
file).
To print an audit report:
1 View an audit report.
To save a diagnostic report:
1 Compare two audit reports.
2 In the Details toolbar, click
Save Diagnostic.
and then click
30 CHAPTER 4
Performing Change Analysis
31
Chapter 5: Collecting Information
In addition to collecting information on files,
registry entries, ActiveX controls, self-registered
files, shortcuts, and environment variables, a
profile can also collect:
•
System, operating system, and hardware information.
•
Copies of text and binary files. For example,
you can get copies of text files such as .INI,
.SYS, and .BAT files.
•
Database configuration and connection information.
•
Advanced diagnostics from Microsoft Windows
systems through Windows Management Instrumentation (WMI).
•
Diagnostic information about Microsoft Internet
Information Server (IIS).
Variables can be combined together to form a
single expression. Variables can also be combined
with regular expressions.
Enterprise Diagnostics provides the following
variable types:
•
Registry variables that are expanded based on
a value stored in the registry.
•
INI variables that are expanded based on a
value stored in an INI file.
•
Predefined variables that are automatically
expanded by Enterprise Diagnostics.
•
Environment variables such as Path and TEMP.
•
User-defined variables, which act like constants
in a profile.
Using a Variable to Specify the Location of a File
Defining Variables
Enterprise Diagnostics uses variables to specify
the paths to files and shortcuts. A variable can
represent a file path that can vary from machine to
machine. For example, the location of the
Windows folder can vary from machine to
machine, and different users can install an
application in different directories.
If an application stores paths in the registry, in an
INI file, or relies on environment variables,
Enterprise Diagnostics can use variables to look
for files and shortcuts only in those locations.
Otherwise, Enterprise Diagnostics searches the
entire computer. Similarly, if you know that a file
should be in the Windows folder, you can use a
variable to search only the Windows folder.
Using Variables
To reference a variable, you type an expression of
the form $(Variable Name), where Variable Name
is the name you gave to the variable when you
defined it.
32 CHAPTER 5
Collecting Information
To reference an environment variable, enclose it in
“%(“ and “)”. For example, “%(TEMP)”.
You can use variables with the following items:
• File names of files, shortcuts, ActiveX controls,
and files to copy (to specify computer-specific
paths).
• Definitions of variables.
You can use INI, Registry, Pre-defined, and
Environment variables in the definitions of INI
and Registry variables.
If you select a registry key, the variable is given
the default value of the key (if the default value
is set).
5 In the Variable Name row, click in the Value
column and enter a name for the variable.
INI Variables
An INI variable represents a value stored in an INI
file. For example, suppose an application stores its
installation directory in an INI file as follows:
• Values of the Pre-audit Application and Postaudit Application audit preferences.
[Paths]
InstallPath=C:\Program Files\Company\App
• Repair rules for files, ActiveX controls, and
shortcuts.
You can define an INI variable that extracts the
value of the InstallPath entry in the PATHS section
of the INI file. This INI variable can then be used to
specify the location of a file.
• Repair rule conditions.
• Database information such as database
connection names, SQL statements, SQL
server attributes, and SQL connection strings.
You must use variables if you want to protect files,
shortcuts, and ActiveX controls.
To define an INI variable:
1 In the profile tree, click Variables.
2 Click Add.
3 Click INI to define an INI variable.
4 Type the name of the INI file, the name of the
Registry Variables
A registry variable represents a value stored under
a registry key (either the default value or a named
value).
To define a registry variable:
1 In the profile tree, click Variables.
2 Click Add.
3 Click Registry to define a registry variable.
4 In the Registry Key row, click
to open the
Registry dialog, and select a registry value.
INI section, and the name of INI entry.
5 In the Variable Name row, click in the Value
column and enter a name for the variable.
Other Variable Attributes for INI and
Registry Variables
The Variable Value attribute is set when you click
OK or Apply. This value is used while building the
profile (for example, to find the files you add to the
profile). During an audit or protect, the variable
value is determined by the settings of the user's
computer.
33
The Default Value attribute is used when the value
cannot be extracted from the user’s computer. For
example, when an application is protected, the
Default Value attribute is assigned the variable
value. So when the application needs to be
repaired, a value is available even if it cannot be
extracted from the user’s computer.
The Extract As and Variable Data Type attributes
are used to extract folder paths from file names.
See “Extracting Folders from File Names” on
page 35.
User-Defined Variables
A user-defined variable is a variable that stores a
value specified in the profile. If you want to use the
same value (for example, a string) in a number of
places, you can define a variable to hold this
value.
To define a user-defined variable:
1 In the profile tree, click Variables.
2 Click Add.
3 Click User Defined.
4 In the Variable Name row, click in the Value
column and type a name for the variable.
5 In the Default Value row, click in the Value
column and type a value.
Predefined Variables
Predefined variables are variables whose values
are supplied by Enterprise Diagnostics when you
audit or protect a computer. Most of the predefined
variables provide computer-specific values, such
as the location of the Windows folder and the
name of the computer.
Predefined System Variables
WinDir Windows folder (for example, "c:\WinNT").
WinSysDir Windows system folder (for example,
"c:\WinNT\system32").
SystemDrive Drive where the operating system
is installed (for example, "c:\").
CommonFiles Windows common files folder (for
example, "c:\Program Files\Common Files").
ComputerName Name of the computer (for
example, "KIMA").
RootDir Boot drive (for example, "c:\").
Predefined User-profile Variables
Common Desktop Location of the shared
Desktop folder. For example:
C:\WinNT\Profiles\All Users\Desktop
Common Documents Location of the shared
Documents folder. For example:
C:\Documents and Settings\All Users\Documents
Common Administrative Tools Location of the
shared Application Data folder. For example:
C:\Documents and Settings\All Users\
Administrative Tools\
Common AppData Location of the shared
Application Data folder. For example:
C:\Documents and Settings\All Users\
Application Data\
Common Programs Location of the shared
Programs folder. For example:
C:\WinNT\Profiles\All Users\Start Menu\Programs
Common Start Menu Location of the shared
Start Menu folder. For example:
C:\WinNT\Profiles\All Users\Start Menu
34 CHAPTER 5
Collecting Information
Common Startup Location of the shared Startup
folder. For example:
C:\WinNT\Profiles\All Users\Start Menu\Programs\Startup
SendTo Location of the current user's SendTo
folder. For example, C:\Documents and
Settings\kima\SendTo\.
Common Templates Location of the shared
Templates folder. For example:
Start Menu Location of the current user's Start
Menu folder. For example:
C:\Documents and Settings\All Users\Templates\
C:\WinNT\Profiles\Kima\Start Menu
Personal Location of the current user's My
Documents folder. For example:
C:\Documents and Settings\stephen\My Documents\
AppData Location of the current user's
Application Data folder. For example:
C:\Documents and Settings\stblair\Application Data\
Cookies Location of the current user's Cookies
folder. For example:
C:\Documents and Settings\stephen\Cookies\
Desktop Location of the current user's Desktop
folder. For example:
C:\Documents and Settings\stephen\Desktop\
Favorites Location of the current user's Favorites
folder. For example:
C:\Documents and Settings\kima\Favorites\
NetHood Location of the current user's NetHood
folder. For example:
C:\Documents and Settings\kima\NetHood\
My Pictures Location of the current user's My
Pictures folder. For example:
SendTo Location of the current user's SendTo
folder. For example:
C:\Documents and Settings\kima\SendTo\
Templates Location of the current user's
Templates folder. For example:
C:\Documents and Settings\kima\Templates\
Startup Location of the current user's Startup
folder. For example:
C:\WinNT\Profiles\Kima\Start Menu\Programs\Startup
Local Settings Location of the current user's
Local Settings folder. For example:
C:\Documents and Settings\kima\Local Settings\
Local AppData Location of the current user's
local Application Data folder. For example:
C:\Documents and Settings\kima\
Local Settings\Application Data\
Cache Location of the current user’s Temporary
Internet files folder.
C:\Documents and Settings\kima\My Documents\
My Pictures\
History Location of the current user’s History
folder.
PrintHood Location of the current user's
PrintHood folder. For example:
Fonts Location of the system fonts folder. For
example, C:\WinNT\Fonts.
C:\Documents and Settings\kima\PrintHood\
Administrative Tools Location of the current
user’s Application Data folder. For example:
Recent Location of the current user's Recent
folder. For example:
C:\Documents and Settings\kima\Recent\
C:\Documents and Settings\kima\
Administrative Tools\
35
Environment Variables
You can control where Enterprise Diagnostics
locates files by prefixing a filename with an
environment variable. For example, to locate a file
in the TEMP directory, you can specify
%(TEMP)\myfile.txt.
For example, if you auto profile the WinZip
application, the following variable is defined:
Variable Name WinZip
Registry Key
HKCU\software\nico mak computing\winzip\programs\zip2exe
Typical environment variables that could be useful
as variables:
Variable Data
Type
File
•
%(COMPUTERNAME) returns the name of the
computer where Diagnostics Agent is running.
Extract As
Folder
•
%(SYSTEMDRIVE) returns the drive on which
the active operating system is installed.
•
%(TEMP) returns the path of the temporary
folder.
Extracting Folders from File Names
Sometimes, an application does not store its
installation path in the registry, but it does store the
full path names of some files in its installation
folder. You can define a variable that gets the file
name from the registry, and then extracts only the
path part.
For example, if a registry value is C:\Program
Files\MyApp\myapp.exe, you can define a variable
that extracts just the C:\Program Files\MyApp part.
To extract the folder from a file name:
Given this variable definition, if the value stored in
the registry is C:\Program Files\
WinZip\WZSEPE32.EXE, then $(WinZip)
evaluates to C:\Program Files\WinZip.
Using Regular
Expressions
Use regular expressions to select groups of files
based on their names. For example, to select all
MFC DLLs in the Windows system directory, you
would use the regular expression "^mfc.*\.dll".
Enterprise Diagnostics audits any file whose name
contains a substring that matches the regular
expression. So, for example, the regular
expression "mfc" matches any file containing the
string "mfc"—not just the DLLs, but also files like
"mfcuix.hlp" and "MFC Tracer" (a shortcut).
1 Create a new registry variable.
2 Set the Extract As attribute to Folder. This
specifies how to extract the variable value when
replacing a variable reference in the profile.
3 Set the Variable Data Type attribute to File.
Variable Data Type specifies what kind of value
is stored in the registry key.
Note that you cannot protect files added with
regular expressions.
. The period (.) matches any character. For
example, "ie." matches both "ie5" and "ie6". To
match an ordinary period, you use the backslash.
For example, "\.ini" matches ".ini".
36 CHAPTER 5
Collecting Information
* The asterisk (*) matches zero or more
occurrences of the preceding character. For
example, ".*" matches any string of characters,
and “.*\.dll” matches all DLLs.
^ The caret (^) matches the beginning of a string.
For example, "^reg" matches any string that
begins with "reg".
$ The dollar sign ($) matches the end of a string.
For example, "ini$" matches any string that ends
with "ini". And while "\.ini" matches both "runlog.ini"
and "foo.init", "\.ini$" matches only files with a ".ini"
extension.
[ ] Matches a range of characters. For example,
"[A-Za-z0-9]" matches any alphanumeric
character. "[0-9]*" matches zero or more digits. If
the first character is the caret (^), the expression
matches any character not in the range. For
example [^AB^] matches any character except A,
B and the caret itself.
\ Used to escape special characters. For example,
"\." matches a period (.) and "\$" matches a dollar
sign ($).
Examples
2 Click Add with regular expression.
To look for all files that have a .DLL extension
in the Windows system directory:
1 In the Variables list, click the WinSysDir
variable.
2 In the File Name box, type the regular
expression “.*\.DLL”.
3 Click Add with regular expression.
To look for all files that have a .DLL extension
in the Windows system directory and its
subfolders:
1 In the Variables list, click the WinSysDir
variable.
2 Click the Include subfolders check box
3 In the File Name box, type the regular
expression “.*\.DLL”.
4 Click Add with regular expression.
To look for all files that have a .DLL extension
in a subfolder of the Windows system
directory:
To look for all DLLs in the Windows system
folder:
1 In the Variables list, click the WinSysDir
1 In the File Name box, type the regular
2 In the File Name box, type the regular
expression “.*\.DLL”.
2 In the Variables list, click WinSysDir.
variable.
expression “aSubFolderName\.*\.DLL”.
3 Click Add with regular expression.
3 Click the Include Subfolders check box.
4 Click Add with regular expression.
To look for all files in a specific folder:
1 In the File Name box, type the regular
expression “.*\..*”.
System Resources
Enterprise Diagnostics can collect a wide variety of
information about the configuration of a computer:
37
System resource information, including
displays, drives, installed applications, NT
services, printers, startup applications, loaded
modules, central processor, running applications, memory, and RAM.
Auditing Files
•
Use variables to specify the location of the files.
•
Operating system information, such as international settings, keyboard, time zone information, and Windows system information.
•
Select files from the folders on your computer
or on any other computer in the network neighborhood.
•
Hardware information about components such
as CD-ROM drives, disks, displays, hard drive
controllers, monitors, ports, and system boards.
•
Add all DLLs that one of your application DLLs
depends on.
•
To collect system resource information:
1 In the profile tree, click System Resources.
2 Select the check boxes for the information you
want to collect. Clear the check boxes for information you don’t want to collect.
To select just one or two check boxes under
Operating System or System Resources, clear the
top-level check box. This clears all check boxes so
you can then select the check boxes you want.
By default, the Network Neighborhood check box
(under System Resources) is cleared. Do not
select this check box for large networks because
auditing networks can take a long time.
The system resource information collected by
Enterprise Diagnostics depends on the version of
Windows installed. For example, Display Fonts
information is collected on Windows 95 and 98, but
not on Windows NT, 2000, and XP. If Enterprise
Diagnostics does not collect the system resource
information you need, use Windows Management
Instrumentation (WMI) to collect the required information. See “Auditing with Windows Management
Instrumentation” on page 41.
A profile includes a list of application files that you
want to audit. To include files in a profile, you can:
For an EXE file, Enterprise Diagnostics
automatically collects information about the
DLLs that the EXE loads (so you don't have to
add the DLLs yourself). But if you want to
collect information for all instances of a DLL on
a system, you must add the DLL to the profile.
Use variables in the file name to collect information
for only one specific instance of the file. Otherwise,
Enterprise Diagnostics collects information for all
instances of the file found on the computer.
If you want to protect files, you must use variables
to add the files.
To add files:
1 In the profile tree, click Files.
2 Click Add.
3 Locate the folder containing the files you want
to add.
4 Select the files you want to audit:
To add specific files, select the files.
To add all files whose names match a regular
expression, type the regular expression in the
File Name box.
5 If you want to use a variable to locate the files,
click a variable in the Variables list.
38 CHAPTER 5
Collecting Information
6 If you selected the files, click Add. If you typed
a regular expression in the File Name box, click
Add with regular expression.
If you use a variable or regular expressions, you do
not have to locate the actual folder containing the
files.
To search subfolders for the files:
Click the Include Subfolders check box.
To include files in a profile even if they do not
exist on your computer:
Type the file names in the File Name box.
To search network drives and CDROMs:
By default, Enterprise Diagnostics searches for
files on the local hard drives of a computer. If you
want Enterprise Diagnostics to also search
network or CD-ROM drives by default, set Include
Network Drives and Include CDROMS to True in
the Audit Preferences.
To add DLL dependencies:
1 Add a DLL to the profile, click it, and then click
Properties.
2 Click the DLL Dependencies tab to browse the
hierarchy of DLLs that your application DLL
depends on.
Collecting File Version Information
The File Version Information audit preference
determines how much file version information is
collected during an audit. Setting this attribute to
Minimal or Normal reduces the amount of memory
and time required to audit files. It also reduces the
size of the audit reports, so they load and compare
faster.
Minimal extracts FileVersionProp,
FileDescriptionProp, and LegalCopyrightProp.
Normal extracts the Minimal information plus:
CompanyName, InternalName, OriginalFileName,
Productname, and ProductVersion.
Full extracts Normal and Minimal information
plus: Comments, FileVersion (not the same as the
one above), ProductVersion (not the same as the
one above), TradeMarks, PrivateBuild,
SpecialBuild, fileFlagsMask, FileFlags, Os, Type,
SubType, Translations, and TranslationsCharset.
Auditing ActiveX Controls
A profile can include a list of ActiveX controls
(.OCX) and self-registered files (.OCX or .DLL) to
audit. For example, you can set up a profile to
check that a DLL is registered correctly.
For each ActiveX control listed in the profile, an
audit report includes the CLSID and TypeLib
information found in the registry, as well as general
and file version information.
3 Click Add All to add all the required DLLs to the
list at the bottom of the dialog, or click Add
Selected Item to add just the selected DLL.
4 Click OK to add the DLLs to the profile.
To add ActiveX controls to a profile:
1 In the profile tree, click ActiveX Controls and
then click Add.
39
2 In the Add ActiveX Controls dialog, select the
files you want to add. You can also type the
name of a file in the File Name box.
Only selected keys and values can be protected
and repaired.
3 If you want to use a variable to locate the files,
click a variable in the Variables list.
4 Click Add.
If you want to protect ActiveX controls, you must
use variables to add the ActiveX controls.
Auditing Registry Keys
and Entries
A profile can include a list of registry keys and
values to collect during an audit.
Synchronizing
Synchronizing allows you to add missing subkeys
and values. For example, after manually adding a
single key, you may decide you want to add all the
keys at the same level. To do this, click the parent
key and then click Synchronize.
After you synchronize, you must select the keys
and values you want to audit.
Before and After Synchronizing a Key
Adding Keys and Values
If you add a registry key, Enterprise Diagnostics
adds all values and subkeys under that key, and
selects the key. If you add a registry value,
Enterprise Diagnostics adds just the value and
selects it.
Selecting Keys and Values
During an audit, Enterprise Diagnostics gets the
selected keys and values. To select a key or value,
click the check box for the key or value.
For each selected key, Enterprise Diagnostics gets
all values entered in the registry for the key. If the
Recursive Registry Scan audit preference is True,
Enterprise Diagnostics gets all subkeys and
values under that key.
Restricting Keys
To prevent users from selecting keys such as
HKEY_LOCAL_MACHINE\Software and all their
subkeys and values, you can build a list of
restricted keys. Restricted keys cannot be added
or selected.
The list of restricted keys is stored in the file
ProfViewer.ini, which you can find in the Enterprise
Diagnostics installation folder.
40 CHAPTER 5
Collecting Information
Auditing Shortcuts
Attaching Copied Files
A profile can include a list of shortcuts (.LNK files)
to check. For example, you can set up a profile to
check that a shortcut exists and that it points to the
correct target.
Binary files are always attached to audit reports.
And by default, ASCII files are also attached to
audit reports (so the audit report contains only a
reference to the copied files, which are stored
externally in the file system).
For each shortcut listed in the profile, an audit
report includes shortcut properties such as the
shortcut's target, arguments, and working
directory.
To add shortcuts to a profile:
1 In the profile tree, click Shortcuts and then click
Add.
2 In the Add Shortcuts dialog, select the shortcut
files you want to add and click Add.
You can use variables such as Common Start
Menu to represent the location of the shortcut. In
the Variables list, click a variable. Click Add to add
the shortcut files.
If you want to protect shortcuts, you must use
variables to add the shortcuts.
Attaching the copied files reduces the size of the
audit report and reduces the amount of time
required to load the report into Diagnostics
Console. It also allows you to use the application
associated with the file type to open or edit the file.
You can include copied ASCII files in the audit
report file by setting the Attach Copied Files
attribute to False. Including copied files in an audit
allows you to automatically compare them when
you compare audit reports.
However, including copied files increases the size
of the audit report and the time required to load the
report into Diagnostics Console. It also means you
cannot open the file in another application (such as
Notepad).
Copying Files
Do not copy files that have extremely long path
names. Enterprise Diagnostics recreates the
entire folder structure of the copied file under the
Support Site. For example, if you copy the file
c\Program Files\App\file.ext, then Enterprise
Diagnostics creates this folder structure:
A profile can include a list of files to retrieve during
an audit. These files can be text files or binary
files.
C:\Program Files\PC-Duo Enterprise\
Diagnostics\SupportSite\
c\Program Files\App\file.ext
Unless you use a variable to specify the exact
location of the file to copy, Enterprise Diagnostics
copies all occurrences of the file it finds on the
computer. Therefore, it is strongly recommended
to use variables when specifying files to copy.
If you copy a file with a path name of over 200
characters, Enterprise Diagnostics cannot create
the folder because the path is too long. In
Windows, the length of a path name cannot
exceed 260 characters.
41
Possible workarounds: 1) include the file in the
audit report instead of attaching it; 2) make the
audit report a private audit report and save the file
in the root folder of your drive (for example, C:\).
This reduces the path name by over 55 characters.
Auditing with Windows
Management
Instrumentation
Windows Management Instrumentation (WMI) is
the Microsoft implementation of Web-Based
Enterprise Management (WBEM), which is an
industry initiative to develop a standard technology
for accessing management information. Such
management information includes information on
the state of system memory, networks, devices,
and other information on client status. WMI offers
a powerful set of base services that include querybased information retrieval and event notification.
WMI is supported on Windows 2000, XP, and Me,
and available as an optional install for Windows 95
OSR 2, 98, and NT4 SP5.
WMI Components
An application profile can specify a list of WMI
components and their properties to audit. To
customize the WMI information audited, you can:
•
View the properties and change their values.
•
Reload the factory default settings for a
category or an object.
To customize the WMI Components list, you can:
•
Remove a component or a category from the
list.
•
Add additional WMI Components for selection.
Editing WMI Category Properties
Display name Caption of the WMI category
(referred to as a namespace).
Namespace Specifies the server path of the
namespace.
Editing WMI Component Properties
Display name Caption of the WMI component.
Query Associators If True, Enterprise
Diagnostics audits all associated WMI objects.
WMI SQL SQL statement that specifies what
information to retrieve. You can change the name
and the value of the WMI SQL property. You can
also add new SQL statements for the same object.
For example, to query the NT event log for errors
only and separate the result of each query under
three different categories: Application Errors,
Security Errors and System Errors:
1 Rename the default WMI SQL to "Application
Errors" and modify the SQL statement to:
SELECT * FROM Win32_NTLogEvent
WHERE LogFile = "Application" AND Type = "Error"
2 Add a WMI SQL property and rename it to
"Security Errors". Set the WMI SQL statement
to:
SELECT * FROM Win32_NTLogEvent
WHERE LogFile = "Security" AND Type = "Error"
3 Add a WMI SQL property and rename it to
"System Errors". Set the WMI SQL statement
to:
SELECT * FROM Win32_NTLogEvent
WHERE LogFile = "System" AND Type = "Error"
42 CHAPTER 5
Collecting Information
For Enterprise Diagnostics to audit a WMI
Component and return information about the
component, you must provide at least one WMI
SQL property for the component.
Customizing the WMI Components List
To audit a WMI object not listed in the factory
default list, you use the Customize feature to first
add it to the list.
To add a new component to the list:
1 Click Customize.
2 In the Customize dialog, click the check box for
component you want to add.
3 Click Add.
You can change the display name of the object to
a more user-friendly name by entering the new
name in the Display Name column. (Objects
prefixed with a '*', are objects containing a modified
Display Name.)
To add several objects at once, hold down the
CTRL key and then click each object you want to
select. Hold down the SHIFT key to select a range
of files. Click Add to add the selected objects.
To add a new category you must edit the
UserWMI.INI file and add it under the
[Namespaces] section.
To remove a component or category from the
list:
Click a WMI component or category and then click
Remove. You cannot remove any of the factory
default WMI Objects from the list.
WMI INI File Format
The list of WMI categories and components
displayed in Enterprise Diagnostics is defined by
the MqWMI.INI and UserWMI.INI files.
• MqWMI.INI provides the list of default WMI
categories and their components. Settings in
the MqWMI.INI are referred to as factory
settings and cannot be removed using Enterprise Diagnostics.
• UserWMI.INI contains the categories and
components added using Enterprise
Diagnostics.
If you edit the INI files manually, you must follow to
the file format described below so that Enterprise
Diagnostics can load these files. Categories
(namespaces) must be added manually to the
UserWMI.INI file following the format outlined
below. To add a category, you must add an entry
under the [Namespaces] section:
Category (Namespace) entry:
[Namespaces]namespace=type:
display name:namespace server path
where type can have two possible values:
• 0 (Default)
• 1 (Custom)
For example:
[Namespaces]
CIMV2=0:Win32 Environment:\\.\root\cimv2
To add a category's component list, you must add
object (class) entries under its corresponding
namespace section:
Component (Class) entry:
[namespace]
class name=type:displayname:SQLstatement
43
For example:
ODBC Database Configuration
[CIMV2]
Win32_DMAChannel=0:DMA Channel:SELECT * FROM
Win32_DMAChannelWin32_IRQResource=0:IRQ
Enterprise Diagnostics steps you through the
process of specifying what to collect about a user's
ODBC installation. The ODBC configuration
information is grouped into categories:
Resources:SELECT * FROM
Win32_IRQResourceStoppedManualServices=1:Stop
ped Manual
Services:SELECT * FROM Win32_Service WHERE
StartMode = "Manual" AND State = "Stopped"
StoppedManualServices is an example of a
custom class that you can add that adheres to the
format guidelines.
Auditing Database
Information
Diagnostics/db extends the auditing capabilities of
Enterprise Diagnostics to include database
configuration information and database content.
Diagnostics/db can collect information for any
ODBC-compliant database such as Oracle,
Microsoft SQL Server, and Microsoft Access.
Due to the nature of how ODBC is implemented,
(multiple layers of programs and drivers
communicating with each other), troubleshooting
can be a challenge.
With Diagnostics/db, when an ODBC call fails, you
no longer need to spend hours trying to determine
whether it is a problem with client libraries, or a net
protocol mismatch, or even a database engine not
running, Diagnostics/db can collect all the
information required to perform a proper diagnosis
in minutes.
System DSNs Data Source Name, registry
security, description, system database, ODBC
driver, User, DSN configuration settings, and
more.
User DSNs Data Source Name, registry security,
description, system database, ODBC driver, User,
DSN configuration settings, and more.
File DSNs Data Source Name, and file
information (location, size, attributes).
ODBC Drivers File version information (file
name, location, file version, attributes, and more),
API level, ODBC driver version, SQL level, and
more.
Database Connection Information
Enterprise Diagnostics/db can retrieve data from
any database table a user has access to read. The
Database Connection Editor provides three ways
to retrieve data from a database:
By selecting tables Enterprise Diagnostics
returns the content of the selected tables.
By selecting stored procedures Enterprise
Diagnostics returns the result of running the stored
procedure.
By specifying an SQL statement Enterprise
Diagnostics returns the result of running the SQL
statement.
With Database Connection Information, you can
add new connections and edit or remove existing
connections.
44 CHAPTER 5
Collecting Information
To add a database connection:
1 In the Database Connections dialog, click Add.
The Database Connection Editor opens to
allow you to create a new Database
Connection.
2 In the Type list, click the type of connection.
3 For an ODBC connection, click Browse and
then click the type of DSN.
User DSN Click a user DSN and click OK.
System DSN Click a system DSN (if any) and
click OK.
• To select only certain tables in the DSN, click
the check boxes beside the tables you want to
include.
To select procedures:
• To select all the procedures in the DSN, click
the check box beside ODBC Procedures in the
list of procedures.
• To select only certain procedures in the DSN,
click the check boxes beside the procedures
you want to include.
To enter SQL statements:
File DSN In the Look in Drive list click a drive,
then click a file DSN and click OK.
1 Under SQL Statements, click Add to add a
SQL Server Enter the names of the SQL server
and the database, a SQL Server login name (ID)
and password, and then click OK. You can use
variables in any of the fields.
2 Under Edit SQL Statement, type a name and
No DSN Enter a connection string that will open
the database. For example:
DRIVER=SQL Server;SERVER=YourServer;
UID=YourLogonName;PWD=YourPassword;
APP=Microsoft®Access;WSID=YOURMACHINE;DATA
BASE=YOURDATABASE)
You can use variables in the connection string.
Selecting Data to Collect
You can select the data to be collected from the
connection as Tables, Procedures and SQL
Statements.
query to your connection.
SQL statement (for example: Select * from
tblAttachments).
You can use variables in the SQL statement.
3 Click Test to view the results of your query in
your default Web browser.
4 When you are satisfied with the query, click
Apply.
You can add more SQL Statements to your
connection, and edit or remove existing ones.
To select tables:
Collecting Diagnostics for
IIS
• To select all the tables in the DSN, click the
check box beside ODBC Tables in the list of
tables.
You can collect information about the Web sites,
virtual directories, FTP sites, and SMTP servers on
an IIS Web server.
45
To collect IIS diagnostics:
1 In the profile tree (Details view), click Audit
Preferences.
2 In the Value list of the Internet Information
Server attribute, click True.
Collecting Security
Information
You can collect security information (permissions)
for files, shares, and registry entries.
To collect security information:
1 In the profile tree (Details view), under Audit
Preferences, click Security.
2 Set the Include File Security, Include Registry
Security, or Include Share Security attribute to
True.
Enterprise Diagnostics collects security
information for the registry entries listed in the
profile.
46 CHAPTER 5
Collecting Information
47
Chapter 6: Customizing Application
Protection
Overview
When you protect an application, Enterprise
Diagnostics generates repair rules that specify
how to detect and fix problems. For example, the
repair rule for a file looks like this:
If (Audit Status = Found AND File Version >= 4.1.0.0)
Do Nothing
Else
Fix it
So if an audit does not find the file or the file
version does not match the version found when it
was protected, a problem is detected.
Repair rules are saved in a copy of the profile. This
copy is created when you protect the application,
and is stored with the snapshot. In addition to
generating If .. Else ... statements in the snapshot
profile, Enterprise Diagnostics also sets the
Enable Self-Repair and Target Directory repair rule
attributes and the global Enable Self-Repair audit
preference.
•
Create self-repairing items that automatically
repair themselves when problems are found
during an audit.
•
Replace the generated If .. Else ... statements
with your own custom rules for detecting
problems.
Note that while the generated rules are computerspecific, custom rules are generic. A generated
rule is based on the state of the protected
computer. For example, different computers may
have different versions of a file, or files may be
installed in different locations. A custom repair rule
is the same for all computers.
How to Customize
To customize the repair rule for an item:
1 In the console, edit the repair rules for one or
more items.
2 Save the profile.
3 Protect the application.
What Can You Customize?
By editing the profile before you protect an
application, you can:
•
Assign priorities to problems, so that the
highest priority problems appear at the top of
the list.
•
Change the descriptive text displayed in the
console for problems.
Protecting the application again propagates the
changes you made to the profile to the protected
computers (each protected computer has its own
copy of the profile).
48 CHAPTER 6
Customizing Application Protection
Assigning Problem
Priorities
To change the default caption text, type a new
caption in the Caption box beside the Fix it action.
The Problem Diagnostics view sorts problems by
priority, with the highest priority problems
appearing at the top of the list. By default, all
problems are sorted in this order:
• Files
• ActiveX controls
The width of the column for the caption is
controlled by the Action column width preference.
• Registry keys and values
• Environment variables
• Shortcuts
To move a problem to the top of this list, set its
Problem Priority attribute to a lower value. Lower
values indicate higher priority.
Customizing Problem
Descriptions
The Title and Description attributes specify the
main descriptive text shown in the console.
Creating Self-Healing
Items
The Auto Execute Action attribute controls
whether Enterprise Diagnostics automatically
executes the Fix It action when it detects a
problem during an audit.
The problem will be listed in the console as Fixed,
and you won’t be able to undo the fix.
Descriptive text for a problem
Description
Title
Details Caption
You can hide the details by setting Diagnosis Show Details to False (in the Self-Repair audit
preferences). The detail text is automatically
generated and cannot be customized.
Customizing Repair Rules
When you protect an application, Enterprise
Diagnostics generates default repair rules. You
can replace the default repair rules with
customized repair rules.
When you customize the conditions or actions of a
repair rule, you must set the Locked attribute to
True. Otherwise the customized rule is overwritten
by a generated rule when you protect the
application.
49
About Repair Rules
Editing Repair Rules
The general form of a repair rule looks like this:
To edit a repair rule:
if ( condition )
1 In the profile tree, click Files, Registry, ActiveX
action1
else
action2
condition is a logical expression that tests the
values in an audit report.
actions are predefined actions such as Fix it,
Display Message, and Do Nothing. Fix it depends
on the type of object.
Generating Repair Rules
You can generate repair rules for files, ActiveX
controls, shortcuts, environment variables, registry
keys, and registry values.
To generate repair rules for specific items:
1 In the profile tree, click Files, Registry, ActiveX
Controls, Environment Variables, or Shortcuts.
2 Select one or more items.
Use the Shift and Ctrl keys to select multiple
objects, or drag the pointer over the objects you
want to select. To select by dragging, point to a
blank area (for example, the whitespace after
an item name) and then drag the bounding
outline.
3 Click Self Repair and then click Auto Build.
Diagnostics Console generates default repair
rules for the selected items.
Controls, Environment Variables, or Shortcuts.
2 Click an item (a file, ActiveX control, shortcut,
environment variable, or registry entry).
3 Click Self Repair and click Build Condition.
Locking Customized Repair Rules
If you customize any repair rule conditions, you
must lock the repair rules so the conditions are not
replaced with generated rules when you protect
the application. You don’t have to lock a rule when
you set rule attributes.
When you lock a rule, you must set Enable Self
Repair and Target Directory attributes yourself.
Defining Conditions
A condition is one or more expressions joined by
And or Or. Each expression tests the value of an
object property. For example:
Audit Status = Found AND
Size (bytes) = 987,136
To define a condition:
1 Click Add.
2 Click in the Property box and select a property.
The Property box lists the properties that can
be used to build a condition.
Use the Audit Status property to test whether
an item was found during the audit.
3 Click in the Test box and select a logical test.
4 Click in the Value box.
50 CHAPTER 6
Customizing Application Protection
The value you enter here is compared against
the value in an audit report.
Click
in the Get column to get the current value
of a property.
To test environment variables like PATH Use
the Contains test operator instead of the =
operator. When Enterprise Diagnostics gets the
current value of the PATH environment variable, it
gets the value for the current process (Diagnostics
Console). So the path to the Enterprise
Diagnostics installation directory is added to the
start of the PATH variable.
Fixing Problems
Fix it for Files Extracts the file from the snapshot
and puts it in the required location.
Fix it for ActiveX Controls and Self-Registered
Files If the file is not registered, is the wrong
version, or is missing, Enterprise Diagnostics gets
the file from the snapshot and registers it. If the file
is already present on the computer but is just not
registered, Enterprise Diagnostics registers it.
Fix it for Shortcuts If a shortcut is broken,
Enterprise Diagnostics tries to fix it based on the
path specified in the condition. But if the path does
not point to an existing file, Enterprise Diagnostics
scans the system for the first occurrence of a file
with the same name and fixes the shortcut to point
to that file.
Fix it for Registry values If a registry value does
not meet the specified condition, Enterprise
Diagnostics updates the registry entry according to
the criteria specified in the condition. Enterprise
Diagnostics can repair individual registry values
only, not complete hierarchies.
Fix it for Environment Variables Fix it updates
the value of the environment variables to match
the value found when the application was
protected.
Deleting Items
Delete it for Registry Keys Enterprise
Diagnostics can delete a registry key and all of its
descendants.
You do not need to add any condition to operate on
keys. If the key exists, Enterprise Diagnostics
considers that the condition is met. If the key does
not exist, the condition is not met.
Delete it for Registry Values If you want to
delete the registry value regardless of its current
value, do not specify any condition. If the value
exists, Enterprise Diagnostics will delete it.
Displaying Messages
The Display Message action displays the message
specified by the Argument field.
if ( condition )
Display Message
Argument = "Condition met!"
else
Display Message
Argument = "Condition failed!"
In the Problem Diagnosis view, the Fix All button
does not execute DIsplay Message actions. Only
the Fix it button for a specific problem executes a
DIsplay Message action.
Jumping to a URL
The Go to URL action starts the default browser
and loads the URL specified in the Argument field.
51
In the Problem Diagnosis view, the Fix All button
does not execute Go to URL actions. Only the Fix
it button for a specific problem executes the Go to
URL action.
Renaming Files
The Rename it action renames a file.
Unregistering ActiveX Controls
The Unregister it action unregisters an ActiveX
control.
Setting Attribute Values
To edit the attributes of a repair rule:
1 In the profile tree, click Files, Registry, ActiveX
Controls, Environment Variables, or Shortcuts.
2 Click an item (a file, ActiveX control, shortcut,
environment variable, or registry entry).
3 Click Self Repair and click Build Condition.
4 In the Attributes list, click in the Value field to
edit the attribute value.
Auto Execute Action If True, Enterprise
Diagnostics automatically executes the specified
repair action.
Description Text displayed between the problem
title and the details section in the Problem
Diagnosis view.
Enable Self-Repair If True, Enterprise
Diagnostics applies the repair rule. If False, the
rule is disabled. When you protect an application,
this attribute is set to True in the snapshot copy of
the profile.
Locked If True, the conditions are not updated
when you protect the application. By default, all
repair rule conditions are regenerated when you
protect the application.
If you lock a repair rule that has no conditions, the
file is not put in the snapshot.
Problem Priority By default, Enterprise
Diagnostics sorts problems by priority, with the
highest priority problems appearing at the top of
the list. Lower numbers indicate higher priority.
Self-Repair Package Specifies the zip file that
contains the files used to repair the problem.
You could use this attribute to keep a single copy
of a file in a central location. Setting this attribute
forces Enterprise Diagnostics to use the specified
file archive instead of the snapshot.
Repair Scope Specifies whether to repair just the
current registry key or to also repair the keys and
values under the current registry key.
Setting Repair Scope to All Descendants reduces
the size of the profile, because Enterprise
Diagnostics doesn’t have to create and save rules
for all the keys and values. It can use the default
rules, which for keys are:
Audit Status = Found
and for values are:
Audit Status = Found
Value = <value>
Type = <type>
Immediate descendants are the direct children of
the current key.
Descendants can still have their own priorities,
titles, and descriptions.
Target Directory Specifies where to put a file on
the user's machine when the problem is fixed. This
attribute is automatically set when you protect an
application, or when you auto-build a rule.
52 CHAPTER 6
Customizing Application Protection
Target Directory is the value of a variable such as
$(WinDir) or $(AppInstallDir).
Title Text displayed after the Problem: label for a
problem. To type or edit a multi-line title, click
.
53
Chapter 7: Scheduling Jobs
Jobs allow you to schedule application protection,
audits, and repairs at the most convenient times
for you (or for your users). Jobs also allow you to
batch protect, audit, and repair applications. For
example, you can use a job to protect multiple
applications on all computers in a domain.
Enterprise Diagnostics uses the Windows Task
Scheduler to schedule jobs. Task Scheduler starts
each time you start Windows, and runs in the
background. Task Scheduler is part of Windows
98, Me, 2000, and XP. On Windows 95 and NT 4.0
SP3+, Task Scheduler is an Internet Explorer
component that you can install by using the
Add/Remove Programs tool in Control Panel.
4 In the Select Machines box, select the check
boxes for the computers you want to protect.
To protect all computers on all domains of the
network, select the Microsoft Windows Network
check box.
To protect all computers on a given domain,
select the domain check box.
To protect all computers in a PC-Duo Enterprise
group, select the group check box.
5 In the Select Products box, select the check
boxes for the products you want to protect.
Jobs run as the Support Site user.
6 In the Job view toolbar, click
After you save the job, you can either run it
immediately or schedule it:
Defining Jobs
You can define jobs to protect, audit, and repair
applications on any computer with a licensed
version of Diagnostics Agent. Jobs can run on one
or more computers, all the computers in a domain
or in a PC-Duo Enterprise group, or all computers
in the network. For example, you can use a job to
protect an application on every agent-licensed
computer.
To define a job:
1 On the Action menu, click New and then click
Jobs.
2 In the box beside the task icon
, type a
name for the job.
3 In the Command list, click Protect, Audit, or
Repair.
to save the job.
•
To run the job, click
in the Job view toolbar.
•
To schedule the job, click Scheduler (see
“Scheduling Jobs” on page 55).
The Select Machines box lists only the computers
with an agent license. Because agent licenses can
be revoked and assigned to different computers, a
job may not run on all the computers you select
when you define the job. Before the job runs, it
checks for agent licenses, and skips computers
that no longer have an agent license.
If you select all computers in a domain or group,
then the job dynamically finds all computers in the
domain or group with an agent license.
54 CHAPTER 7
Scheduling Jobs
Running Jobs
To see the audit report for a job:
You can run jobs manually without scheduling
them. This is handy for doing batch protects of
applications on many machines when you don’t
want to repeat the protection at regular intervals.
Scheduled tasks can be run manually as well.
To run a job:
• In the Job view toolbar, click
.
1 In the console tree, click a job result.
2 In the Job Status view, click View Audit.
Checking for Notifications
Jobs post notifications to the console when they
finish.
• Repair jobs post notifications if they fix (or fail
to) fix problems.
Checking the Status of
Jobs
To check the status of a job:
1 In the console tree, expand Jobs and then
expand the job definition. The starting date and
time of each job is listed under the job
definition.
Job Results in the Console Tree
• Protect jobs post notifications if they detect
missing items (such as files, shortcuts and
ActiveX controls).
• Audit jobs post notifications if they detect
missing items (such as files, shortcuts and
ActiveX controls) or if they detect other
problems (for example, different file versions).
Notifications let you see at a glance whether your
jobs found or fixed any problems. To check for
notification messages, click Notifications in the
console tree.
Notifications in the console tree
2 Click a job to display the Job Status view.
The Job Status view displays the status of the
commands executed on each machine.
To see more details for a specific command:
For example, you may want to know why a Protect
command failed on a certain computer.
Click the command and then click Details.
To refresh the job status display:
Click Reload.
Clicking Notifications forces the console to check
for new notifications. Otherwise, the console
checks for new notifications once every minute.
To get more information on the problems found by
the job, you can check the job results and then
click View Audit to jump to the audit report.
55
After you review the notifications, you can delete
them from the Notifications view.
To delete a notification:
Click the notification and then click
console toolbar.
in the
Scheduling Jobs
You can schedule a job to run daily, weekly, or
monthly, and change the schedule for a task.
To schedule a job:
1 If the job you want to schedule is not already
open, expand Jobs in the console tree and click
the job you want to schedule.
2 In the Job view, click Scheduler.
To remove the schedule for a job:
1 If the job you want to schedule is not already
open, expand Jobs in the console tree and click
the job you want to schedule.
2 In the Job view, click Remove Schedule.
Unscheduled jobs are represented by
scheduled jobs by
.
, and
A protected computer has its own copy of the
profile, which is stored with the snapshot. If the
console version of the profile is more recent, then
Always use latest profile revision determines
which profile an Audit command uses.
To
Do this
Use the most recent
version of the profile
Select the Always use latest
profile revision check box.
Use the version of the
profile stored with the
snapshot
Click to clear the Always
use latest profile revision
check box.
56 CHAPTER 7
Scheduling Jobs
57
Chapter 8: Requests
Working with Requests
Requests are audit and protect commands sent by
a console to an agent. When an agent finishes a
request, the agent sends back a response (such
as Done Audit or Done Protect).
To see the results of a pending response, you can
manually refresh the console display by clicking
Refresh on the Action menu (or by pressing F5).
For example, refreshing the console displays audit
reports associated with pending Done Audit
responses.
Repair jobs send an audit command.
The Request view displays the requests
responses
for a computer:
and
•
Pending requests are waiting to be picked up
by the agent. You can delete pending requests.
•
In Progress requests are being processed by
the agent. You cannot delete in-progress
requests.
•
Pending responses are waiting to be processed
by the console.
Requests can be sent interactively by a console
user or automatically by a scheduled job. Because
interactive requests are processed independently
in separate threads, they never appear as In
Progress. A job request, however, must finish
before any other requests (or responses) are
processed and is listed as In Progress until it
finishes. While a job request is In Progress, all
other requests and responses are Pending.
For example, when a console receives a Done
Audit response, it adds the audit report to the
console tree and asks if the user wants to view the
audit details. However, if a job request is In
Progress, the Done Audit response is marked
Pending and is not processed until the job request
finishes.
To view the list of requests and responses for a
computer:
1 In the console tree, expand the Entire Network
and locate the computer.
2 Expand the computer and click Requests.
To delete a pending request:
Click the request and then click
toolbar.
in the console
Troubleshooting Pending
Requests
When there are no In Progress requests and one
or more requests are pending, there are a number
of things you can check before you delete the
pending requests:
•
Is the target computer on and connected to the
network?
•
Is the agent running on the target computer?
Does the target computer have an agent
license or was it revoked?
•
Has the server run out of licenses? Try disconnecting all other users from the Support Site
share and try again.
58 CHAPTER 8
Requests
• Is the MQ Message Broker service running? Is
it running with the correct credentials?
• Is TriMon.exe running with the correct credentials? (Use the dcomcnfg.exe utility to check the
Distributed COM Configuration Properties.)
• Is the Support Site still available over the
network? Does the Support Site User have
enough privileges to access the Support Site?
59
Chapter 9: Configuring Enterprise
Diagnostics
Configuring the Support
Site
Editing the Support Site
To edit the Support Site configuration on a
remote computer:
In the system tray of the Windows task bar, rightclick the agent icon and click SupportSite Configuration.
The Support Site configuration consists of a UNC
path and a domain user account. The path is the
location of the Support Site, which is a shared
folder on the network.
Agent icon in the system tray
The user account is used by Enterprise
Diagnostics agents and consoles to perform
operations (such as application protection and
repair) on remote computers.
Moving the Support Site
The Support Site is initially configured during
installation, but you can edit the configuration later.
For example, you may want to move the Support
Site, or use a different Support Site.
When you change the location of the Support Site,
all agents and consoles are automatically notified.
If the notifications fail and the consoles cannot
automatically update their Support Site settings,
they can do it manually through the Options dialog
box.
When you edit the Support Site configuration, the
changes apply to all agents and consoles. Agents
are sent a notification message of the changes,
and consoles pick up the changes the next time
they start up.
You can also move the data in your Support Site to
another Support Site.
If for some reason an agent or console does not
pick up the changes, the changes can be manually
applied.
1 In the console tree, click PC-Duo Enterprise
To edit the Support Site configuration in a
console:
1 In the console tree, click PC-Duo Enterprise
Diagnostics.
2 On the Action menu, click SupportSite
Configuration.
To move Support Site data to another Support
Site:
Diagnostics.
2 On the Action menu, click SupportSIte
Configuration.
3 In the Support Site Path box, enter the UNC
path of the other Support Site.
4 In the dialog box that appears, click the Move
all data from your current Support Site to the
new location check box.
60 CHAPTER 9
Configuring Enterprise Diagnostics
5 If you want consoles installed from the current
Support Site to switch to the other Support Site,
click the Notify all clients of the change in
Support Site location check box.
To switch to a different Support Site:
1 In the Support Site Path box, enter the path to
the Diagnostics Agent may not be able to audit,
protect, or repair certain items such as files and
registry entries.
To verify that the Support Site user has access to
the SupportSite from a computer, log on to
Windows with that user account and try to copy a
file to and from the Support Site shared folder.
the other Support Site.
2 In the dialog that appears, click the Notify all
clients of the change in Support Site location
check box.
When you don’t select the Move all data from your
current Support Site to the new location check box,
you switch to using the other Support Site and its
data.
Do not add any other shares for the Support Site
folder. For example, do not create a second share
so that the Support Site folder is shared both as
//nanp/Support Site and //nanp/Diagnostics.
The Support Site User Account
The Support Site user account is used to:
• Audit, protect, and repair computers.
• Access the Support Site shared folder.
• Run jobs.
Support Site User with No Password
If you want to use an account with no password as
your Support Site user, you may have to change
your security settings.
On Windows XP:
In the Security Settings, go to Local
Policies\Security Options and disable the policy
Accounts: Limit local account use of blank
passwords to console logon only.
On Windows 2000:
In the Security Settings, go to Account
Policies\Password Policy and set the minimum
password length to 0.
On Windows 95, 98, Me, and NT:
In the Users Manager, set the minimum password
length to 0.
• Run the MQ Message Broker service.
On each local computer, the Support Site user
account must have the permissions required to
perform tasks such as auditing and protecting the
computer. The Support Site user should be a
domain Administrator that has local Administrator
rights on each computer. If the Support Site user is
not a member of the local Administrators group,
Setting Options
Enterprise Diagnostics provides options for
logging events and maintaining archives of audits
and snapshots. The option settings are shared by
all consoles, although individual agents and
consoles can override the default settings.
61
From the console, you can:
•
Set the defaults for new agents and consoles.
•
Change the settings used by existing agents
and consoles.
•
Change the agent options for specific
computers, domains, or groups of computers.
Users can also change the settings for the agents
running on their computers. If a user changes the
event logging or maintenance options, these
changes cannot be overwritten by the console.
Updating Selected Clients
From the console, you can set event logging and
maintenance options on an computer-bycomputer, domain-by-domain, or group-by-group
basis. This allows you override the default settings
for specific computers.
To update selected clients:
1 In the console tree, right-click a computer and
then click Agent Options.
2 For domains and groups, select one or more (or
Setting the Defaults
All new installations of agents and consoles use
the same default settings for event logging and the
maintenance of audits and snapshots.
To edit the default settings:
1 On the Action menu, click Options, or click
on the console toolbar.
2 Edit the event logging or maintenance options
and click OK.
Updating All Clients
The Event Logging and Maintenance tabs each
have an Apply new settings to all Clients check
box. By selecting the check box on a tab, you can
apply the changes (on that tab) to existing agents
and consoles.
Agents receive a notification message of the
changes. Consoles pick up the changes at their
next startup.
all) computers.
3 Set the event logging and maintenance options
and click OK.
Preventing Users From Editing Options
By default, users can edit the event logging and
maintenance options by double-clicking the agent
icon in the system tray. You can prevent users
from editing just the event logging options, just the
maintenance options, or both sets of options.
To prevent users from editing the agent
options:
1 In the Event Logging or Maintenance tab, clear
the Agent can edit Event Logging options check
box.
2 To apply this change to existing agents, click
the Apply new settings to all Clients check box.
This overrides any local settings.
3 Click OK.
62 CHAPTER 9
Configuring Enterprise Diagnostics
Logging Events
By default, agents and consoles log events on the
local computer. On Windows NT, 2000, and XP,
events are logged to the Event Log. On Windows
95, 98, and Me, events are logged to a text file.
On Windows NT, 2000, and XP, you can log all
events to the Event Log on a central server.
While audits are much smaller than snapshots,
you still may want to limit the number of audit
reports saved in the Support Site.
However, if you want to keep a baseline audit of a
system to use for change analysis, don’t set a limit
on the number of audits. If you set a limit, your
baseline audit will be deleted once the limit is
reached (to make room for the new audit).
To log all events to the Event Log on a central
server:
To limit the number of audits and snapshots:
1 On the Action menu, click Options, or click
1 On the Action menu, click Options, or click
on the console toolbar.
2 On the Event Logging tab, click the Log events
to a central server check box.
3 Type the computer name of the central server.
By default, settings changes are applied only to
new installations of agents and consoles.
on the console toolbar.
2 Click the Maintenance tab.
3 To limit the number of snapshots, click the Limit
number of snapshots to check box and type a
number in the box.
4 To limit the number of audits, click the Limit
Maintaining Audits and
Snapshots
Limiting Audits and Snapshots
By default, Enterprise Diagnostics saves an
unlimited number of audits and snapshots for each
application. To conserve disk space, or to prevent
clutter, you can limit the number of audits and
snapshots. Enterprise Diagnostics will automatically delete the oldest audits and snapshots when
necessary.
For example, the snapshot for an application such
as Microsoft Outlook is around 35MB. You
probably don’t want to keep an unlimited number
of such snapshots, particularly if you use jobs to
take snapshots at regular intervals.
number of audits to check box and type a
number in the box.
Storing Snapshots on the Support Site
By default, snapshots are stored on the local
computer (the computer where the agent is
running). Each agent can change this so that
snapshots are stored in the Support Site instead.
The Store snapshots in the Support Site option
moves existing snapshots from the local computer
to the Support Site. On the Support Site,
snapshots are stored in a Snapshots folder:
Support Site\Snapshots\<domain>\<app>
By default, audits are stored in the Support Site,
and snapshots are stored on the local computer
(the computer where the agent is running).
63
Snapshots are stored in the Data\Snapshots
subfolder of the Enterprise Diagnostics installation
folder. For example:
C:\Program Files\
PC-Duo Enterprise\Diagnostics\
Data\Snapshots\
<protected-app1>
Revoking Licenses
If someone is on an extended vacation or leave of
absence, you can revoke the license so someone
else can use Enterprise Diagnostics. Typically you
revoke licenses for Enterprise Diagnostics (the
console) or for Enterprise Diagnostics / db.
Revoking an agent license would leave the
Customizing Remote
Control
The Remote Control command in the Action menu
launches PC-Duo Remote Control with the
command-line arguments /VS /E.
The default arguments when launching PC-Duo
Remote Control are /VS /E, which opens the
connection in Share mode and closes the
connection when the window is closed.
You can customize the command line from the by
adding string values under the key:
HKLM\Software\MetaQuest\Triage\4.0
RemoteControlPath specifies the path to the
remote control executable.
RemoteControlArgs specifies the command-line
arguments.
computer unprotected.
To revoke a license for a product:
1 On the Action menu, click Options, or click
on the console toolbar.
2 Click the License Usage tab.
3 Expand the product and click the user’s
computer.
Configuring Notifications
By default, only jobs post notifications. You can
configure when notifications are posted by editing
a section in the SupportSite\TriSite.ini file.
[Notifications]
LogMissingItems=<value>
LogRepairFailed=<value>
LogRepairSuccess=<value>
4 Click Revoke.
LogProblemsFound=<value>
After you revoke a license, the agent or console
To disable a notification, set the value to 0.
will automatically acquire a license the next time it
starts.
Uninstalling an agent or console automatically
revokes the license.
Value
Description
0
Do not log
1
Log notifications for jobs
64 CHAPTER 9
Configuring Enterprise Diagnostics
Value
Description
2
Log notifications for console commands
3
Log notifications for jobs and console commands
Console commands include Audit, Protect, and
fixes applied from the Problem Diagnostics view.