1
UNIVERSITY OF APPLIED SCIENCES
FACULTY OF LANDSCAPING
DEPARTMENT OF GEODESY
STUDY PROGRAMME: REAL ESTATE MEASUREMENT ENGINEERING
653H14004
VINCAS ZAKARAUSKAS
UPDATE MATERIAL FOR THE
STUDY SUBJECT
GEODESY
TO SUPPORT THE PROJECT
“INTERNATIONALITY PROMOTION AND UPDATE OF
ENGINEERING STUDY FIELD PROGRAMMES TO MEET
COURSE DELIVERY NEEDS OF INTERNATIONAL
STUDENTS AT THE FACULTY OF LANDSCAPING OF
KAUNO KOLEGIJA/THE UNIVERSITY OF APPLIED
SCIENCES”
(VP1-2.2-ŠMM-07-K-02-045)
Mastaiciai
2012
Educational Institution:
Study Programme:
Kauno Kolegija/University of Applied Sciences
Real Estate Measurement Engineering
GEODESY
Study Subject Programme
The Annotation: introduction to the efficient application of geodetic methods in various fields of activity,
analysis fundamental geodetic provisions, requirements and principles for selection of modern geodetic devices
and software, for development of topographic plan projects, for processing and evaluation of the data obtained in
a variety of ways and methods; analysis of state and special geodetic networks and their application in a variety
of surveying work.
The Aim of the Programme includes the development of practical skills in ground spatial measurements using
modern geodetic devices, elaboration of digital plans and schemes, checking of the general setting of points, lines
and objects of the locality; development of students’ geodetic thinking, creativity, initiative and ability to make
decisions both individually and in team and assume the responsibility.
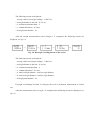
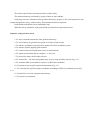
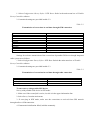
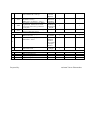
2. The Length in Credits and Hours
Structure
Study
subject
title
Length in
ECTS credits
Lectures,
hours
Practical
works,
hours
Consultations,
hours
5
17
43
8
Geodesy
Individual
work, hours
65
In total,
hours
Assessment
133
Cumulative
3. Prerequisites: engineering graphics, basics of geodesy, topography, practical training for geodetic survey,
mathematics 1, mathematics 2, physics, human safety.
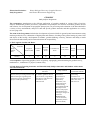
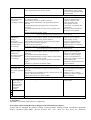
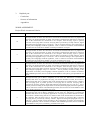
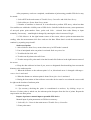
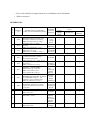
4. Links between Learning Outcomes and Intended Study Subject Outcomes and Student Achievement
Assessment Methods
Learning outcomes
To adapt modern measurement
devices, their processing software and
GIS technologies organizing and
performing special geographical
projects in the optimal way.
Intended study subject
outcomes
1. Technical specifications
for modern geodetic devices
(precise levels, range finder,
GPS devices and electronic
tachometers) were
characterised.
Study methods
Provision of
information
(presentation in
(Power Point
application),
discussions, oneminute reflection,
virtual learning
environment Moodle
(developed in the
course of the project
“Development of elearning in colleges of
Lithuania”
(BPD2004-ESF2.4.0-03.05/0179)
financed by the EU
Structural Fund).
Student achievement
assessment methods
Frontal oral
questioning,
presentation of
individual task in oral
and written form,
mid-term test.
2. The possibilities of
processing and exchange of
geodetic data using geodetic
data processing software
GeoMap were defined.
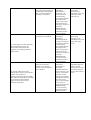
1. Geodetic surveying data of
the locality was collected.
To create large scale data following
the methods approved by the
Government of Lithuania and
regulatory acts applying them for
public needs.
1. Geodetic surveying was
linked to the national
geodetic basis, and the
accuracy of measurements
was evaluated.
To classify stable natural and
anthropogenic objects of the Earth’s
surface for formation of
georeferenced map and cartographic
case data sets and products according
to specifications and methods
approved by the Government
authorized institution.
Provision of
information,
demonstration,
discussions, oneminute reflection,
virtual learning
environment Moodle
(developed in the
course of the project
“Development of elearning in colleges of
Lithuania”
(BPD2004-ESF2.4.0-03.05/0179)
financed by the EU
Structural Fund).
Provision of
information,
discussions,
individual problem
solving, case analysis,
one-minute reflection,
virtual learning
environment Moodle
(developed in the
course of the project
“Development of elearning in colleges of
Lithuania”
(BPD2004-ESF2.4.0-03.05/0179)
financed by the EU
Structural Fund).
Provision of
information,
demonstration,
discussions,
individual and team
problem solving, case
analysis, one-minute
reflection, virtual
learning environment
Moodle (developed in
the course of the
project “Development
of e-learning in
colleges of Lithuania”
(BPD2004-ESF2.4.0-03.05/0179)
financed by the EU
Structural Fund).
Frontal oral
questioning,
presentation of
individual task in oral
and written form,
mid-term test.
Frontal oral
questioning,
presentation of
individual task in oral
and written form,
exam.
Presentation of
individual and team
task in oral and
written form, written
assessment method:
written mid-term test,
exam.
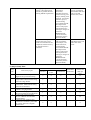
2. Topographic plan of the
locality is developed using
innovative geodetic devices
meeting GKTR requirements.
3. The indexes of equal and
unequal precision survey
results of one dimension are
computed, and the accuracy
of obtained results is
evaluated.
Provision of
information,
discussions,
individual and team
problem solving, case
analysis, dealing with
problems, one-minute
reflection, project,
virtual learning
environment Moodle
(developed in the
course of the project
“Development of elearning in colleges of
Lithuania”
(BPD2004-ESF2.4.0-03.05/0179)
financed by the EU
Structural Fund).
Explanation, selfstudy assignment,
case analysis, oneminute reflection,
virtual learning
environment Moodle
(developed in the
course of the project
“Development of elearning in colleges of
Lithuania”
(BPD2004-ESF2.4.0-03.05/0179)
financed by the EU
Structural Fund).
Presentation of a
project, presentation
of individual and team
task in oral and
written form, exam.
Presentation of
individual task in oral
and written form,
exam.
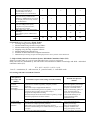
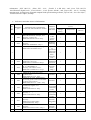
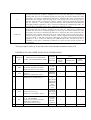
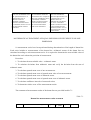
5. Subject Study Plan:
Contact hour number
Seq.
No.
1
2
3
4
5
6
7
Titles of key topics
Structure and control of precise
digital levels, precision leveling
Structure and control of electronic
range finders. Measurements using
electronic range finders.
Structure and control of electronic
tachometers. Measurements using
electronic tachometers.
Topographical planning in GeoMap
software using digital data.
Global Positioning System (GPS).
World Coordinate System WGS 84.
Control and structure of GPS
devices. GPS use for real estate
measurements.
Lithuanian state geodetic basis.
Lithuanian coordinate system LKS
94. Direct and inverse angular
intersections.
Total number
of hours for
study per
topic
13
Lectures
Practical
works
Consultations
Individual
work hours
3
8
2
-
2
2
-
-
2
8
-
-
4
2
6
-
-
10
1
-
2
-
8
2
8
2
-
12
2
6
-
-
8
8
9
10
11
Basic concepts, objectives and tasks
of metrology. Problems of
measurement error theory.
Measurement error classification.
Mathematical processing of equal
precision survey results of one
dimension. Mathematical processing
of unequal precision survey results
of one dimension.
Theoretical preparation for mid-term
tests (according to the topics),
completion of practical works,
preparation for seminar
Individual works “Site topographic
planning”
(Coordinate systems: LKS 94 and
WGS 84)
Total number of hours for subject
studies:
1
-
2
-
3
2
5
-
-
7
-
-
-
27
27
-
-
-
38
38
17
43
8
65
133
6. Practical (and/ or laboratory) Work Topics:
1. Leveling using precision digital levels.
2. Measurements using electronic range finders.
3. Measurements using electronic tachometers.
4. Mapping using GeoMap computer software.
5. Measurements using GPS devices.
6. Solutions on direct and inverse angular intersection.
7. Mathematical processing of equal and unequal precision survey results of one dimension.
7. Subject Study Outcome Assessment System: Individual Cumulative Index (ICI)
(Mid-term exams make up a part of exam/individual paper (project) performed)
Study outcomes are determined by the total index of assessment of student’s knowledge and skills - individual
cumulative index (ICI).
ICI = 0,5 E + 0,15 K + 0,15 P + 0,2 S,
here: E - examination, K – mid-term tests, P – practical works, S – individual works.
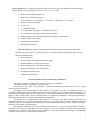
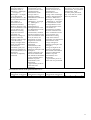
8. Learning Outcome Assessment Criteria:
Grade and brief
description of
knowledge and
abilities
10 (Excellent)
Excellent
performance,
outstanding
knowledge and skills
9 (very good)
Good knowledge
and skills
Detailed description of knowledge and understanding
Detailed description of
abilities
Excellent application of
theoretical geodesy knowledge.
Excellent accomplishment of
complex nonstandard tasks.
Perfect, outstanding quality of
work. Excellent skills of
expression and presentation.
Good understanding of the
content and aim of the
undertaken work.
All the objectives of studies are achieved
Strong, good, comprehensive knowledge and its application
Very good application of
in solution of complex practical problems.
geodesy knowledge.
Individual study of supplemental geodesy material.
Easy accomplishment of
Excellent understanding of the studied material, proper use of complex standard tasks.
concepts.
Very good quality of work.
Original and independent thinking.
Very good skills of expression
Excellent, outstanding, comprehensive knowledge and its
application in solution of geodesy complex practical
problems.
Individual study of supplemental material.
Excellent understanding and use of geodesy concepts, ability
to analyze them in wider context of the subject.
Original and independent thinking.
Excellent analytical and assessment skills in geodesy, insight.
Excellent preparation for further studies.
Very good analytical, evaluation and synthesis skills.
Very good preparation for further studies.
8 (Good)
Above the average
performance,
knowledge and skills
7 (Highly
satisfactory)
Average
performance,
knowledge and skills
with unessential
shortcomings
6 (Satisfactory)
Below average
performance,
knowledge and skills
with substantial
shortcomings
5 (Sufficient)
Knowledge and
skills meet minimum
criteria
4
Insufficient
Knowledge and
skills do not
meet minimum
criteria/below
minimum
criteria
and presentation.
Understanding of the content
and aim of the applied methods
and techniques.
Not less than 90 percent of study objectives are achieved
Above the average knowledge and its application in solution
Good application of knowledge.
of practical problems.
Correct accomplishment of
Acquaintance with the set geodetic material.
medium complexity and
difficult geodesy tasks.
Ability to work individually with supplemental geodesy
material.
Good quality of work.
Understanding and proper application of concepts and
Good skills of expression and
principles.
presentation.
Good argumentation and reasoning of the arguments with
Knowing of the methods and
facts.
techniques to be applied.
Good preparation for further studies.
Not less than 80 percent of study objectives are achieved
Average knowledge with unessential mistakes.
Application of knowledge is
Application of knowledge in solution of practical problems.
based on given examples.
Acquaintance with the main geodetic material.
Good quality of work.
Correct accomplishment of
Understanding and application of concepts and principles.
Integration of several key elements.
medium complexity tasks.
Sufficiently good argument.
Sufficient skills of expression
Sufficient preparation for further studies.
and presentation.
Not less than 70 percent of study objectives are achieved
Below average knowledge, mistakes.
Application of knowledge is
Application of knowledge in solution of simple practical
based on given examples.
problems.
Satisfactory quality of work.
Acquaintance with the main material.
Ability to work by analogy.
Sufficient understanding of concepts, ability to describe the
Correct accomplishment of
simple tasks, failure to perceive
received information in own words.
Analysis focuses on several aspects but fails to interrelate
more complex ones.
them.
Satisfactory skills of expression
Satisfactory preparation for further studies.
and presentation.
Not less than 60 percent of study objectives are achieved
Geodesy knowledge meets minimum requirements.
Minimum satisfactory abilities
to solve problems in accordance
Application of knowledge in solution of simple practical
problems.
with examples.
Simple citation of assimilated concepts, retelling of text. The Ability to work by analogy.
answer is focused on one aspect.
Satisfactory skills of expression
Minimum preparation for further studies.
and presentation.
Not less than half of study objectives are achieved
Geodesy knowledge does not meet minimum requirements.
Abilities do not meet minimum
requirements.
3
2
1
Less than half of study objectives are achieved
9. Attendance.
Attendance of practical work sessions is compulsory.
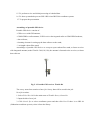
10. Facilities and Learning Resources Required and Their Brief Description:
Lecture halls are equipped for geodesy teaching. Technical means: training polygon. Presentation equipment,
Internet, electronic range finders „Spectra Precizion HD – 50“, „Disto A3“ and „Disto A5“. Electronic
tachometers: „GPT 3005 N“, „Nikon NPL - 632“, „Trimble S 6 DR 300+“ and „Leica TCR 1205 R
100“.Electronic digital levels: „Leica DNA 03“, „Leica Sprinter 200 M“, and „Topcon DL – 102 C“. Leveling
metering-rods, leveling bases. Personal computer with special training software „Topcon link“, Leica Geo Ofise“,
Trimble Geomatics Office, GeoMap.
•
Se
q.
No.
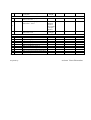
References and other sources of information:
Publishing
year
Information source (publication)
author, title and identification number
Publishin
g location
and house
(a tick-mark shall mean availability of the
source)
Kaunas
Other
College
Study Rooms
libraries
library
Key Information Sources
1
2008
2
2012
2012
ŽIVATKAUSKAS, Aurelijus, et al.
Geodesy: training aid.
ISBN 978-9955-511-87-8. 329 p.
Alexander, Ross, CLARKE.
Geodesy.
ISBN 978-1290098762. 378 p.*
HARRY, L. Landscape Surveying.
ISBN 9781111310608. 256 p.*
3
4
2012
5
2012
Charles, D., GHILANI et al.
Elementary Surveying.
ISBN 978-0-13-255434-3. 984 p.*
E., V., ZOLOTOVA.
R., N., SKOGOREVA.
Geodesy with cadastre basics.
ISBN 978-5-919840-07-7. 413 p.*
Vilnius.
UAB
„Vaistų
žinios“
√
√
HardPress
Publishing
√
√
√
√
√
√
√
√
Technics
√
√
Technics
√
√
√
√
√
√
√
√
Department
of
Agricultural
Engineering,
Oklahoma
State
University,
USA
Westford
United States
of America
Fund “Mir”
(Russian:
Φонд
,,Мир“)
Additional reading
1
1998
2
1995
3
4
1996
1992
5
2011
6
2009
7
2012
SKEIVALAS, Jonas. Electronic
geodetic tools
ISBN 9986-05-713-2. 193 p.
SKEIVALAS Jonas. Mathematical
processing of the results of correlated
geodetic measurements.
ISBN 9986-05-151-7 : 10.00 . 272 p.
TAMUTIS, Zigmas. et al.
Geodesy-2
ISBN 5-420-01331-2. 384 p.
TAMUTIS, Zigmas, et al.
Geodesy-1
ISBN 5-420-01331-2. 292 p.
М. I. KISILIOV, D. S. MIHELIOV.
Geodesy.
ISBN: 978-5-7695-8390-2
(9785769583902). 384 p.*
I. F.,KUSHTIN, V. I. KUSHTIN
Geodesy .
ISBN: 978-5-222-15779-4. 912 p.*
TORGE, WOLFGANG; MÜLLER,
Science and
Encyclopaed
ia Publishing
Centre
Science and
Encyclopaed
ia Publishing
Centre
“Akademija”
(Russian:
,,Академия“
)
“Fenix”
(Russian:
,,Феникс“)
University of
8
2003
9
2012
10
2000
11
2000
12
2013
JÜRGEN. Geodesy.
ISBN 978-3-11-020718-7. 539 p.*
ERIK W. GRAFAREND,
FRIEDRICH W. KRUMM, VOLKER
S. SCHWARZE. Geodesy – The
Challenge of the 3rd Millennium.
ISBN-10: 3642077331. 487 p.*
Edited by G. G. POKLAD. Geodesy
practicum: textbook for HEIs. 2nd
edition.
ISBN 978-5-98426-115-9. 470 p.*
Technical regulations of geodesy and
cartography. GKTR 2.08.01:2000:
constructional geodetic engineering
investigations
Technical regulations of geodesy and
cartography. GKTR 2.11.02:2000:
conventional signs for topographic
maps of scale M 1:500, 1:1000, 1:2000
and 1:5000
AutoCad (Autodesk Product Design
Suite for Education 2013)*
Hannover,
Germany.
Springer –
Verlag
Berlin
Heidelberg
√
√
√
√
Technics
√
√
Vilnius
Gediminas
Technical
University,
Institute of
Geodesy
College of
Kaunas
√
√
√
√
“Gaudeamus
”
National
Service of
Geodesy and
Cartography
National
Service of
Geodesy and
Cartography
Periodicals
Geodesy and cartography.
ISSN 1392-1541
Geodesy and cartography.
ISSN 2029 – 6991*
1
2
Measurement engineering and GIS.
ISSN 2029-5790
Online Information Sources
1
http://www.nzt
2
http://www.topcon.lt
3
http://www.gpspartneris.lt
4
http://www.infoera.lt
5
http://www.geoportalas.lt
6
http://www.gps.lt
7
http://www.glonas-center.ru
8
http://www.unavco.org
9
http://www.navstar.com
10
http://www.esa.int/esaNA/galileo.html
11
http://www.gsb.lt
3
*
references for international students
Subject Programme has been prepared by:
assistant Vincas Zakarauskas
Teacher, coordinating the Subject:
lecturer Aurelijus Živatkauskas
UNIVERSITY OF APPLIED SCIENCES
FACULTY OF LANDSCAPING
FACULTY OF LANDSCAPING
DEPARTMENT OF GEODESY
STUDY PROGRAMME: REAL ESTATE MEASUREMENT ENGINEERING
(code) 653H14004
VINCAS ZAKARAUSKAS
PROJECT WORK PROCEDURE
FOR THE SUBJECT
GEODESY
Mastaiciai
2012
The Aim and Objectives of the Work: to create site topographic plan, to perform geodetic
surveying using GPS device.
The Main Objectives of the Project Work:
1. To define boundaries of the site.
2. To collect initial geodetic data.
3. To define geodetic network and site plan base points.
4. To select GPS device.
5. To provide detailed technical data for GPS device.
6. To carry out GPS surveying.
7. To process GPS surveying data.
8. To assess surveying precision.
9. To create a site plan.
10. To create a file.
11. To present a report.
The Length of the Project Work in Hours: 38
Expected Outcomes: To collect the data on site geodetic surveying, to link geodetic surveying to the
national geodetic base and evaluate surveying precision, create a site topographic plan using innovative geodetic
instruments that meet GKTR requirements.
RECOMMENDED TOPICS (TASKS)
1. Preparatory works.
2. Site examination.
3. Geodetic surveying.
4. Data processing.
5. Site topographic plan.
6. File creation.
7. Report presentation.
STRUCTURE OF THE WORK
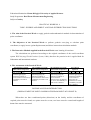
I INTRODUCTION
Introduction must include description of work object, relevance of the analysed topic, the object,
aim and objectives of the work. The style must be clear and explicit. Each statement must be justified
using simple sentences. Use the following form of sentences: “Object of the work– ...”, “Aim of the work–
...”, “... is analysed in the paper” etc.. Paper structure is briefly described, and relevance is factually
discussed.
It is recommended to write the aim of the work separately in bold italic.
The objectives must be numbered and arranged in separate paragraphs.
The following questions must be answered in the introduction:
What is the object of the work?
What goals must be achieved in the work?
Why to achieve them?
How will be the goals sought?
The list of basic terms and abbreviations with explanations is provided next to the introduction
on a separate page (expressions (key concepts), applied terms (concepts), summaries are clearly and
briefly described).
II WORK PROCEDURE
Student must analyse study and technical literature and other information sources (textbooks,
monographs, scientific publications, standards and normative documents, information from web sites etc.)
in detail during the preparation of the project paper.
In the work preparation procedure the student considers work specificity and envisaged outcomes.
It is required to follow the requirements of geodesy and cartography regulations of the Republic of
Lithuanian during implementation of processes of the site topographic map .
Geodetic surveying is carried out using GPS device.
Site topographic map M 1 : 500 is created by GeoMap software.
III MATERIAL ANALYSIS
The analysis chapter must include students’ explanations on the procedure of data collection,
analysis and obtained outcomes. Each visual form must explained.
More attention is paid to the description of data collection procedure and justification of the
precision of obtained data.
IV CONCLUSION
The most important conclusions are formed in this chapter. The material is provided in laconic
manner in the form of theses with minimum figures (do not use tables or diagrams - they must be provided
in description or appendices). Conclusions need to be numbered and arranged in paragraphs. The author
must sign under the conclusions.
V SOURCES OF INFORMATION
Description of used sources and literature bibliographies is provided herein. This chapter
comprises description of used sources and literature compiled in accordance with the standards for
document bibliography. Only directly quoted data sources or conception paraphrase (quoting) as well as
the sources containing information (numbers, models, figures etc.) must be mentioned.
Preparation work, bibliographic references and their list is drawn up according to the Lithuanian
standards LST ISO 690 and LST ISO 690-2. Some recommendations are provided in the methodological
guidelines. References are given after conclusions in separate chapter titled SOURCES OF
INFORMATION (not numbered).
Each source of information referenced in the text must be listed in the source list. You can not
specify any references not mentioned in the text.
List the information sources in alphabetical order using the author's last name. Composite works
without indicated authors on the title-page/cover (usually published by organisations or group of authors)
are listed according to the initial letter of the heading. Several works of the same author are listed
according to the publication year in chronological order starting with the earliest publication (e.g.: 1995,
1999, 2001 etc.)
Information sources in Lithuanian and other Latin alphabet based languages (English, German
etc.) are listed in common alphabetic order. Slavic alphabet sources are listed separately following Latin.
Foreign language sources must be written in original. All information sources must be numbered.
Description of used information sources includes: surnames and initials of author or authors, title
of publication, place of publication, publishing house, publishing year. General number of pages may be
indicated as an option. Note that the international standard book number (ISBN, ISSN) must be indicated
at the end. This number allows to easily find publications over the Internet.
Cited book page is not indicated in the list of information source. However the cited page of article
thesis work must be indicated.
Example of the list of sources is provided hereinafter.
Books: (Publication title is written in italics)
• book with one author:
ALEKNAVIČIUS, Pranas. Žemės teisė: vadovėlis. Kaunas: UAB „Judex“, 2007. 296 p. ISBN978-9955448-92-1.
• book with two authors:
JANKAUSKIENĖ, Erika; ir NENORTAITĖ, Birutė Emilija. Inžinerinė grafika: inžinerinės
grafikos mokymo priemonė. Kaunas: Kauno kolegijos leidybos centras, 2009. 138 p. ISBN 9789955-27-155-0.
• book with three authors:
REKUS, Donatas; URBANAVIČIUS, Valdas ir PAKROSNIENĖ, Irina. Georeferencinės duomenų bazės:
mokymo(si) priemonė. Vilnius: UAB „Vaistų žinios“ 2008. 72 p.
• book with four and more authors:
ŽIVATKAUSKAS, Aurelijus, et al. Geodezija: mokymo(si) priemonė. Vilnius: UAB „Vaistų žinios“
2008. 329 p.
• book with one editor:
Lietuvių kalbos žinynas. Sudarė Petras Kniūkšta. Kaunas, 2002.
• book with no author:
Respublikinė mokslinė – praktinė konferencija „Matavimų inžinerija ir GIS“ Straipsnių rinkinys 2010/1.
Kaunas: Kauno viešoji biblioteka, 2010.
• magazines, newspapers and other continuous publications
Tarp knygų: Vilniaus Gedimino technikos universitetas, Geodezijos instituto bibliotekos žurnalas. 2004.
Nr.1 (101). Vilnius. 2000, p. 94-106.
Articles:
• article with one author from a book or multi-volume publications:
SIKORSKYTĖ, Aušra. Triukšmo žemėlapio sudarymo ypatumai MapNoise programine įranga.
In Respublikinė mokslinė – praktinė konferencija „Matavimų inžinerija ir GIS“ Straipsnių
rinkinys 2010/1. Mastaičiai: Kauno kolegijos leidybos centras, 2010, p.14-18. ISSN 2029-5790
• article with two authors from a book or multi-volume publications:
MOZGERIS, Gintautas; ir MASAITIS Gediminas. Lietuvos miškų aerofotografavimas: iššūkiai bei
perspektyvos. In Respublikinė mokslinė – praktinė konferencija „Matavimų inžinerija ir GIS“ Straipsnių
rinkinys 2010/1. Mastaičiai: Kauno kolegijos leidybos centras, 2010, p.14-18. ISSN 2029-5790
• article from magazines, newspapers and other continuous pablications:
BAGDONAS, Algis; ir SURVILA, Romualdas. Kuriama darni žemėtvarkos sistema. Žemėtvarka ir
hidrotechnika [magazine]. Vilnius: AB „Spauda“ 2010, p.13-19. ISSN 1648-3014.
WRIGLEY, E.A. Parish registers and the historian. In STEEL, D.J. National index of parish registers.
London, 1968, vol. 1, p. 155-167.
• article from a book:
SKEIVALAS, Jonas. Elektromagnetinių virpesių sklidimo greitis. In Elektroniniai geodeziniai prietaisai.
Vilnius, 2004, p. 19-20.
WRIGLEY, E.A. Parish registers and the historian. In STEEL, D.J. National index of parish registers.
London, 1968, vol. 1, p. 155-167.
Electronic documents:
• electronic books, data bases, computer software:
URBANAVIČIUS, Valdas; GIRKUS, Romualdas; SKAČKAUSKAS, Milanas. Kaunas topografiniuose
žemėlapiuose XIXa-XXa. I p. [CD-ROM]. Mastaičiai: Kauno kolegijos leidybos centras, 2010. ISBN 9789955-27-189-5.
Lietuvos Respublikos Civilinio kodekso patvirtinimo, įsigaliojimo ir įgyvendinimo įstatymas
[interactive]. 2000 m. liepos 18 d. Nr. VIII-1864 ,Vilnius [visited on 16 March, 2010].
Internet access:
http://www3.lrs.lt/pls/inter3/dokpaieska.showdoc_l?p_id=390714&p_query=statybos&p_tr2=2
CARROL, Lewis. Alice’s Advantures in Wonderland [interactive]. Texinfo ed. 2.1. [Dortmund, Germany
]:
WindSpiel,
November
1994
2001
[visited
on
10
February,
1995].
Internet
access:
<http://www.germany.eu.net/books/carrrol/alice.html>.
• articles from electronic books, databases, computer software:
Bibliografinė Europos Sąjungos oficialiųjų dokumentų bazė [interactive]. Vilnius: Lietuvos nacionalinė
Martyno Mažvydo biblioteka. Informacijos centras [visited on 16 March, 2010].
Internet access: ,<http: //www.lrs.lt: 10000/esaa/plsgl/esaa web.login>.
MCCONNELL, W.H. Constitutional History, In The Canadian Encyclopedia [CD-ROM].
Mcintosh’o versija 1.1. Toronto: McClelland&Stewart, c. 1993. ISBN 0-7710-1932-7
• electronic serial publications (newspapers, magazines and other continuous publications):
Informacijos mokslai [interactive]. Vilnius: Vilniaus universiteto leidykla, 1994- [visited on 9 November,
2001]. Internet access: http://www.leidykla.vu.lt/inetleid/inf-mok/infmok.html>
• articles from electronic publications (newspapers, magazines and other continuous publications):
GUDONIENĖ, Vilija. Politinė visuomenė ir informacija. In Informacijos mokslai
[interactive]. 1998, [nr.] 9 [visited on 9 November, 2001], ekr.3. Internet access:
<http://www.leidykla.vu.lt/inetleid/inf-m-9/index.htmll>.
STONE, Nan. The Globalization of Europe. In Harward Business Rewiew [interactive]. MayJune 1989 [visited on 3 September, 1990], ekr. 1-2. Access through: BRS Information Technologies,
McLean (Va.).
WORK PROCEDURE:
1. Groups of 3-4 students are made.
2. Geodesy teacher specifies site borders on the locality.
Students of the group:
3. Collect initial geodetic data.
4. Examine the site.
5. Determine topographic map base points and mark them.
6. Select and check the GPS device.
7. Prepare GPS device for surveying.
8. Create locality sketch.
9. Determine site location using GPS device.
10. Transfer numerical data of measurement to computer.
11. Print GPS surveying report.
12. Evaluate surveyed data precision.
13. Process surveying data using GeoMap software.
14. Following Geodesy and cartography technical regulations create digital and analogical map M
1 : 500.
15. Create file.
16. Present report.
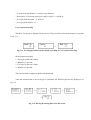
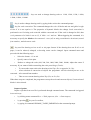
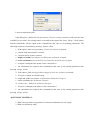
PAPER FORMATTING (FONT, FORMAT, STRUCTURE ETC.)
The text should be typed on one side of the paper 17 x 26 cm leaving margins: left – 30 mm, right
– 10 mm, top – 20 mm, bottom – 20 mm, in 12 pt size Times New Roman font (Normal option) and 1,5
line spacing.
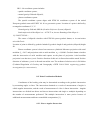
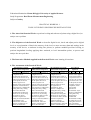
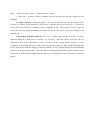
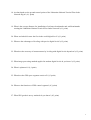
Each chapter should be started on new page. Sections may be written on the same page dividing
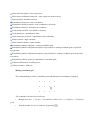
them from the text by double line spacing according to fig. 1.
1. GEODETIC DEVICES (Level A)
1.1. Electronic devices (Level B)
1.1.1. Calibration of electronic devices (Level C)
Fig. 1. Style of headings of chapters
Center the text on full width of page. Space the paragraph from the left edge of the paper to 12-15
mm. The text is not divided into columns.
The paper must be neatly bound.
All pages (including title page, task, tables, illustrations, appendices drawn on separate pages)
should be numbered. Title page is considered the first page of the paper, but the number is not inserted.
All noticed mistakes must be thoroughly corrected; white corrector may be used for the purpose.
One page may contain at most five insignificant character corrections. Number the pages at right bottom
of the page, 10 pt. font size. Use Headers and Footers if needed (optional) as well as Footnotes. Separate
all of them from the document body by continuous slash with 1- 1.5 point spacing (to visually separate
from the text). In addition, they must be written in 10 pt font size or otherwise highlighted. If Headers and
Footers are used, their content must be meaningful.
Limit the number of various highlighted places and emphasis not to tire reader’s eyes.
It is recommended to use 12 pt Italics for main characters of mathematical expressions and 9 pt – for
indexes. Matrices should be written in square brackets, vectors - 12 pt Bold. Formulas should numbered
by Arabic numbers in circular brackets. They must be centred, and their numbers indicated on the right
side of the page.
Every new symbol of the formula has to be explained. Comma should be added after the formula,
and explanation starts from the word “here” written in small letters on a new line, without indentation. Do
not place a colon after the word. Each meaning of the symbol should be explained from new line (after a
hyphen) in the order the formulas are provided in the text. Place a semicolon after each symbol
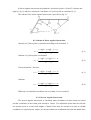
explanation and a dot – after the last explanation. For example, average deviation is calculated according
to the formula:
S=
here:
X max − X min
,
K
(4.1)
Xmax – maximum value;
Xmin – minimum value;
K – factor corresponding to amplitude value.
It is required to place reference to the cited literature source in the text prior to the formula.
Figures and tables should be placed next to their description in the text.
Write captions in small letters, 10 pt Bold font (e.g.: fig. 2.1. Population change). Centre the figures
and their captions. Perform numbering of all figures according to chapter numbering (numbering of
section is not relevant) e.g.: chapter 2 is a theoretical part, if it comprises figures, then the numbering is:
fig. 2.1. , fig. 2.2. etc..
Large-size tables and figures should be placed in the top or bottom of the page, centred. It is
recommended to check the figures printed – they must be pure and clear.
Write captions for a table above the table in small letters, font size 10 pt Bold, in the centre of the
page, e.g.: Coding of geoobjects. Number of table should be placed one line above, font size 10 pt Italic,
aligning along the right margin.
The table in the body text must occupy at most 2 pages. If the table is longer, it must be placed in
appendices providing only main results of the table in the text (contracted table can be made) and
reference to the appendix.
It is recommended to fill in the table using 10 pt font size and single spacing and the font different
from the body text. Numbers in columns must be aligned to decimal tabs (according to the Lithuanian
standard a coma (“, “) not a dot (“.“). Write “x table continuation”, where x is a table number on each
page occupied by the table. “End of table” instead of “continuation” must be written on the last page.
Repeat table column title or at least the number of columns on each table page.
Introduction, conclusion, list of references, main concepts, list of abbreviations with explanations,
list of tables, figures and appendices should not be numbered. Chapters, sections, figures, tables, formulas
and appendices should be numbered: chapters with one number, sections – with two or more, others –
custom. It is recommended to align along the left margin. Indentations are allowed. Headings, tables,
figures and formulas should be divided from the document body by single line spacing. Headings of
chapters and sections should be centred.
Figures, tables, formulas etc. must not be placed at the end of chapter or section. Chapter or
section must end with summarizing sentence about the essence and main results of the chapter.
Internal appendices even though they represent equipment handouts or their copies must have a
number and title. If the appendix consists of several pages, indicate its continuation or end.
When several authors, composite authors or publications must be indicated in the text, authors’
surnames and titles of publications may be indicated and source sequence number in brackets, e.g.:
Expansion of agriculture reorganization is envisaged in the documents [20, 21] of the Government.
Realization opportunities and methods of the reorganization are analysed by J.Čaplikas [3], A.Šimėnas [4]
and other authors [10,11,12].
The references provided in the text should be numbered in Arabic numbers in square brackets
(source number only is specified, chapters and pages are not specified). The list of references with heading
“References” (font of the chapter heading) is provided next to the conclusion (before internal appendices).
The reference sources should be in original languages in accordance with the Lithuanian standards. Refer
to the list of entries arranged in the order they are mentioned in the text. The sequence of references
complies with their sequence in the text. The list should not contain any source which is not referenced in
the text.
Topographic map is provided on A3 format pages with margins 25x5x5x5 mm.
Drawings are made using computer software. A table with main information must be placed in the
right bottom corner of the drawing. Map scaling should be M 1:500.
Standard conventional symbols should be used for the map. Other symbols are allowed in case
there are no appropriate symbols in the standard or decision to use them is not taken. Standard symbol are
described in the geodesy and cartography technical regulation applicable in Lithuania: GKTR
2.02.02.:1999; GKTR 2.11.02.:2000. In case of non-standard symbols, provide their descriptions.
Structure of the project work:
-
Title page
-
Table of contents
-
Introduction
-
List of main terms and abbreviations with explanations
-
List of tables, figures and appendices
1.
Work procedure
2.
Material analysis
3.
Graphical part
-
Conclusion
-
Sources of information
-
Appendices
WORK ASSESSMENT:
Project Work Assessment Criteria:
Grade
10
9
8
7
6
Detailed description of criteria
All the initial geodetic data required for the project is collected, topographic map base points are
envisaged and set out at the site, GPS device is selected and checked, GPS device is prepared for
surveying, site location sketches are made, site location is defined using GPS device, numerical
data of the measurement are transferred to the computer, GPS surveying report is printed,
precision of surveying data is assessed, surveying data is processed by GeoMap software, digital
and analogical topographic map at a scale M 1 : 500 is created according to the requirements of
Geodesy and cartography technical regulations, a file is created in accordance with established
procedure, the text in the file is readable, excellent presentation of a report.
All the initial geodetic data required for the project are collected, topographic map base points are
envisaged and set out at the site, GPS device is selected and checked, GPS device is prepared for
surveying, site location sketches are made, site location is defined using GPS device, numerical
data of the measurement are transferred to the computer, GPS surveying report is printed,
precision of surveying data is assessed, surveying data is processed by GeoMap software, digital
and analogical topographic map at a scale M 1 : 500 is created according to the requirements of
Geodesy and cartography technical regulations, a file is created in accordance with established
procedure, the text in the file is readable, very good presentation of a report.
All the initial geodetic data required for the project are collected, topographic map base points are
envisaged and set out at the site, GPS device is selected and checked, GPS device is prepared for
surveying, site location sketches are made, site location is defined using GPS device, numerical
data of the measurement are transferred to the computer, GPS surveying report is printed,
precision of surveying data is assessed, surveying data is processed by GeoMap software, digital
and analogical topographic map at a scale M 1 : 500 is partially created according to the
requirements of Geodesy and cartography technical regulations, a file is created in accordance
with established procedure, the text in the file is unreadable in some places, good presentation of a
report.
All the initial geodetic data required for the project are collected, topographic map base points are
envisaged and only part of them is adequately set out at the site, GPS device is selected and
checked, GPS device is prepared for surveying, site location sketches are made, site location is
defined using GPS device, numerical data of the measurement are transferred to the computer,
GPS surveying report is printed, precision of surveying data is assessed, surveying data is
processed by GeoMap software, digital and analogical topographic map at a scale M 1 : 500 is
partially created according to the requirements of Geodesy and cartography technical regulations,
a file is created in accordance with established procedure, the text in the file is unreadable in some
places, highly satisfactory presentation of a report.
All the initial geodetic data required for the project are collected, topographic map base points are
envisaged and only part of them is adequately set out at the site, GPS device is selected and
checked, GPS device is not completely prepared for surveying, site location sketches are made,
site location is defined using GPS device, numerical data of the measurement are transferred to
the computer, GPS surveying report is not printed, precision of surveying data is assessed,
surveying data is processed by GeoMap software, digital and analogical topographic map at a
scale M 1 : 500 is partially created according to the requirements of Geodesy and cartography
technical regulations, a file is created in accordance with established procedure, the text in the file
is unreadable in some places, satisfactory presentation of a report.
5
4 and lower
All the initial geodetic data required for the project are collected, topographic map base points are
envisaged and only part of them is adequately set out at the site, GPS device is selected and
checked, GPS device is not completely prepared for surveying, site location sketches are made
inaccurately, site location is defined using GPS device, numerical data of the measurement are
transferred to the computer, GPS surveying report is not printed, precision of surveying data is
assessed, surveying data is processed by GeoMap software, digital and analogical topographic
map at a scale M 1 : 500 is partially created according to the requirements of Geodesy and
cartography technical regulations, a file is created not following the established procedure, the
text in the file is unreadable in some places, sufficient presentation of a report.
All the initial geodetic data required for the project are collected, topographic map base points are
envisaged and only part of them is adequately set out at the site, GPS device is selected and
checked, GPS device is not completely prepared for surveying, site location sketches are made
inaccurately, site location is defined using GPS device, numerical data of the measurement are
transferred to the computer, GPS surveying report is not printed, precision of surveying data is
assessed, surveying data is processed by GeoMap software, digital and analogical topographic
map at a scale M 1 : 500 does not meet the requirements of Geodesy and cartography technical
regulations, a file is created not following the established procedure, the text in the file is
unreadable in some places, insufficient presentation of a report, the most relevant processes are
not explained.
The project paper makes up 20 percents of the total individual cumulative index (ICI).
REFERENCES AND OTHER SOURCES OF INFORMATION:
Se
q.
No.
Publishing
year
Information source (publication)
author, title and identification number
Publishin
g location
and house
(a tick-mark shall mean availability of the
source)
Kaunas
Other
College
Study Rooms
libraries
library
Key Information Sources
1
2008
2
2012
2012
ŽIVATKAUSKAS, Aurelijus, et al.
Geodezija: mokymo(si) priemonė.
ISBN 978-9955-511-87-8. 329 p.
Alexander, Ross, CLARKE.
Geodesy.
ISBN 978-1290098762. 378 p.*
HARRY, L. Landscape Surveying.
ISBN 9781111310608. 256 p.*
3
Charles, D., GHILANI et al.
4
2012
Elementary Surveying .
ISBN 978-0-13-255434-3. 984 p.*
5
2011
6
2011
Vilnius.
UAB
„Vaistų
žinios“
√
√
HardPress
Publishing
√
√
Department
of
Agricultural
Engineering,
Oklahoma
State
University,
USA
√
√
Westford
United States
of America
√
√
√
√
Е., В., ЗОЛОТОВА;
АкадемиР., Н., СКОГОРЕВА.
ческий
Геодезия с основами кадастра.
Проект,
ISBN 978-5-904954-04-8,
Трикста
978-5-8291-1246-2. 416 p.*
NENORTAITĖ, Birutė Emilija; ir Mastaičiai:
URBANAVIČIENĖ, Ilona. Metodiniai
Kauno
nurodymai baigiamajam darbui rengti.
kolegija
38 p.
Geodezijos
katedra
Additional Reading
1
1998
2
1996
3
1992
SKEIVALAS, Jonas. Elektroniniai
geodeziniai prietaisai
ISBN 9986-05-713-2. 193 p.
TAMUTIS, Zigmas. ir kiti.
Geodezija-2
ISBN 5-420-01331-2. 384 p.
TAMUTIS, Zigmas, et al.
Geodezija-1
ISBN 5-420-01331-2. 292 p.
√
√
√
√
√
√
√
√
√
√
√
√
Technika
√
√
Vilniaus
Gedimino
technikos
universitetas,
geodezijos
institutas
Kauno
kolegija
√
√
√
√
Technika
Mokslo ir
enciklopedijų leidykla,
Mokslo ir
enciklopedijų leidykla
Из
датель-
4
2011
АЛЬБЕРТ, ГАМЗАТОВИЧ,
ЮНУСОВ, и др. Геодезия.
ISBN: 978-5-8291-1326-1,
978-5-98426-108-1. 409 p.*
ство
"Академи
-ческий
Проект"
5
2012
6
2000
7
2000
8
2013
TORGE, WOLFGANG; MÜLLER,
JÜRGEN. Geodesy.
ISBN 978-3-11-020718-7. 539 p.*
Geodezijos ir kartografijos techninis
reglamentas. GKTR 2.08.01:2000:
statybiniai inžineriniai geodeziniai
tyrinėjimai
Geodezijos ir kartografijos techninis
reglamentas. GKTR 2.11.02:2000:
sutartiniai topografinių planų M
1:500, 1:1000, 1:2000 ir 1:5000
ženklai
AutoCad (Autodesk Product Design
University of
Hannover,
Germany.
Valstybinė
geodezijos ir
kartografijos
tarnyba
Valstybinė
geodezijos ir
kartografijos
tarnyba
Suite for Education 2013)*
Periodicals
1
Geodezija ir kartografija.
ISSN 1392-1541
Geodesy and cartography.
ISSN 2029 – 6991*
2
Matavimų inžinerija ir GIS.
ISSN 2029-5790
Online Information Sources
1
http://www.nzt
2
http://www.topcon.lt
3
http://www.gpspartneris.lt
4
http://www.infoera.lt
5
http://www.geoportalas.lt
6
http://www.gps.lt
7
http://www.glonas-center.ru
3
8
9
10
11
http://www.unavco.org
http://www.navstar.com
http://www.esa.int/esaNA/galileo.html
http://www.gsb.lt
*-references for international students
Prepared by
assistant Vincas Zakarauskas
Appendix 1
UNIVERSITY OF APPLIED SCIENCES
FACULTY OF LANDSCAPING
DEPARTMENT OF GEODESY (12 pt, bold, Times New Roman )
NAME SURNAME (14 pt. Times New Roman )
PROJECT WORK TITLE
(18 pt bold, Times New Roman)
Project work
(12 pt, bold, Times New Roman)
Teacher
Name Surname
(12 pt, bold, Times New Roman)
Mastaiciai,
2012
(12 pt, Times New Roman)
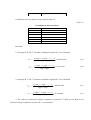
Appendix 2
Table of contents
Introduction
…………………………………………………………………………………………...
List of main terms and abbreviations with explanations……………………………………….
List of tables, figures and appendices.............................................................................................
1. .................................................................................................................................................
2. .........................…...................…………………………………...............................................
2.1. …………………………………………………………………………………………….
2.1.1. …………………………….…………………………………………………………
Conclusion........................…………………………………………………………………………..
Sources of information …………………………………………………….…............................
Appendices…………………………………………………………………………………………...
Examples
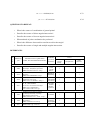
Appendix 3
List of tables, figures and appendices
List of tables
Table
No.
2.1.
2.8.
3.1.
Title
Geodetic coordinates GRS 80
Geodetic survey data
Evaluation of data precision
pg.
5
7
9
List of figures
Figure
No.
2.1.
2.4 .
3.1.
Title
Geodetic survey
Downloaded survey data
Locality topographic map fragments
pg.
4
6
8
List of appendices
Appendix
No.
Appendix 1
Appendix 2
Appendix 3
Title
pg.
GPS survey report
Satellites in orbits and their footprints
Natural landscape components
11
12
13
Educational Institution:
Kauno Kolegija/University of Applied Sciences
Study Programme:
Real Estate Measurement Engineering
Subject:
Geodesy
TOPIC: GLOBAL POSITIONING SYSTEM (GPS),
WORLD GEODETIC SYSTEM WGS 84.
1. The Structure of the Topic: the analysis of topics “Global positioning system (GPS)” and
“World Geodetic System WGS 84“ covers analysis of GPS systems, GPS satellites, environmental
effects on GPS surveying, GPS point positioning methods and World Geodetic System WGS 84.
2. The Length in Hours: 1 academic hour is envisaged for topic explanation.
3. The Innovative Methods Applied During Lectures for Topic Explanation: Presentation of
information, discussions, case analysis, one-minute reflection, use of literature and material in virtual
media (Moodle).
6. GLOBAL POSITIONING SYSTEM (GPS)
Global Positioning System (GPS) is a complex of special man-made Earth satellites and
instruments for determination of spatial geodetic coordinates applying radio navigation method. There
are navigational GPS instruments used for vehicles – aircrafts, space vehicles, ships, cars, and geodetic
GPS instruments - used for specific constructions and kinematic measurements [1, 3].
There are two operational GPS systems in the world: american NAVSTAR and russian GLONASS
navigation systems. NAVSTAR system was launched in 1983, GLONASS – in 1996.In 2011 two
satellites of european navigation systems „Galileo“were launched and placed into circular orbit at 23
000 km. „Galileo“ will be installed within the decade, and the first navigation signal will be transmitted
to users in 2015, when sufficient number of satellites will be reached. By the year 2020 the
constellation would consist of 27 active satellites and 3 spare satellites in orbit. Compared to U.S. GPS
system satellites, „Galileo“ is equipped with more precise atomic clocks – the most important
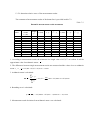
component of the system [1]. The main NAVSTAR and GLONASS station parameters are provided in
table 1.1..
Table 1.1.
The main components of NAVSTAR and GLONASS GPS systems
Indicators
Orbital altitude
Orbit inclination to equatorial plane
Orbital period
Number of Earth satellites
Time scale
Coordinate system
GLONASS
NAVSTAR
19 100 km
20 200 km
64,8°
55°
11 h 15 min 44 s
11 h 57 min 58,3 s
24
24
UTC (Moscow)
GPS time
PZ 90
WGS 84
Both GPS systems were invented for navigation. The systems are used to determine the location
of objects on the earths surface and in the space around as well as motion vectors of the objects. These
systems are also adapted for geodetic tasks: determination of point geocentric coordinates, Earth’s
gravity field parameters, geodetic constants and etc. NAVSTAR and GLONASS systems also deal with
tasks related to geoid determination, Earth’s pole movement, Earth’s tides, geodynamics. Highprecision geodetic networks are created with the help of these systems [1, 3].
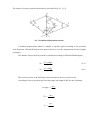
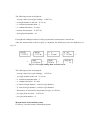
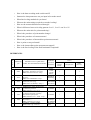
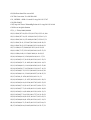
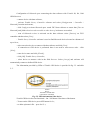
GPS consists of segments: space, control and user segments. The space segment consists of 6
orbiting satellites placed so that not less than four satellites would elevate 10° higher above the horizon
from any Earth’s surface point and at any time of the day.
The precision of the point coordinates determined applying GPS method depends on the precision
of clocks, satellite orbital parameters, signal parameter measurement accuracy, and satellite - user
interlocation. Point geocentric coordinates X, Y, Z are determined according to absolute method with an
error of several meters. Point coordinate changes in relation to another point location according to
differential method are determined with an errors of several centimeters [1, 3].
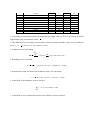
6.1. GPS Satellites
Electronic technologies have opened the possibilities to create innovative Earth surveying
methods: fast and accurate measurements. However, these methods are still limited by the density of
control points, terrain ireguliarities and features. These restrictions are to be voided using man-made
Earth satellites.
Nowadays the most advanced radio navigation system is the system operated by the U.S.
Department of Defence (DOD). It is called the Global Positioning System - GPS (NAVSTAR Global
Positioning System). GPS has been used since 1994 [1, 3].
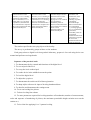
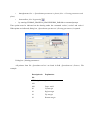
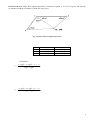
GPS system consists of satellites orbiting above the earth’s surface and ground-based stations
(control segment). The satellites are placed in four orbital planes consisting of six satellites each. Each
satellite transmits the exact time and location coordinates. A minimum of four satellites is required to
determine the location of a point, however, more satellites ensure higher accuracy and faster
detetermination of the coordinates. Satellite transmitted signals must be received simultaneously at the
point the coordinates of which are being determined [2].
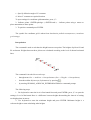
GPS satellites are placed at an altitute of approximately 20 200 km above the surface of the
Earth. The precise orbital periods of the satellites are close to 11 hours 58 minutes. The satellite makes
somewhat more than two orbits per day, therefore the same satellite may be seen from the same ground
surface point twice a day. The satellite appears for the next time 4 minutes earlier than the day before.
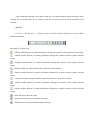
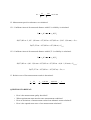
Each satellite has one transmitter and receiver, one antenna, five oscillators and one microcomputer.
The oscillator uses rubidium and cesium frequency etalons. There may be less than 24 active satellites
because of repair of single satellites. New satellites are launched if required.
Fig. 6.1. GPS staellites orbiting above the Earth
Ground-based GPS stations observe GPS satellites, monitor their position in space and the
reliability. Satellite ephemeris data and time corrections are broadcasted from these stations to
satellites. Satellites can use these corrections in its signals transmitted to GPS tools. There are five
ground-based GPS satellite observation stations.
GPS has its own timing system - GPS weeks and seconds of week. The time is measured in GPS
weeks, and the time of GPS week - in seconds of week, and this time varies from 1 to 604800. The
GPS weeks begin at the Saturday/Sunday transition [1].
The aim of GPS method consists in measurement of the distance from the satellite to the receiver
(trilateration). This distance is calculated according to the formula - the travel path of signal is equal to
the multiplication of propagation speed and time. Point coordinates are calculated using special
algorithms.
Time is an essential factor of the GPS system. Signals travel at the speed of light, so there is a
high significance of any delay millisecond if converted into distance.
GPS operates with WGS S4 coordinate system. User coordinates are converted into other
coordinates providing corresponding specification [1, 3].
6.2. Environmental Effects on Surveying
The quality of GPS surveying is determined by the certain environmental factors:
- Ionospheric activity depends on the time of day and solar activity;
- Tropospheric propagation delay (depends on the satellite elevation angle);
- Signal obstacles (buildings, hills, trees, meter man);
- Signal reflections (the signal is reflected from a house or other object and then reaches the
receiver - consequently the propagation distance is longer leading to the falsification of results);
- Radio wave interference (similar frequency radio wave sources). Ionosphere - the component of
the Earth’s atmosphere from about 50 to 1 000 km altitude above the Earth’s surface. It consists of free
electrons. Ionosphere has the greatest influence on GPS signals in northern and southern latitudes. Its
activity is highly dependent on the 11-year sunspot cycle and the time of day (the greatest impact is on
sunny day). 2000 - 2001 were the years of maximum solar activity. High solar activity can affect the
initial determination of conditions for favorable surveying - drag out the measurement reducing the
accuracy[1].
Tropospheric effect is simulated and eliminated by the GPS device. Determination of favorable
conditions for surveying and the accuracy of measurements are influenced by tropospheric propagation
delay. Where possible, the same height of base-type and portable device is set.
Obstacles around the receiver (houses, trees and etc.) limit the possibilities for the station to
observe all satellites. They also increase the potential of signal reflection. Flat metal objects in the
vicinity of the satellite antenna (roofs of cars) can cause signal reflection before the signal reaches the
device. This may result in 1 to 5 centimeters measurement error [1, 3].
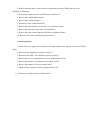
6.3. Number of Visible Satellites
GPS system is designed so that at leat four satellites were visible at every point of the Earth
above any location on the horizon. But often more satellites are visible. Satellite inclination angle to the
equatorial plane makes up 55°. The visibility of satellites depends on the point geographical latitude the further north, the less satellites are observed simultaneously and the lower their elevation angle is.
The maximum number of visible satellites is 12. When more satellites are seen, the surveyimng isfaster
and the results are more accurate.
Satellite geometry directly affects the capabilities of GPS device. The best measurement
conditions are when the angles of satellites are righter in respect to the device [1, 3].
6.4. Satellite Elevation Angle
GPS satellite orbit angle of inclination towards equator is approximatelly 55°, therefore the
satillites will be never visible in the zenith further north than 55° of northern latitude and further south
than 55° of southern latitude. Vilnius is approximatelly 54°38' of northen latitude therefore the
satellites can be still observed in the zenith (right above the observer).
Why is the satellite elevation angle important? The quality of satellite transmitted signal depends
on the elevation angle. The elevation mask is a very important and often used term in GPS science. It is
the minimum satellite elevation angle that is visible above the user azimuth. It must be determined
before measuring. If any of the satellites is lower of the set angle the signals from it will not be
automatically received. Most often used minimum satellite elevation angle is 15°. It is the most suitable
for a variaty of observations. When variable number of satellites is observed, e.g. five simultaneously,
eight after a few seconds and again five or six, it means that some of the satellites are going down or up
and are on the line of the set minimum elevation angle. In such case it is recommended to wait for
some minutes till the fixed number of satellites or to change the minimum elevation angle and perform
remeasuring [1, 3].
How does the elevation angle influence the accuracy of measurement? When the satellite
elevation angle is small, the signal must travel longer path through the Earth’s atmosphere from the
satellite to the receiver. The Earth’s atmosphere impedes signal propagation (because the light
propagation is speeding down).
6.5. Point Positioning GPS Methods
Point positioning GPS method is chosen according to the requirements for accuracy and
reliability of the set point location. GPS survey methods are the following: Static, Reoccupation, Rapid
Static, Kinematic, Stop&Go Kinematic, Real Time Kinematic -RTK, Differencial GPS [1, 3].
Static method is the most precise and reliable. It is possible to coordinate with several devices at
the same time during the measurement. Measurement time depends on the length of measured vectors,
satellite observation possibilities, atmosphere conditions and other requirements. Such measurement
may take from 30 minutes to several days. This method is often applied in measuring longer than 15
km vectors.
Reoccupation method is similar to the static, but the measurement at points takes less time i.e. 10
min., then continuing with the next point and going on to all set points before returning to the first one.
Remeasurement with short time interval is performed. The advantage of this method is shorter
measurement time.
Kinematic method is the most rapid. The measurement is performed in two established points
applying Rapid Static method (approximately 5 min.). The advantage of the kinematic method is fast
determination of point locations on the ground and in the space.
Stop&Go Kinematic method is a combination of Rapid Static and Kinematic methods.
Measurements are performed without switching off the device, several minute stops are made at points
for the reason of renewal of detection of the number of strong waves [1, 3].
The aim of Real Time Kinematic method is the same as of the simple Kinematic method. The
main advantage of the Real Time Kinematic method consists in fast determination of poit locations
because the measurement takes 5 - 10 seconds. Nowadays this method is the most applicable for point
positioning. Corrections sent from the basic station located at the point with established coordinates are
used in the cource of RTK measurement. The accuracy of RTK method makes up approximately 1 - 3
cm.
Differential methiod is a type of Real Time Kinematic method when the corrections from the
established point are transmitted by radio waves from radio stations or broadcasted on the Internet.
The Real Time Point Positioning method is the post popular for real estate cadastral
measurements.
6.6. World Geodetic System WGS 84
The locations of points have been determined with the help of GPS devices since 1984 according
to the World Geodetic System WGS 84. It is a geocentric coordination system. Its geodetic datum
coincide with the mass center of the Earth. Z axis is directed towards the conventional Earth’s poles.
X axis is set according to WGS 84 prime meridian and conventional Earth’s poles equator
longitude. WGS 84 prime meridian is parallel to the zero meridian. Y axis is on the conventional Earth’s
pole equator longitude towards the east from X axis through 90°.
WGS 84 ellipsoid semi-major axis – 6 378137 m, longitude - 1 : 298,257 223 563. Ellipsoid
geometry center coincide with WGS 84 coordinate system origin, and ellipsoid semi-minor axis - with
axis Z axis of the coordinate system [2].
One-minute reflection questions
1. What are the world operational GPS systems?
2. What causes the most influence on the accuracy of GPS surveying?
3. When is the greatest impact of Ionosphere on GPS surveying?
4. Do the buildings influence the accuracy of GPS surveying ?
5. How long can the RTK method measurement take?
6. Could the Static method take 5 hours?
7. What is the axial meridian of the LKS -94 coordinate system?
8. What is the name of coordinate system where the origin of coordinates coincide with the mass
center of the Earth?
General questions
1. Where are the GPS tools used?
2. What is the approximate height of satellites?
3. What coordinate system is used by NAVSTAR satellites?
4. Why does the surveying accuracy depend on orbital altitude?
5. What is the most often used minimum satellite elevation angle?
6. What is the most precise GPS surveying method?
7. What is the most common GPS method used for Real estate cadastral measurements?
8. What is the name of the world coordinate system?
9. What is the ellipsoid of the world coordinate system?
10. Is the WGS 84 coordinate system topocentric or geocentric?
•
Se
q.
No.
References and other sources of information:
Publishing
year
Information source (publication)
author, title and identification number
Publishin
g location
and house
(a tick-mark shall mean availability of the
source)
Kaunas
Other
College
Study Rooms
libraries
library
Key Information Sources
1
2008
2
2012
3
2012
ŽIVATKAUSKAS, Aurelijus, et al.
Geodezija: mokymo(si) priemonė.
ISBN 978-9955-511-87-8. 329 p.
Alexander, Ross, CLARKE.
Geodesy.
ISBN 978-1290098762. 378 p.*
Charles, D., GHILANI et al.
Elementary Surveying.
ISBN 978-0-13-255434-3. 984 p.*
Vilnius.
UAB
„Vaistų
žinios“
√
√
HardPress
Publishing
√
√
Westford
United States
of America
√
√
Technika
√
√
√
√
√
√
√
√
Springer –
Verlag
Berlin
Heidelberg
√
√
Valstybinė
geodezijos ir
kartografijos
tarnyba
√
√
Technika
√
√
Vilniaus
Gedimino
technikos
universitetas,
geodezijos
institutas
Kauno
kolegija
√
√
√
√
Additional reading
1
1998
2
1996
3
2011
4
2012
5
6
2003
2000
SKEIVALAS, Jonas. Elektroniniai
geodeziniai prietaisai
ISBN 9986-05-713-2. 193 p.
TAMUTIS, Zigmas. ir kiti.
Geodezija-2
ISBN 5-420-01331-2. 384 p.
АЛЬБЕРТ, ГАМЗАТОВИЧ,
ЮНУСОВ, и др. Геодезия.
ISBN: 978-5-8291-1326-1,
978-5-98426-108-1. 409 p.*
TORGE, WOLFGANG; MÜLLER,
JÜRGEN. Geodesy.
ISBN 978-3-11-020718-7. 539 p.*
ERIK W. GRAFAREND,
FRIEDRICH W. KRUMM, VOLKER
S. SCHWARZE. Geodesy – The
Challenge of the 3rd Millennium.
ISBN-10: 3642077331. 487 p.*
Geodezijos ir kartografijos techninis
reglamentas. GKTR 2.08.01:2000:
statybiniai inžineriniai geodeziniai
tyrinėjimai
Mokslo ir
enciklopedijų leidykla,
Издательство
"Академи
-ческий
Проект"
University of
Hannover,
Germany.
Periodicals
1
Geodezija ir kartografija.
ISSN 1392-1541
Geodesy and cartography.
ISSN 2029 – 6991*
2
Matavimų inžinerija ir GIS.
ISSN 2029-5790
Online Information Sources
1
http://www.nzt
2
http://www.topcon.lt
3
http://www.gpspartneris.lt
4
http://www.infoera.lt
5
http://www.geoportalas.lt
3
6
7
8
9
10
11
http://www.gps.lt
http://www.glonas-center.ru
http://www.unavco.org
http://www.navstar.com
http://www.esa.int/esaNA/galileo.html
http://www.gsb.lt
* references for international students
The topic of the Subject Programme prepared by:
assistant Vincas Zakarauskas
Educational Institution:
Kauno Kolegija/University of Applied Sciences
Study Programme:
Real Estate Measurement Engineering
Subject:
Geodesy
TOPIC: LITHUANIAN NATIONAL GEODETIC BASIS,
1994 LITHUANIAN COORDINATE SYSTEM - LKS 94,
DIRECT AND INVERSE ANGULAR INTERSECTION
1. The Structure of the Topic: the analysis of topics Lithuanian National Geodetic Basis, 1994
Lithuanian Coordinate System - LKS 94, point coordination methods covers the presentation and
analysis of information regarding the structure of the Lithuanian National Geodetic Basis and its
networks, LKS 94 coordinate system main data, coordinate reference point, essence of direct and
inverse angular intersections, data processing procedure and permissible errors.
2. The Length in Hours: 2 academic hours are envisaged for topic explanation.
3. The Innovative Methods Applied During Lectures for Topic Explanation: Presentation of
information, demonstration, discussions, one-minute reflection, individual tasks, case analysis, use
of literature and material in virtual media (Moodle).
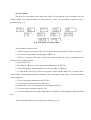
8. LITHUANIAN NATIONAL GEODETIC BASIS
The geodetic basis is required for real estate cadastral measurements, control, creation of
topographic maps in the field of land cartography, construction, geodynamic investigations, state
border marking and other activities requiring determination of point locations [1].
The Lithuanian Geodetic Basis consists of Lithuanian geodetic networks, their coordinates
and heights. The totality of geodetic marks on the Earth’s surface interconnected by geodetic
surveying constitutes the geodetic network. The geodetic network is divided into national global
positioning system (GPS), planimetric, vertical, gravimetric, magnetometer, permanent GPS station
networks according to determinable parameters. According to the territory the geodetic networks
and divided into world, continental, national, municipal, local and special networks [1].
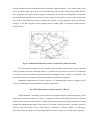
The global positioning system of the Republic of Lithuania is the network of permanent
reference GNSS stations called LitPOS. It is an information system of the Lithuanian National
Geodetic Basis, which provides the users with geodetic control data in real time. LitPOS consists of
25 permanent reference GNSS stations located in the territory of the Republic of Lithuania.
Regional GNSS station control room is equipped in Vilnius Gediminas Technical University. The
purpose of LitPOS is to calculate and eliminate errors of GPS satellite signals received by GPS
measurement tools and to determine the spatial location of objects on the Earth’s surface in the
territory of the Republic of Lithuania using GPS measurement equipment. The geodetic basis data
corrected according to these errors is transmitted to LitPOS users through telecommunication
facilities. LitPOS data source is GPS satellite signals received by permanent reference GNSS
stations and transmitted through state safe data transmission network to LitPOS data processing
centre. Other LitPOS data sources are the information from permanent reference GNSS stations,
meteorological information, parameters of ionosphere model, parameter of the Lithuanian geodetic
basis and Lithuanian geodetic coordinate system as well as parameters of related systems according
to which the corrections for real time elimination of GPS satellite signal errors are calculated.
LitPOS activity functions: to receive GPS satellite signals throughout the Republic of
Lithuania at uniformly located permanent reference GNSS stations and transmit the data through
the state safe data transmission networks to LitPOS data processing centre; to process the LitPOS
data and calculate corrections for real time elimination of GPS satellite signal errors; provide
LitPOS users with corrected geodetic basis data using telecommunication tools. Organizational
structure of LitPOS includes LitPOS administrator – National Land Service under the Ministry of
Agriculture and LitPOS manager – state enterprise National Centre of Remote Sensing and
Geoinformatics „GIS-Centras“; LitPOS users – physical and legal entities who uses GPS equipment
for determination of object spatial location.
Physical and legal entities wishing to use the LitPOS data must fill in the registration on
LitPOS web page www.nzt.lt, i. e. to fill in and send an electronic form of registration to LitPOS
manager. After filling in and sending of the electronic form of registration the LitPOS manager
provides physical and legal entities with LitPOS username, password and parameters of service
station of the LitPOS data processing centre, providing geodetic basis data.
The requirements imposed on the LitPOS user for measurement by GPS equipment:
capability to use Internet GPRS (eng. General Packet Radio Service) connection and capability to
use Internet GPRS connection and receive RTK signals.
Planimetric network consists of: GPS, triangulation, polygonometry and local networks.
GPS networks are divided into zero, first, second and third order networks. GPS network integrates
4 zero order, 52 first order, 1026 second order and 12 000 (1 station - 5 sq. km) third order stations.
Baltic height system is applied in Lithuania. Normal height is computed from Kronstadt zero
(The Gulf of Finland) equipotential surface (geoid). Baltic system heights differ from Amsterdam
system heights common for Europe by 15 cm.
The Lithuanian National Geodetic First Order Network consists of five closed polygons.
Perimeter of the network is approximately 1900 km. Average perimeter of the polygon – 500 km,
average distance between benchmarks and wall marks is approximately 1.5 km. Mean square error
of one kilometre makes up 0.42 mm. Second order networks are placed inside and outside the first
order polygons. The outside of the polygon is bounded by the border of the Republic of Lithuania.
Vertical network stations in the territory of the country are located so as not to leave local points
more than 15 km distant form first or second order stations. Average perimeter of the second order
polygon is 120 km. Lengths of lines uniting network nodal points or reference points must not
exceed 50 km.
Fig. 8.1. Lithuanian National Geodetic Vertical First Order Network
The state geodetic network is also united by three absolute measurement stations and first
order gravimetric network uniting 48 stations. A second order gravimetric network of 635 stations
is created to carry out detailed geopotential field investigation in the territory of Lithuania. The
gravimetric network is required to perform detailed gravity field investigations.
Lithuanian magnetometric network consists of 6 magnetometric stations equipped in the
territory of Lithuania for determination of magnetic field ramp.
8.1. 1994 Lithuanian Coordinate System - LKS 94
1994 Lithuanian Coordinate System (LKS-94) integrated into the general European system
only must be used since February 1, 1996. Coordinates of all the GPS (Global Positioning System)
geodetic basis stations in the territory of Lithuania determined applying satellite method are located
towards the global and geocentric mass centre of the Earth. Global geocentric coordinate system is
WGS 84 (World Geodetic System 1984) with its realization in Europe EUREF 89 (European
Coordinate Referencing System 1989) using GRS-80 (Geodetic Reference System 1980) ellipsoid.
LKS – 94 coordinate system includes:
– spatial coordinate system;
– normal gravity field and ellipsoid;
– planar coordinates system.
The spatial coordinate system aligns with ETRS 89 coordinates system of the united
European geodetic network EUREF 89. It is a geocentric system. Location of a point is defined by
rectangular coordinates X, Y, Z.
Normal gravity field and GRS 80 (Geodetic Reference System) ellipsoid.
Semi-major axis of the ellipse is a = 6378137 m, inverse flattening of the ellipse is –
1/f= 298.257222101....
The centre of ellipsoid coincides with ETRS 89 system geodetic datum, or its semi-minor
axis with Z axis.
Location of point is defined by geodetic latitude B, geodetic length L and geodetic (ellipsoid) height
He.
Planar coordinate system is based on transverse cylindrical Mercator projection with axial
meridian Lo = 24°C and projection scale at axial meridian mo = 0,99980. Geodetic datum coincides
with the intersection of axial meridian and equator on the plane of projection. Axial meridian
projection is an abscissa (x) axis. Positive direction of this axis is directed toward the north. Positive
direction of ordinates (y) axis is directed toward the east. The ordinate of abscissa axis is 500 000 m
(Technical Regulation of Geodesy and Cartography. GKTR 2.08.01:2000: engineering geodetic
investigations for constructions).
8.2. Point Coordination Methods
Coordinates of the locality point may be determined according to the geodetic intersection
by measuring angles or lines. The intersection obtained as a result of measurement of angles is
called angular intersection, and the result of measurement of a line is linear intersection. Angular
intersections are divided into direct and inverse intersections and single or multiple depending on
the number of measurements performed. The multiple intersection is more precise because of
additional measurements and better controllable computations [1].
8.2.1. Direct Angular Intersection
In direct angular intersection the planimetric location of points A, B and C is known and
angles β1, β2, β3 and β4 are measured. Coordinates of 7 picket point are calculated [1, 2].
The scheme of the direct angular intersection is provided in Fig. 8.1.
8.1. Scheme of direct angular intersection
Abscissa of 7 picket point is calculated according to the formula 8.1.:
xPK7 =
xA ctgβ2 + xB ctgβ1 − yA + yB
ctgβ2 + ctgβ1
(8.1.)
Ordinate of 7 picket point is calculated:
xPK7 =
yA ctgβ2 + yB ctgβ1 + xA − xB
ctgβ2 + ctgβ1
(8.2.)
Check calculation - abscissa:
xPK7 =
xA ctgβ2 + xB ctgβ1 − yA + yB
ctgβ2 + ctgβ1
(8.3.)
xPK7 =
yA ctgβ2 + yB ctgβ1 + xA − xB
ctgβ2 + ctgβ1
(8.4.)
Ordinate:
Difference of calculated coordinates not exceeding 50 cm is assumed.
8.2.2. Inverse Angular Intersection
The inverse angular intersection is calculated when coordinates of three points are known
and the coordinates of the fourth point should be found. Two additional points must be selected,
two datums must be created and lengths of datum lines must be measured in order to findthe
coordinates of required point. Angles are measured between coordinated direction and datum lines.
The scheme of inverse geodetic intersection is provided in Fig. 8.2. [1, 2].
8.2. Coordinate displacement scheme
Coordinate displacement scheme is adapted to specific option according to the provided
local directions. DB and BE datum lines must be drawn to ease the measurement of their lengths
and angles.
The distance from point M to point B is calculated according to DMB and EMB triangles:
SBM =
SDB × sin β1
sin (β1 + β2)
(8.5.)
SBM =
SBE × sin β4
sin (β3 + β4)
(8.6.)
The result is positive if the difference between distances does not exceed 20 cm.
According to inverse geodetic task, direction angle and length of MN line are calculated:
arc tgαMN =
SMN =
SMN =
∆yMN
;
∆xMN
∆xMN
;
cos αMN
∆yMN
;
sin αMN
SMN = ∆x 2 + ∆y 2 .
Difference of distances not exceeding 20 cm is assumed.
µ and c values of angles are calculated:
sin µ =
SBM × sin β5
;
SMN
γ = 180º - β5 – µ .
(8.7.)
(8.8.)
The value of direction angle of MN line is calculated:
αMB = αMN + γ.
(8.9.)
According to direct geodetic task, coordinates of B point are calculated:
xB = xM + SBM × cos αMB;
(8.10.)
yB = yM + SBM × sin αMB;
(8.11.)
Direction angle of BN line is calculated:
arc tgαBN =
∆yBN
;
∆xbN
(8.12.)
Check calculation of direction angle of BN line:
αBN = αMB + 180º + β5 .
The difference between values of direction angle of BN line must not exceed 5 seconds.
One-minute reflection questions
1. What networks do compose the Lithuanian Geodetic Basis?
2. What is the short name of the network of permanent reference GNSS stations of the
Republic of Lithuania?
3. How many stations does the LitPOS network consist of?
4. What is the LitPOS administrator?
5. What is the LitPOS manager?
6. Who may use the LitPOS network?
7. What is the axial meridian of the LKS -94 coordinate system?
8. What is the projection scale at the axial meridian?
9. What is the name of the ellipsoid of LKS-94 coordinate system?
10. What are the check calculations performed for?
General questions
1. What is the web page where physical and legal entities must register to use the LitPOS
data?
2. What does the planimetric network consist of?
3. What does the LKS – 94 coordinate system consist of?
4. What is the case for computation of inverse angular intersection?
5. What is the purpose of coordination of geodetic points?
6. What is the purpose of inverse geodetic task?
7. Characterize the purpose of direct angular intersection.
•
References and other sources of information:
Se
q.
No.
Publishing
year
Information source (publication)
author, title and identification number
Publishin
g location
and house
(a tick-mark shall mean availability of the
source)
Kaunas
Other
College
Study Rooms
libraries
library
Key Information Sources
1
2008
ŽIVATKAUSKAS, Aurelijus, et al.
Geodezija: mokymo(si) priemonė.
ISBN 978-9955-511-87-8. 329 p.
2
2012
Charles, D., GHILANI et al.
Elementary Surveying .
ISBN 978-0-13-255434-3. 984 p.*
Vilnius.
UAB
„Vaistų
žinios“
Westford
United States
of America
TAMUTIS, Zigmas. ir kiti.
Geodezija-2
ISBN 5-420-01331-2. 384 p.
Geodezijos ir kartografijos techninis
reglamentas. GKTR 2.08.01:2000:
statybiniai inžineriniai geodeziniai
tyrinėjimai
Mokslo ir
enciklopedijų leidykla,
Valstybinė
geodezijos ir
kartografijos
tarnyba
√
√
√
√
√
√
√
√
Technika
√
√
Vilniaus
Gedimino
technikos
universitetas,
geodezijos
institutas
Kauno
kolegija
√
√
√
√
Additional reading
1
1996
2
2000
Periodicals
1
Geodezija ir kartografija.
ISSN 1392-1541
Geodesy and cartography.
ISSN 2029 – 6991*
2
Matavimų inžinerija ir GIS.
ISSN 2029-5790
Online Information Sources
1
http://www.nzt
2
http://www.gpspartneris.lt
3
http://www.infoera.lt
4
http://www.geoportalas.lt
5
http://www.gps.lt
6
http://www.glonas-center.ru
7
http://www.unavco.org
8
http://www.navstar.com
9
http://www.esa.int/esaNA/galileo.html
3
* references for international students
The topic of the Subject Programme prepared by:
assistant Vincas Zakarauskas
Educational Institution: Kauno Kolegija/ University of Applied Sciences
Study Programme: Real Estate Measurement Engineering
Subject: Geodesy
PRACTICAL WORK NO. 1
TOPIC: LEVELING USING PRECISE DIGITAL LEVELS
1. The Aim of the Practical Work: to perform leveling and stakeout of points using a digital level, to
analyse surveyed data.
2. The Objectives of the Practical Work: to describe digital levels, check and adjust precise digital
level, to set registration of data in the memory of the level, to enter necessary data and settings in the
memory of the device, to stakeout leveling line pickets, to perform standard precision leveling, to
perform longitudinal leveling applying three methods, to level intermediate points, to process and
analyse the surveyed data.
3. The Innovative Methods Applied in the Practical Work: team learning, discussions.
4. The Assessment of the Practical Work:
The highest level of the
achievement of objectives
10
9
Key control and functions of
the digital level are
demonstrated, the tripod of
level is set, the level is set up
on the tripod, the device is set
over the point, the level is
levelled, eyepieces are
adjusted, switch on/off of date
registration is demonstrated,
Alpha reference is adapted for
leveling data entry, setting
menu is described and
demonstrated, leveling line
pickets are set out, leveling
line scheme is drawn,
parameters required for
leveling are entered (numbers
of benchmarks, and
measurements, order and
sequence of numbering of
pickets, the maximum
The medium level of the
achievement of objectives
8
7
Key control and functions of
the digital level are
demonstrated, the tripod of
level is set, the level is set up
on the tripod, the device is set
over the point, the level is
levelled, eyepieces are
adjusted, switch on/off of date
registration is demonstrated,
Alpha reference is adapted for
leveling data entry, setting
menu is described and
demonstrated, leveling line
pickets are set out, leveling
line scheme is drawn, not all
parameters required for
leveling are entered (numbers
of benchmarks, and
measurements, order and
sequence of numbering of
pickets, the maximum
The minimum level of the
achievement of objectives
6
5
Key control and functions of
the digital level are
demonstrated, the tripod of
level is set, the level is set up
on the tripod, the device is
set over the point, the level is
levelled, eyepieces are
adjusted, switch on/off of
date registration is
demonstrated, Alpha
reference is adapted for
leveling data entry, setting
menu is described and
demonstrated, leveling line
pickets are set out, leveling
line scheme is drawn, not all
parameters required for
leveling are entered
(numbers of benchmarks,
and measurements, order and
sequence of numbering of
Not achieved
objectives
4
3
2
1
Key control and
functions of the digital
level are demonstrated,
the tripod of level is set,
the level is set up on the
tripod, the device is set
over the point, the level
is levelled, eyepieces
are adjusted, switch
on/off of date
registration is
demonstrated, Alpha
reference is adapted for
leveling data entry,
setting menu is
described and
demonstrated, leveling
line pickets are set out,
leveling line scheme is
drawn, parameters
required for leveling are
permissible height variation
measurement error on the
station etc.), Level 1 leveling
is performed, intermediate
points are measured, Level 2
leveling and Level 3 leveling
are performed, measurement
data is transferred to computer
and revised, measurement data
is printed and analysed.
permissible height variation
measurement error on the
station etc.), Level 1 leveling is
performed, intermediate points
are measured, Level 2 leveling
and Level 3 leveling are
performed, measurement data
is transferred to computer and
revised, measurement data is
printed and analysed.
pickets, the maximum
permissible height variation
measurement error on the
station etc.), leveling
applying two Level methods
only is performed,
intermediate points are
measured, measurement data
is not transferred to computer
and not revised,
measurement data is not
printed and analysed.
not entered (numbers of
benchmarks, and
measurements, order
and sequence of
numbering of pickets,
the maximum
permissible height
variation measurement
error on the station
etc.), leveling applying
one Level method only
is performed,
intermediate points are
not measured,
measurement data is not
transferred to computer
and not revised,
measurement data is not
printed and analysed.
The teacher specifies the surveying object of the locality.
The survey is performed by groups of three or four students.
Each group selects a digital level from geodetic laboratory, prepares it for work using devise user
manual and performs envisaged tasks.
Sequence of the practical work:
1. To demonstrate the key control and functions of the digital level.
2. To set a tripod of the level.
3. To set up the level on the tripod.
4. To set the device in the middle between the points.
5. To level the digital level.
6. To adjust the eyepieces.
7. To demonstrate the switch on/off of data registration.
8. To adapt Alpha reference for input of leveling benchmark data.
9. To describe and demonstrate the settings menu.
10. To set out leveling line pickets.
11. To draw leveling line scheme.
12. To enter parameters required for leveling (numbers of benchmarks, number of measurements,
order and sequence of numbering of pickets, the maximum permissible height variation error on the
station etc.).
13. To level the line applying Level 1 pattern leveling.
14. To measure intermediate points.
15. To level the line applying Level 2 pattern leveling.
16. To level the line applying Level 3 pattern leveling.
17. To transfer measurement data to computer and perform review.
18. To print obtained data and evaluate survey results.
19. To prepare presentation of practical work.
Level 1 pattern leveling
The Back Pn prompt is displayed on the screen. Collimate to the rod Backsight 1 and press MEAS
key to recollect the measurement. When the measurement is completed the average value of the
measurement is displayed on the screen. Message display time is set on the setting mode. When the
setting mode is continuous measurement, press ESC key is pressed. The Fore 1 Pn message is on the
screen. Point number is automatically increased.
Collimate to the rod Foresight 1 and press MEAS to recollect the measurement. When the
measurement is completed the average value of the measurement is displayed on the screen. Then
collimation to the rod foresight in performed and MEAS key is pressed. Foresight 2 measurement is
performed in the same way. Collimation to the rod Backsight 2 is performed. After the measurement
has been completed the average value will be displayed. Further measurements are performed similarly
to the process described for the first station.
Measurements on the1st station are displayed, see fig. 1.1. – 1.5.
Fig. 1.1. Leveling procedure on the station according to Level 1 pattern leveling
Collimation to the Backsight is performed. Leveling by the level is performed. Measurement is
carried out. After backsights 1 on the rod are taken the following screens are displayed, see fig. 1.2.
Fig. 1.2. Backsight 1 reading data is on the screen
The following screens are displayed:
- average value of backsight readings – 1.69837 m;
- backsight distance to the rod– 21.433 m;
- n – total measurements taken - 3;
- σ – standard deviation – 0.2 mm;
- backsight point number - 10.
Further foresight rod readings are taken, Leveling by the level is performed and measurement is
carried out. After the measurement to the foresight 1 is completed, the following screens are displayed,
see fig. 1.3.
Fig. 1.3. Foresight 1 reading data is on the screen
The following screens are displayed:
- average value of foresight readings – 1.49837 m;
- foresight distance to the rod – 21.433 m;
- n – total measurements taken - 3;
- σ – standard deviation – 0.2 mm;
- discrepancy of elevation backsight 1 and foresight 1– 0.20000 m;
- foresight point elevation – 35.8272 m;
- foresight point number - 11.
After the measurement to the foresight 2 is completed, the following screens are displayed, see
fig. 1.4.
Fig. 1.4. Foresight 2 reading data is on the screen
The following screens are displayed:
- average value of foresight readings – 1.49833 m;
- foresight distance to the rod – 21.434 m;
- n – total measurements taken - 3;
- σ – standard deviation – 0.1 mm;
- d - total backsight distance – total foresight distance;
- Σ - total backsight distance + total foresight distance;
- foresight point number - 11.
Backsight on the rod is taken, leveling by the level is performed and measurement is carried out.
After the measurement to the backsight 2 is completed, the following screens are displayed, see fig.
1.5.
Fig. 1.5. Backsight 2 reading data is on the screen
The following screens are displayed:
- average value of backsight readings – 1.69832 m;
- height difference error - (backsight 1 – foresight 1) – (backsight 2 – foresight 2) – 0.01 mm;
- backsight distance to the rod – 21.430 m;
- n – total measurements taken - 3;
- σ – standard deviation – 0.1 mm;
- d - total backsight distance – total foresight distance;
- Σ - total backsight distance + total foresight distance;
- discrepancy of elevations backsight 2 and foresight 2 - 0.19999 m;
- backsight point elevation – 35.8272 m;
- backsight point number - 10.
Level 2 pattern leveling
The procedure of measurement is provided in fig. 1.6.
Fig. 1.6. Leveling procedure on the station according to Level 2 pattern leveling
Measurement procedure:
1. Backsight 1 on the rod is taken.
2. MEAS key is pressed.
3. Backsight 2 on the rod is taken.
4. MEAS key is pressed.
5. Foresight 1 on the rod is taken and MEAS key is pressed.
6. Foresight 2 on the rod is taken.
The same method is applied to further measurements.
After the first measurement to the backsight 1 is completed, the following screens are displayed,
see fig. 1.7.
Fig. 1.7. Backsight 1 reading data is on the screen
The following screens are displayed:
- average value of backsight readings – 1.69837 m;
- backsight distance to the rod – 21.433 m;
- n – total measurements taken - 3;
- σ – standard deviation – 0.2 mm;
- backsight point number - 10.
After the second measurement to the backsight 2 is completed, the following screens are
displayed, see fig. 1.8.
Fig. 1.8. Backsight 2 reading data is on the screen
The following screens are displayed:
- average value of backsight readings – 1.49833 m;
- backsight distance to the rod – 21.434 m;
- n – total measurements taken - 3;
- σ – standard deviation – 0.1 mm;
- d - total backsight distance – total foresight distance;
- Σ - total backsight distance + total foresight distance;
- backsight point number - 10.
Foresight rod readings are taken, Leveling by the level is performed, measurement is carried
out.
After the measurement to the foresight 1 is completed, the following screens are displayed, see
fig. 1.9.
Fig. 1.9. Foresight 1 reading data is on the screen
The following screens are displayed:
- average value of foresight readings – 1.49837 m;
- foresight distance to the rod – 21.433 m;
- n – total measurements taken - 3;
- σ – standard deviation – 0.2 mm;
- discrepancy of elevations between points backsight 1 and foresight 1 – 0.20000 m;
- foresight point elevation – 35.8272 m;
- foresight point elevation - 11.
The second foresight 2 on the rod is taken. After the measurement to the foresight 2 is
completed, the following screens are displayed, see fig. 1.10.
Fig. 1.10. Foresight 2 reading data is on the screen
The following screens are displayed:
- average value of foresight readings – 1.52387 m;
- difference error - (backsight 1 – foresight 1) – (backsight 2 – foresight 2) – 0.01 mm;
- foresight distance to the rod – 21.430 m;
- n – total measurements taken - 3;
- σ – standard deviation – 0.1 mm;
- d - total backsight distance – total foresight distance;
- Σ - total backsight distance + total foresight distance;
- discrepancy of elevations backsight 2 and foresight 2– 0.19999 m;
- foresight point elevation – 35.8272 m;
- foresight point number - 11.
Level 3 pattern leveling
The Back Pn prompt is displayed on the screen. The procedure of the measurement is provided
in fig. 1.11.
Fig. 1.11. Leveling procedure on the station according to Level 3 pattern leveling
Measurement procedure:
1. Backsight on the rod is taken.
2. MEAS key is pressed.
3. Foresight on the rod is taken.
4. MEAS key is pressed.
The same method is applied to further measurements.
After the measurement to the backsight is completed, the following screens are displayed, see
fig. 1.12.
Fig. 1.12. Backsight reading data is on the screen
The following screens are displayed:
- average value of backsight readings – 1.69837 m;
- backsight distance to the rod – 21.433 m;
- n – total measurements taken - 3;
- σ – standard deviation – 0.2 mm;
- horizon of instrument – 35.8272 m;
- backsight point number - 10.
Foresight rod reading are taken, leveling is performed, measurement is carried out.
After the measurement to the foresights is completed, the following screens are displayed, see
fig. 1.13.
Fig. 1.13. Foresight reading data is on the screen
The following screens are displayed:
- average value of foresight readings – 1.52387 m;
- foresight distance to the rod – 22.123 m;
- n – total measurements taken - 3;
- σ – standard deviation – 0.1 mm;
- d - total backsight distance – total foresight distance;
- Σ - total backsight distance + total foresight distance;
- discrepancy of elevation backsight and foresight– 0.17432 m;
- foresight point elevation – 34.3074 m;
- foresight point number - 11.
Measurement of intermediate points
IN/SO key is used to measure intermediate points.
Number of measurements is selected, three measurements are selected for the given case.
The procedure of measurement of intermediate points is provided in fig. 1.14.
Fig. 1.14. Measurement of intermediate points
1. After completing the measurement to the backsight and before measuring to the next
foresight press the IN/SO key.
2. Press the ENT key. The instrument is now ready to collect the measurement to the
intermediate point, the Inter – Mediate prompt is displayed on the screen.
3. Collimate to the instrument on the staff which should be set on the intermediate point and
press the MEAS key.
4. Measured average height is displayed after the measurement. Other values are available by
pressing the [▲] and [▼] keys.
5. Press the ESC key. The instrument is ready to collect the next intermediate point. The
intermediate point number is automatically increased or decreased.
6. Repeat steps for each intermediate shot.
Review of intermediate points is possible. Measurement data of the intermediate point is
provide in fig. 1.15.
Fig. 1.15. Intermediate point measurement data
The following screens are displayed:
- average value of intermediate point readings – 1.69835 m;
- distance to the rod – 21.430 m;
- n – total measurements taken - 3;
- σ – standard deviation – 0.1 mm;
- intermediate point elevation – 52.8765 m;
- number of intermediate point - 10.
The end change point End Mode
It is possible to stop the Leveling at the intermediate point and later proceed with measurement.
The stop of measurement is provided in fig. 1.16.
Fig. 1.16. Measurement stop at the intermediate point
Measurement procedure:
1. Press the MENU key at the “Back Pn” prompt after having collected a foresight point and
before measuring a backsight point.
2. Press the [▲] key to display the Menu and End Mode menu.
3. Press the ENT key twice. Enter remarks, if required, at the Info 1 prompt, press the ENT key.
If there were no intermediate points, the distance difference between benchmarks will be shown.
Input is limited to 16 alphanumeric characters. If record mode is OFF, this step is skipped.
3. Press the ENT key.
A fragment of measurements data is provided in fig. 1.17.
Fig. 1.17. Measurement data
To look through the measurement data press the [▲] or [▼] keys. Displayed data:
- height difference between benchmark and the end change point – 1.922 m;
- horizontal distance from the end change point – 45.77 m;
- distance from the benchmark to the end change point – 124.55 m;
- elevation of the end change point – 34.307 m.
Set out of points
The data of set out point can be taken from RAM or from memory card according to the Out
module setting. The selected number of measurements – three. The procedure of point set out is
provided in fig. 1.18.
Fig. 1.18. Point set out procedure
The procedure of point set out:
1. After backsight measurement and prior to foresight measurement the IN/SO key is pressed.
2. Setout menu is selected by pressing [▲] or [▼] keys.
3. ENT key is pressed. The data is taken from RAM of from the Group, depending of the
selection in Out module settings.
4. Press the ENT key.
5. Press [▲] or [▼] keys to select the point and then press the ENT key.
6. To look through the altitudes and note screens press [▲] or [▼] keys.
7. A sight on the rod set up on the set out point is taken and the MEAS key is pressed. After
measurement an information with three measured values and final average value of the measurement
will be displayed.
8. To save measurement data press the ENT key.
9. To measure set out point press the ESC l key.
10. Return to the Fore Pn message box by pressing the ENT key.
11. For next point set out press the ESC key.
12. After the sight on the rod, other information is available by pressing [▲] or [▼] and MEAS
keys.
The measurement data of set out point is provided in fig. 1.19.
Fig. 1.19. Set out point measurement data
The following screens are displayed:
- average value of height difference – 0.48453 m;
- horizontal distance from the level to the set out point – 38.470 m;
- n – total measurements taken - 3;
- σ – standard deviation – 0.1 mm;
- set out point elevation – 50.3678 m;
- number of the set out point - 11.
ADDITIONAL MATERIAL FOR COMPLETION OF THE PRACTICAL WORK
Key function of the digital level DL-102C are provided in table 1.1., and table 1.2. provides for
display contents of the digital level DL-102C.
Table 1.1.
Key functions of digit level DL-102C
Keys
REC
SET MENU
SRCH
IN / SO
DIST
MANU
▼ ▲
◄ ►
REP
ESC / C
O<9
. (▼ )
Functions
Records the measured data or enters the displayed data to the instrument
Initiates Set mode and Menu mode
Data search
This key is used to initiate intermediate point or set-out mode collection during
line leveling
Distance measurement
Manual key used to input the data from the keyboard
This key is used to page through menu screens or data display screens
If the displayed value overflows the screen this key can be used to shift the
display to the right or left in the screen
This key is used to remeasure the previous backsight or foresight point during
line leveling
This key can be used to escape from the menu mode or any of the setting
modes. This key can be used as a backspace key when inputting data
These keys are used to input numeric values
When in alpha mode this key will change between numeric, alpha, or symbol
-[]
ENT
MEAS
POWER
input mode
This key can be used to measure with a inverse staff. Inverse staff mode is
necessary to set “USE” within the set mode beforehand
Use this key to confirm mode parameters and to enter displayed data values
This key is used to initiate a measurement
This key is used to cut the instrument ON or OFF
Table 1.2.
DL-102C level display contents
Display
REC
i
So
BM
Bk
Fr
Int
↕
Inst Ht
CP
GH
Contents
Indicate the record mode is on
Inverse measurement mode
Set out mode
Benchmark
Backsight
Foresight
Intermediate point measurement, sideshot
Pressing ▼ or ▲ keys to display the next menu
Instrument height
Changing point
Ground height
Setting of record mode. To store the measured data to the internal memory of the instrument
the Set Mode should be set. Out Module has to be set to RAM or Card.
Module RAM: the measured data is stored in the instrument RAM. Maximum 8000 point data
can be stored in RAM, maximum – 256 jobs. Group cannot be made within RAM.
Module Card: the measured data can be stored in Memory card directly, maximum – 256
groups.
Module RS-232C: Connect DL-101C/102C to external device and output the data every time
measured. The measurement in this mode can be Standard Measurement (Menu Measure) only.
Module off: the measured data is displayed only but not stored or output.
Entering characters when in Alpha mode. When record mode is on, alphanumeric characters
can be entered when entering fields such as remarks. Small letters and symbol marks can be input only
in input of Remarks (Info1,...). In other input, only capital letters and numeric characters can be input.
The word RAM cannot be used for the group name. For the group name (only for card) only capital
letters, numeric characters and ” – ” can be input (maximum 8 characters). For the job name capital
letters, numeric characters and ” – ” can be input (maximum 8 characters).
For the Info capital and small letters, numeric characters and all symbol marks can be input (maximum
16 characters).
Example: Enter Tp#7. Operating procedure:
1. The „Info 1 ?“ prompt is displayed on the instrument screen.
2. Press the [▼] key to enter the capital alphabet letter mode. Part of English alphabet is
displayed.
3. Press the [◄] or [►] key until the letter “T” is
located at the flashing cursor.
4. Press the [ENT] key. The “T” is entered and displayed on the bottom line.
5. Press the [▼] or [▲] key to enter the small letter mode.
6. Press the [◄] or [►] key several times until “p” is located at the flashing cursor. Press the
[ENT] key.
7. Press the [▼] or [▲] key to enter the symbol mode.
8. Press the [◄] or [►] key several times until “#” character is located at the flashing cursor.
Press the [ENT] key.
9. Press the [▼] or [▲] key to enter the numeric mode.
10. Press the [◄] or [►] several times until the “7” character is located at the flashing cursor.
Press the [ENT] key.
11. Press the [ESC] key.
12. Press the [ENT] key after confirming the contents of the displayed string.
Input is limited to 8 characters.
Set mode. The set mode menu allows the user to select a variety of different options that affect
the way the level operates. The set menu allows the user to select measuring units, communication
parameters, etc. The settings remain unchanged even when the power is off.
Press the [SET] key and the Set Mode will be displayed in context menu. Press the [ENT] key
to select the displayed option.
Available settings:
1. Check Battery – displays the battery voltage. The battery icon displays the battery capacity.
No light: the battery level is sufficient for measuring; light: measuring is possible but the battery is
partly discharged; flash: a flashing indicates the battery will soon be discharged. Charge to a new
battery as soon as possible.
Using one of the Set menu options battery voltage level is checked. Before the measurement or
while the screen displays the MENU, press the [SET] key and the Check Battery message will be
displayed. Press the [ ENT ] key and the battery voltage level will be displayed. Press the [ ESC ] key
and the message that was displayed before pressing the [ SET ] key will be displayed.
2. Set Measure – measurement method: continuous, single, n – times.
- Measure N Time – number of measurements is between 2 and 99.
- Measure Single – single measurement mode.
- Measure Cont – continuous measurement mode.
3. Set Fix – set the minimum units read by the level.
- Fix Standard – DL-101C level – 0.1 mm, DL – 102C – 1 mm.
- Fix Precise DL 101C level – 0. 01 mm, DL– 102C – 0.1 mm.
4. Set Item – set standard or extended data display in line leveling. You may select standard or
extended data display. Extended data: d: total backsight distance – total foresight distance; Σ: total
backsight distance + total foresight distance;
- Item Standard – do not display extended data;
- Item Extended – display extended data.
5. Display Time – setting display duration. This option is used to set how long certain screens
will be displayed before the next screen is displayed. Select N Sec. – set the display duration in
seconds, 1-9 secs.
6 .Display Unit – setting distance units.
- Unit m – meters (m).
- Unit ft – feet (ft).
7. Out Module –RAM data storing, RS-232C or OFF. Option that determines if and where the
data will be stored.
- Ram – measured data is stored to internal memory.
- Card – measured data is stored to memory card.
- RS-232C – communication with an external data collector is enabled.
- Off – measured data is not stored.
8. Point Number – selection of point number increase or decrease.
9. File Out – sending a data file.
10 . Set Comm – communication parameters.
11. Auto Cutoff – auto cut off is on or off. If Auto Cutoff is ON, the instrument will
automatically cut off after 5 minutes, if none of the keys will be pressed during these 5 minutes.
12. Set Bright - used to change the brightness of the display. The brightness can be set to one of
nine different settings.
13. Set Light – this option is used to turn the back light ON or OFF.
14. Check Time – display and edit the date and time.
15. Inverse Mode – used to measure with the inverted rod.
- Inverse Not Use – Not use the Inverse Mode;
- Inverse Use – Use the Inverse Mode.
16. Swing Correct – determines whether Swing Correct is on or off.
Changing set modes. Press the [SET] key while either in menu mode or before measuring. The
Set Mode screen will be displayed for a few seconds and then Check Battery will be displayed. Press
[▲] or [▼] key several times until displays Set Measure screen. Select the measurement mode by
pressing [▲] or [▼] keys. Press [ENT] key and set the measurement times by inputting numerical
character and press the [ENT] key. The display returns to Set Measure.
Standard measurement Menu meas. Examples of the practical work are carried out using
digital level DL-102C.
Standard measurement mode is used to take measurements without having an elevation
calculated. If Out Module is set to Ram or Card, you will be prompted to enter remarks and job
number, and all measurements will be recorded to instrument memory. Measurement procedure:
recording mode is ON, three measurements are performed. „Menu Measure“ prompt is displayed.
- Press the ENT key.
- Enter the job No. and press ENT. Maximum 8 characters allowed in field JobNo, and 16
characters in Remarks.
- Enter the MeasNo and press the ENT. To bypass the remark prompts and go directly to the
next step press ENT at the “Info 1” or “Info 2” prompt. Maximum of 8 numerical characters can be
input in MeasNo. The job no., measuring no., and remarks are not entered when the record mode is of
record mode is OFF.
- Collimation to the rod is performed and the MEAS key is pressed. Three measurements will be
taken and the average value will be displayed. If the level is set for continuous measuring, press the
ESC key. The screen then displays the last measured data.
When measurements are completed the information is displayed. Press the [▲] or [▼] key to
view the alternate screens. Press the REC key to store the data.
Display when [▲] or [▼] key is pressed:
- Rod Avg 1,69837 – n – times measurement height difference average value.
- Dist Avg 23,427 m – distance to the rod.
- n 3 – number of measurements.
- σ 0,2 mm - standard deviation.
- Meas Pn 4 – point number display.
Record mode (Out Module) must be set to RAM, Card or OFF to run line leveling. The example
in this chapter assumes that record mode is set to RAM. If the line leveling data is saved into Data card
directly, Out Module must be set to Card.
- Menu Leveling – start of line leveling.
- Start Leveling – input Job No, benchmarks and remarks.
- Cont Leveling – leveling sequence. There are three patterns of line leveling as follows:
1. Level1 (Method 1): backsight 1 → foresight 1 → foresight 2 → backsight 2.
2. Level 2 (Method 2 ): backsight 1 → backsight 2 → foresight 1 → foresight 2.
3. Level 3 (Method 3): backsight → foresight
The following keys can be used during measurements:
- REP: remeasure the foresight or backsight;
- MENU: manual entry of rod height and rod distance;
- DIST: measure a distance;
- INT/SO: intermediate point collection (Intermediate)/Set out measuring (Set out).
- Close Leveling – to end the measurement.
Start of line leveling. Start of line leveling Start L is used to enter the job no., benchmark no.,
and benchmark elevation. After this data has been entered the measurement to the backsight is taken.
Start of line leveling is provided in fig. 1.20.
Fig. 1.20. Start of line leveling
Measurements are started from backsight station.
Procedure:
1. Press the ENT key.
2. Press the ENT key. The previously used job number will be displayed as the default.
3. Enter Job No., and press ENT. When record mode is off (Out Module is OFF), the input of
job no., benchmark no. and remarks is bypassed.
4. Select a measuring pattern of line leveling by pressing the [▲] or [▼] and press the ENT key.
5. Enter the limit of discrepancy (EV limit) and press the ENT key. When Level 3 (backsight →
foresight) is selected, the input of limit of discrepancy is bypassed.
6. Enter benchmark No. and press the ENT key. When record mode is off (Out Module is
OFF), the input of job no., benchmark no. and remarks is bypassed.
7. Enter benchmark elevation and press the ENT key.
8. Enter remarks and press the ENT key. To bypass the remark prompts and go directly to the
next step press ENT at the Info 1 or Info 2 prompt. Screen displays measurement of backsight point
(benchmark).
Point number modifying
Point number can be changed before foresight measurement (fig. 1.21.). In point number,
numeric characters and the capital letter alphabets and “ - ” are usable to 8 characters. The point
number used once can be used again.
Fig. 1.21. Point number modifying
The Fore Pn 11 is displayed. Press the ESC key before foresight measurement. The point
number moves to the left side. Press the ESC (C) key twice to clear the number. The Fore Pn prompt
will be displayed – point number will be cleared.
New point number is entered. For example, 1001; Fore Pn 1001 will be displayed. Input is
limited to 8 alphanumeric characters. In the same line leveling, the point number used already can be
input. The ENT key is pressed. Info1 ? prompt is displayed for remark entering. Enter the remark and
press the ENT key. Input is limited to 16 alphanumeric characters. Example: CKPOINT, (displayed:
Info1 ? CKPOINT).
By pressing the ENT key, Point number will be changed to – Fore Pn1001.
It is possible to set up auto increment, auto decrement.
If there is numeric character at the end of the point number which it was input into in the last
time, point number of this time is indicated with last value+1.
When overall length of point number is less than 8 characters, digit sequence will shift right,
and increase by 1 figure. Example: last time - ABCD-99, this time - ABCD-100.
When overall length of point number is 8 characters. Figure shift is ignored. Example: last time
- ABCDE-99, this time - ABCDE-00.
If there is numeric character at the end of the point number which it was input into in the last time,
point number of this time is indicated with last value - 1.
Numeric character is decreased by 1 in case of more than 1. Example: last time - ABC-02, this
time - ABC-01, next time - ABC-00.
When numeric character section is 0 entirely, “ 9 ” are indicated till overall length is 8 figure.
Example: last time - ABC-00, this time - ABC-9999, next time - ABC-9998.
Repeat measurements
The REP key is used to recollect either the previous backsight or foresight point in the event
that the point was collected in error. The data which stored before remeasuring, will not affected on the
result of each data calculations.
Level 1 measurements. After finishing backsight 1 or foresight 1 measurement, it is possible to
remeasure from backsight 1. After finishing backsight 2 or foresight 2 measurement, it is possible to
remeasure from foresight 2 or backsight 1.
Level 2 measurements. After finishing backsight 1 or backsight 2 measurement, it is possible
to remeasure from backsight. After finishing backsight 1 or foresight 2 measurement it is possible to
remeasure from foresight 1 or backsight 1.
Level 3 measurements. After finishing backsight measurement it is possible to remeasure from
backsight. After finishing foresight measurement, it is possible to remeasure from foresight or
backsight.
Remeasurement form backsight 1, after the foresight measurement by Level1 method is
finished, is provided in fig. 1.22.
Fig. 1.22. Remeasurement applying Level 1 method
Remeasurement procedure:
1. Press the REP key at the REP Back2Pn prompt.
2. Press the [▲] or [▼] key to view the measured data.
3. The Back2Pn 29 prompt is displayed, press the REP key, the Rep Fr? 30 enquiry appears –
do you wish to recollect the measurement?
4. Press the ENT key to confirm that you wish to recollect the measurement Rea Rep EV err.
5. Press the [▲] or [▼] key to select a remeasurement reason and press the ENT key. You can
select one of the following 3 reasons:
- OP err: operation error;
- EV err: discrepancy of elevation error;
- RD: reading error.
6. Press the REP key again. The display returns to the Back 1 Pn prompt.
7. Collimate to the foresight Fore1Pn 30 and press MEAS to recollect the measurement.
8. When the measurement is completed the measured data is displayed on the screen.
9. Collimate to the backsight and press MEAS to recollect the measurement.
10. The display returns to Back2Pn prompt. Press the [▲] or [▼] key to display the final
measured point.
End of line leveling (end of benchmark) End Mode
Used for measurement completion. The end of line leveling is provided in fig. 1.23.
Fig. 1.23. End of line leveling
Measurement procedure:
- Press the MENU key after having collected a foresight point and before measuring a backsight
point;
- press the [▲],key to display the Menu and End Mode prompts;
- press the ENT key;
- press the [▼] key to display the end of benchmark screen End of BM;
- press the ENT key;
- enter the ending benchmark number and press the ENT key;
- enter to remarks if required;
- press ENT at the Info1 prompt to bypass remark entry. Input is limited to 16 alphanumeric
characters. If REC Mode is OFF, this step is skipped;
- press the ENT key;
- the display shows menu of start line leveling Menu Start L.
If there is no previous change point the height difference between benchmarks will b displayed.
The following data can be displayed in level screen, see fig. 1.24.
Fig, 1.24. Data of the end of line leveling
Displayed data after the line leveling is completed:
- the height difference between the benchmarks;
- horizontal distance from the last change point. If there is no previous change point, then this
screen is not displayed;
- horizontal distance between the benchmarks;
- elevation of the benchmark.
Continuing leveling Cont Leveling
This mode is used to continue line-leveling job. Data must be stored to Card or RAM. The
procedure of continuing leveling is provided in fig. 1.25.
Fig, 1.25. Procedure of continuing leveling
Measurement procedure:
1. Press the ENT key, if Menu Leveling is displayed;
2.To see the last displayed option press the [▲] key, Cont Leveling prompt will be displayed;
3. Press the ENT key. Job reference Job JO11 is displayed.
4. Select a job by pressing the [▲] or [▼] key.
5. Press the ENT key.
6. Setting Now job data will be set.
7. Start measuring. You can exit the job only when the first backsight prompt is shown.
QUESTIONS TO REPEAT:
•
What are the main components of the digital level Topcon DL - 102 C?
•
How is the tripod of the instrument set up?
•
How is the level set up over the point?
•
How is the position of the digital level levelled?
•
How is the level collated to the rod and how is the brightness adjusted?
•
How is the data recording mode switch on/off?
•
Summarize what parameters can you input in Set mode menu?
•
What line leveling methods do you know?
•
What are the main settings required to start the leveling?
•
How are the measured data browsed through?
•
What is difference between leveling patterns Level 1, Level 2 and Level 3?
•
What are the main rules for point numbering?
•
What is the procedure of point number change?
•
What is the procedure of remeasurement?
•
What is the procedure of intermediate point measurement?
•
How is point set out performed?
•
How is the intermediate point measurement stopped?
•
How is the line leveling of the final benchmark completed?
REFERENCES
Se
q.
No.
Publishing
year
Information source (publication)
author, title and identification number
Publishin
g location
and house
(a tick-mark shall mean availability of the
source)
Kaunas
Other
College
Study Rooms
libraries
library
Key Information Sources
1
2008
2
2012
3
2012
ŽIVATKAUSKAS, Aurelijus, et al.
Geodezija: mokymo(si) priemonė.
ISBN 978-9955-511-87-8. 329 p.
Alexander, Ross, CLARKE.
Geodesy.
ISBN 978-1290098762. 378 p.*
Charles, D., GHILANI et al.
Elementary Surveying .
ISBN 978-0-13-255434-3. 984 p.*
Vilnius.
UAB
„Vaistų
žinios“
√
√
HardPress
Publishing
√
√
Westford
United States
of America
√
√
Technika
√
√
Technika
√
√
√
√
√
√
Additional Reading
1
1998
2
1995
3
1996
4
2011
SKEIVALAS, Jonas. Elektroniniai
geodeziniai prietaisai
ISBN 9986-05-713-2. 193 p.
SKEIVALAS Jonas. Koreliuotų
geodezinių matavimų rezultatų
matematinis apdorojimas.
ISBN 9986-05-151-7 : 10.00 . 272 p.
TAMUTIS, Zigmas. ir kiti.
Geodezija-2
ISBN 5-420-01331-2. 384 p.
АЛЬБЕРТ, ГАМЗАТОВИЧ,
ЮНУСОВ, и др. Геодезия.
Mokslo ir
enciklopedijų leidykla,
Издательство
ISBN: 978-5-8291-1326-1,
978-5-98426-108-1. 409 p.*
5
6
7
2012
2003
2000
TORGE, WOLFGANG; MÜLLER,
JÜRGEN. Geodesy.
ISBN 978-3-11-020718-7. 539 p.*
ERIK W. GRAFAREND,
FRIEDRICH W. KRUMM, VOLKER
S. SCHWARZE. Geodesy – The
Challenge of the 3rd Millennium.
ISBN-10: 3642077331. 487 p.*
Geodezijos ir kartografijos techninis
reglamentas. GKTR 2.08.01:2000:
statybiniai inžineriniai geodeziniai
tyrinėjimai
"Академи
-ческий
Проект"
University of
Hannover,
Germany.
√
√
Springer –
Verlag
Berlin
Heidelberg
√
√
Valstybinė
geodezijos ir
kartografijos
tarnyba
√
√
Technika
√
√
Vilniaus
Gedimino
technikos
universitetas,
geodezijos
institutas
Kauno
kolegija
√
√
√
√
Periodicals
1
Geodezija ir kartografija.
ISSN 1392-1541
Geodesy and cartography.
ISSN 2029 – 6991*
2
Matavimų inžinerija ir GIS.
ISSN 2029-5790
Online Information Sources
1
http://www.nzt
2
http://www.topcon.lt
3
http://www.gsb.lt
3
* references for international students
Prepared by:
assistant Vincas Zakarauskas
Educational Institution: Kauno Kolegija/ University of Applied Sciences
Study Programme: Real Estate Measurement Engineering
Subject: Geodesy
PRACTICAL WORK NO. 2
TOPIC: MEASUREMENTS USING ELECTRONIC RANGE FINDER
1. The Aim of the Practical Work: to perform measurements using electronic range finders, to
analyse measured data, to develop project of a building.
2. The Objectives of the Practical Work: to describe electronic range finders, to define building
geometry using electronic range finders, to compute perimeter, area of the building and to develop a
project of real estate - building.
3. The Innovative Methods Applied in the Practical Work: team learning, discussions.
4. The Assessment of the Practical Work:
The highest level of the
achievement of objectives
The medium level of the
achievement of objectives
The minimum level of the
achievement of objectives
Not achieved
objectives
10
9
The outside of the building
is measured using
electronic range finder,
building project at a scale
of M 1 : 500 is developed
applying GeoMap computer
software, building area and
perimeter are computed,
precision of the measured
line is evaluated.
8
7
The outside of the building
is measured using electronic
range finder, building
project at a scale of M 1 :
500 is developed applying
GeoMap computer software
and has errors, building area
and perimeter are
computed, precision of the
measured line is evaluated.
6
5
The outside of the
building is measured using
electronic range finder,
building project at a scale
of M 1 : 500 is developed
applying GeoMap
computer software and has
errors, building area is
computed, but perimeter is
not computed, precision of
the measured line is
evaluated.
4
3
2
1
The outside of the
building is measured
using electronic
range finder, building
project at a scale of
M 1 : 500 is
developed applying
GeoMap computer
software and has
errors, building area
and perimeter are not
computed, precision
of the measured line
is not evaluated.
The teacher specifies the measurement object of the locality.
The measurements are performed by groups of two or three students.
Each group selects an electronic range finder from geodetic laboratory, prepares it for work using
devise user manual and performs envisaged tasks.
Sequence of the practical work:
1. To measure the outside of the building using electronic range finder. The distance between
building angles is provided in table 2.1..
2. To develop a building project at a scale of M 1 : 500 applying GeoMap computer software.
3. To compute building area and perimeter.
4. To evaluate the precision of measured distances in table 2.2..
5. To prepare presentation of practical work.
Table 2.1.
Distances between building angles
Measured distance, m
Building
angles
I measurement
II measurement
average
1-2
19,052
19,053
19,05
2-3
3,341
3,342
3,34
3-4
2,960
2,960
2,96
4-5
3,744
3,742
3,74
5-6
2,941
2,943
2,94
6-7
6,772
6,773
6,77
7-8
1,682
1,684
1,68
8-9
3,401
3,400
3,40
9-10
1,271
1,271
1,27
10-11
2,722
2,724
2,72
11-12
2,981
2,981
2,98
12-13
3,273
3,272
3,27
13-14
6,571
6,572
6,57
14-15
4,752
4,751
4,75
15-16
8,590
8,591
8,59
16-17
4,971
4,972
4,97
17-18
2,712
2,712
2,71
18-19
3,154
3,152
3,15
19-20
1,732
1,731
1,73
20-21
3,241
3,241
3,24
21-22
3,031
3,031
3,03
22-23
14,610
14,611
14,61
23-24
3,612
3,611
3,61
24-1
2,021
2,020
2,02
Total
113,10
Building footprint – 607 m²
Table 2.2.
Distance measurement precision evaluation
Measured distance, m
Building
angles
I measurement
II measurement
Relative average
deviation of
measurement
1-2
19,052
19,053
19100
2-3
3,341
3,342
3300
3-4
2,960
2,960
-
4-5
3,744
3,742
-
5-6
2,941
2,943
-
6-7
6,772
6,773
6800
7-8
1,682
1,684
-
8-9
3,401
3,400
3400
9-10
1,271
1,271
-
10-11
2,722
2,724
-
11-12
2,981
2,981
-
12-13
3,273
3,272
3300
13-14
6,571
6,572
6600
14-15
4,752
4,751
4800
15-16
8,590
8,591
8600
16-17
4,971
4,972
5000
17-18
2,712
2,712
-
18-19
3,154
3,152
-
19-20
1,732
1,731
-
20-21
3,241
3,241
-
21-22
3,031
3,031
-
22-23
14,610
14,611
14600
23-24
3,612
3,611
3600
24-1
2,021
2,020
2000
Maximum relative error of measurement
2000
BUILDING PROJECT
PASTATO PROJEKTAS
M 1 : 500
2
1
23
24
3
4
5
6
MN
8
22
21
20
10
12
19
18
17
14
16
15
13
11
9
7
The project prepared by ______________group student
_________________________________________
QUESTIONS TO REPEAT:
1. What distance measuring instruments do you know?
2. What is the procedure of distance measurement using optical theodolite?
3. It is allowed to measure lines by electronic tachometer up to ...
4. What is the main condition for measurement of a line?
REFERENCES
Se
q.
No.
Publishing
year
Information source (publication)
author, title and identification number
Publishin
g location
and house
(a tick-mark shall mean availability of the
source)
Kaunas
Other
College
Study Rooms
libraries
library
Key Information Sources
1
2008
2
2012
2012
ŽIVATKAUSKAS, Aurelijus, et al.
Geodezija: mokymo(si) priemonė.
ISBN 978-9955-511-87-8. 329 p.
Alexander, Ross, CLARKE.
Geodesy.
ISBN 978-1290098762. 378 p.*
HARRY, L. Landscape Surveying.
ISBN 9781111310608. 256 p.*
3
4
5
2012
2011
Charles, D., GHILANI et al.
Elementary Surveying .
ISBN 978-0-13-255434-3. 984 p.*
Е., В., ЗОЛОТОВА;
Р., Н., СКОГОРЕВА.
Геодезия с основами кадастра.
ISBN 978-5-904954-04-8,
978-5-8291-1246-2. 416 p.*
Vilnius.
UAB
„Vaistų
žinios“
√
√
HardPress
Publishing
√
√
√
√
√
√
Академический
Проект,
Трикста
√
√
Technika
√
√
√
√
√
√
Department
of
Agricultural
Engineering,
Oklahoma
State
University,
USA
Westford
United States
of America
Additional Reading
1
1998
2
1996
3
1992
SKEIVALAS, Jonas. Elektroniniai
geodeziniai prietaisai
ISBN 9986-05-713-2. 193 p.
TAMUTIS, Zigmas. ir kiti.
Geodezija-2
ISBN 5-420-01331-2. 384 p.
TAMUTIS, Zigmas, et al.
Geodezija-1
Mokslo ir
enciklopedijų leidykla,
Mokslo ir
enciklope-
ISBN 5-420-01331-2. 292 p.
4
2011
5
2012
6
7
2003
2000
АЛЬБЕРТ, ГАМЗАТОВИЧ,
ЮНУСОВ, и др. Геодезия.
ISBN: 978-5-8291-1326-1,
978-5-98426-108-1. 409 p.*
TORGE, WOLFGANG; MÜLLER,
JÜRGEN. Geodesy.
ISBN 978-3-11-020718-7. 539 p.*
ERIK W. GRAFAREND,
FRIEDRICH W. KRUMM, VOLKER
S. SCHWARZE. Geodesy – The
Challenge of the 3rd Millennium.
ISBN-10: 3642077331. 487 p.*
Geodezijos ir kartografijos techninis
reglamentas. GKTR 2.08.01:2000:
statybiniai inžineriniai geodeziniai
tyrinėjimai
dijų leidykla
Издательство
"Академи
-ческий
Проект"
University of
Hannover,
Germany.
√
√
√
√
Springer –
Verlag
Berlin
Heidelberg
√
√
Valstybinė
geodezijos ir
kartografijos
tarnyba
√
√
Technika
√
√
Vilniaus
Gedimino
technikos
universitetas,
geodezijos
institutas
Kauno
kolegija
√
√
√
√
Periodicals
1
Geodezija ir kartografija.
ISSN 1392-1541
Geodesy and cartography.
ISSN 2029 – 6991*
2
Matavimų inžinerija ir GIS.
ISSN 2029-5790
Online Information Sources
1
http://www.nzt
2
http://www.topcon.lt
3
http://www.infoera.lt
3
* references for international students
Prepared by:
assistant Vincas Zakarauskas
Educational Institution: Kauno Kolegija/ University of Applied Sciences
Study Programme: Real Estate Measurement Engineering
Subject: Geodesy
PRACTICAL WORK NO. 3
TOPIC: MEASUREMENTS USING ELECTRONIC TACHOMETERS
1. The Aim of the Practical Work: to measure pickets using electronic tachometer, to prepare picket
measurement report and the list of point coordinates in WGS 84 coordinate system datum.
2. The Objectives of the Practical Work: to describe the tachometers available at the geodetic
laboratory, to designate fundamental differences between various types of tachometers, to get the
instrument ready to measure, to coordinate the pickets using electronic tachometer, to print the report
on picket measurement, to prepare the list of point coordinates according to the World Geodetic System
WGS 84.
3. The Innovative Methods Applied in the Practical Work: team learning, discussions.
The practical work is adapted for international students. Coordinated points are linked to the LKS 94
coordinate system. To use the data the geodetic and plane rectangular coordinates of points are
converted to WGS 84 coordinate system. WGS 84 coordinate system is widely used all over the world.
4. The Assessment of the Practical Work:
The highest level of the
achievement of objectives
10
9
The tachometers available at
the geodetic laboratory are
described, fundamental
differences between various
types of tachometers are
designated, the tripod with the
instrument on the base point is
set up, the instrument is
aligned and levelled, the
electronic tachometer is ON
and ready to measure, pickets
are coordinated, measurement
report is provided, the list of
point coordinates according to
The medium level of the
achievement of objectives
8
7
The tachometers available at
the geodetic laboratory are
described, fundamental
differences between various
types of tachometers are
designated, the tripod with the
instrument on the base point is
set up, the instrument is
aligned and levelled, the
electronic tachometer is ON
and ready to measure, pickets
are coordinated, measurement
report is provided, the list of
point coordinates according to
The minimum level of the
achievement of objectives
6
5
The tachometers available at
the geodetic laboratory are
described, fundamental
differences between various
types of tachometers are
designated, the tripod with
the instrument on the base
point is set up, the instrument
is aligned and levelled, the
electronic tachometer is ON
and ready to measure, pickets
are coordinated,
measurement report is not
provided, the list of point
Not achieved
objectives
4
3
2
1
The tachometers
available at the geodetic
laboratory are
described, fundamental
differences between
various types of
tachometers are not
designated, the tripod
with the instrument on
the base point is set up,
the instrument is
aligned and levelled,
the electronic
tachometer is ON and
WGS 84 coordinate system is WGS 84 coordinate system is
prepared.
not prepared.
coordinates according to
WGS 84 coordinate system
is not prepared.
ready to measure,
pickets are not
coordinated,
measurement report is
not provided, the list of
point coordinates
according to WGS 84
coordinate system is not
prepared.
Sequence of the practical work:
1. To describe the tachometers available at the geodetic laboratory.
2. To designate fundamental differences between various types of tachometers.
3. To set up the instrument on the snapshot base point;
4. To align and level the instrument.
5. To get the instrument ready to measure the pickets (points).
6. To prepare the report on picket measurement (fig. 3.1.).
7. To prepare the list of point coordinates according to the general (world) WGS 84 coordinate
system (table 3.1.).
8. To prepare presentation of practical work.
The teacher specifies the measurement object of the locality.
The measurements are performed by groups of three or four students.
Each group selects an electronic tachometer from geodetic laboratory, prepares it for work using
devise user manual. Each student measures ten pickets.
When the task is completed, each group holds a presentation.
Getting the tachometer ready for work:
- tachometer is set up on snapshot base point, aligned and levelled;
- instrument is switched on;
- air temperature and atmosphere pressure are set. These data is necessary to calculate measure
distance corrections;
- excitation of instrument horizontal limb and collimation eyepieces;
- new job is created.
Input of station parameters and measurements
Station parameters are input using tachometer user manual. The instrument will ask to input
station title (ST), height of instrument (HI), title of backsight station (BS) and azimuth (AZ). If local
coordinates are used, the AZ equals 0º00΄00΄΄. The most of tachometers require setting the coordinates
of station title (ST) and backsight station (BS), and then the azimuth (AZ) is automatically computed.
A prism is installed on the point of backsight station (BS) and vertical collimation to it is performed.
Verification is carried out according to the instructions provided is the user manual. Further, the pickets
are measured.
During rotation of the horizontal limb the reading of horizontal angle (HA) is displayed. When
eyepieces are rotated, the reading of vertical angle (VA) is displayed. Distance measuring key is
pressed for distance measurement. The tachometers with integrated non-prismatic distance
measurement may have two keys – for measurement with prism and laser waves.
Prism is set up to measure the picket. Vertical and horizontal collimation to prism centre is
performed and distance measurement key is pressed. The height of tripod of the prism (HT), title and
code of measured picket are entered and recorded by pressing REC or ENT key, depending on the type
of tachometer. Measurement results are automatically recorded to data storage unit. After picket
measurement is completed, readings of horizontal and vertical angle (HA,VA) are displayed, after
tilting – vertical and horizontal distance (SD,VD,HD). Coordinates of measured pickets are displayed
according to the coordinates of these stations. Other pickets are measured applying the same method.
Picket measurement report
CO.Nikon RAW data format V2.00
CO,12GDI01
CO,Description:
CO,Client:
CO,Comments:
CO,Downloaded 26-Aug-201116:49:27
CO,Software: Pre-install version: 1.10
CO,lnstrument: Nikon NPL-632
CO.Dist Units: Metres
CO.Angle Units: DDDMMSS
CO.Zero azimuth: North
CO,Zero VA: Zenith
CO,Coord Order: ENZ
CO,HA Raw data: HA zero to BS
CO.Tilt Correction: VA:ON HA:ON
CO, 12GDI01 <JOB> Created 12-Aug-201115:37:07
CO,S/N:020635
CO,Temp:18C Press:760mmHg Prism:0 12-Aug-201115:41:48
CO.HA set in Quick Station
ST,1„„1.7800,0.0000,0.0000
SS,2,1.8500,227.88,350.3335,89.5720,15:55:41,100
SS,3,1.8500,227.20,351.1824,89.5635,15:56:12,51
SS,4,1.8500,218.56,352.0100,89.5807,15:59:07,51
SS,5,1.8500,76.61,352.4657,89.3949,16:02:28,51
SS,6,1.8500,76.03,355.1604,89.3951,16:03:08,51
SS,7,1.8500,69.73,2.0803,89.2553,16:05:39,29
SS,8,1.8500,72.75,358.1622,89.3410,16:07:53,51
SS,9,1.8500,69.88,1.1150,89.2609,16:10:38,15
SS,10,1.8500,66.05,1.5424,89.2410,16:11:37,51
SS,11,1.8500,51.87,10.3018,89.2310,16:13:22,51
SS,12,1.8500,50.71,11.0202,89.1100,16:14:14,51
SS,13,1.8500,40.83,11.4142,89.0502,16:15:52,20
SS,14,1.8500,50.57,14.5540,89.1314,16:17:16,51
SS,15,1.8500,43.78,32.5331,89.0423,16:19:05,29
SS,16,1.8500,41.81,32.4939,89.0227,16:20:25,51
SS,17,1.8500„31.4706,88.5938,16:21:21,51
SS,18,1.8500,40.11,31.4707,88.5938,16:21:28,51
SS,19,1.8500,34.90,34.2346,88.5705,16:22:23,22
SS,20,1.8500,37.95,43.0117,89.1957,16:26:57,51
SS,21,1.8500,57.72,39.4128,89.2113,16:29:10,29
SS,22,1.8500,51.94,42.0206,89.2330,16:30:13,51
SS,23,1.8500,57.70,43.2301,89.1757,16:31:50,51
SS,24,1.8500,59.08,42.5931,89.2417,16:33:02,51
SS,25,1.8500,60.08,41.4709,89.2510,16:33:34,51
SS,26,1.8500,66.71,52.0932,89.3125,16:35:00,51
SS,27,1.8500,58.86,S1.4656,89.2243,16:35:57,51
SS,28,1.8500,58.80,57.3724,89.1746,16:37:03,51
SS,29,1.8500,58.88,61.4329,89.1509,16:38:00,51
55,30,1.8500,53.77,62.1858,89.1203,16:38:28,51
SS,31,1.8500,55.74,56.3610,89.0920,16:43:57,20
SS,32,1.8500„56.3610,89.0920,16:44:03,20
SS,33,1.8500,46.96,54.1256,89.0637,16:45:46,20
SS,34,1.8500,42.38,50.1608,89.1300,16:46:46,51
55,35,1.8500,46.97,63.0503,88.5420,16:47:56,51
SS,36,1.8500,26.13,57.4647,88.2543,16:50:00,15
SS,37,1.8500,24.87,50.3133,88.4802,16:51:07,15
SS,38,1.8500,24.92,56.0728,89.1015,16:52:18,15
SS,39,1.8500,22.23,56.2803,88.5846,16:53:19,15
SS,40,1.8500,22.24,49.5732,89.0239,16:54:12,15
Fig. 3.1. Picket measurement report
Table 3.1.
The list of point coordinates
WGS 84 coordinate system
Points
1
2
3
4
5
6
7
8
9
10
11
12
13
14
15
16
17
18
19
20
21
22
23
Geodetic coordinates, degrees
Φ
54,23869450
54,23867313
54,23870091
54,23887009
54,23877590
54,23869137
54,23865537
54,23853220
54,23869108
54,23849211
54,23837699
54,23828214
54,23818933
54,23809671
54,23820782
54,23829300
54,23838486
54,23869161
54,23844960
54,23850515
54,23868578
54,23857274
54,23861757
λ
24,91260150
24,91258700
24,91264759
24,91254254
24,91265365
24,91260281
24,91254314
24,91244876
24,91260308
24,91238376
24,91226615
24,91217106
24,91199488
24,91194949
24,91202828
24,91214727
24,91224251
24,91260389
24,91233536
24,91242798
24,91260346
24,91249984
24,91253671
24
54,23867575
24,91258937
ADDITIONAL MATERIAL FOR COMPLETION OF THE PRACTICAL WORK
It is recommended to ascribe special codes to the measured pickets during the operation with
electronic tachometers. Coding system is necessary to see the conventional sign block when working
with computer software. Some codes of the point conventional signs recognized by GeoMap software
are provided in table 3.2.
Table 3.2.
GeoMap codes for some of the points
No.
Point title
Code
No.
1.
2.
3.
4.
5.
6.
7.
8.
9.
10.
11.
12.
13.
14.
15.
16.
17.
18.
19.
20.
Movement point
Reinf. concrete border column
Wooden border column
Temporary border column
Electrical support (low voltage)
Electrical support (high voltage)
Street lamp
Well
Cover
Road sign
Broadleaf tree
Narrow-leaved tree
Fir tree
Pine tree
Cedar
Fruit tree
Single bush
Communication well
Water supply well
Sewage cover
1
2
3
4
12
13
14
15
16
17
1S
20
21
22
23
24
25
33
35
37
21.
22.
23.
24.
25.
26
27.
28.
29.
30.
31.
32.
33.
34
35.
36.
37.
3S.
39.
40.
Point title
Storm runoff cover
Heat chamber cover
Gas pipeline cover
Drainage well cover
Artesian well
Communication support
Monuments
Fountain
Semaphore
Traffic light
Countdown marker
Road sign
Bus station
Religious signs
Coupling
Valve
Grating
Signpost
Polygonal point
Wall benchmark
QUESTIONS TO REPEAT:
•
What are the main components of electronic tachometer?
•
What characteristics are used to describe the precise electronic tachometers?
Code
371
40
44
45
46
49
52
54
55
56
60
61
62
63
69
70
71
72
100
103
•
What is measured by electronic tachometers?
•
What is the procedure of preparation of the electronic tachometer for measurements?
•
What readings are displayed after picket measurements?
•
What is the aim of picket codes?
REFERENCES
Se
q.
No.
Publishing
year
Information source (publication)
author, title and identification number
Publishin
g location
and house
(a tick-mark shall mean availability of the
source)
Kaunas
Other
College
Study Rooms
libraries
library
Key Information Sources
1
2008
2
2012
3
2012
4
2012
5
2011
ŽIVATKAUSKAS, Aurelijus, et al.
Geodezija: mokymo(si) priemonė.
ISBN 978-9955-511-87-8. 329 p.
Alexander, Ross, CLARKE.
Geodesy.
ISBN 978-1290098762. 378 p.*
HARRY, L. Landscape Surveying.
ISBN 9781111310608. 256 p.*
Charles, D., GHILANI et al.
Elementary Surveying .
ISBN 978-0-13-255434-3. 984 p.*
Е., В., ЗОЛОТОВА;
Р., Н., СКОГОРЕВА.
Геодезия с основами кадастра.
ISBN 978-5-904954-04-8,
978-5-8291-1246-2. 416 p.*
Vilnius.
UAB
„Vaistų
žinios“
√
√
HardPress
Publishing
√
√
√
√
√
√
Академический
Проект,
Трикста
√
√
Technika
√
√
√
√
√
√
Springer –
Verlag
Berlin
Heidelberg
√
√
Valstybinė
√
√
Department
of
Agricultural
Engineering,
Oklahoma
State
University,
USA
Westford
United States
of America
Additional Reading
1
1998
2
1996
3
2011
4
2003
5
2000
SKEIVALAS, Jonas. Elektroniniai
geodeziniai prietaisai
ISBN 9986-05-713-2. 193 p.
TAMUTIS, Zigmas. ir kiti.
Geodezija-2
ISBN 5-420-01331-2. 384 p.
АЛЬБЕРТ, ГАМЗАТОВИЧ,
ЮНУСОВ, и др. Геодезия.
ISBN: 978-5-8291-1326-1,
978-5-98426-108-1. 409 p.*
ERIK W. GRAFAREND,
FRIEDRICH W. KRUMM, VOLKER
S. SCHWARZE. Geodesy – The
Challenge of the 3rd Millennium.
ISBN-10: 3642077331. 487 p.*
Geodezijos ir kartografijos techninis
Mokslo ir
enciklopedijų leidykla,
Издательство
"Академи
-ческий
Проект"
reglamentas. GKTR 2.08.01:2000:
statybiniai inžineriniai geodeziniai
tyrinėjimai
geodezijos ir
kartografijos
tarnyba
Periodicals
1
Geodezija ir kartografija.
ISSN 1392-1541
Geodesy and cartography.
ISSN 2029 – 6991*
2
Matavimų inžinerija ir GIS.
ISSN 2029-5790
Online Information Sources
1
http://www.nzt
2
http://www.topcon.lt
3
http://www.gpspartneris.lt
4
http://www.infoera.lt
5
http://www.geoportalas.lt
6
http://www.gsb.lt
3
Technika
√
√
Vilniaus
Gedimino
technikos
universitetas,
geodezijos
institutas
Kauno
kolegija
√
√
√
√
* references for international students
Prepared by:
assistant Vincas Zakarauskas
Educational Institution: Kauno Kolegija/University Of Applied Sciences
Study Programme: Real Estate Measurement Engineering
Subject: Geodesy
PRACTICAL WORK NO. 4
TOPIC: PLANNING IN GEOMAP SOFTWARE
1. The Aim of the Practical Work: to create topographic map, to prepare the lists of point coordinates
according to LKS 94 and WGS 84 coordinate systems.
2. The Objectives of the Practical Work: to select an electronic tachometer from geodetic laboratory;
to link N area to geodetic base points, to measure map points applying polar method, to perform
calculations of coordinates using GeoMap software, to develop a project – topographic map using
GeoMap software, to transform point coordinates from LKS 94 coordinate system to WGS 84 (eng.
World Geodetic System, 1984) coordinate system, to prepare the lists of point coordinates according to
LKS 94 and WGS 84 coordinate systems.
3. The Innovative Methods Applied in the Practical Work: team learning, discussions.
The practical work is also applied for international students. Lithuanian and international students
prepare the list of point coordinates of WGS 84 coordinate system.
4. Assessment of the Practical Work:
The highest level of the
achievement of objectives
10
9
N area is linked to geodetic
base points, pickets are
measured applying polar
method, coordinates are
calculated, topographic map is
created, report on picket
(point) measurement and list
of point coordinates of WGS
84 coordinate system are
prepared.
The medium level of the
achievement of objectives
8
7
N area is linked to geodetic
base points, pickets are
measured applying polar
method, calculation of
coordinates is wrong,
topographic map is created,
report on picket (point)
measurement and list of point
coordinates of WGS 84
coordinate system are
prepared.
The minimum level of the
achievement of objectives
6
5
N area is linked to geodetic
base points, pickets are
measured applying polar
method, calculation of
coordinates is wrong,
topographic map is not
completely created, report on
picket (point) measurement
or list of point coordinates
of WGS 84 coordinate
system are not prepared.
Not achieved
objectives
4
3
2
1
N area is linked to
geodetic base points,
pickets are measured
applying polar method,
calculation of
coordinates is wrong,
topographic map is not
created or only part of
the map is created,
report on picket (point)
measurement and list
of point coordinates of
WGS 84 coordinate
system are not prepared.
The teacher specifies the measurement object of the locality.
The measurements are performed by groups of three or four students.
Each group selects a tachometer from geodetic laboratory, prepares it for work using devise user
manual and performs survey of the territory. Each student measures ten pickets.
Each student individually create topographic map.
When the task is completed, each group holds a presentation on the practical work.
Sequence of the practical work:
1. To select electronic tachometer from geodetic laboratory.
2. To select and set out geodetic base points of N object of the locality.
3. To link the coordinates of geodetic base points to LKS 94 coordinate system.
4. To measure pickets applying polar method.
5. To create locality sketch plan in the course of measurement.
6. To import measurement data to computer – to new job.
7. To process the data with GeoMap software.
8. To create a M 1 : 500 scale topographic map - project using GeoMap software (fig. 4.1.).
9. To transform LKS 94 coordinates of pickets to WGS 84 coordinates.
10. To prepare report on picket (point) measurement (fig. 4.2.).
11. To create the list of picket (point) coordinates according to WGS 84 coordinate system (fig.
4.3.).
12. Created job is saved in computer data medium.
13. To prepare a presentation.
TOPOGRAPHIC MAP
M 1 : 500
Fig. 4.1. Topographic map
REPORT ON PICKET (POINT) MEASUREMENT
Fig. 4.2. Report on picket (point) measurement
LIST OF PICKET (POINT) COORDINATES
WGS 84 COORDINATE SYSTEM
Points
1
2
3
4
5
6
7
8
9
10
11
12
13
14
15
16
17
18
19
20
21
22
23
24
Geodetic coordinates, degrees
Φ
Λ
54,23869450
24,91260150
54,23867313
24,91258700
54,23870091
24,91264759
54,23887009
24,91254254
54,23877590
24,91265365
54,23869137
24,91260281
54,23865537
24,91254314
54,23853220
24,91244876
54,23869108
24,91260308
54,23849211
24,91238376
54,23837699
24,91226615
54,23828214
24,91217106
54,23818933
24,91199488
54,23809671
24,91194949
54,23820782
24,91202828
54,23829300
24,91214727
54,23838486
24,91224251
54,23869161
24,91260389
54,23844960
24,91233536
54,23850515
24,91242798
54,23868578
24,91260346
54,23857274
24,91249984
54,23861757
24,91253671
54,23867575
24,91258937
Planar rectangular coordinates, m
X
Y
3388217,927
1573664,253
3388220,076
1573664,208
3388216,136
1573666,734
3388205,161
1573654,085
3388209,826
1573664,239
3388218,147
1573664,449
3388222,735
1573662,291
3388235,417
1573661,395
3388218,163
1573664,476
3388240,487
1573659,077
3388253,148
1573656,502
3388263,531
1573654,488
3388275,973
1573647,601
3388284,806
1573648,440
3388273,540
1573648,872
3388263,294
1573652,668
3388253,153
1573654,805
3388218,098
1573664,504
3388245,299
1573657,832
3388238,204
1573661,196
3388218,588
1573664,700
3388230,694
1573662,873
3388226,008
1573663,348
3388219,796
1573664,249
Fig. 4.3. List of picket (point) coordinates, WGS 84 coordinate system
ADDITIONAL MATERIAL FOR COMPLETION OF THE PRACTICAL WORK
GeoMap is InfoEra product compatible with Autodesk Inc. Created on AutoDesk Map. This
program enables efficient management of field measurement data.
Scale
Drawing scale and conversion commands are triggered by clicking menu Geo → Scale or from
toolbar Mastelis (Scale):
– keys are used to change drawing scale to 1:100, 1:200, 1:500, 1:1000,
1:2000, 1:5000, 1:10000.
– key is used to change drawing scale by typing in the scale at the command prompt.
– key for scale conversion. The command changes the scale of blocks and text and global weight
of line if it is not equal to 0. The properties of dynamic blocks also change. Scale conversion is
performed even if existing scale coincide with the converted one. If the scale is changed to 500, then
scale parameter of a block is set to 0,5, if 1000 – to 1 and etc.. When triggering the command, it is
necessary to specify the blocks to be converted – visus (all) or only prasidedančius skaičiumi (started
from number), and select new scale.
– key used for drawing review on A3 or A4 paper format. If the drawing does not fit A3 or A4
paper, it can be reduced, enlarged, or drawing centre can be changed. Open command menu and
proceed with the following steps:
•
Select the format – A3 or A4.
•
Specify centre of site plan.
•
Reduce or enlarge the scale (100, 200, 500, 1000, 2000, 5000, 10000). Adjust the centre if
necessary. If you want to finish customizing the scale press Baigti (Finish).
•
To convert the same scale to the drawing select Taip (Yes) or opposite Ne (No).
•
After selection of conversion of objects the programme will ask what objects are to be
converted – all or started from number.
•
Then to save current drawing select Taip (Yes) or Ne (No).
When these steps are completed, the programme sets up the scale and converts objects, if conversion of
blocks is also selected.
Import of points
Import of pickets from text file is performed through command menu. The command is triggered
in several ways:
•
by clicking menu command Geo → Taškų importas (Geo → Point import);
•
by pressing
•
by typing in command GEOMAP_TASKU_IMPORTAS at the command prompt.
key on Geo toolbar;
After command triggering a box appears with text file with information about the pickets. After
required file is selected Open key is pressed. After these steps the pickets will be imported to the
drawing.
Symbols
Use Geo → Ženklai (Geo → Symbols) menu or Toolbar Ženklai (Symbols) to select symbols
and insert functions:
Meanings of Toolbar icons:
– taškinių ženklų dėjimas su ženklo pasirinkimo dialogu/dot symbols with symbol selection dialog;
– taškinių ženklų dėjimas be ženklo pasirinkimo dialogo/dot symbols without symbol selection
dialog;
– linijinių ženklų dėjimas su ženklo pasirinkimo dialogu/line symbols with symbol selection
dialog;
– linijinis ženklas per taškų numerius/line symbol by point numbers;
– linijinių ženklų dėjimas be ženklo pasirinkimo dialogo/line symbols without symbol selection
dialog;
– vartotojo pasirinkto sutartinio linijinio ženklo dėjimas/user-selected line symbol;
– plotinių ženklų dėjimas su ženklo pasirinkimo dialogu/area symbols with symbol selection
dialog;
– plotinių ženklų dėjimas be ženklo pasirinkimo dialogo/area symbols without symbol selection
dialog;
– šlaito braižymas/draw the slope;
– sklypo ribos braižymas/site boundary drawing;
– naudmenų ribos braižymas/land boundary drawing;
– vienodo kodo piketų apjungimas/linking of same code pickets.
Note. The Ženklai (Symbols) toolbar of GeoMap previous version included commands: „Juostinių
ženklų dėjimas su ženklo pasirinkimo dialogu“/„Strip symbols with symbol selection dialog“ and
„Juostinių ženklų dėjimas be ženklo pasirinkimo dialogo“/„Strip symbols without symbol selection
dialog“. In 2008 version these command are revealed. They should be removed in the future because of
presence of line symbols placement command. It is still possible to trigger „Juostinių ženklų dėjimas su
ženklo pasirinkimo dialogu“/„Strip symbols with symbol selection dialog“ and „Juostinių ženklų
dėjimas be ženklo pasirinkimo dialogo“/„Strip symbols without symbol selection dialog“ commands in
the command line by entering appropriate name. Read about these commands in section „Juostinių
ženklų braižymas“/„Strip Symbol Drawing“.
More:
Taškinių ženklų dėjimas
Dot symbols
Linijinių ženklų dėjimas
Line symbols
Linijinis ženklas per taškų numerius
Line symbol by point numbers
Apsaugos vamzdžio braižymas
Protective pipe drawing
Plotinių ženklų dėjimas
Area symbols
Juostinių ženklų braižymas
Strip symbol drawing
Šlaito braižymas
Slope drawing
Dažniausiai naudojamas šlaitas
Predominant slope
Sklypo ribos braižymas
Site boundary tracing
Naudmenų ribos braižymas
Agricultural land boundary drawing
Vienodo kodo piketų apjungimas
Connection of same code pickets
Import
In dialog box Matavimų duomenys (Measurement data) key Importuoti (Import)
or menu
Veiksmai → Importuoti (Actions → Import) are used for data import from electronic tachometers. Call
the command and see a dialog box where select the file from which the data must be imported. Also
select required measurement device:
The data is imported to traverse levelling dialog. Format file structure is described in section
Formatų failo struktūra (Format file structure).
Traverse management
The command is invoked by pressing
key.
It is used during the import of measured data from devices without indicating fixed points. As
the command for data import of traverse adjustment activates an automatic marking of traverse with
input of data, lack of information about fixed points will lead to unmarked traverse. Thus, fixed points
must additionally be uploaded or entered, and the command „Sužymėti ėjimą“ (Mark traverse) must be
invoked to automatically stake out traverse points. This function is also used in any other cases when it
was detected that the marking did not resume after certain actions.
Unmarked traverse in the surveying log
Marked traverse in the surveying log
Selecting planimetric traverse
Planimetric traverse points are marked by double left click on a mouse on the number of
selected row in “Matavimų žurnalas”(Surveying log) of “Matavimų duomenys” (Surveying data) dialog
box (see the fig. below):
First of all, select the surveying from the first station to a fixed point; direction angle is
indicated by the surveying. Further, stake out remaining traverse points so that the second stations
would be observed from the selected one (see the fig. below):
Bold blue line stands for direction angle from the first station to the fixed point.
Blue colour stands for traverse. Black colour stands for neutralling of traverse
stations. Surveyed points are marked with green colour. Traverse direction is
indicated by arrows.
Transformation of objects
To transform the objects from a drawing select Objektų transformavimas (Transform objects)
tab:
Here press the Žymėti objektus
(Select objects) key. Indicate the area of objects to be
transformed between coordinate systems or select the objects one by one on the drawing. Then press
ENTER button on the keyboard or make a right click on a mouse. After these steps you will see the
objects selected for transformation.
Nekeisti objektų pasukimo kampo (jeigu jis lygus 0) (Do not change deflection angle of the
objects (if it is 0) function may be selected to leave the objects undeflected.
Transformation of coordinates
To transform the coordinates of one point between coordinate systems select Koordinatės
transformavimas (transform coordinate) tab:
Enter the coordinate of point X to X field of the dialog box, and Y coordinate - to Y field. The
point may also be indicated on a drawing using a mouse by pressing
key.
To save transformed coordinates to result file tick Rezultatus rašyti į failą (Record results to
the file) and press
located next to Rezultatų failas (Result file) line, indicate the file. Find the
structure of the file in section Rezultatų failo struktūra (Result file structure).
If the result is recorded to the file, indicate the number of transformed point in Nr. (No.) field.
Result file may contain more than one record, therefore the points should be numbered.
When the results are obtained, centre coordinate may be entered to the table (the table is
invoked by entering GEOMAP_LENTPILDYMAS_UZKRAUTI to command prompt). Note: it is
possible to enter centre coordinate in GeoMap software only. The accuracy of coordinates is taken from
GeoMap settings. In case the set accuracy is higher of that in Transformation dialog box, use the latter.
Note. Geographical coordinates must be expressed in degrees prior to transformation, i.e. to
translate minutes and seconds to degree measure. E.g.: coordinate 30o 30’ is translated to 30,50;
coordinate 30o07.30’ (30o07’30”) is translated to 30,125. X coordinate refers to eastern longitude, Y
coordinate – to northern latitude.
Intersections (triangulation)
The intersections are found in menu option Geo → Užkirčiai (Geo → Intersections) or toolbar
Užkirčiai (Intersections):
Meanings of icons:
– linijinis užkirtis / line intersection;
– kampinis-linijinis užkirtis / angular-line intersection;
– polinis užkirtis / polar intersection;
– polinis užkirtis nuo bet kurio taško / polar intersection from any of the points;
– kampinis užkirtis / angular intersection;
– kampinis užkirtis nuo bet kurio taško / angular intersection from any of the points;
– potenoto užkirtis / inverse geodetic intersection.
– pririšimas prie žinomo taško užkirtis / known point dimensioning intersection.
More:
Linijinis užkirtis;
line intersection;
Kampinis-linijinis užkirtis;
angular-line intersection;
Polinis užkirtis;
polar intersection;
Polinis užkirtis nuo bet kurio taško;
polar intersection from any of the points;
Kampinis užkirtis;
angular intersection;
Kampinis užkirtis nuo bet kurio taško;
angular intersection from any of the points;
Potenoto užkirtis;
inverse geodetic intersection;
Pririšimas prie žinomo taško užkirtis.
known point dimensioning intersection.
Comments
To trigger commands for comments and annotations use menu option Geo → Užrašai (Geo →
Comments) or toolbar Užrašai (Comments). The Užrašai (Comments) toolbar is as follows:
Meaning of toolbar icons:
– paprasto teksto rašymas / common text input;
– užrašų iškėlimas ant kitų objektų / placement of comments on other objects;
– užrašo anotacija / annotation to comment;
– figūros ploto užrašymas / enter figure area;
– figūros ploto su tikslumu užrašymas / enter figure area with accuracy;
– srities ploto užrašymas / enter region area;
– srities ploto su tikslumu užrašymas / enter region area with accuracy;
– ploto anotacija / annotation to area;
– koordinačių užrašymas / enter coordinates;
– koordinačių užrašas su išnaša / enter coordinates with a note;
– koordinatės anotacija / annotation to coordinate;
– linijų atstumų užrašas / line distance comment;
– linijų anotacijos / annotations to lines;
– linijų anotacijos su lentele / annotations to lines with table;
– kampo užrašas / angle comment;
– piketo numerio užrašas / picket number;
– koordinačių tinklelio sudėjimas / making coordinate grid;
– koordinačių tinklelio sudėjimas nurodytoje srityje (taškais) / making coordinate grid on specified
area (points);
– koordinačių tinklelio sudėjimas nurodytoje srityje (linijomis) / making coordinate grid on
specified area (lines);
– koordinačių tinklelio anotacija / annotation to coordinate grid;
– teksto modifikavimas / modifying the text;
– teksto storinimas / bold text;
More:
Paprasto teksto rašymas / common text input;
Užrašų iškėlimas ant kitų objektų / placement of comments on other objects;
Užrašo anotacija / annotation to comment;
Figūros ploto užrašymas / enter figure area;
Figūros ploto su tikslumu užrašymas / enter figure area with accuracy;
Srities ploto užrašymas / enter region area;
Srities ploto su tikslumu užrašymas / enter region area with accuracy;
Ploto anotacija / annotation to area;
Koordinačių užrašymas / enter coordinates;
Koordinačių užrašas su išnaša / enter coordinates with a note;
Koordinatės anotacija / annotation to coordinate;
Linijų atstumų užrašas / line distance comment;
Linijų anotacijos / annotations to lines;
Linijų anotacijos su lentele / annotations to lines with table;
Kampo užrašas / angle comment;
Piketo numerio užrašas / picket number;
Koordinačių tinklelio sudėjimas / making coordinate grid;
Koordinačių tinklelio sudėjimas nurodytoje srityje (taškais) / making coordinate grid on specified
area (points);
Koordinačių tinklelio sudėjimas nurodytoje srityje (linijomis) / making coordinate grid on specified
area (lines);
Koordinačių tinklelio anotacija / annotation to coordinate grid;
Teksto modifikavimas / modifying text;
Teksto storinimas / bold text.
Making coordinate grid
The command helps to make a coordinate grid with indication of coordinates if required.
The command is invoked in several ways:
•
through menu Geo → Užrašai → Koordinačių tinklelis (Geo → Comments → Coordinate
•
from the toolbar Užrašai (Comments) by pressing
grid);
;
•
by entering GEOMAP_UZRASAI_TINKLAS to command prompt.
The following steps:
1. Use left button of a mouse to indicate required network points (to call coordinate grid
annotation settings press „X“).
2. Use right button of a mouse to end network set out.
3. If network coordinates are required press ENTER, or press Ne (no) to quit the command.
4. If ENTER is pressed, use left button of a mouse to indicate network point that needs
coordinates to be specified.
5. Use left button of a mouse to indicate the deflection angle of X coordinate comment and
place the comment to required location.
6. Enter Y coordinate according to step 5.
7. If other coordinates of the map are required, repeat activities from step 4.
8. To quit the command press ENTER.
A symbol for coordinate grid is taken from koordinačių tinklelio nustatymuose (coordinate grid
settings).
Coordinate grid annotation
The command is used to make coordinates of angles of coordinate grid.
The command is invoked in several ways:
•
through menu Geo → Užrašai → Koordinačių tinklelio anotacija (Geo → Comments →
Coordinate grid annotation);
;
•
from the toolbar Užrašai (Comments) by pressing
•
by entering GEOMAP_KOORDTINKLELIS to command prompt.
The following steps:
1. To make comments automatically [Taip/Ne/nUstatymai] ([Yes/No/Settings]). <Taip>
(<Yes>): - the comments will be automatically made. Otherwise:
a. Specify deflection angle of X comment
b. Move X comment to required location
c. Specify deflection angle of Y comment
d. Move Y comment to required location.
To open settings for coordinate grid annotation, press „U“.
2. Indicate points <ENTER-pabaiga> (<ENTER-end>): - indicate points using a mouse to
place annotations to these points.
3. To quit the command press ENTER.
The symbol for coordinate grid is taken from koordinačių tinklelio nustatymuose (coordinate
grid settings).
Interpolation
The command is used to calculate the height between two points. The heights of pickets P1 and
P2 are known. Heights between these pickets are calculated according to the level of shown horizontal
lines.
The command is invoked in several ways:
•
through menu Geo → Aukščiai → Interpoliavimas (Geo → Heights → Interpolation);
•
from the toolbar Informacija (Information) by pressing
•
by entering GEOMAP_AUKSCIAI_INTERPOLIAVIMAS to command prompt.
;
The following steps:
1. Use keyboard to enter the level of horizontal lines and press ENTER (press „X“ to open the
settings). Level of horizontal lines is a difference between heights determining the interval of setting
out height points in meters.
2. Use keyboard to enter the minimum height and press ENTER. Minimum height is a
reference height to start calculating other heights.
3. Indicate the first picket P1. If well indicated, press ENTER, otherwise press Ne (No) and
reindicate the picket.
4. Similarly to step 3, indicate the second picket P2.
5. Select Taip (Yes) to question Ar koreguosite taškų aukščių reikšmes?(Would you like to adjust
point height?) to change the altitudes of pickets P1 and P2. By pressing Ne (No), the altitudes of
pickets P1 and P2 are left unchanged.
6. Then calculate the heights.
7. Repeat the command from the 3rd step. To quit the command press ENTER.
Drawing horizontal lines
The command is used to draw horizontal lines. The height of each horizontal line is indicated in
brackets in the figure below (linked points are of the same height).
The command is invoked in several ways:
•
through menu Geo → Aukščiai → Horizontalių braižymas (Geo → Heights → Drawing
horizontal lines);
•
from the toolbar Informacija (Information) by pressing
;
•
by entering GEOMAP_AUKSCIAI_HORIZONTALES to command prompt.
The following steps:
1. Use keyboard to enter the height of horizontal line and press ENTER (press „X“ to open the
settings).
2. Markers indicating all pickets of the height appear.
3. Link required pickets. The function of linkage is analogous to the boundary linkage, but the
line must be levelled after the linkage is completed.
4. Repeat the command from the 1st step. To quit the command press ENTER.
Comment annotation
The command is used to leave a comment on the drawing. The comment is made according to
the Geo settings užrašo anotacijos nustatymus (comment annotation settings). Text style, layer, size,
deflection angle, graphical code and use/do not use footnote parameters are set. The command is
invoked in several ways:
through menu Geo → Užrašai → Užrašo anotacija (Geo → Comments → Comment
•
annotation);
;
•
from the toolbar Užrašai (Comments) by pressing
•
by entering GEOMAP_UZRASUANOTACIJOS to command prompt.
The following steps:
1. Indicate the type of text binding in the command line. Binding type may include vidurys
(middle), centras (centre), dešinys (right), kairys (left) and įtalpint (fit). For the meaning of each type
refer to section Paprasto teksto rašymas (Common text input). Press „X“ to open comments settings.
2. Use the keyboard to enter standard comment and press ENTER.
3. Use the mouse to indicate the location of the comment on a drawing.
4. If the comment with a note is set, indicate the location of annotation.
5. Repeat the command from the 2nd step. To quit the command select Pabaiga (End) and press
ENTER.
Line distance comment
The command is used to specify the distance between two indicated points. Distance comment
is turned according to the line or indicated angle. Deflection type is specified in linijos anotacijos
nustatymuose (line annotation settings). The annotation is also rounded to the accuracy specified in
linijos anotacijos nustatymuose (line annotation settings).
The command is invoked in several ways:
•
through the menu Geo → Užrašai → Linijų atstumai (Geo → Comments → Line distance);
•
from the toolbar Užrašai (Comments) by pressing
•
by entering GEOMAP_UZRASAI_ATSTUMAI to command prompt.
;
The following steps:
1. Indicate the reference point. If the picket is indicated, press ENTER, otherwise press Ne (No)
and repeat picket indication procedure.
2. Similarly to step 1, indicate the second reference picket.
3. Line length is entered. To confirm press ENTER or enter required line length and press
ENTER. Press „X“ to open line annotation settings.
4. Use the left button of a mouse to appropriately locate the comment.
5. Repeat the command from the 1st step. To quit the command press ENTER.
Modifying the text
The command opens text editor and allows for editing the selected text. The command is
invoked in several ways:
•
through the menu Geo → Užrašai → Tekstas → Modifikavimas (Geo → Comments → Text
→ Modify);
•
from the toolbar Užrašai (Comments) by pressing
•
by entering DDEDIT to command prompt.
;
Text object to be corrected must be selected after the command was triggered by mouse. Text
editor opens after selection of text. Edit the text and press OK.
Traverse adjustment commands
Traverse adjustment toolbar:
The same commands are invoked both from the toolbar and menu. Fast one click invoking is
available from the toolbar.
užkrauti
duomenis/import data
Command is used to import the data from a file.
pridėti ėjimą/add
traverse
saugoti/save
Command is used to save data in the same file used for data import.
saugoti kaip.../save as...
Command is used to save data in a file with new name.
Iškirpti/cut
pridėti eilutę/insert row
Command is used to cut selected rows from traverse measured data
dialog box.
Command is used to copy selected rows from traverse measured data
dialog box.
Command is used to paste copied rows to selected place in traverse
measured data dialog box.
Command is used to insert empty row at the end.
Atstatyti/undo
Command is used to undo step.
lyginti/adjust
Command is used to perform traverse adjustment.
importuoti/import
Command is used to import the data from measuring devices. This
function uses data import settings.
Command is used to import the reference points from selected „*.dat“
file.
Kopijuoti/copy
Įterpti/paste
užkrauti pagrindo
taškus/import reference
points
pridėti pagrindo tašką iš
brėžinio/add reference
point from drawing
tvirtų taškų Z kontrolė/z
control of fixed points
atstumų
vidurkinimas/distance
averaging
sužymėti ėjimą/set out
traverse
išvalyti duomenis/erase
data
keisti kodus/change
codes
surasti pagrindo ir
orientavimo taškus/find
reference and orientation
points
atrinkti kodus/select
codes
nustatymai.../settings...
pagalba./help
Command is used to add additional data (e.g. add inverse) from a file.
Command is used to import the reference point from a drawing.
Command is used to perform Z control of fixed points according to
specified accuracy.
Command is used to perform distance averaging according to specified
accuracy.
Command is used to automatically set out traverse points.
Command is used to erase the data and geodetic base points from
surveying log.
Command is used to change the code of geodetic base point.
Command is used to find reference and orientation points on drawings
according to picket number and import to the list of reference points.
Command selects symbols and their descriptions according to the code on
an instrument in tables of surveying log and geodetic base points, column
„Kodas“ (Code).
Command is used to open Geo settings.
Command is used to call user’s manual.
Printing parameters and plans
The function is used to print italic tables. This command allows for faster printing process and
reduction of paper consumption.
The command is invoked in several ways:
•
through menu Geo → Spausdinimo parametrai ir planai (Geo → Printing parameters and
•
from toolbar „Geo“ by pressing
•
by entering GEOMAP_IRANKIAI_SPAUSDINIMO_PARAM to command prompt.
plans).
.
Three points must be indicated on the drawing under the command: taskas1, taskas2 and taskas3.
When points are indicated, dialog box „Spausdinimo parametrai“ (Printing parameters) is opened:
Dialog box „Printing parameters“
All printers from file „Spausdintuvai2.ini“ are listed in field „Spausdintuvas“ (Printer). File
example:
Description in
Explanation
file
HP DesignJet
printer
430
420
Paper width
20
Left margin
10
Right margin
10
Top margin
10
Bottom margin
Appropriate actions must be taken to perform certain calculations: open dialog box
„Spausdinimo parametrai“ (Printer parameters), select another printer, press ENTER button, when
mouse cursor is in the field „Nuo popieriaus krašto“ (From the edge of the paper), change the scale.
Hereafter calculations and actions take place in the dialog box „Spausdinimo parametrai“(Printer
parameters):
1. Printer parameters are set as follows:
a. If the printer is not set, select the first one from the list; the printer is described in file
„Spausdintuvas2.ini“.Otherwise set printer is used.
b. Enter paper width parameters of the selected printer to the following fields: Kiti parametrai
→ Popieriaus plotis (Other parameters → Paper width) and Popierius → Plotis (Paper → Width).
c. Margins are automatically set in „Paraštės“ (Margins):
Margin settings
2. If there are no entered values in „Kiti parametrai“ (Other parameters), „Nuo popieriaus
krašto“(From the edge of the paper), default value is set 20.
3. The following optional values are provided in the „Mastelis“ (Scale) list: 250; 500; 1000;
2000. Unless other value is set, default value is entered 250.
4. Paper length and offset coordinates are calculated.
When closing „Spausdinimo parametrai“ (Printing parameters) by pressing „Baigti“ (End) key,
the calculations are output in command bar:
Paper size: Width x Length.
Set LTSCALE = didKoef before printing.
By pressing „Sukurti maketą“ (Create a layout) Viewports creation dialog opens:
Layout creation dialog box
Open dialog box „Maketo kūrimo parametrai“ (Layout creation parameters) and select the first
available Layout name. All existing names are loaded to the opened list. Press „Baigti” (End) button,
and the calculations will be output in the command bar (the same as for printing parameters). The
following actions are performed by pressing „Vykdyti“ (Run):
1. If the option „Sukurti naują maketą“ (Create new layout) is selected:
a. a layout with entered name is created.
b. viewport in new layout is created.
c. height and width (viewAukstis, viewPlotis) are set for new viewport.
d. centre coordinates (viewCentrasX, viewCentrasY) are set for new viewport.
e. viewport is enlarged to the points: taskas1 and taskas2.
f. the calculations are output in the command bar (the same as for printing parameters after
pressing „Baigti“ (End)).
2. If the option „Sukurti naują peržiūros langą“(Create new viewport) is selected:
a. Viewport is created in selected layout.
b. height and width (viewAukstis, viewPlotis) are set for new Viewport.
c. centre coordinates are set for new Viewport.
d. custom scale = didKoef is set for new Viewport.
e. Viewport is enlarged to the points: taskas1 and taskas2.
f. the calculations are output in the command bar (the same as for printing parameters after
pressing „Baigti“ (End)).
QUESTIONS TO REPEAT:
1. What is the procedure of preparation of electronic tachometer for surveying?
2. What is a tachometry map?
3. What is the base of tachometry map?
4. What are the functions of GeoMap software command traverse adjustment?
5. What commands are used to layout the pickets?
6. How are the buildings drawn from the command Namų braižymas ratu (Circular drawing of
buildings)?
7. What conventional symbols belong to the group of dotted symbols?
8. What conventional symbols belong to the group of linear symbols?
9. What conventional symbols belong to the group of areal symbols?
10. What is a horizontal line?
11. How is the relief represented on plans (maps)?
12. How is the graphical interpolation performed?
13. What are the main properties of horizontal lines?
14. How are the numbers written on horizontal lines?
15. What are the actions we perform while drawing horizontal lines in GeoMap software?
REFERENCES
Se
q.
No.
Publishing
year
Information source (publication)
author, title and identification number
Publishin
g location
and house
(a tick-mark shall mean availability of the
source)
Kaunas
Other
College
Study Rooms
libraries
library
Key Information Sources
1
2008
2
2012
3
2012
ŽIVATKAUSKAS, Aurelijus, et al.
Geodezija: mokymo(si) priemonė.
ISBN 978-9955-511-87-8. 329 p.
Alexander, Ross, CLARKE.
Geodesy.
ISBN 978-1290098762. 378 p.*
HARRY, L. Landscape Surveying.
ISBN 9781111310608. 256 p.*
Vilnius.
UAB
„Vaistų
žinios“
√
√
HardPress
Publishing
√
√
Department
of
Agricultural
Engineering,
Oklahoma
State
University,
√
√
4
5
2012
2011
Charles, D., GHILANI et al.
Elementary Surveying .
ISBN 978-0-13-255434-3. 984 p.*
Е., В., ЗОЛОТОВА;
Р., Н., СКОГОРЕВА.
Геодезия с основами кадастра.
ISBN 978-5-904954-04-8,
978-5-8291-1246-2. 416 p.*
USA
Westford
United States
of America
√
√
Академический
Проект,
Трикста
√
√
√
√
√
√
√
√
Technika
√
√
Vilniaus
Gedimino
technikos
universitetas,
geodezijos
institutas
Kauno
kolegija
√
√
√
√
Additional Reading
1
2
3
1992
TAMUTIS, Zigmas, et al.
Geodezija-1
ISBN 5-420-01331-2. 292 p.
Mokslo ir
enciklopedijų leidykla
2011
АЛЬБЕРТ, ГАМЗАТОВИЧ,
ЮНУСОВ, и др. Геодезия.
ISBN: 978-5-8291-1326-1,
978-5-98426-108-1. 409 p.*
Издательство
"Академи
-ческий
Проект"
Valstybinė
geodezijos ir
kartografijos
tarnyba
2000
4
2000
5
2013
Geodezijos ir kartografijos techninis
reglamentas. GKTR 2.08.01:2000:
statybiniai inžineriniai geodeziniai
tyrinėjimai
Geodezijos ir kartografijos techninis
reglamentas. GKTR 2.11.02:2000:
sutartiniai topografinių planų M
1:500, 1:1000, 1:2000 ir 1:5000
ženklai
Valstybinė
geodezijos ir
kartografijos
tarnyba
AutoCad (Autodesk Product Design
Suite for Education 2013)*
Periodicals
1
Geodezija ir kartografija.
ISSN 1392-1541
Geodesy and cartography.
ISSN 2029 – 6991*
2
Matavimų inžinerija ir GIS.
ISSN 2029-5790
Online Information Sources
1
http:/www.nzt
2
http://www.infoera.lt
3
http://www.geoportalas.lt
4
http://www.gsb.lt
3
* references for international students
Prepared by:
assistant Vincas Zakarauskas
Educational Institution: Kauno Kolegija/ University of Applied Sciences
Study Programme: Real Estate Measurement Engineering
Subject: Geodesy
PRACTICAL WORK NO. 5
TOPIC: SURVEYING WITH GPS DEVICES
1. The Aim of the Practical Work: to perform automatic measurement of points using GPS devices,
point set out activities, surveyed point data transfer to computer, to draw up a standard report on GPS
Lithuanian LKS 94 coordinate system and list of coordinates of the world WGS 84 (eng. World
Geodetic System, 1984) coordinate system.
2. The Objectives of the Practical Work: to list GPS device control functions, to prepare GPS device
for work, to perform RTK survey settings, port configuration, RTK portable device settings, automatic
point measurement, point set out activities, surveyed point data transfer to computer, to draw up a
standard report on GPS Lithuanian LKS 94 coordinate system and list of coordinates of the world
WGS 84 (eng. World Geodetic System, 1984) coordinate system.
3. The Innovative Methods Applied in the Practical Work: team learning, discussions.
The practical work is applied for international students. Lithuanian and international students prepare
standard report on GPS LKS 94 coordinate system and list of coordinates of WGS 84 (eng. World
Geodetic System, 1984) coordinate system.
4. The Assessment of the Practical Work:
The highest level of the
achievement of objectives
10
9
All GPS device control
functions are listed, RTK
survey settings are managed,
Port configuration is
performed, RTK base settings
and RTK portable device
settings are managed, point set
out and automatic point
measurement is performed,
surveyed point data transfer to
The medium level of the
achievement of objectives
8
7
All GPS device control
functions are listed, RTK
survey settings are managed,
Port configuration is
performed, RTK base settings
and RTK portable device
settings are managed, point set
out and automatic point
measurement is performed,
surveyed point data transfer to
The minimum level of the
achievement of objectives
6
5
All GPS device control
functions are listed, RTK
survey settings are managed,
Port configuration is
performed, RTK base
settings and RTK portable
device settings are managed,
point set out and automatic
point measurement is
performed, surveyed point
Not achieved
objectives
4
3
2
1
All GPS device control
functions are listed,
RTK survey settings are
managed,
Port configuration is
performed, RTK base
settings and RTK
portable device settings
are managed, point set
out and automatic point
computer is performed,
standard report on GPS
Lithuanian LKS 94 coordinate
system and list of coordinates
of the world WGS 84
coordinate system are drawn
up.
computer is performed,
standard report on GPS
Lithuanian LKS 94 coordinate
system and list of coordinates
of the world WGS 84
coordinate system are not
drawn up.
data transfer to computer is
not performed, standard
report on GPS Lithuanian
LKS 94 coordinate system
and list of coordinates of the
world WGS 84 coordinate
system are not drawn up.
measurement is not
performed, surveyed
point data transfer to
computer is not
performed, standard
report on GPS
Lithuanian LKS 94
coordinate system and
list of coordinates of the
world WGS 84
coordinate system are
not drawn up.
The teacher specifies the survey object of the locality.
The survey is performed by groups of three or four students.
Each group selects a GPS device from geodetic laboratory, prepares it for work using devise user
manual and surveys the specified site and its objects.
Each student individually drawns up standars report on GPS Lithuanian LKS 94 coordinate
system and list of coordinates of the world WGS 84 coordinate system.
Sequence:
1. To assemble GPS device.
2. To explane control panels and keys, control principles, meanings of indicator line of GPS
device.
3. To determine battery charge level.
4. To prepare GPS device for work in Bluetooth mode and on GSM network or through radio
connection.
5. To check if the information about satellites is received.
6. To create new job for collection of survey data.
7. To set the height of portable GPS device and input measured value.
8. To set the type of antenna and other antenna parameters of portable GPS device.
9. To set the elevation angle of GPS satellites applied to survey.
10. To set survey reliability indexes.
11. To perform coordination of points (the number of points is specified by the lector).
12. To perform set out of points (the number of points is specified by the lector).
13. To perform importof points applying automatic and manual methods.
14. To perform reloading of points.
15. To perform review and initial processing of reloaded data.
16. To draw up standard report on GPS LKS 94 and WGS 84 coordinate systems.
17. To prepare the presentation.
Assemblage of portable GPS device
Portable GPS device consists of:
- GPS recever with GPS antenna;
- GSM//GPRS or radio antenna, if GPS receiver has itegrated radio or GSM//GPRS modems;
- data collector;
- fastening element for setting up the data collector to the stand;
- 2 m length carbon-fiber stand;
Assemblage of portable GPS device: to set up two-part carbon-fiber stand, to fasten receiver
with integrated antenna (model Trimble 5800, R6, R8), the antenna is fastened to the receiver, to fasten
data collector.
Fig. 5.1. Portable GPS receiver Trimble R6
The survey starts from sreation of new job. Survey data will be stored in the job.
New job creation:
1. Select Files//New Job in the main menu of Trimble Survey Controller.
2. Input the title of new job.
3. Click Coord. Sys to select coordinate system and then click Next. If there is no LKS 94
(Lithuanian coordinate system), select it from the library.
4. Measuring units are set by clicking Units key.
5. Click Accept to save the job after the settings are made:
1. Select Files//Open Job in the main menu of Trimble Survey Controller.
2. Select the required job, mark it with a pen and click Select. The title of the job will appear
on the upper information bar of Trimble Survey Controller software.
Job deletion:
1. Select Files//Open Job from the main menu of Trimble Survey Controller, mark the job
with directional buttons or by clicking and holding for some seconds special pen on active touch
screen. The job is deleted by clicking and holding for some seconds special pen on active touch screen.
By quick click the job will be opened and activated.
2. Click Delete, Yes for deletion or No – to cancel.
Portable GPS device setting
Configurations of Portable GPS device for RTK surveying:
1. Select Configuration /Survey Styles / RTK/ Rover options in the main box of Trimble Survey
Controller software .
2. Made settings are provided in table 5.1..
Table 5.1.
Portable GPS device settings
Survey Type
Broadcast Format
Use Station index
Promt Station Index
Satellite Diferencini
Elevation Mask
PDOP Mask
Antenna:
Type
Measured to
Antena Height
Šeriai number
Trackπio:
Use L2C
L2C
RTK
CMR+
Any
Do not put a tick mark
Off
15°
6.0
Selected from the list according to used GPS device model
Bottom of antenna mount
2.000 m, if the device is fastened to the stand, of 2 m in length
Device series number is entered
Yes
(if device supports L2C frequency) to put a tick mark
Preparation of portable GPS device for work on GSM network
To transmit the corrections of portable GPS device in real time, GSM or radio connection is
used. GSM connection is set as follows:
1. Select Configuration /Survey Styles / RTK/ Rover Radio in the main menu box of Trimble
Survey Controller software.
2. Customized settings are provided in table 5.2.
Table 5.2.
Transmission of corrections in real time through GSM connection
Type
Method
Name to dial
Number to dial
Modem PIN
Init String
Hang UO
Dial Prefix
Dial Suffix
Post Connect
Send User Identify In for
Trimble internal
GSM dial up
?
Data number
Empty
?
ATHO
AT D
?
?
Do not put a tick mark varnele
Settings for real time transmission of the coorections of portable GPS device though integrated
radio system are as follows:
1. Select Configuration /Survey Styles / RTK/ Base Radioin the main menu box of Trimble
Survey Controller software.
2. Customized settings are provided in table 5.3.
Table 5.3.
Transmission of corrections in real time through radio connection
Type
Frequency
Chanel Spacine
Power Output
T RIMT AL K 450S
443.8570 MHz
12 .5 KHz
0.5 W
To start survey with portable GPS device
Survey with portable GPS device in RTK mode:
1. Make sure if the created job is active; its title is in the upper information line.
2. Select Survey from the main menu.
3. If surveying in RTK mode, make sure the corrections ar received from GPS network
through radio or GSM connection.
4. If automatic initialisation failed, initialise mannualy.
5. After survey initialisation select survey methods: point measurement Measure
Points or stake out of points (Stakeout).
Input of heights of stand for portable GPS device
1. Select Configuration /Survey Styles / in the main menu of Trimble Survey Controller, select
survey mode/ Rover options.
2. When using 2 m long carbon fiber stand, input 2.000 in the field Antenna Height. Device
height will be constant during survey of each point.
3. If is is necessary to chanhe the height during survey, change it manually by inputing device
height when filling in surveyed point parameters.
Input of survey reliability of portable GPS device
Survey reliability is defined by PDOP index. PDOP stands for positional dilution of precision.
It indicates the accuracy of position based on the number of satellites and the geometry of satellite
positions. From a geometrical point of view PDOP is proportional to the used divided by the volume of
pyramid, formed by lines drawn from four observed satellites to GPS antenna. Lower number – to 6
means more accurate survey data, higher than 6 – less accurate data. Low DOP values mean thet
satellites are widely spread in relation to surveyed point, and high values – vice virsa. PDOP involve
vertical and horizontal PDOP² = HDOP² + VDOP²
PDOP Mask setting:
1. Select Configuration /Survey Styles / RTK/ Rover options in th main woindow of Trimble
Survey Controller software.
2. Input 6.0 value in the field „PDOP Mask“. PDOP Mask – maximum DOP value under
which the device proceeds with calculation of positions.
Input of elevation angle of portable GPS device
Elevation angle of portable GPS device is set by configuration of each survey mode:
1. Select Configuration /Survey Styles / Rover options in the main wondow of Trimble Survey
Controller software.
2. Set elevation angle in the field Elevation Mask and save the changes.
Input of antenna type and configuration of portable GPS device
Antenna type of portable GPS device is set by configuration each syrvey mode:
1. Select Configuration /Survey Styles / Rover options in the main wondow of Trimble Survey
Controller software.
2. Select used antenna from the list in the field Antena type and save the changes.
Coordination of points
After preparatory works are completed, coordination of points using portable GPS device may
be started:
1. Select RTK in the main menu of Trimble Survey Controller and click Start Survey.
2. Select Measure Points from Survey menu.
3. Number of satellites is observed. It is not allowed to perform RTK surevy when less than
five satellites are within the visibility zone of GPS device. Satisfied with the accuracy enter parameters
of surveyed point: point number Name, point code Code – selected from codes library or input
manually, if necessary – stand height is changed by entering the value in Antenna Height.
5. Click Measure in the right bottom corner of the screen, observe point measurement time
reading. After the measurement click Store and save the data. When data is saved the measurements
continue by repeating steps 4 and 5.
Stake out of points
1. Select Stakeout from Survey menu when survey in RTK mode is started.
2. List of anticipated stake out points is activated Stake out points list.
3. To add to the list click Add.
4. To stake out all points select All Points.
5. To stake out specific point mark it inn the list and click Stakeout in the right bottom corner of
the screen.
6. Keep the data collector in front of you, move to designated direction taking into account the
distance to the stakeout point.
7. When the distance to the stakeout point is 3 m, directional arrow is changed with target course view is activated.
8. When the distance to stakeout point is about 30 cm, fine view is activated.
9. During ht observation of data collector screen the device must be set so that the cross would
be right on the location of stakeout point.
10. Mark the point.
11. Fpr accuracy checking the point is recoordinated as-stakeout, by clicking Accept or
Measure. If other point is staked out, the stakeout point dessapers from the list of points. Repeat the
steps tostake out other points.
Import of points or manual input to portable GPS device
Manual input of point parameters to GPS device memory:
1. Select Key In / Points in the main menu of Trimble Survey Controller.
2. Enter point name.
3. Enter other parameters: X, Y, Z, Code.
4. The point is saved, click Store and continue work.
The data is imported to data collector using Trimble Geomatics Office software in * CSV
format:
1. Imported data must be in TGO file.
2. Data collector must be connected to computer.
3. Select File / Export, click Comma delimited coordinate file to Surbey controler (*CSV)in
dialog box, select Survey Controller on ActiveSync and click Open (CSV file must include: number, X,
Y, Z, code)
The data are exported to the internal memory of data collector.
4. To import *.CSV files available on data collector to new job or previous job use import
function (File / Import/Export).
Measurement data transfer
Point measurement data are transferred to computer. Matavimo duomenims perkelti iš
valdiklio, Use Microsoft ActiveSync software to transfer measurement data from controller:
1. Microsoft ActiveSync software must be installed on the computer.
2. When the data collector is connected to the computer, the following box appears (fig. 5.2.).
Fig. 5.2. Measurement data transfer software
3. Select Cancel to connect as a Guest.
After connection of the device to the computer Trimble Geomatics Office software is used for
data processing:
1. Trimble Geomatics Office software is activated (Start / Programs / Trimble
Office / Trimble Geomatics Office / Trimble Geomatics Office).
2. New file is created in order to transfer surveyed points from the data collector to the
computer.
Creation of project: Activate program → New Project, type the title of project in box Name.
Template → LKS 94. At the option New select Project. Open the box Project properties → Coordinate
system and check if LKS 94 coordinate system is selected, if not – click Change, Select Coordinate
system box will open, select coordinate system and click Finish. Close Project properties dialog box by
clicking OK.
Data import from data collector: Go to File → Import and click Survey devices → OK in
appeared dialog box. Find Survey Controller on ActiveSync and click OPEN. After the sata are
trasferred, in box Project koordinates system → select Keep the existing Project definition → OK.
Coordinate system of the software is used for surveyed points because it is more widely described then
on the software for field data storage of the data collector. In DAT Chekin dialog box the information
about surveyed points is provided → OK. The data were collected in RTK survey mode, therefore there
is no need of additional data processing; the data may be exported for later processing in a desired
format.
Fig. 5.3. Standard GPS report
ADDITIONAL MATERIAL FOR COMPLETION OF THE PRACTICAL WORK
Trimble Survey Controller software is controlled with the help of active touch screen. Specal
pen is used for the purpose complete with Trimble TSC2 data collector. The Trimble Survey Controller
software is activated through Start menu, all desired functions are controlled by touching the screen
with the pen.
Main control of GPS device is performed by the data collector. All measurements and
parameters are recorded to the field data storge software Trimble Survey Controller.
Indicators of Trimble Survey Controler field software may be observed only if the software is
activated on the data collector. Meanings of the indicators depen on what devices are connected to the
data collector (controller). Indicators of GPS device software and their meanings are provided in fig.
5.4..
GPS device software indicators
Indicator
Meaning
Data collector is energized by external source
Battery is charging
Battery charge is 100% or 50%. The upper indication is for the data collector, the bottom – external
device connected to the collector.
Data collector controls Trimble 5800GPS receiver
Data collector controls Trimble R7 GPS receiver
Data collector controls Trimble R8 GPS receiver
Data collector controls Trimble 5700 GPS receiver
Data collector controls Trimble 4800 GPS receiver
Data collector controls Trimble 4700 GPS receiver
Data collector controls Trimble 4800 GPS receiver. Height of the receiver is on the right
Apart from the receiver, antenna is connected. Height of antenna is on the right
Stationary point is measured
Receiving of radio data batches
Receiving of mobile connection modem signals
When connection is interrupted the indicator crossed
Receiving of of WAAS/EGNOS signals
Number of satellites observed by receiver, on the right of indicator
In real time survey the GPS receiver receives corrections from base receiver through internet
connection (GPRS)
Fig. 5.4. GPS device software indicators
Text indicators in the bottom of the screen of data collector provide information about
performed activities or current errors. Text indicators of GPS device software and their meanings are
provided in table 5.4..
Table 5.4.
Text indicators
Text indicator
No Survey
RTK:Fixed
RTK:Float
RTK:Check
RTK:Auto
RTK:WAAS
FastStatic
PP differential
RT differential
In fill:Fixed
In·ifill
Explanation
GPS device is connected to data collector, but survey mode is not selected
Performed RTK survey are initialised, L 1 is fixed - centimeter-level
Performed RTK survey are non- initialised, L 1 is not fixed (float)
RTK survey performed –initialisation is verified
Radio connection was lost during RTK survey – autonomous positioning is performed
Radio connection was lost during RTK survey, solution - GPS survey is performed with
WAAS/EGNOS
Selected survey mode is fast static {FastStatic)
Results are processed after survey
Survey is performed in real- time differential mode
Performed kinematic survey is initialised and after processing ionosphere unaffected L
1 fixed solution with cm accuracy is obtained
Performed survey is differential and a session is performed with data collection for
post-processing (post-piocessing)
Bluetooth wireless connection in GPS device and data collector allow for data exchange
without a cable. The capabilities of data collector with Bluetooth connection:
- connection with other data collector (for data exchange);
- control Trimble R8, R6, 5800 GPNS devices;
- control distance metering units.
Configuration of Bluetooth port connecting the data collector with Trimble R8, R6, 5800
GPNS devices:
- connect device with data collector;
- activate Trimble Survey Controller software and select [Configuration / Controller /
Bluetooth] from the main menu;
- click Config to activate Bluetooth port: watch TSC2 data collector to ensure that [Turn on
Bluetooth] and [Make this devise discoverable to other devices] references are marked.
- scan of Bluetooth evices is activated on the data collector: select [Devises] on TSC2
controller and then select [New];
- Trimble Survey Controller software is used to find Bluetooth devices located at a distance of
up to 10 m;
- after scan select device to connect with data collector and click [Next];
- if connection to GPS device is performed there is no need to enter access code – click
[Next];
- enter device name and click [Finish];
- click [OK] Trimble Survey Controller;
- select device to measure with in the field Reciever. Select [Accept] and software will
automatically connect to defined GPS device.
The information provided by LEDs of Trimble GPS device is provided in fig. 5.5. and table
5.5..
On/Off
Energy
Translation of CMR data
Observation of satellites
Fig. 5.5. LED information if the device
Trimble GPS device has one functional – On // Off button. Functions of the button:
- To turn on the GPS device press OFF button for 2 s;
- to delete ephemeris file – press for 15 s;
- to restart the device with factory settings – press for 15 s;
- to delete used files – press for 30 s.
LED information is provided in table 5.5..
Table 5.5.
LED information
Green
-
Radijo duomenų
Perdavimo
Green
-
lighting
-
-
fast blinking
-
-
lighting
-
fast blinking
lighting
-
slow blinking
Blinking each 3 s
lighting in the cource of
translation
slow blinking
Not lighting
-
GPS device status
OFF
ON: batteries are fully
charged
ON: batteries are running
down
Four and more satellites are
observed
Less then four satellites are
observed
Internal data collection
Internal translation
Energy
Radio data trasfer
Radio data are not received
lighting
lighting
Palydovų sekimo
Yellow
-
-
Work management
To star the survey job must be created for measurement data collection.
Creation of new job:
1. Select Files // New Job in the Trimble Survey Controller main manu.
2. Type in job title.
3. To select coordinate system click Coord. Sys, then – Next.
4. If there is no LKS’94 coordinate system, select it from the library.
5. To change metering units (dimensions) of the created job click Units .
6. When settings are made click Accept to save the job.
Continuing existing job:
1. Select Files//Open Job from the Trimble Survey Controller main menu.
2. Select the job to continue with, mark with a pen and click Select.
The title of continuing job will be visible on the upper information bar of the Trimble Survey
Controller software.
Deletinf the job:
1. Select Files//Open Job from the Trimble Survey Controller main menu.
If the job to be delated is not marked, mark it using directional buttons or by pressing and holding the
pen on active touch screen.
2. Click Delete and Yes to confirm deletion or No – to cancel deletion.
Creating export file
Export of points in desired format is performed, automatically input to C:\ Trimble Geomatics
Office / Projects / ttle of created project / Export.
Determination of the structure of exposrt file data
The structure of export file data is individually defined according to the method of further
data processing. To export the data click File/Export and select the format of data from the ones
seggested:
- if data were processed by ArcGIS software, export in ArcView shape file points – (*.dbf,
*.shp, *.shx).
- if data were processed by CAD software, export in (*.dxf, *.CSV arba *.txt) formats.
After format is selected, chose required standard of data export and click OK, enter the title in appeared
dialog box and save.
File export procedure
1. New project (file) is created in Trimble Geomatics Offise data processing software to upload
surveyed points.
2. Survey results are downloaded from the data collector to Trimble Geomatics Office software
for field data processing.
3. Data are exported under selected format.
QUESTIONS TO REPEAT:
•
What are the GPS device indicators for?
•
Describe the meanings of LEDs defining the status of GPS device.
•
How does GPS work?
•
What is the difference between static and kinematic survey methods?
•
How are the data collected by GPS device?
•
How to create a new job?
•
What parameters do determine the accuracy of GPS survey?
•
How are the points coordinated by GPS device?
•
How are the points staked out by GPS device?
•
How to prepare the standard GPS report?
REFERENCES
Se
q.
No.
Publishing
year
Information source (publication)
author, title and identification number
Publishin
g location
and house
(a tick-mark shall mean availability of the
source)
Kaunas
Other
College
Study Rooms
libraries
library
Key Information Sources
1
2008
2
2012
3
2012
4
2012
5
2011
ŽIVATKAUSKAS, Aurelijus, et al.
Geodezija: mokymo(si) priemonė.
ISBN 978-9955-511-87-8. 329 p.
Alexander, Ross, CLARKE.
Geodesy.
ISBN 978-1290098762. 378 p.*
HARRY, L. Landscape Surveying.
ISBN 9781111310608. 256 p.*
Charles, D., GHILANI et al.
Elementary Surveying .
ISBN 978-0-13-255434-3. 984 p.*
Е., В., ЗОЛОТОВА;
Р., Н., СКОГОРЕВА.
Геодезия с основами кадастра.
ISBN 978-5-904954-04-8,
978-5-8291-1246-2. 416 p.*
Vilnius.
UAB
„Vaistų
žinios“
√
√
HardPress
Publishing
√
√
√
√
√
√
Академический
Проект,
Трикста
√
√
Technika
√
√
Department
of
Agricultural
Engineering,
Oklahoma
State
University,
USA
Westford
United States
of America
Additional Reading
1
1998
2
1996
3
2011
4
2012
5
2003
6
2000
SKEIVALAS, Jonas. Elektroniniai
geodeziniai prietaisai
ISBN 9986-05-713-2. 193 p.
TAMUTIS, Zigmas. ir kiti.
Geodezija-2
ISBN 5-420-01331-2. 384 p.
АЛЬБЕРТ, ГАМЗАТОВИЧ,
ЮНУСОВ, и др. Геодезия.
ISBN: 978-5-8291-1326-1,
978-5-98426-108-1. 409 p.*
TORGE, WOLFGANG; MÜLLER,
JÜRGEN. Geodesy.
ISBN 978-3-11-020718-7. 539 p.*
ERIK W. GRAFAREND,
FRIEDRICH W. KRUMM, VOLKER
S. SCHWARZE. Geodesy – The
Challenge of the 3rd Millennium.
ISBN-10: 3642077331. 487 p.*
Geodezijos ir kartografijos techninis
reglamentas. GKTR 2.08.01:2000:
Mokslo ir
enciklopedijų leidykla,
Издательство
"Академи
-ческий
Проект"
University of
Hannover,
Germany.
√
√
√
√
√
√
Springer –
Verlag
Berlin
Heidelberg
√
√
Valstybinė
geodezijos ir
√
√
statybiniai inžineriniai geodeziniai
tyrinėjimai
kartografijos
tarnyba
Periodicals
1
Geodezija ir kartografija.
ISSN 1392-1541
Geodesy and cartography.
ISSN 2029 – 6991*
2
Matavimų inžinerija ir GIS.
ISSN 2029-5790
Online Information Sources
1
http://www.nzt
2
http://www.topcon.lt
3
http://www.gpspartneris.lt
4
http://www.infoera.lt
5
http://www.geoportalas.lt
6
http://www.gps.lt
7
http://www.glonas-center.ru
8
http://www.unavco.org
9
http://www.navstar.com
10
http://www.esa.int/esaNA/galileo.html
11
http://www.gsb.lt
3
Technika
√
√
Vilniaus
Gedimino
technikos
universitetas,
geodezijos
institutas
Kauno
kolegija
√
√
√
√
* references for international students
Prepared by:
assistant Vincas Zakarauskas
Educational Institution: Kauno Kolegija/ University of Applied Sciences
Study Programme: Real Estate Measurement Engineering
Subject: Geodesy
PRACTICAL WORK NO. 6
TOPIC: INVERSE AND DIRECT ANGULAR INTERSECTION SOLUTIONS
1. The Aim of the Practical Work: to apply geodetic and mathematical methods in determination of
point coordinates.
2. The Objectives of the Practical Work: to perform geodetic surveying, to calculate point
coordinates, to apply inverse (point displacement) and direct intersection calculation methods.
3. The Innovative Methods Applied in the Practical Work: team learning, discussions.
The calculations are performed according to the original coordinates of the world coordinate
system WGS 84 (eng. World Geodetic System, 1984), therefore the practical work is applied both for
Lithuanian and international students.
4. The Assessment of the Practical Work:
The highest level of the
achievement of objectives
10
9
Point coordinates are
calculated applying the
calculations methods of
inverse and direct intersection,
the reliability of results is
evaluated.
The medium level of the
achievement of objectives
8
7
Point coordinates are
calculated applying the
calculations methods of
inverse and direct intersection,
the reliability of results is not
evaluated.
The minimum level of the
achievement of objectives
6
5
Point coordinates are
calculated applying the
calculations methods of
inverse and direct
intersection, the calculations
have errors, the reliability of
results is not evaluated.
Not achieved
objectives
4
3
2
1
Point coordinates are
calculated applying the
calculations methods of
inverse and direct
intersection, the
calculations are wrong,
the reliability of results
is not evaluated.
INVERSE ANGULAR INTERSECTION
(DISPLACEMENT OF POINT COORDINATES FROM POINT M TO POINT B)
When there are three coordinated points (directions) on the locality and the coordinates of
required point must be found, two points must be set out, two bases must be created and lengths of
datum lines must be measured.
Procedure:
1. To calculate the distance from survey marker 401 to survey marker 3 of triangle 1, 401,3.
The difference of calculated distances may differ by 20 cm. Distance average value is used for further
calculations. 2. To calculate the direction angle value of line 401,2 and compute the length of the line
according to three formulas. The calculated distances may differ by 50 cm. Average value of three
measurements is used for further calculations.
3. To calculate 402 and 401 values of triangle angles 401,402,3.
4. To calculate the direction angle of line 401,3.
5. To calculate the coordinates of point 3.
6. To calculate the value of direction angle 3, 402 of the line.
7. To check the calculations of the value of direction angle 3,402. The values may differ by 5
sec.
Further, the calculations are performed according to the second triangle 401,403,3, the
procedure of calculations is similar to the abovementioned.
Angles between coordinated directions and datum lines are measured. Datum lines are created
so that it would be easy to measure their length and angles to coordinated survey markers (peaks) (fig.
6.1.).
Fig. 6.1. Scheme of coordination of points by inverse intersection
Measurement data are provided in table 6.1.
Table 6.1.
Measurement data
Angles
Angle values
ß1
53°56'39"
ß2
55°15'05"
ß3
57°14'06"
ß4
67°38'45"
ß5
24°11'27"
ß6
101°29'15"
Base
Base length, m
S1,3
222,038
S2,3
168,685
Coordinates of survey markers are provided in table 6.2.
Table 6.2.
Coordinates of survey markers
Survey marker
401
402
403
X
6182380,266
6185467,458
6180342,816
Y
500361,025
503444,321
503361,086
Coordinates
WGS 84, m
Mathematical treatment of data is performed according to the results of geodetic measurement.
1. The distance between marker 401 to marker 3 of triangle 401,3,1 is calculated :
S401,3 =
S1,3 ⋅ sin β1
222,038⋅ sin 53°56'39"
=
= 190,073 m.
sin (β1 + β2 ) sin (53°56'39" + 55°15'05")
6.1.
2. The distance between marker 401 to marker 3 of triangle 401, 2,3 is calculated:
S 401,3 =
S 2,3 ⋅ sin β 4
sin (β 3 + β 4 )
=
168,85 ⋅ sin (67°38'45")
= 190,175 m.
sin(57°14'06" + 67°38'45")
6.2.
3. The difference between the distances is less than 20 cm, so average value is calculated:
S 401,3 = 190,124 m.
6.3.
4. The direction angle of line 401,402 is calculated:
arc tg α 401,402 =
∆ Y402,401 3083,296
=
= 44°57'50' '
∆ X 402,401 3087,192
6.4.
5. The length and average value of line 401,402 is calculated:
S 401,402 =
S 401,402 =
2
∆ X 402,401
3087,192
=
= 4363,195 m.
coc α 401,402 cos (44°57'50'')
∆ Y402,401
3083,296
=
= 4363,195 m.
sin α 401,402 sin (44°57'50'')
2
S 401,402 = ∆ X 402,401 + ∆ Y402,401 = 3087,192 2 + 3083,296 2 = 4363,195 m.
6.5.
6.6.
6.7.
6. The difference between the distances is less than 20 cm, so average value is used:
6.8.
S 401,402 = 4363 ,195 m .
7. The value of angle 401,402,3 (β7) is calculated:
sin β 7 =
S 401,3 ⋅ sin β 5
S 401, 402
=
190,124 ⋅ sin (24°10'23' ' )
= sin 1°01'21' '.
4363,195
6.9.
8. The value of angle β8 is calculated:
β8 = 180 ° − β 5 − β 7 = 180 ° − 24 °11'27 ' '− 1°01'21' ' = 154 °47 '10 ' '.
6.10.
9. The value of direction angle of line 401,3 is calculated:
α 401,3 = α 401, 402 + β 8 = 44 °57 '50 ' '+ 154 °47 '10 ' ' = 199 °45 '00 ' '
6.11.
10. The coordinates of marker 3 are calculated:
X 3 = X 401 + S 401,3 ⋅ cos α 401,3 = 6182380,266 + 190,124 ⋅ cos (199°45'00' ' ) = 6182201,326 m
Y3 = Y401 + S 401,3 ⋅ sin α 401,3 = 35500361,025 + 190,124 ⋅ sin (199°45'00'' ) = 500296,779 m
6.12.
6.13.
11. The value of direction angle of line 3, 402 is calculated:
arc tg α 3, 402 =
∆ Y402, 3
∆ X 402,3
=
3147,542
= 43°56'27' '
3266,132
6.14.
12. Check computation of the direction angle of line 3,402:
α 3, 402 = α 401,3 + 180° + β5 = 199°45'00' '+180° + 24°11'27' ' = 43°56'27' '.
6.15.
Further the calculations according to the triangle 401, 403, 3 are performed.
13. Direction angle of line 401,403 is calculated:
arc tg α 401,403 =
∆ Y403,401
= 124 ° 10 '55 ' '
∆ X 403,401
6.16.
14. The length and average value of line 401,403 is calculated:
S 401,403 =
2
∆ X 403,401
= 3626 ,509 m .
coc α 403,401
2
S401,403 = ∆ X 403,401 + ∆ Y403,401 = 3626,509 m.
S 401,403 = ∆ X 403,4012 + ∆ Y403,4012 = 3626,509 m.
6.17.
6.18.
6.19.
15. The difference between the distances is less than 20 cm, so average value is used:
S 401,402 = 3626 ,509 m .
6.20.
16. 401,403,3 (β9) angle value is calculated:
sin β 9 =
S 401,3 ⋅ sin β 6
S 401, 403
= sin 2°56'42' '.
6.21.
17. β10 angle value is calculated:
β10 = 180 ° − β 6 − β 9 = 154 °47 '12 ' '.
6.22.
18. Value of direction angle of line 401,3 is calculated. The value may differ from the earlier
measured up to 5 s.
α 401, 3 = α 401, 402 + β8 = 44 °57 '50 ' '+154 °47 '12 ' ' = 199 °45 '02 ' '
6.23.
19. The coordinates of marker 3 are calculated:
X 3 = X 401 + S 401, 3 ⋅ cos α 401,3 = 6182380,26 6 + 190,124 ⋅ cos (199°45'02' ' ) = 6182201,32 7 m
Y3 = Y401 + S 401,3 ⋅ sin α 401,3 = 500296,777 m
6.24.
6.25.
20. The value of direction angle of line 3, 403 is calculated:
arc tg α 3, 403 =
∆ Y403,3
∆ X 403,3
= 121°14'13'
6.26.
21. Check calculation of direction angle of line 3,403:
α 3, 403 = α 401,3 + 180° + β6 = 121°14'13' '
6.27.
22. Average coordinates are calculated:
X3 = 6 182 201,327 m; Y3 = 500 296,777 m.
6.28.
DIRECT ANGULAR INTERSECTION
Angles are measured for determination of ground point coordinates by geodetic intersection–
angular intersection. Angular intersections are divided into direct and inverse. The intersection is single
when only required number of reference points and measurements is applied. When there are more
reference points and measurements than it is actually required, the intersection is multiple. The multiple
intersection is more precise because of additional measurements, therefore the results are more reliable.
PK-77 picket coordinates are calculated according to the coordinates of three points and measured A, B,
C angles.
Procedure:
1. To calculate the coordinates of point PP-77 of triangle A, B, PP-77.
2. To check the calculation of the coordinates of point PP-77 of triangle C, B, PP-77.
3. To evaluate the reliability of calculated coordinates, they may differ by 50 cm.
4. To calculate average coordinates of point PP-77.
The drawing is provided in fig. 6.2.
Fig. 6.2. Scheme of direct angular intersection
Measurement data are provided in table 6.3.
Table 6.3.
Measurement data
Points
Angles
ß1
33°34'06"
ß2
26°01'18"
ß3
82°10'47"
ß4
57°24'25"
Coordinates of survey markers are provided in table 6.4.
Table 6.4.
Coordinates of survey markers
Points
Coordinates WGS 84, m
xA
6086116,04
xB
6086517,83
xC
6084516,92
yA
519202,94
yB
514801,53
yC
513935,02
Procedure:
1. In triangle A, B, PK-77 Cartesian coordinates of point PK-77 are calculated:
x PK −77 =
x A ctg β 2 + x B ctg β1 − y A + y B
= 6085048,34 m.
ctg β1 + ctg β 2
y PK−77 =
y A ctg β 2 + y B ctg β1 + xA − xB
= 517224,35m.
ctg β1 + ctg β 2
6.29.
6.30.
2. In triangle B, C, PK-77 Cartesian coordinates of point PK-77 are calculated:
xPK−77 =
xB ctg β 4 + xC ctg β3 − y B + y C
= 6085048,38m.
ctg β3 + ctg β 4
6.31.
y PK−77 =
y B ctg β 4 + y C ctg β 3 + xB − xC
= 517224,48m.
ctg β 3 + ctg β 4
6.32.
3. The values of calculated Cartesian coordinates of point PK-77 differ by less than 50 cm,
therefore average coordinates of point PK-77 are calculated:
6.33.
xPK −77 vid . = 6085048,36 m.
6.34.
y PK −77 vid. = 517224,42 m.
QUESTIONS TO REPEAT:
•
What is the essence of coordination of ground points?
•
Describe the essence of direct angular intersection?
•
Describe the essence of inverse angular intersection?
•
What methods of point coordination do you know?
•
What is the difference between direct and inverse direction angle?
•
Describe the essence of single and multiple angular intersection.
REFERENCES
Se
q.
No.
Publishing
year
Information source (publication)
author, title and identification number
Publishin
g location
and house
(a tick-mark shall mean availability of the
source)
Kaunas
Other
College
Study Rooms
libraries
library
Key Information Sources
1
2008
2
2012
3
2012
4
2011
ŽIVATKAUSKAS, Aurelijus, et al.
Geodezija: mokymo(si) priemonė.
ISBN 978-9955-511-87-8. 329 p.
Alexander, Ross, CLARKE.
Geodesy.
ISBN 978-1290098762. 378 p.*
Charles, D., GHILANI et al.
Elementary Surveying .
ISBN 978-0-13-255434-3. 984 p.*
Е., В., ЗОЛОТОВА;
Р., Н., СКОГОРЕВА.
Геодезия с основами кадастра.
ISBN 978-5-904954-04-8,
978-5-8291-1246-2. 416 p.*
Vilnius.
UAB
„Vaistų
žinios“
√
√
HardPress
Publishing
√
√
Westford
United States
of America
√
√
Академический
Проект,
Трикста
√
√
Technika
√
√
√
√
√
√
Additional Reading
1
1995
2
1992
3
2011
SKEIVALAS Jonas. Koreliuotų
geodezinių matavimų rezultatų
matematinis apdorojimas.
ISBN 9986-05-151-7 : 10.00 . 272 p.
TAMUTIS, Zigmas, et al.
Geodezija-1
ISBN 5-420-01331-2. 292 p.
АЛЬБЕРТ, ГАМЗАТОВИЧ,
ЮНУСОВ, и др. Геодезия.
Mokslo ir
enciklopedijų leidykla
Издательство
ISBN: 978-5-8291-1326-1,
978-5-98426-108-1. 409 p.*
4
2012
5
2000
6
2013
TORGE, WOLFGANG; MÜLLER,
JÜRGEN. Geodesy.
ISBN 978-3-11-020718-7. 539 p.*
Geodezijos ir kartografijos techninis
reglamentas. GKTR 2.08.01:2000:
statybiniai inžineriniai geodeziniai
tyrinėjimai
AutoCad (Autodesk Product Design
Suite for Education 2013)*
"Академи
-ческий
Проект"
University of
Hannover,
Germany.
Valstybinė
geodezijos ir
kartografijos
tarnyba
√
√
√
√
Technika
√
√
Vilniaus
Gedimino
technikos
universitetas,
geodezijos
institutas
Kauno
kolegija
√
√
√
√
Periodicals
1
Geodezija ir kartografija.
ISSN 1392-1541
Geodesy and cartography.
ISSN 2029 – 6991*
2
Matavimų inžinerija ir GIS.
ISSN 2029-5790
Online Information Sources
1
http://www.nzt
2
http://www.infoera.lt
3
http://www.geoportalas.lt
4
http://www.gsb.lt
3
* references for international students
Prepared by:
assistant Vincas Zakarauskas
Educational Institution: Kauno Kolegija/ University of Applied Sciences
Study Programme: Real Estate Measurement Engineering
Subject: Geodesy
PRACTICAL WORK NO. 7
TOPIC: MATHEMATICAL TREATMENT OF EQUAL AND UNEQUAL PRECISION SURVEY
RESULTS OF ONE DEMENSION
1. The Aim of the Practical Work: to apply theoretical skills for mathematical treatment of equal and
unequal precision distance measurement results and evaluation of precision of the measurements.
2. The Objectives of the Practical Work: to select minimum length value of the line, to calculate the
differences between single measurement results and values close to the arithmetic mean, the arithmetic
mean, rounding error, deviation of measurement results from the arithmetic mean, to check the
calculation of the arithmetic mean, of squared sum of deviations from the arithmetic mean, to calculate
mean squared error of one measurement, mean squared error of weight unit, mean squared error of
mean squared error of one measurement, mean squared error of mean squared error of weight unit,
mean squared error of the arithmetic mean, the reliability of the mean squared error of the arithmetic
mean, to determine the tolerances of measurement precision with 95 % and 99,73 % precision
probability, to determine relative error of line measurement results.
3. The Innovative Methods Applied in the Practical Work: team learning, discussions.
4. The Assessment of the Practical Work:
The highest level of the
achievement of objectives
10
9
The most reliable value and
deviations from arithmetic
mean are calculated, sum of
deviations from the arithmetic
mean is verified, squared
mean error of one
measurement, squared mean
error of squared mean error of
one measurement, squared
mean error of squared mean
The medium level of the
achievement of objectives
8
7
The most reliable value and
deviations from arithmetic
mean are calculated, sum of
deviations from the arithmetic
mean is verified, squared mean
error of one measurement,
squared mean error of squared
mean error of one
measurement, squared mean
error of squared mean error of
The minimum level of the
Not achieved
achievement of objectives
objectives
6
5
4
3
2
1
The most reliable value and The calculations are
deviations from arithmetic
wrong.
mean are calculated, sum of
deviations from the
arithmetic mean is verified,
squared mean error of one
measurement, squared mean
error of squared mean error
of one measurement, squared
mean error of squared mean
error of weight unit, squared
mean error of arithmetic mean
and squared mean error of
squared mean error of
arithmetic mean are
calculated, confidence
intervals of measured values
are calculated, relative error of
line measurement results is
determined.
weight unit, squared mean
error of arithmetic mean and
squared mean error of squared
mean error of arithmetic mean
are calculated, confidence
intervals of measured values
are not calculated, relative
error of line measurement
results is not determined.
error of weight unit, squared
mean error of arithmetic
mean and squared mean error
of squared mean error of
arithmetic mean are
calculated. The calculations
have errors. Confidence
intervals of measured values
are not calculated, but are
determined, relative error of
line measurement results is
not determined.
MATHEMATICAL TREATMENT OF EQUAL PRECISION SURVEY RESULTS OF ONE
DIMENSION
10 measurement series have been performed during determination of the length of datum line.
Each series includes n measurements of the datum line. Arithmetic means of the datum line are
calculated according to each measurement series. It is required to determine the most reliable value of
the datum line and evaluate the precision of measurement.
Procedure:
1. To calculate the most reliable value – arithmetic mean.
2. To calculate deviations from arithmetic mean and verify the deviation from the sum of
arithmetic mean.
3. To calculate squared mean error of one measurement.
4. To calculate squared mean error of squared mean value of one measurement.
5. To calculate squared mean error of arithmetic mean.
6. To calculate squared mean error of squared mean error of arithmetic mean.
7. To calculate confidence intervals of measured values.
8. To determine relative error of line measurement results.
The treatment of measurement results of the datum line are provided in table 7.1.
Table 7.1.
Datum line measurement results treatment
Lines
Measurement results xi (m)
ε i (mm)
ε 2 i (mm²)
ν i (mm)
2
ν i (mm²)
1
2
3
4
5
6
7
8
9
10
107.222
107.222
107.242
107.249
107.219
107.230
107.229
107.227
107.245
107.247
Σ
3
3
23
30
0
11
10
8
26
28
= 142
Σ
9
9
529
900
0
121
100
64
676
784
= 3192
-11
-11
+9
+16
-14
-3
-4
-6
+12
+14
Σ =2
Σ
121
121
81
256
196
9
16
36
144
196
= 1176
1. According to measurement results the minimum line length value of 107,219 m is taken. It will be
approximate value for arithmetic mean - x ′ .
2. The differences between single measurement results are measured and the values close to arithmetic
mean: ε i = xi − x' = 107,222 − 107,219 = 0,003 m = 3 mm .
3. Arithmetic mean is calculated:
10
x = x'+
∑ε
i
i =1
n
= 107,219 +
142
= 107,2332 ≈ 107,233 m.
10
4. Rounding error is calculated:
ϕ= x −x
apv.
= 107,2332 − 107,233 = + 0,0002 m = + 0,2 mm.
5. Measurement result deviations from arithmetic mean v are calculated:
v1 = x1 − x = 107,222 − 107,233 = − 0,011 m = −11 mm .
6. Calculation of the arithmetic mean is checked:
10
∑v
i
= n ⋅ ϕ = 10 ⋅ 0,2 mm = 2 mm.
i =1
7. Calculation of sum of squared deviations from arithmetic mean is checked:
10
10
∑
i =1
10
2
νi =
∑
i =1
2
εi −
∑ε
2
i
i =1
142 2
= 3192 − 2016,4 = 1175,6 = 1176 mm².
10
= 3192 −
n
8. Squared mean error of one measurement is calculated:
10
m=
∑ν
2
i
i =1
1176
= 11,43 mm.
10 − 1
=
n −1
9. Squared mean error of squared mean error of one measurement is calculated:
mm =
m
2(n − 1)
11,43
=
2 ⋅ (10 − 1)
= 2,69 mm.
10. Squared mean error of arithmetic mean is calculated:
M=
m
n
=
11,43
10
= 3,61 mm.
11. Reliability of squared mean error of arithmetic mean is calculated:
mM =
m
2⋅n
=
11,43
2 ⋅ 10
= 0,81 mm.
12. Measurement precision tolerances are calculated:
12.1. Confidence interval for measured distance with 95 % reliability is calculated:
P( x − tα M ≤ x ≤ x + tα M ) Pα
P(107,233 m - 2,145 · 3,61 mm < 107,233 m < 107,233 m + 2,145 · 3,61 mm) = P95%.
P(107,225 m < 107,233 m < 107,241 m) = P95%.
12.2. Confidence interval for measured distance with 99,73 % reliability is calculated:
P( x − tα M ≤ x ≤ x + tα M ) Pα
P(107,233 m – 4,09 · 3,61 mm < 107,233 m < 107,233 m + 4,09 · 3,61 mm) = P99,73%.
P(107,218 m < 107,233 m < 107,248 m) = P99,73%.
13. Relative error of line measurement results is determined:
1 m
= ;
N x
1 11,43 mm 0,01143 m
1
.
=
=
=
N 107,233 m 107,233 m 9400
MATHEMATICAL TREATMENT OF EQUAL PRECISION SURVEY RESULTS OF ONE
DIMENSION
Procedure:
1. To select minimum line length value.
2. To calculated differences between single measurement results and the values close to
arithmetic mean.
3. To calculate the arithmetic mean.
4. To calculate rounding error.
5. To calculate deviations of measurement results from arithmetic mean.
6. To check the calculation of arithmetic mean.
7. To check the calculation of sum of squared deviations from arithmetic mean.
8. To calculate squared mean error of weight unit.
9. To calculate squared mean error of squared mean error of weight unit.
10. To calculate squared mean error of gross arithmetic mean.
11. To calculate the reliability of squared mean error of gross arithmetic mean.
12. To calculate measurement precision tolerance.
13. To determine relative error of line measurement results.
The treatment of measurement results of the datum line is provided in table 7.2.
Table 7.2.
Datum lie measurement results treatments
Lines
Measurement
results
x i (m)
Weight
p
ε i (mm)
1
2
3
4
5
6
7
8
9
10
657,988
657,979
657,977
657,981
657,986
657,980
657,981
657,987
657,985
657,980
6
8
14
10
12
8
4
6
8
12
11
2
0
4
9
3
4
10
8
3
Σ = 88
Σ = 54
εi · p i
Σ
66
16
0
40
108
24
16
60
64
36
= 430
ε 2i · p i
Σ
726
32
0
160
972
72
64
600
512
108
= 3246
v i (mm)
Σ
+6
-3
-5
-1
+4
-2
-1
+5
+3
-2
= +4
vi · pi
Σ
36
-24
-70
-10
48
-16
-4
30
24
-24
= -10
v 2i · p i
Σ
216
72
350
10
192
32
4
150
72
48
= 1146
1. According to measurement results the minimum line length value of 657,977 m is taken. It will be
approximate value for arithmetic mean - x ′ .
2. The differences between single measurement results are measured and the values close to arithmetic
mean: ε i = xi − x' = 657,988 − 657,977 = 0,011 m = 11 mm .
3. Arithmetic mean is calculated:
10
x = x' +
∑ε
i
⋅ pi
i =1
10
∑p
= 657,977 +
430
⋅ 1000 = 657,9819 m ≈ 657,982 m.
88
i
i =1
4. Rounding error is calculated:
ϕ= x −x
apv.
= 657,98189 − 657,982 = − 0,00011 m = − 0,11 mm.
5. Measurement result deviations from arithmetic mean v are calculated:
v1 = x1 − x = 657,988 − 657,982 = − 0,011 m = −11 mm .
6. Calculation of the arithmetic mean is checked:
10
∑
10
∑p
vi p i = ϕ
i =1
i
= −0,11 ⋅ 88 = −9,68 ≈ −10 mm.
i =1
7. Calculation of sum of squared deviations from arithmetic mean is checked:
2
10
ε i ⋅ pi
10
10
2
2
2
= 3246 − 430 = 3246 − 2101,1 = 1144,9 mm².
ν i ⋅ pi = ε i ⋅ pi − i =1
10
n
i =1
i =1
∑
∑
∑
8. Squared mean error of weight unit is calculated:
10
µ=
∑ν
2
i
pi
i =1
=
n −1
1146
= 11,28 mm.
10 − 1
9. Squared mean error of squared mean error of weight unit is calculated:
mµ =
µ
2(n − 1)
11,28
=
2 (10 − 1)
= 1,41 mm.
10. Squared mean error of gross arithmetic mean is calculated:
M=
µ
=
10
∑p
11,28
88
= 1,20 mm.
i
i =1
11. The reliability of squared mean error of gross arithmetic mean is calculated:
mM =
M
2⋅n
=
1,20
2 ⋅ 10
= 0,27 mm.
12. Measurement precision tolerances are calculated:
12.1. Confidence interval for measured distance with 95 % reliability is calculated:
P( x − tα M ≤ x ≤ x + tα M ) Pα
P(657,982 m - 2,145 · 1,20 mm < 657,982 m < 657,982 m + 2,145 · 1,20 mm) = P95%.
P(657,979 m < 657,982 m < 657,984 m) = P95%.
12.2. Confidence interval for measured distance with 99,73 % reliability is calculated:
P( x − tα M ≤ x ≤ x + tα M ) Pα
P(657,982 m – 4,09 · 1,20 mm < 657,982 m < 657,982 m + 4,09 · 1,20 mm) = P99,73%.
P(657,977 m < 657,982 m < 657,987 m) = P99,73%.
13. Relative error of line measurement results is determined:
1 M
=
;
N
x
1,20 mm
0,0012 m
1
1
=
=
=
.
N 657,982 m 657,982 m 550000
QUESTIONS TO REPEAT:
• How is the measurement quality described?
• What requirements must meet the same measurement conditions?
• How are deviations of measurement results from arithmetic mean calculated?
• How is the squared mean error of one measurement calculated?
• How is the reliability of squared mean error of arithmetic mean calculated?
• What is tolerance?
REFERENCES
Se
q.
No.
Publishing
year
Information source (publication)
author, title and identification number
Publishin
g location
and house
(a tick-mark shall mean availability of the
source)
Kaunas
Other
College
Study Rooms
libraries
library
Key Information Sources
1
2008
2
2012
3
2012
ŽIVATKAUSKAS, Aurelijus, et al.
Geodezija: mokymo(si) priemonė.
ISBN 978-9955-511-87-8. 329 p.
Alexander, Ross, CLARKE.
Geodesy.
ISBN 978-1290098762. 378 p.*
Charles, D., GHILANI et al.
Elementary Surveying .
ISBN 978-0-13-255434-3. 984 p.*
Vilnius.
UAB
„Vaistų
žinios“
√
√
HardPress
Publishing
√
√
Westford
United States
of America
√
√
Technika
√
√
√
√
√
√
Springer –
Verlag
Berlin
Heidelberg
√
√
Valstybinė
geodezijos ir
kartografijos
tarnyba
√
√
Technika
√
√
Vilniaus
Gedimino
technikos
universitetas,
geodezijos
institutas
Kauno
kolegija
√
√
√
√
Additional Reading
1
1995
2
1996
3
4
5
2011
2003
2000
SKEIVALAS Jonas. Koreliuotų
geodezinių matavimų rezultatų
matematinis apdorojimas.
ISBN 9986-05-151-7 : 10.00 . 272 p.
TAMUTIS, Zigmas. ir kiti.
Geodezija-2
ISBN 5-420-01331-2. 384 p.
АЛЬБЕРТ, ГАМЗАТОВИЧ,
ЮНУСОВ, и др. Геодезия.
ISBN: 978-5-8291-1326-1,
978-5-98426-108-1. 409 p.*
ERIK W. GRAFAREND,
FRIEDRICH W. KRUMM, VOLKER
S. SCHWARZE. Geodesy – The
Challenge of the 3rd Millennium.
ISBN-10: 3642077331. 487 p.*
Geodezijos ir kartografijos techninis
reglamentas. GKTR 2.08.01:2000:
statybiniai inžineriniai geodeziniai
tyrinėjimai
Mokslo ir
enciklopedijų leidykla,
Издательство
"Академи
-ческий
Проект"
Periodicals
1
Geodezija ir kartografija.
ISSN 1392-1541
Geodesy and cartography.
ISSN 2029 – 6991*
2
3
Matavimų inžinerija ir GIS.
ISSN 2029-5790
Online Information Sources
1
http://www.infoera.lt
2
http://www.geoportalas.lt
3
http://www.gsb.lt
* references for international students
Prepared by:
assistant Vincas Zakarauskas
UNIVERSITY OF APPLIED SCIENCES
FACULTY OF LANDSCAPING
DEPARTMENT OF GEODESY
EVALUATED:_________________________
Date: _________________________2012
Teacher
_____________________Vincas Zakarauskas
Variant No._____
(signature)
___________group student_________________________________________________
(name, surname, signature)
GEODESY
1 mid-term test
Note: The answers must be concise, clearly worded. Writing must be readable. Every question
is valued by number of points indicated next to the question.
1. What is the precision of determination of horizontal position of a point when measuring by Real Time
Kinematic method using LITPOS and LEICA SMART NET LT networks of permanent reference GNSS
stations? (0,5 point)
2. Please, characterize GLONASS navigation satellite system? (0,5 point)
3. What is ephemeris? (0,5 point)
4. What does the GPS space segment consist of? (0,5 point)
5. What are the functions of GPS control segment? (1 point)
6. What GPS geodetic measurement methods do you know? (1 point)
7.
Please, characterize GALILEO navigation system? (0,5 point)
8. Please, characterize the essence of the Static GPS measurement method? (1 point)
9. Please, characterize the essence of the Real Time Kinematic GPS measurement method? (1 point)
10. What GPS measurable values do you know? (0,5 point)
11. What is the altitude of GPS NAVSTAR satellites and how many orbits does it consist of? (0,5 point)
12. What is the purpose of LITPOS networks of permanent reference GNSS stations? (0,5 point)
13. What is the environmental effect on GPS measurements? What environmental effect factors do you
know? (1 point)
14.
What are the main nodes and elements of GPS satellite? (1 point)
15. What is the angle of satellite inclination above the horizon set for in GPS device? What angle value is
set? (0,5 point)
2
UNIVERSITY OF APPLIED SCIENCES
FACULTY OF LANDSCAPING
DEPARTMENT OF GEODESY
EVALUATED:_________________________
Date: _________________________2012
Teacher
_____________________Vincas Zakarauskas
Variant No._____
(signature)
___________group student_________________________________________________
(name, surname, signature)
GEODESY
2 mid-term test
Task. Three points with known coordinates are given. The angles at points A, B, C are measured. Find the
coordinates of point PK-77.
B
A
β3
C
β
β
2
β
1
4
PK - 77
Fig. 2.1. Scheme of direct angular intersection
Table 2.1
Measurement data
Points
ß1
ß2
ß3
ß4
Angles
33°32'18"
26°02'22"
82°09'45"
57°23'30"
Table 2.2.
Point coordinates
Points
Coordinates, m
xA
5086116,04
xB
5086517,83
xC
5084516,92
yA
419202,94
yB
414801,53
yC
413935,02
1. Find plane rectangular coordinates of point PK-77 of triangle A, B, PK-77:
x PK −77 =
x A ctg β 2 + x B ctg β1 − y A + y B
=
ctg β1 + ctg β 2
2.1.
yA ctg β 2 + yBctg β1 + xA − xB
=
ctg β1 + ctg β 2
2.2.
yPK−77 =
2. Check plane rectangular coordinates of point PK-77 of triangle B, C, PK-77:
xPK−77 =
xB ctg β 4 + xC ctg β3 − y B + yC
=
ctg β3 + ctg β 4
2.3.
yPK−77 =
yBctg β4 + yC ctg β3 + xB − xC
=
ctg β3 + ctg β 4
2.4.
3. Evaluate the reliability of found coordinates for point PK-77; they may differ by 50 cm
4. Find mean coordinates of point PP-77:
x PK − 77 mean =
2.5.
y PK −77 mean =
2.6.
Sequence:
1. Find coordinates of PP-77 of triangle A, B, PP-77.
2. Check the calculation of point PP-77 coordinates of triangle C, B, PP-77.
3. Evaluate the reliability of found coordinates; they may differ by 50 cm.
4. Find mean coordinates of point PP-77.
Assessment of Mid-term Test:
The highest level of the
achievement of objectives
10
9
The medium level of the
achievement of objectives
8
7
Coordinates of point PP-77 of
triangle A, B, PP-77 are found
, the calculation of point PP77 coordinates of triangle C,
B, PP-77 is checked, the
Coordinates of point PP-77 of
triangle A, B, PP-77 are found,
the calculation of point PP-77
coordinates of triangle C, B,
PP-77 is checked, the
reliability of found
coordinates is evaluated,
mean coordinates of point
reliability of found
coordinates is not evaluated,
mean coordinates of point
PP-77 are calculated.
PP-77 are not calculated or
calculations are wrong.
The minimum level of the
Not achieved objectives
achievement of objectives
6
5
Coordinates of point PP-77
of triangle A, B, PP-77 are
found, the calculation of
point PP-77 coordinates of
triangle C, B, PP-77 is not
checked, the reliability of
found coordinates is not
evaluated, mean
coordinates of point PP-77
are not calculated or
calculations are wrong.
4
3
2
1
Coordinates of point
PP-77 of triangle A, B,
PP-77 are not found or
calculations are wrong,
the calculation of point
PP-77 coordinates of
triangle C, B, PP-77 is
not checked, the
reliability of found
coordinates is not
evaluated, mean
coordinates of point
PP-77 are not
calculated or
calculations are wrong.
2
UNIVERSITY OF APPLIED SCIENCES
FACULTY OF LANDSCAPING
DEPARTMENT OF GEODESY
APPROVED BY
The Head of the Department of Geodesy
_____________________
Birute Nenortaite
Form of Studies:
Full-time studies
Study Programme:
Real Estate Measurement Engineering
Subject:
Geodesy
Group:
NT 1
Semester:
Autumn semester
Teacher:
Vincas Zakarauskas
Test Form:
Examination
Examination Date:
January 2013
Assessment of the achievement level of the subject outcomes according to the task:
1. To select and check, adjust precise leveling devices.
2. To carry out precision leveling applying different methods.
3. To evaluate leveling results and their accuracy.
4. To select and evaluate geodetic devices for formation of geodetic networks.
5. To design and develop the detailed background for a plan.
6. To select and perform the measurements using electronic distance and angle measuring devices.
7. To know what is the Global Positioning System, its application possibilities dealing with various
geodetic tasks.
8. To link geodetic measurements to the sections of national geodetic network.
9. To analyze formation methods of the Lithuanian National Geodetic Network.
10. To analyze and adapt point coordination methods.
11. To plan, develop and evaluate the measurement according to GKTR (Technical Regulation of
Geodetic Cartography) requirements.
Learning outcomes: No. 1, 2, 3 are the constituents of study subject outcomes No. 1.1., 1.2., 2.1., 3.1.,
3.2., 3.3.
Teacher
_______________
Vincas Zakarauskas
(signature)
(name, surname)
UNIVERSITY OF APPLIED SCIENCES
FACULTY OF LANDSCAPING
DEPARTMENT OF GEODESY
EVALUATED:_________________________
Date: _________________________2012
Teacher _____________________Vincas Zakarauskas
Variant No._____
(signature)
________group student___________________________________________________________________
(name, surname, signature)
GEODESY
Examination (part I– theoretical questions)
Note: The answers must be concise, clearly worded. Writing must be readable. Every question is valued
by number of points indicated next to the question.
1. When and who by was the first precision leveling network of Lithuania established? (0, 1 point)
2. What is leveling? (0,1 point)
3. What is the precision of determination of horizontal position of a point when measuring by Real
Time Kinematic method using LITPOS and LEICA SMART NET LT networks of permanent
reference GNSS stations? (0,1 point)
4. Please, characterize GLONASS navigation satellite system? (0,3 point)
5. At what depth are the benchmarks of the Lithuanian National Vertical First Order Network dug
in? (0,1 point)
6. What is the average distance for installation of reference benchmarks and wall benchmarks
creating the Lithuanian National Vertical First Order Network? (0,1 point)
7. When and who did create the first in the world digital level? (0,1 point)
8. What are the advantages of leveling with precie digital levels? (0,2 point)
2
9. What does the accuracy of measurements by leveling with digital levels depend on? (0,3 point)
10. What image processing methods applied in modern digital levels do you know? (0,1 point)
11. What is ephemeris? (0,1 point)
12. What does the GPS space segment consist of? (0,3 point)
13. What are the functions of GPS control segment? (0,3 point)
14. What GPS geodetic measurement methods do you know? (0,3 point)
15. Please, characterize GALILEO navigation system? (0,3 point)
16. Please, characterize the essence of the Static GPS measurement method? (0,4 point)
17. Please, characterize the essence of the Real Time Kinematic GPS measurement method? (0,4
point)
18. What GPS measurable values do you know? (0,1 point)
3
19. What is the altitude of GPS NAVSTAR satellites and how many orbits does it consist of? (0,1
point)
20. What is the purpose of network of permanent reference GNSS stations LITPOS? (0,3 point)
21. How was the network of permanent reference GNSS stations LITPOS created? (0,3 point)
22. How were the coordinates of points of the network of permanent reference GNSS stations
LITPOS determined?
(0,1 point)
23. What is the purpose of electronic tachometer? (0,1 point)
24. What is the commonly used method for measuring of picket points with electronic tachometer?
(0,1 point)
25. Characterize the code method of limb spreading of electronic tachometer? (0,1 point)
26. Characterize the positioning method of limb spreading of electronic tachometer? (0,1 point)
27. Characterize the incremental method of limb spreading of electronic tachometer? (0,1 point)
4
UNIVERSITY OF APPLIED SCIENCES
FACULTY OF LANDSCAPING
DEPARTMENT OF GEODESY
EVALUATED:_________________________
Date: _________________________2012
Teacher _____________________Vincas Zakarauskas
Variant No._____
(signature)
________group student___________________________________________________________________
(name, surname, signature)
GEODESY
Examination (part I – theoretical questions)
Note The answers must be concise, clearly worded. Writing must be readable. Every question is
valued by number of points indicated next to the question.
1.
Please, characterize GALILEO navigation system? (0,3 point)
2. Please, characterize the essence of the Static GPS measurement method? (0,4 point)
3. Please, characterize the essence of the Real Time Kinematic GPS measurement method? (0,3
point)
4. What GPS measurable values do you know? (0,4 point)
5. What is the altitude of GPS NAVSTAR satellites and how many orbits does it consist of? (0,1
point)
5
6. What is the purpose of the network of permanent reference GNSS stations LITPOS? (0,2 point)
7. How is the network of permanent reference GNSS stations LITPOS made? (0,2 point)
8.
How were the coordinates of points of the network of permanent reference GNSS stations
LITPOS determined?
(0,1 point)
9. What is electronic tachometer? (0,1 point)
10. What is the principle of measurement of picket points with electronic tachometer? (0,1 point)
11. Characterize the code method of limb spreading of electronic tachometer? (0,1 point)
12. Characterize the positioning method of limb spreading of electronic tachometer? (0,1 point)
13. Characterize the incremental method of limb spreading of electronic tachometer? (0,1 point)
14. When and who by was the first precision leveling network of Lithuania established? (0,1 point)
15. What is leveling? (0,1 point)
16. What is the precision of determination of horizontal position of a point when measuring by Real
Time Kinematic method using LITPOS and LEICA SMART NET LT networks of permanent
reference GNSS stations? (0,1 point)
17. Please, characterize GLONASS navigation satellite system? (0,3 point)
6
18. At what depth are the ground control points of the Lithuanian National Vertical First Order
Network dug in? (0,1 point)
19. What is the average distance for installation of reference benchmarks and wall benchmarks
creating the Lithuanian National Vertical First Order Network? (0,1 point)
20. When and who did create the first in the world digital level? (0,1 point)
21. What are the advantages of leveling with precise digital levels? (0,2 point)
22. What does the accuracy of measurements by leveling with digital levels depend on? (0,2 point)
23. What image processing methods applied in modern digital levels do you know? (0,2 point)
24. What is ephemeris? (0,1 point)
25. What does the GPS space segment consist of? (0,3 point)
26. What are the functions of GPS control segment? (0,3 point)
27. What GPS geodetic survey methods do you know? (0,3 point)
7
Practical task No.1. Single direct angular intersection. Coordinates of points T1, T2 and T3 are given, and angles βn
are measured. Find the coordinates of point PK-1968 (Fig.1.).
Fig. 1. Scheme of direct angular intersection
Points
x, m
y, m
T1
T2
T3
86 000,9
86 517,8
84 540,3
19 190,9
14 801,5
13 882,9
Calculations:
xp =
yp =
xT1 ctgβ 2 + xT2 ctgβ 1 − yT1 + yT2
ctgβ1 + ctgβ 2
yT1 ctgβ 2 + yT2 ctgβ 1 + xT1 − xT2
ctgβ 1 + ctgβ 2
8
Practical task No. 2. To perform precision leveling between two points specified by the teacher applying
BFFB method. Use precise digital level Topcon DL - 102 C or similar.
To determine the following parameters:
1. Mean value of backsight readings.
2. Error in differences = (Backsight 1 – Foresight 1) – (Backsight 2 – Foresight 2).
3. Distance to the rod backsight.
4. n –rod scale.
5. σ – standard deviation.
6. d = Final distance backsight – Final distance foresight.
7. Σ = Final distance backsight + Final distance foresight.
8. Altitude change between the backsight 2 and foresight 2 measurements.
9. Altitude change on the station.
10. Benchmark (point) altitude.
11. Backsight point number.
Practical task No.3. Perform topographical works using electronic tachometer. The teacher
specifies four picket points. It is required to carry out geodetic measurements of these pickets and to
check the obtained results:
1. Horizontal angles.
2. Vertical angles and calculated inclination angles.
3. Measured distances on the ground surface.
4. Horizontal projections of measured distances.
5. Differences in heights to the picket points.
6. Coordinates of picket points.
7. Altitudes of picket points.
General assessment of the results of the examination
The teacher organizes, conducts and evaluates the results of examination.
Examination results are marked on a ten-point scale.
Assessment of the results of examination is performed following the achievement levels of subject
outcomes defined as follows:
the highest level of achievement of the objectives (9-10 points): all tasks are completed; answers are
acceptable, comprehensive and reasonable; original or several acceptable options of solution of raised problems are
provided and the optimal option is reasonably selected; various and adequate theoretical models and analyses are
applied to deal with the tasks, and the obtained results are compared; comprehensive theoretical knowledge is
demonstrated according to the objectives specified in task appendices;
the medium level of achievement of the objectives (7-8 points): more than two-thirds of all tasks are
completed; the answers to questions and problem solutions are acceptable and reasonable; adequate theoretical
models and analyses are applied to deal with the tasks; good theoretical knowledge is demonstrated according to
the objectives specified in task appendices;
the minimum compulsory level of achievement of the objectives (5-6 points): more than half of all tasks is
completed; the answers are acceptable in general; problems are solved in general; acceptable theoretical models
and analyses are applied to deal with the tasks; minimum of necessary theoretical knowledge is demonstrated
according to the objectives specified in task appendices.
9
Theoretical task takes up 50% of the exam value. Every question is valued by a point indicated next to it.
Practical task takes up 50% of the exam value: the first practical task – 20%, the second practical task – 30%, the
third practical task – 50% of the total value of the practical test.
The task is marked on 10-point scale. P = 0,2 × 1PU + 0,3 × 2PU + 0,5 × 3PU
here:
1PU; 2PU, 3PU – practical tasks
Assessment criteria of the practical task No. 1:
The highest level of the
achievement of objectives
10
9
x or y coordinates of
point PK-1968 are
calculated, the calculation
of coordinates is checked,
change of x and y
coordinates of the
calculated point does not
exceed 0,3 m. The task is
completely performed.
The medium level of the
achievement of objectives
8
7
x or y coordinates of
point PK-1968 are
calculated for two
triangles, without
checking the coordinated
points. Change of x and y
coordinates of the
calculated point does not
exceed 0,3 m.
x or y coordinates of
point PK-1968 are
calculated for one
triangle, but check
calculation was not
performed.
The calculation of x or y
coordinates of point PK1968 is wrong, check
calculation is not
complete.
The minimum level of the
achievement of objectives
6
5
x or y coordinates of point
PK-1968 are calculated for
two triangles performing
the check of coordinated
points. Change of x and y
coordinates of the
calculated point does not
exceed 0,3 m. x or y
coordinates of point PK1968 are not calculated.
The calculation is not
checked.
Not achieved objectives
4
3
2
1
x or y coordinated of point PK1968 are calculated for one
triangle only, check
calculation for other triangle is
not performed. Secondary
calculation only are carried
out.
Calculations of coordinates of
point PK-1968 were not
carried out or they are wrong,
without check calculation.
Assessment criteria of the practical task No. 2:
The highest level of the
achievement of objectives
10
9
The medium level of the
achievement of objectives
8
7
The minimum level of the
achievement of objectives
6
5
Not achieved objectives
4
3
2
1
10
Average value of
backsight readings is
determined. Error in
differences = (Backsight
1 – Foresight 1) –
(Backsight 2 – Foresight
2) was determined.
Backsight distance to the
rod was determined. The
total number of
measurements was
determined, standard
deviation. Distance to the
place of installation of the
level (in meters) was
determined. Leveling
length from reference
benchmark was
determined. Change of
heights in difference
backsight 2 and foresight
2 was determined;
Change of heights at the
station was determined.
The altitude of
benchmark (point) was
determined. Numbers of
points (benchmarks) were
determined.
The task is completely
performed.
The following
measurements can be
carried out in the course
of measurements:
determination of the
average value of
backsight readings.
Determination of the error
in differences =
(Backsight 1 – Foresight
1) – (Backsight 2 –
Foresight 2).
Determination of
backsight distance to the
rod. Determination of the
total number of
measurements, standard
deviation. Distance to the
place of installation of the
level (in meters) was
determined. Leveling
length from reference
benchmark was
determined.
Determination of the
change of heights in
difference backsight 2 and
foresight 2;
Change of heights at the
station was determined.
The altitude of benchmark
(point) was determined.
Numbers of points
(benchmarks) were
determined.
Approximately 70-80 %
of the task were
performed.
The following
measurements may be
carried out in the can of
measurements:
determination of the
average value of backsight
readings. Determination of
the error in differences =
(Backsight 1 – Foresight 1)
– (Backsight 2 – Foresight
2). Determination of the
backsight distance to the
rod. Determination of the
total number of
measurements, standard
deviation. Distance to the
place of installation of the
level (in meters) was
determined. Leveling
length from reference
benchmark was determined.
Determination of the
change of heights in
difference backsight 2 and
foresight 2;
Change of heights at the
station was determined.
The altitude of benchmark
(point) was determined.
Numbers of points
(benchmarks) were
determined.
Approximately 50-70 %
of the task were performed.
Some measurements can be
carried out in the course of the
measurements, non-systematic
measurements: Other
secondary tasks performed
only. Less than 50 % of the
task were performed.
The minimum level of the
achievement of objectives
6
5
Not achieved objectives
Assessment criteria of the practical task No. 3:
The highest level of the
achievement of objectives
10
9
The medium level of the
achievement of objectives
8
7
4
3
2
1
11
Measurement of
horizontal angles was
performed. Measurement
of vertical angles was
performed and vertical
angles were calculated.
Distances were measured.
Line slope lengths and
horizontal projections
were determined.
Measurements of changes
of height to pickets.
Coordinates of picket
points were determined.
Picket altitudes were
determined.
The task is completely
performed.
The following
measurements can be
carried out in the course
of measurements:
Measurement of
horizontal angles was
performed. Measurement
of vertical angles was
performed and vertical
angles were calculated.
Distances were measured.
Line slope lengths and
horizontal projections
were determined.
Measurements of changes
of height to pickets.
Coordinates of picket
points were determined.
Picket altitudes were
determined.
Approximately 70-80 %
of the task were
performed.
The following
measurements can be
carried out in the course of
measurements:
Measurement of horizontal
angles was performed.
Measurement of vertical
angles was performed and
vertical angles were
calculated. Distances were
measured. Line slope
lengths and horizontal
projections were
determined. Measurements
of changes of height to
pickets. Coordinates of
picket points were
determined. Picket altitudes
were determined.
Approximately 50 - 60 %
of the task were performed.
Some measurements can be
carried out in the course of the
measurements, non-systematic
measurements: Other
secondary tasks performed
only. Less than 50 % of the
task were performed.
Examination assessment E = 0,5T + 0,5P
here: T– theoretical task;
P– practical task
Examination is passed if subject objectives are achieved at least to the minimum compulsory level.
The outcomes of studies are determined by the total index of assessment of student’s knowledge and skills individual cumulative index (ICI ).
ICI = 0,5 E + 0,15 K + 0,15 P + 0,2 S,
here: E - examination, K – mid-term tests, P – practical works, S – individual works.
Teacher
______________
Vincas Zakarauskas
(signature)
12