1
User Guide
For dB Foresight Software, Version 3.01
Windows ® Version
Included In This User Guide:
The Quick Start Guide
Installation, Startup and Operation Instructions
The End User License Agreement
Warranty description
Refund policy
Functional Specifications
Noise Level Prediction Methodologies
User Guide Version: 3.01
Date: September 8, 2015
Copyright © 2015 dB Foresight Corporation
Noise Level Prediction And Mapping Software
Contents
1 Licensing ........................................................................................................................................... 5
1.1 License Definitions. ....................................................................................................................... 5
1.2 End User License Agreement for dB Foresight ............................................................................. 5
1.3 Software Product License .............................................................................................................. 6
1.3.1 Grant of License .......................................................................................................................... 6
1.3.2 Description of Other Rights and Limitations .............................................................................. 6
1.3.3 Upgrades ..................................................................................................................................... 7
1.3.4 Copyright and Trademarks ......................................................................................................... 7
1.3.5 Limited Warranty ........................................................................................................................ 7
1.3.6 Refund Policy.............................................................................................................................. 8
1.3.7 Terms Of The License ................................................................................................................ 8
2 System Requirements........................................................................................................................ 8
2.1 Standard System Requirements ..................................................................................................... 8
3 About dB Foresight ........................................................................................................................... 9
3.1 dB Foresight 3 New Features ....................................................................................................... 10
3.2 File Types And Descriptions Table ............................................................................................. 10
3.3 Elevations File Format ................................................................................................................. 11
3.3.1 Elevations File Format Table .................................................................................................... 12
4 Installation And Uninstallation Procedures .................................................................................... 12
4.1 Pin to Taskbar or Start Menu ....................................................................................................... 14
4.2 Unable To Open dBFConfig.csv File .......................................................................................... 14
4.3 dB Foresight Properties................................................................................................................ 15
4.4 Run As Administrator .................................................................................................................. 15
4.5 Uninstallation ............................................................................................................................... 16
5 Quick Start Guide ........................................................................................................................... 16
6 Operational Instructions .................................................................................................................. 17
6.1 Project Panel ................................................................................ Error! Bookmark not defined.
6.2 Project Settings and Specifications Table .................................................................................... 19
6.2.1 Valid Data Identification, Project Settings Panel Screenshot ................................................... 21
6.3 Source Settings Panel ................................................................................................................... 24
6.4 Source Settings and Specifications Table .................................................................................... 25
6.4.1 Valid Data Identification, Source Settings Panel Screenshot ................................................... 26
6.5 Solid Barrier Settings Panel ......................................................................................................... 27
6.6 Barrier Settings and Specifications Table .................................................................................... 28
6.7 Custom Barrier Settings Panel ..................................................................................................... 29
6.8 Custom Barrier Settings and Specifications Table ...................................................................... 30
6.9 POR Settings Panel ...................................................................................................................... 32
6.10 POR Settings and Specifications Table ..................................................................................... 33
6.11 Contours Lines Settings Panel ................................................................................................... 34
6.12 POR Settings and Specifications Table ..................................................................................... 35
6.13 Filled Contours Settings Panel ................................................................................................... 37
6.14 Filled Contours Settings and Specifications Table .................................................................... 37
7 Menu Toolbar.................................................................................................................................. 39
7.1 File Menu ..................................................................................................................................... 39
7.1.1 File Menu Screenshot ............................................................................................................... 40
dB Foresight, User Guide, Version 3.01
Copyright © 2015 dB Foresight Corporation
Page 2 of 76
Noise Level Prediction And Mapping Software
7.2 Edit Menu..................................................................................................................................... 40
7.2.1 Edit Menu Screenshot ............................................................................................................... 41
7.3 Project Menu ................................................................................................................................ 41
7.3.1 Project Settings ......................................................................................................................... 41
7.3.2 Output Data Folder Location .................................................................................................... 42
7.3.3 Project Menu Screenshot .......................................................................................................... 42
7.4 Run Menu..................................................................................................................................... 42
7.4.1 Run Menu Screenshot ............................................................................................................... 43
7.5 Map Creation Process, Progress Panel Screenshot ...................................................................... 44
7.6 Map Creation Process, Progress Panel Screenshot ...................................................................... 45
7.7 Help Menu ................................................................................................................................... 45
7.7.1 Help, Menu Screenshot ............................................................................................................. 46
7.7.2 Help About dB Foresight Panel ................................................................................................ 46
7.7.3 Help About dB Foresight Panel Screenshot.............................................................................. 47
7.7.4 Help User Guide Panel.............................................................................................................. 47
7.7.5 Help User Guide Panel.............................................................................................................. 48
7.7.6 Help Check For Updates and Forum Menus............................................................................. 48
8 Viewing dB Foresight Created Files ............................................................................................... 48
8.1 Output File Listings ..................................................................................................................... 49
8.2 Google Earth Settings .................................................................................................................. 51
8.3 Example Georeferenced Plot, Noise Contour Lines and Contour Fill, No Elevations Included . 52
8.4 Example Georeferenced Plot, Noise Contour Lines and Contour Fill, Elevations Included ....... 53
8.5 Sample Georeferenced Elevation Contour Lines Plot On Google Earth ..................................... 54
8.6 Example Georeferenced Noise Filled Contours Plot ................................................................... 55
8.7 Example Georeferenced Noise Contour Lines Plot ..................................................................... 56
8.8 Microsoft Excel Charting Limitations ......................................................................................... 57
8.9 Sample Microsoft Excel Noise Level Surface Chart ................................................................... 58
8.10 Sample Output Data Chart ......................................................................................................... 59
8.11 Sample Plots And Legend .......................................................................................................... 59
8.11.1 Sample Noise Contour Lines PNG File Image ....................................................................... 60
8.11.2 Sample Noise Filled Contours PNG File Image ..................................................................... 61
8.11.3 Sample Noise Contour Lines Legend ..................................................................................... 62
8.11.4 Sample Noise Filled Contours Legend ................................................................................... 63
9 Noise Level Prediction Methodologies ........................................................................................... 64
9.1 Noise level Prediction Confidence ............................................................................................ 65
9.2 Noise Impact Assessment Parameters ....................................................................................... 65
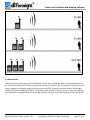
9.3 Geometric Divergence ................................................................................................................. 65
9.3.1 Directivity ................................................................................................................................. 66
9.3.2 Distance Effects ........................................................................................................................ 66
9.3.3 Distance Effect Illustration ....................................................................................................... 67
9.4 Ground Effects ............................................................................................................................. 67
9.4.1 Ground Attenuation Regions Table .......................................................................................... 68
9.4.2 Expressions Used For Hard Ground Type ................................................................................ 69
9.5 Atmospheric Conditions ............................................................................................................. 69
9.6 ISO-9613-2 Atmospheric Attenuation Coefficients ................................................................. 69
9.7 Meteorological Conditions ......................................................................................................... 70
9.7.1 Downwind Propagation ............................................................................................................ 70
9.7.2 Temperature Inversions ............................................................................................................ 70
9.8 Multiple Sources .......................................................................................................................... 71
dB Foresight, User Guide, Version 3.01
Copyright © 2015 dB Foresight Corporation
Page 3 of 76
Noise Level Prediction And Mapping Software
9.8.1 Multiple Sources Effect On Noise Levels ................................................................................ 71
9.9 Noise Barriers .............................................................................................................................. 72
9.9.1 Effect Of Noise Barriers On Attenuation.................................................................................. 73
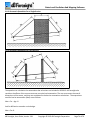
9.9.2 Geometric Quantities For a Single Barrier ............................................................................... 74
9.9.3 Geometric Quantities For Two Barriers ................................................................................... 74
10 Continuous Improvement.............................................................................................................. 76
Copyright © 2015 dB Foresight Corporation
All rights reserved. Unless otherwise specified, no part of this publication may be reproduced or utilized in any
form or by any means, electronic or mechanical, including photocopying and microfilm, without permission
from dB Foresight Corporation.
dB Foresight Corporation, Calgary, Alberta, Canada, website: www.dbforesight.com.
dB Foresight, User Guide, Version 3.01
Copyright © 2015 dB Foresight Corporation
Page 4 of 76
Noise Level Prediction And Mapping Software
Acronyms
BMP – Bitmap File Format
CSV – Comma Separated Values
dB – Decibel
dBA – Decibel, A-weighted
EULA - End User License Agreement
ISO - International Organization for Standardization
JPEG – Joint Photographic Experts Group
KML – Keyhole Markup Language
MSI – Microsoft Installer
PNG – Portable Network Graphics
POR – Point Of Reception
PWYW - Pay What You Want
SPL – Sound Pressure Level
SWL – Sound Power Level
TGA – Truevision TGA (TARGA)
XDB – dB Foresight File Format
1 Licensing
1.1 License Definitions.
In this End User License Agreement, unless the contrary intention appears,
"EULA" - End User License Agreement.
“YOU” – The "Licensee" or the organization (if any) on whose behalf YOU are taking the EULA.
"Registered Edition of dB Foresight" - The officially released edition of the SOFTWARE PRODUCT which is
available from the web site: http://www.dbforesight.com .
"SOFTWARE PRODUCT" or "SOFTWARE" – The dB Foresight application, which includes computer software
and associated media and printed materials, and may include online or electronic documentation.
"Support Services" – Email based support provided by dB Foresight Corporation, including advice on usage of
dB Foresight, investigation of bugs, fixes, repairs of models if and when appropriate and general product
support.
1.2 End User License Agreement for dB Foresight
IMPORTANT-READ CAREFULLY.
This dB Foresight End-User License Agreement (“EULA”) is a legal AGREEMENT between you and dB Foresight
Corporation for the dB Foresight Software Product identified above, which product includes computer
software and may include associated media, printed materials, and “online” or electronic documentation
dB Foresight, User Guide, Version 3.01
Copyright © 2015 dB Foresight Corporation
Page 5 of 76
Noise Level Prediction And Mapping Software
(“SOFTWARE PRODUCT”). By installing, copying, or otherwise using the SOFTWARE PRODUCT, you agree to be
bound by the terms of this EULA. If you do not agree to the terms of this EULA, then DO NOT install or use the
SOFTWARE PRODUCT; in such event the original purchaser may, however, return it to the place of purchase
within thirty days of the date of original purchase for a full refund.
1.3 Software Product License
The SOFTWARE PRODUCT is protected by copyright laws and international copyright treaties, as well as other
intellectual property laws and treaties. The SOFTWARE PRODUCT is licensed, not sold.
1.3.1 Grant of License
In accordance with the terms of this EULA YOU are granted the following rights:
a) to install and use only one copy of the SOFTWARE PRODUCT, or in its place, any prior version for the same
operating system, on a single computer.
b) to make copies of the SOFTWARE PRODUCT for backup and archival purposes.
1.3.2 Description of Other Rights and Limitations
Limitations on Reverse Engineering, Decompilation, and Disassembly:
YOU may not modify, reverse engineer, decompile, or disassemble the SOFTWARE PRODUCT. The SOFTWARE
PRODUCT is licensed as a single product. Its component parts may not be separated for use on more than one
computer.
Rental Rights:
You may not rent, lease, or lend the SOFTWARE PRODUCT to any party.
Software Transfer:
You may permanently and wholly transfer all of your rights under this EULA, provided you
(a) retain no copies (whole or partial),
(b) permanently and wholly transfer any and all of the SOFTWARE PRODUCT (including all
component parts, the media and printed materials, any upgrades, this EULA, and, if applicable, the Certificate
of Authenticity) to the recipient, and
(c) the recipient first agrees to abide by all of the terms of this EULA. If the SOFTWARE
PRODUCT is an upgrade, any transfer must include any and all prior versions of the SOFTWARE PRODUCT and
any and all of your rights therein, if any. Promptly upon the transfer, written evidence of such transfer shall be
provided to dB Foresight Corporation.
dB Foresight, User Guide, Version 3.01
Copyright © 2015 dB Foresight Corporation
Page 6 of 76
Noise Level Prediction And Mapping Software
Support Services:
dB Foresight Corporation will provide you with support services related to the SOFTWARE PRODUCT (“Support
Services”). Support will be by email or our website support forum communications only. Any supplemental
software code provided to you as part of the Support Services shall be considered part of the SOFTWARE
PRODUCT and subject to the terms and conditions of this EULA. With respect to technical information you
provide to dB Foresight Corporation as part of the Support Services, dB Foresight Corporation may use such
information for its business purposes, including for product updates and development. dB Foresight
Corporation will use its best efforts to not utilize such technical information in a form that personally identifies
you.
Termination:
Without prejudice to any of dB Foresight Corporation‘s other rights, dB Foresight Corporation may terminate
this EULA if you fail to comply with the terms and conditions of this EULA. In such event, you must destroy any
and all copies of the SOFTWARE PRODUCT, all of its component parts and any maps or files created by dB
Foresight during your usage of the Product; to this end you grant to dB Foresight Corporation the right to, with
or without notice, monitor your Internet accessible activities for the purpose of verifying SOFTWARE PRODUCT
performance and/or your compliance with the terms hereof, including, but not limited to the remote
monitoring and verification of your implementation, use and duplication of the SOFTWARE PRODUCT.
1.3.3 Upgrades
If the SOFTWARE PRODUCT is labeled or otherwise identified by dB Foresight Corporation as an “upgrade”,
you must be properly licensed to use a product identified by dB Foresight Corporation as being eligible for the
upgrade in order to use the SOFTWARE PRODUCT. A SOFTWARE PRODUCT, labeled or otherwise identified by
dB Foresight Corporation as an upgrade, replaces and/or supplements the product that formed the basis for
your eligibility for such upgrade. You may use the resulting upgraded product only in accordance with the
terms of this EULA. If the SOFTWARE PRODUCT is an upgrade of a component of a package of software
programs that you licensed as a single product, the SOFTWARE PRODUCT may be used and transferred only as
part of that single product package and may not be separated for use on more than one computer.
1.3.4 Copyright and Trademarks
All title, trademarks and copyrights in and pertaining to the SOFTWARE PRODUCT (including but not limited to
any images, photographs, animation, video, audio, music, text, and applets incorporated into the SOFTWARE
PRODUCT), the accompanying, printed materials and any copies of the SOFTWARE PRODUCT are owned by dB
Foresight Corporation.
1.3.5 Limited Warranty
During the warranty period, dB Foresight Corporation warrants that its standard, generally supported
Software (excluding Beta Code), when properly installed, will substantially conform to the functional
specifications set forth in the applicable User Guide. The warranty period is 90 days from the date of
Customer's initial receipt of Software. Customer must notify dB Foresight Corporation in writing of any
dB Foresight, User Guide, Version 3.01
Copyright © 2015 dB Foresight Corporation
Page 7 of 76
Noise Level Prediction And Mapping Software
nonconformity within the warranty period. This warranty applies only to the initial shipment of Software
under the applicable Order and does not renew with the delivery of (a) Software Updates or Upgrades or (b)
new or reissued authorization codes. This warranty shall not be valid if Software has been subject to misuse,
modification or improper installation.
dB Foresight Corporation offers no warranty that the software will detect or protect against all threats or be
error-free or free from interruptions or other failures. dB Foresight Corporation 's entire liability and
customer's exclusive remedy shall be, at dB Foresight Corporation 's option, either (a) refund of the price paid
upon return of software to dB Foresight Corporation and a certification that customer has destroyed all copies
or (b) modification or replacement of software that does not meet this limited warranty, provided customer
has otherwise complied with this agreement. dB Foresight Corporation offers no warranties with respect to:
(a) services; (b) software which is licensed at no charge; or (c) beta code; all of which are provided "as is."
Subject to the Limitation of Liability, the warranties set forth in this license are exclusive. Neither dB Foresight
Corporation nor its licensors offer any other warranties, terms or conditions, express, implied or statutory,
with respect to software or other material provided under this agreement. dB Foresight Corporation and its
licensors specifically disclaim all implied warranties, terms, conditions, and representations of (a)
merchantability, satisfactory quality, fitness for a particular purpose and non-infringement of intellectual
property, and (b) those arising out of course of dealing, usage or trade. No oral or written information or
advice given by dB Foresight Corporation or dB Foresight Corporation 's authorized representatives shall
create a warranty or other obligations on behalf of dB Foresight Corporation This Section shall survive
termination or expiration of this Agreement.
1.3.6 Refund Policy
dB Foresight Corporation will provide a full refund if You are not satisfied with the dB Foresight product. You
must notify dB Foresight Corporation within 30 days of purchase of the dB Foresight product and provide
details on why you are not satisfied with the product. This will help us improve the product for future releases.
You must fully uninstall dB Foresight from your computer and delete any copies of it or any maps or files
created by dB Foresight. dB Foresight Corporation will initiate the refund process with PayPal or other
payment method used, within 15 days of receipt of your notification.
1.3.7 Terms Of The License
This license is a PWYW (Pay What You Want) agreement. You may download and try out the Software Product
for free. But once you are satisfied with the product and intend to continue using it you must pay for it, for the
amount you feel it is worth. The license will be valid until December 31, 2016. After December 31, 2016 dB
Foresight Corporation reserves the right to either continue to extent the PWYW licenses or change the license
type. The license renewal and payment instructions will be posted on the website www.dbforesight.com.
2 System Requirements
The following table lists preferred minimum system requires to run dB Foresight.
2.1 Standard System Requirements
Component
dB Foresight, User Guide, Version 3.01
Minimum Requirement
Copyright © 2015 dB Foresight Corporation
Page 8 of 76
Noise Level Prediction And Mapping Software
Computer and processor
Memory
Hard disk
Display
Operating system
Network Card / Internet
Access
PC, 2-gigahertz (GHz) processor, quad-core. It will run on a slower PC,
but computation may take longer to run.
1 gigabyte (GB) RAM or higher.
5 gigabyte (GB) available disk space. The data files could require up to
50 MB per project.
1024 × 768 or higher resolution monitor.
Windows XP:
Home/ Professional/ 64-bit Edition
Windows Vista:
Home Basic/Home Premium / Business / Ultimate
Windows 7:
Home Basic/Home Premium/Professional/Enterprise/ Ultimate
Windows 10:
Running in Windows 7 compatibility mode.
High speed internet access is preferred. This is required to view the
noise plots on Google Earth. dB Foresight also requires internet access
to verify the Product Verification Code.
3 About dB Foresight
dB Foresight is a software application that predicts noise levels for outdoor industrial projects. It uses the
computation methodologies as defined in the international standard ISO 9613-2. The noise level prediction
plots and data can be used for permitting, regulatory applications or public consultations. For more
information on noise level prediction calculation methodologies refer to section 10 Noise Level Prediction
Methodologies.
One of dB Foresight’s strengths is the ability to consider site elevation and topographic data. It computes
barrier attenuation effects based on the both natural elevation contours and man-made barriers. This
produces realistic, accurate noise level predictions for the assessment area. dB Foresight’s simultaneous
multiprocessing feature takes advantage of all the computer CPU cores to speed up the computations and
reduce run time. The user interface is extremely intuitive and efficient.
The input data required includes the projects’ geographic coordinates, project settings along with source, POR,
barrier and plot settings. This data is entered and saved as dB Foresight project files.
The output files created by dB Foresight include predicted noise level contour line and filled contour plots in
numerous file types. KML files are created which georeference the plot file images for viewing in Google
Earth, ArcGIS, or most standard GIS applications. Complete noise level data files with latitude, longitude and
SPL levels are also created.
The file types created are listed in the table below. Each file name contains the project name, file type and a
unique 6 digit number which is the hour, minute and second (HHMMSS) it was created. The KML files
georeference the plot files and require the complete path and file names. If you edit the plot file names or
move them to another folder, then the file name references will need to be updated in Google Earth. Please
refer to the ‘Google Earth Settings’ section of this user guide for details on updating the file name references
in Google Earth.
dB Foresight, User Guide, Version 3.01
Copyright © 2015 dB Foresight Corporation
Page 9 of 76
Noise Level Prediction And Mapping Software
3.1 dB Foresight 3 New Features
dB Foresight 3.01 has the following new features, and improvements:
-
For insufficient memory allocation errors, version 3.01 now checks for sufficient memory allocation and
gives the user a message to reduce project data points to save memory. Previously the software would
freeze and give the error message on shut down.
dB Foresight 3.00 has the following new features, and improvements:
-
Customized barriers: louvered or split barriers which are partial louvered and partial solid
Increased component count: Sources-500, Barriers-500, Custom Barriers-500, PORs-500
Increased resolution: up to 1000 divisions per axis
Increased speed: restructured software to run up to 10 times faster or more depending on configuration
Ability to include day and night time ambient SPLs for the PORs
Improved POR SPL output data table, which includes the day and night time data
Selectable current or previous data input: can be used to fine tune plotting for data already computed in a
previous project, includes setting the previous project SPL data file
More flexibility in the plot settings, including plot height, resolution and marker types
New Cmet feature: this is a meteorological correction based on the site location and know conditions
Simplified POR height is now the “Receiver (Map) Height”, so that it can be set with one point
Intermediate output data files for improved impact analysis and mitigation
Ability to exclude barriers for selected sources (ex: if the barrier is the source enclosure).
3.2 File Types And Descriptions Table
#
File Names And Folders Created By dB Foresight
ProjectName_HHMMSS
1
Data
2
NoiseLevels_HHMMSS.csv*
2.1
2.2
POR_SPLs_HHMMSS.csv
2.3
ProjectData_HHMMSS.csv
2. a
2.a1
Data/PORSPL
PORSPLHHMMSS.csv
2.b
2.b1
2.b2
Data/SiteSPL
SiteSPLHHMMSS.csv
SiteSPLHeadersHHMMSS.csv
2.c
2.c1
Data/SPLPerSrc_FullGrid
FullGrid_HHMMSSSPLPerSrcNum_0.csv ...
dB Foresight, User Guide, Version 3.01
Description
Project folder
Data folder
The predicted noise sound pressure levels for
each latitude and longitude in the project area.
These levels do not include the cumulative
project and ambient SPLs. * Used when
“Previous Project” is set in the Project Panel.
The generated, day and night time ambient and
cumulative SPLs at each POR. The POR
coordinates.
A copy of all project settings from the project
XDB file.
PORSPL folder
The SPL level at each POR point. The Project
Settings information.
SiteSPL folder
The SPL values for the full project site.
The SPL values for the full project site, with
headers.
SPLPerSrc_FullGrid folder
The generated SPLs for the full site for each
Copyright © 2015 dB Foresight Corporation
Page 10 of 76
Noise Level Prediction And Mapping Software
source.
2.d
2.d1
Data/SPLPerSrc_PORs
PORs_HHMMSSSPLPerSrcNum0.csv
SPLPerSrc_PORs folder
3
Noise_ContourLines
3.1
3.2
3.3
NoiseContourLines_ HHMMSS.bmp
NoiseContourLines_ HHMMSS.jpeg
NoiseContourLines_ HHMMSS.kml
3.4
3.5
3.6
3.7
4
NoiseContourLines_ HHMMSS.png
NoiseContourLines_ HHMMSS.tga
NoiseContourLinesLegend_ HHMMSS.png
NoiseContourLinesLegend_ HHMMSS.tga
Noise_FilledContours
4.1
4.2
4.3
NoiseFilledContours_ HHMMSS.bmp
NoiseFilledContours_ HHMMSS.jpeg
NoiseFilledContours_ HHMMSS.kml
4.4
4.5
4.6
NoiseFilledContours_ HHMMSS.png
NoiseFilledContours_ HHMMSS.tga
NoiseFilledContoursLegend_ HHMMSS.png
4.7
NoiseFilledContourssLegend_ HHMMSS.tga
5
5.1
Placemarks
Placemarks_ HHMMSS.kml
5.2
SrcStructurePlacemarks_ HHMMSS.kml
The generated SPLs at each POR for each
source.
Folder of plots for the predicted noise levels in
the contour lines format.
A BMP format of the noise contour lines plot.
A JPEG format of the noise contour lines plot.
A georeferenced KML format of the noise
contour lines plot. This file can be opened in
Google Earth, ArcGIS or most standard GIS
applications.
A PNG format of the noise contour lines plot.
A TGA format of the noise contour lines plot.
A PNG format of the noise contour lines legend.
A TGA format of the noise contour lines legend.
Folder of plots for the predicted noise levels in
the filled contours format.
A BMP format of the noise filled contours plot.
A JPEG format of the noise filled contours plot.
A georeferenced KML format of the noise filled
contours plot. This file can be opened in Google
Earth, ArcGIS or most standard GIS applications.
A PNG format of the noise filled contours plot.
A TGA format of the noise filled contours plot.
A PNG format of the noise filled contours plot
legend.
A TGA format of the noise filled contours plot
legend.
Placemarks Folder
The georeferenced placemarks to view the
source, POR and barrier names in Google Earth,
ArcGIS or most standard GIS applications.
The georeferenced placemarks to view the
source structure endpoints in Google Earth,
ArcGIS or most standard GIS applications. These
points are used to create and assess the affects
the source structures would have on sound
level attenuations.
3.3 Elevations File Format
dB Foresight can accept elevation data to assess the noise level attenuation due to natural barriers and
elevation changes. The format of the elevation data must be a CSV file in the following format.
dB Foresight, User Guide, Version 3.01
Copyright © 2015 dB Foresight Corporation
Page 11 of 76
Noise Level Prediction And Mapping Software
Elevations File Format Table
The application Elevation Mapper creates the elevations in a file format accepted by dB Foresight. The
Elevation Mapper software can be purchased and downloaded at www.elevationmapper.com.
4 Installation And Uninstallation Procedures
To install the dB Foresight download and double click on the ElevationMapperInstallerVer20.exe shortcut.
Note: the Installer version will be the released version which you have download.
This is a standard installer application which will automatically start up and guide you through the installation
process. The installer will prompt you for the installation path, and suggest the preferred installation at
C:\MyPrograms\ElevationMapper. If you select this path it will automatically create new folders, if required,
and install the application at this selected location.
dB Foresight, User Guide, Version 3.01
Copyright © 2015 dB Foresight Corporation
Page 12 of 76
Noise Level Prediction And Mapping Software
It is preferable NOT to install dB Foresight on either C:\Program Files or C:\Program Files(x86). These locations
may require administrator privileges to run. If one of these paths is required, then see below on how to set dB
Foresight to run in administrator mode.
After installation you will see a dB Foresight shortcut on your PC Desktop. You can start up the dB Foresight
application by double clicking on this shortcut. To pin the short cut to your Taskbar or Start Menu , right click
on the dB Foresight shortcut and select ‘Pin to Taskbar’ or ‘Pin to Start Menu’.
dB Foresight, User Guide, Version 3.01
Copyright © 2015 dB Foresight Corporation
Page 13 of 76
Noise Level Prediction And Mapping Software
4.1 Pin to Taskbar or Start Menu
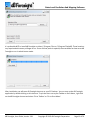
If you installed the application on the C:\Program Files(x86) or other folder locations that prevent write access,
you may get the following error when you start the application.
4.2 Unable To Open dBFConfig.csv File
If you get this error you can unlock the folder by setting the application to run in administrator mode. To do
this, right click on the dB Foresight shortcut, select ‘Properties’, click the ‘Compatibility’ tab then select the box
next to ‘Run this program as an administrator’, as per the following screenshot.
dB Foresight, User Guide, Version 3.01
Copyright © 2015 dB Foresight Corporation
Page 14 of 76
Noise Level Prediction And Mapping Software
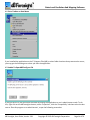
4.3 dB Foresight Properties
You can also right click on the dB Foresight shortcut and select ‘Run As Administrator’, though you will need to
do this each time you start up the application, as per the following screenshot.
4.4 Run As Administrator
dB Foresight, User Guide, Version 3.01
Copyright © 2015 dB Foresight Corporation
Page 15 of 76
Noise Level Prediction And Mapping Software
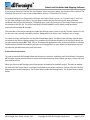
4.5 Uninstallation
To uninstall dB Foresight from your computer, simply use a file manager tool such as Windows Explorer to
locate the folder where dB Foresight was installed. Delete the installed folder and all subfolder and files within
that folder to remove the product from your computer. Delete any dB Foresight shortcuts you may have on
your Desktop or other locations on your computer. Unpin any dB Foresight start icons that may be on the
taskbar. Go to the Start menu and select “Remove from this list” for any dB Foresight start icons that may be
in the Start Menu.
dB Foresight does not modify or store any information in the Windows Operating System registry, so there is
nothing to remove from the registry.
5 Quick Start Guide
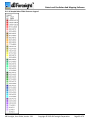
The project settings are located within the Project Panel. You can click in any cell and edit them for your site.
The "Project Name" is used in the created filenames and KML references, so it must not contain any of the
illegal filename characters as follows:
# pound
< left angle bracket
$ dollar sign
+ plus sign
% percent
> right angle bracket
! exclamation point
` backtick
& ampersand
* asterisk
‘ single quotes
| pipe
{ left bracket
? question mark
“ double quotes
= equal sign
} right bracket
/ forward slash
: colon
~ tilde
\ back slash
blank spaces
@ at sign
^caret
( left bracket
) right bracket
[ left bracket
] right bracket
Also, keep these rules in mind.
Don’t start or end your filename with a space, period, hyphen, or underline.
Keep your filenames to a maximum of 30 characters.
Project names are case sensitive.
The GPS coordinates for the site boundaries must be entered in decimal degrees. The resolution is the number
of divisions per axis. This will correspond to the number of data points computed across your site. A resolution
setting of 100 is a good starting point. The ground type is commonly ‘Mixed’ which is mostly vegetation with
some hard ground such as pavement. The Include Cmet Effect should be set to ‘No’ unless you are aware of
known conditions at the site area. If you have an elevation map then set the Include Elevation Effects to ‘Yes’.
The Number of Elevation Levels can be set to 25 as a starting point.
The Output Data Folder setting is also located on the Project Information. To set where you want the map and
data files located click on the ‘Browse” button which will open a folder selection menu. To save the project
settings click the File>Save As menu and select a folder and file name to save the project. The project can be
saved as either an XDB (dB Foresight Project) or CSV (Comma Separated Values) type of file.
dB Foresight, User Guide, Version 3.01
Copyright © 2015 dB Foresight Corporation
Page 16 of 76
Noise Level Prediction And Mapping Software
If you have an Elevations File click the next ‘Browse’ button and select where the elevations file is located. The
Elevations File must be in the format as described in section 4.2 Elevations File Format.
A standard setting for the Computation Setting in the Project Panel is to set it to “Current Project” and “Yes”
for the other settings in this panel. If you just want to create the plot files and use SPL data previously
calculated, then you set the setting to “Previous Project” and in the lower are of the Project Panel you select
the location of the SPL file. This is the Data/SiteSPL/SiteSPLHHMMSS.csv file which would have been
previously created with dB Foresight.
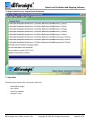
The remainder of the project settings are under the Settings menu. Ensure to set the ‘Include’ columns to ‘Yes’
for the items that you want included in the Run. Background cells will turn red if a value is out of range.
To create the maps and data files click the Run>Create Maps menu. The Status Panel will open up and show
the results as the files are being created. Once complete it will indicate the paths for all the files created. You
can then view the output BMP, PNG, JPEG or TGA maps with applications such as Microsoft Office or Inkscape.
Double click on the KML files and they will open up in Google Earth (or your default GIS application) and you
can view the georeferenced noise level plots there.
6 Operational Instructions
To install or uninstall dB Foresight follow the directions in section 4 Installation and Uninstallation Procedures.
dB Foresight requires internet access to verify the Product Activation Code. Before you begin, ensure that you
have internet access.
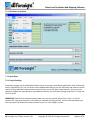
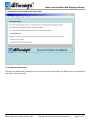
When you first start dB Foresight you will see project information for a default project. The start up window
will open with the Project Panel. It will open maximized to your screen resolution. You can click the minimize
button to get a smaller sized panel. The Project Panel is under the Settings menu. The Project Panel is shown
below.
dB Foresight, User Guide, Version 3.01
Copyright © 2015 dB Foresight Corporation
Page 17 of 76
Noise Level Prediction And Mapping Software
6.1 Project Panel
dB Foresight, User Guide, Version 3.01
Copyright © 2015 dB Foresight Corporation
Page 18 of 76
Noise Level Prediction And Mapping Software
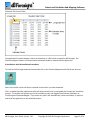
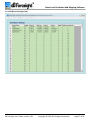
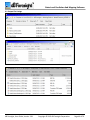
You can edit the Project Settings under the Settings>Project menu. The description and specifications for the
Project Settings is described in the following table.
6.2 Project Settings and Specifications Table
# Project Setting
Setting Description and Specifications
1 Project Name
The "Project Name" is used in the created filenames and KML references, so
it must not contain any of the illegal KML filename characters such as:
!@#$%^&*()+=[]{}\|'"/?<>~ \ / : < > or blanks, and must be no more than
30 characters in length.
2 North Latitude
The northern edge of the project site in decimal degrees, dd.dddddddd. The
maximum latitude 90°. The minimum latitude is -90°.
3 South Latitude
The southern edge of the project site in decimal degrees, dd.dddddddd. The
maximum latitude is 90°. The minimum latitude is -90°.
4 East Longitude
The eastern edge of the project site in decimal degrees, dd.dddddddd. The
maximum longitude is 180°. The minimum longitude is -180°.
5 West Longitude
The western edge of the project site in decimal degrees, dd.dddddddd. The
maximum longitude is -180°. The minimum longitude is -180°.
6 Resolution (divisions/axis)
The number of noise SPL points calculated along the north-south and eastwest axis of the project site area. The total site SPL points computed is the
number of divisions squared. The range of the setting is from 1 to 1,000,
however computation run times will increase for higher resolution settings.
If Included Elevation Effects is selected the Resolution should be set to
approximately double the Number of Elevation Levels settings. This is
explained more in section 9 below.
7 Ground Type
Select ‘Porous’, ‘Mixed’ or ‘Hard’ to enter they ground type for the project
area. Porous ground is ground covered in grass, trees other vegetation or
farm land. Hard ground includes paving, water, ice or concrete. Mixed
ground is a combination of hard and porous ground, but it mostly porous.
8 Include Cmet Effect
Select ‘Yes’ or ‘No’ to determine if the Cmet Effect level is computed in all
SPL points. The Cmet is a value that is based on known meteorological
effects in an area, and are explained more in section 9 below.
9 Co Factor Value (dB)
This is the dB level of the CMet Effect that be used to all computed SPL
points, if Include Cmet Effect is set to ‘Yes’.
10 Receiver (Map) Height (m) This is the height used for all POR points.
11 Include Elevation Effects
Select ‘Yes’ or ‘No’ to determine if the SPL computations include effects due
to the site area topography. If set to yes, a valid Elevations File Path must
be selected in the Elevation File Path window.
12 Number of Elevation Levels If Include Elevation Effects is set to “Yes” this will determine the number of
elevation levels used in determining the SPL attenuations due to the site
area topography. The suggested setting is 15-30. The range of this setting is
from 1 to 500. However, the higher the setting the longer the computation
time will take.
14 Output Data Folder
Click on the “Browse” button to select or create the folder location. This is
Location
the working folder where all the files created from a run will be stored.
15 Elevations File Path
Click on the “Browse” button to select the elevations file path. This is the
elevations file used in determining the SPL attenuations due to the site area
dB Foresight, User Guide, Version 3.01
Copyright © 2015 dB Foresight Corporation
Page 19 of 76
Noise Level Prediction And Mapping Software
16
17
18
19
20
21
topography. The format of this file must be as described in section 4.1 of
this document.
Site SPL Data Input, File
This is the Data/SiteSPL/ SiteSPLHHMMSS.csv file to be used if “Previous
Path (Previous Project)
Project” is selected. It will contain the SPL data previously computed, to be
used to generate new plot files. This is meant for large projects that take
considerable time to run, and the user wants to make adjustments to the
Contour Lines and Filled Contour settings and replot them.
Site SPL Data (Current or
This is set to “Current Project” for standard computations, and to “Previous
Previous Project)
Project” if the Site SPL data was previously created.
Run Simulations For Full
This is set to “Yes” to run the computations for the full site based on the
Project Site
current project settings.
Run Simulations For POR
This is set to “Yes” to run the computations to determine the SPL levels at
Points
the PORs.
Create Contour Lines Plots This is set to “Yes” to create all the contour line plots and files.
Create Filled Contours Plots This is set to “Yes” to create all the filled contours plots and files.
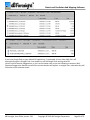
If the individual cells for the project setting is within specifications the cell background will be green. If the cell
value is invalid, the cell background will be red. Further data checks will also be performed just prior to
viewing the site location or creating the elevation maps. The maximum separation between the north and
south latitudes or east and west longitudes is 0.24 degrees. This is about 27 kilometres (north to south) by 17
kilometres (east to west) at a latitude of 50 degrees.
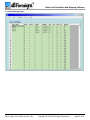
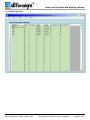
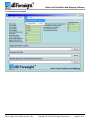
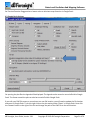
Preliminary data checking is done as the Project Settings are updated. If the data is invalid the cell background
will go red, as illustrated in the following screenshot.
dB Foresight, User Guide, Version 3.01
Copyright © 2015 dB Foresight Corporation
Page 20 of 76
Noise Level Prediction And Mapping Software
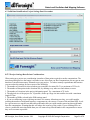
6.3 Valid Data Identification, Project Settings Panel Screenshot
6.3.1 Project Settings Data Points Considerations
When setting up a project one consideration is number of data points required to run the computations. The
more data points there are the longer it will take to run. Also when you Run Computations you may get an error
that there is insufficient memory allocated to run your project. To reduce memory requirements and run time
you can reduce the settings for one or more of the following:
1. The number of elevation levels used when you created the elevations file. Try a maximum of 25 levels.
2. The number of data points in the elevations file, by deleting every other row and column, or more.
3. The number of elevations in the project information panel. Try a maximum of 25 levels.
4. The physical size of the project site. If possible, divide up a large site into smaller sites with a maximum
length of 3 km.
5. The number of PORs selected in the POR settings panel.
6. If you are still having issues with long run times or a memory allocation error they you could consider
reducing the number of mid-band frequency components in your sources. If some of the mid-band SWL levels
for a given source are much lower than other mid-bands, then you could consider removing those mid-bands
from the computations. Warning that this will reduce the accuracy of the results. If your resulting SPLs are
close to permissible noise thresholds then you will want to keep all mid-bands in the computations to ensure
they are as accurate as possible.
dB Foresight, User Guide, Version 3.01
Copyright © 2015 dB Foresight Corporation
Page 21 of 76
Noise Level Prediction And Mapping Software
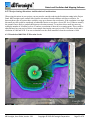
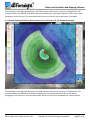
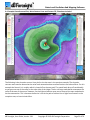
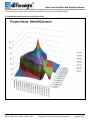
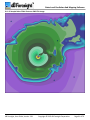
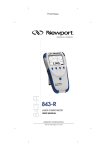
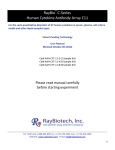
6.3.2 Project Settings Elevations And Resolution Considerations
When using elevations in your project you may need to consider reducing the Resolution setting in the Project
Panel. dB Foresight creates contour lines from the elevations file and considers each line as a barrier. So
between these types of barriers there would be a step up or down to the next barrier. If the resolution is too high
this small step area could be considered as behind the barrier so may have a lower SPL level. Whereas actually
the ground is more likely a gradual shift between elevation contours. To not show these small step areas try
setting the number of elevation levels to 25 and use a resolution of about 60 as a starting point. These could be
adjusted based on your project. Below is an example showing the same project with 25 elevation levels and a
resolution of 1000 and of 60. You can see that there are the small anomalies when the resolution is 1000.
6.3.3 Resolution 1000 With 25 Elevation Levels
dB Foresight, User Guide, Version 3.01
Copyright © 2015 dB Foresight Corporation
Page 22 of 76
Noise Level Prediction And Mapping Software
6.3.4 Resolution 60 With 25 Elevation Levels
dB Foresight, User Guide, Version 3.01
Copyright © 2015 dB Foresight Corporation
Page 23 of 76
Noise Level Prediction And Mapping Software
6.4 Source Settings Panel
dB Foresight, User Guide, Version 3.01
Copyright © 2015 dB Foresight Corporation
Page 24 of 76
Noise Level Prediction And Mapping Software
You can edit the Source Settings under the Settings>Sources menu. The description and specifications for the
Source Settings is described in the following table.
6.5 Source Settings and Specifications Table
# Source Setting
Setting Description and Specifications
1 Source Name
The "Source Name" is used in the KML plot files to identify the name of
each source included. The name should be kept to less than 31 characters.
2
Include
3
Number
4
Latitude
5
Longitude
6
SWL
7
Atmo
8
Snd Ht
9
Dir
10 Mid Band
Select ‘Yes’ or ‘No’ to indicate if the Source is included in the SPL
calculations for the project.
This is the source number, do not use 0. You can use decimal points such as
1.1, 1.2... 1.8 to identify that it is one source with multiple mid bands. The
integer of this number is used in the barriers to exclude the barrier in the
computations for the selected source. (Ex: for when the barrier is also the
enclosure for the source.)
The latitude of the location of the source in decimal degrees, dd.dddddddd.
The maximum latitude is 90°. The minimum latitude is -90°.
The longitude of the location of the source in decimal degrees,
dd.dddddddd. The range of this setting is from 180 to -180 degrees.
This is the un-weighted octave-band Sound Power Level (SWL) of the
Source in decibels (dB), produced by the Source relative to a reference
sound power of one picowatt (1 pW). Ensure that you enter the Sound
Power Level (SWL) and not the Sound Pressure Level (SPL). Ensure to use
the un-weighted SWL, and not the A-weighted SWL for this entry. You
must enter the SWL for each mid-band frequency that has noise levels. For
example if you have noise levels at all eight mid-band frequencies, then you
must create eight entries for that Source. Refer to the figure 6.3 Source
Settings Panel. You will see that Source 5 is entered as Source 5.1, Source
5.2 ... Source 5.8 to account for the eight mid-band frequencies for that
source. The data and plots that dB Foresight creates will be A-weighted SPL
values. dB Foresight uses the A-weighting methodology as described by
ISO-9613-2 which refers to the IEC-651 standard for A-weighting.
The atmospheric attenuation coefficient in dB/km. The range of this setting
is from 0 to 1000. See table 10.5 of this document for the setting levels
based on other site parameters.
The source’s sound level height in metres. The range of this setting is from
0 to 1000.
The noise directivity of the source. The settings and descriptions for each
setting are as follows:
H: Hemispherical - the sound radiates equally in all directions from the
source
N: North - the sound radiation is dominant to the north of the source
S: South - the sound radiation is dominant to the south of the source
E: East - the sound radiation is dominant to the east of the source
W: West - the sound radiation is dominant to the west of the source
The nominal mid-band frequency in Hertz for the source. The range of this
dB Foresight, User Guide, Version 3.01
Copyright © 2015 dB Foresight Corporation
Page 25 of 76
Noise Level Prediction And Mapping Software
setting is from 1 to 20,000 Hz.
If the individual cells for the source setting is within specifications the cell background will be green. If the cell
value is invalid, the cell background will be red. Further data checks will also be performed just prior to
running the SPL computations.
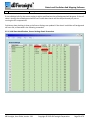
Preliminary data checking is done as the Source Settings are updated. If the data is invalid the cell background
will turn red, as illustrated in the following screenshot.
6.5.1 Valid Data Identification, Source Settings Panel Screenshot
dB Foresight, User Guide, Version 3.01
Copyright © 2015 dB Foresight Corporation
Page 26 of 76
Noise Level Prediction And Mapping Software
6.6 Solid Barrier Settings Panel
dB Foresight, User Guide, Version 3.01
Copyright © 2015 dB Foresight Corporation
Page 27 of 76
Noise Level Prediction And Mapping Software
You can edit the Barrier Settings under the Settings>Barriers menu. The description and specifications for the
Barrier Settings is described in the following table.
6.7 Barrier Settings and Specifications Table
# Barrier Setting
Setting Description and Specifications
1 Barrier Name
The "Barrier Name" is used in the KML plot files to identify the name of
each barrier included. The name should be kept to less than 31 characters.
2
Include
3
Start Lat
4
Start Lon
5
End Lat
6
End Lon
7
Height
8
Thickness
9
Exclude Source
Select ‘Yes’ or ‘No’ to indicate if the Barrier is included in the SPL
calculations for the project.
The latitude for the starting point of the barrier in decimal degrees,
dd.dddddddd. The maximum latitude is 90°. The minimum latitude is -90°.
The longitude for the starting point of the barrier in decimal degrees,
dd.dddddddd. The maximum latitude is 180°. The minimum latitude is
-180°.
The latitude for the end point of the barrier in decimal degrees,
dd.dddddddd. The maximum latitude is 90°. The minimum latitude is -90°.
The longitude for the end point of the barrier in decimal degrees,
dd.dddddddd. The maximum latitude is 180°. The minimum latitude is
-180°.
The height of the barrier in metres. The range of this setting is from 1 to
100.
The thickness of the barrier in metres. The range of this setting is from 1 to
100. Currently the barrier thickness is for user information only. If you do
have a very thick barrier (>1m), it must be entered it as 2 barriers, for
better attenuation accuracy. When a barrier is entered as a source, you
need to enter one barrier for each side panel of the source.
This source number which will excluded for the barrier in the computations
for the selected source. (Ex: for when the barrier is also the enclosure for
the source.) Set it to 0 to use for all sources. It will use the integer of the
source number. For example if there is a source with 8 midbands with the
source numbers 1.1, 1.2, 1.3...1.8, you can set the Exclude Source value to 1
to exclude all of these sources in the computations for this barrier.
If the individual cells for the source setting is within specifications the cell background will be green. If the cell
value is invalid, the cell background will be red. Further data checks will also be performed just prior to
running the SPL computations.
Preliminary data checking is done as the Source Settings are updated. If the data is invalid the cell background
will turn red.
dB Foresight, User Guide, Version 3.01
Copyright © 2015 dB Foresight Corporation
Page 28 of 76
Noise Level Prediction And Mapping Software
6.8 Custom Barrier Settings Panel
dB Foresight, User Guide, Version 3.01
Copyright © 2015 dB Foresight Corporation
Page 29 of 76
Noise Level Prediction And Mapping Software
6.9 Custom Barrier Settings and Specifications Table
#
Barrier Setting
Setting Description and Specifications
1
Barrier Name
The "Barrier Name" is used in the KML plot files to identify the name of
each barrier included. The name should be kept to less than 31 characters.
2
Include
3
Start Lat
4
Start Lon
5
End Lat
6
End Lon
7
Full Ht
Select ‘Yes’ or ‘No’ to indicate if the Barrier is included in the SPL
calculations for the project.
The latitude for the starting point of the barrier in decimal degrees,
dd.dddddddd. The maximum latitude is 90°. The minimum latitude is -90°.
The longitude for the starting point of the barrier in decimal degrees,
dd.dddddddd. The maximum latitude is 180°. The minimum latitude is
-180°.
The latitude for the end point of the barrier in decimal degrees,
dd.dddddddd. The maximum latitude is 90°. The minimum latitude is -90°.
The longitude for the end point of the barrier in decimal degrees,
dd.dddddddd. The maximum latitude is 180°. The minimum latitude is
-180°.
The full height of the barrier in metres. The range of this setting is from 1
dB Foresight, User Guide, Version 3.01
Copyright © 2015 dB Foresight Corporation
Page 30 of 76
Noise Level Prediction And Mapping Software
8
Thickness
9
Exclude Source
10
Lower Ht
11- 63Hz...8000Hz
18
to 100.
The thickness of the barrier in metres. The range of this setting is from 1 to
100. Currently the barrier thickness is for user information only. If you do
have a very thick barrier (>1m), it must be entered it as 2 barriers, for
better attenuation accuracy. When a barrier is entered as a source, you
need to enter one barrier for each side panel of the source.
This source number which will excluded for the barrier in the computations
for the selected source. (Ex: for when the barrier is also the enclosure for
the source.) Set it to 0 to use for all sources. It will use the integer of the
source number. For example if there is a source with 8 midbands with the
source numbers 1.1, 1.2, 1.3...1.8, you can set the Exclude Source value to
1 to exclude all of these sources in the computations for this barrier.
The height of the lower area in metres, for split barriers that have a solid
upper area and louvered lower area.
This are the mid bands for the attenuations in dB for the lower area. Put
the known dB attenuation for each frequency here, or 0 if the bottom area
is open.
If the individual cells for the source setting is within specifications the cell background will be green. If the cell
value is invalid, the cell background will be red. Further data checks will also be performed just prior to
running the SPL computations.
Preliminary data checking is done as the Source Settings are updated. If the data is invalid the cell background
will turn red.
dB Foresight, User Guide, Version 3.01
Copyright © 2015 dB Foresight Corporation
Page 31 of 76
Noise Level Prediction And Mapping Software
6.10 POR Settings Panel
dB Foresight, User Guide, Version 3.01
Copyright © 2015 dB Foresight Corporation
Page 32 of 76
Noise Level Prediction And Mapping Software
You can edit the POR Settings under the Settings>PORs menu. The description and specifications for the POR
Settings is described in the following table.
6.11 POR Settings and Specifications Table
# POR Setting
Setting Description and Specifications
1 POR Name
The "POR Name" is used in the KML plot files to identify the name of each
POR included. The name should be kept to less than 31 characters.
2
Include
3
4
POR Number
Latitude
5
Longitude
6
Day Ambient SPL
7
Night Ambient SPL
Select ‘Yes’ or ‘No’ to indicate if the POR is included in the SPL calculations
for the project.
For user usage only, to identify any number for the POR.
The latitude of the location of the POR in decimal degrees, dd.dddddddd.
The maximum latitude is 90°. The minimum latitude is -90°.
The longitude of the location of the POR in decimal degrees, dd.dddddddd.
The maximum longitude is 180°. The minimum longitude is -180°.
The day time ambient SPL in dBA at the POR. This value will be added to the
SPL at the POR, you can put it to -200 if not used. NOTE: this level is only
added in the Data/POR_SPLs_HHMMSS.csv file for the ambient levels at the
POR. It is not included in the plots or Noise Levels CSV data files. The range
of this setting is from -200 to200.
The night time ambient SPL in dBA at the POR. This value will be added to
the SPL at the POR, you can put it to -200 if not used. NOTE: this level is
only added in the Data/POR_SPLs_HHMMSS.csv file for the ambient levels
at the POR. It is not included in the plots or Noise Levels CSV data files. The
range of this setting is from -200 to200.
If the individual cells for the POR setting is within specifications the cell background will be green. If the cell
value is invalid, the cell background will be red. Further data checks will also be performed just prior to
running the SPL computations.
Preliminary data checking is done as the POR Settings are updated. If the data is invalid the cell background
will turn red.
dB Foresight, User Guide, Version 3.01
Copyright © 2015 dB Foresight Corporation
Page 33 of 76
Noise Level Prediction And Mapping Software
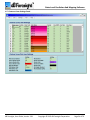
6.12 Contours Lines Settings Panel
dB Foresight, User Guide, Version 3.01
Copyright © 2015 dB Foresight Corporation
Page 34 of 76
Noise Level Prediction And Mapping Software
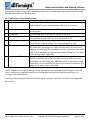
You can edit the Contour Lines Settings under the Settings>Contour Lines menu. The description and
specifications for the Contour Lines Settings is described in the following table.
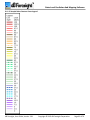
6.13 POR Settings and Specifications Table
# Contour Lines,
Setting Description and Specifications
User Settings
1 Noise Level
The noise level in dBA. The range of this setting is from -1000 to 1000.
2
Include
3
Color Code
4
Color Name
5
Opacity
6
Line Width
7
Font Size
8
Line Type
9
Contour Lines Plot,
User Settings
Plot Source Markers
10 Source Marker Style
11 Source Marker Size
12 Source Marker Color
13 Plot POR Markers
Select ‘Yes’ or ‘No’ to indicate if the noise level is included in the contour
lines plot and in the contour lines legend.
The hexadecimal notation (Hex) code for the color of the contour line in the
plot and legend. The setting can be from a range of #000000 to #FFFFFF in
hexadecimal notation.
The left two digits are for the red color value, from 00 to FF.
The middle two digits are for the green color value, from 00 to FF.
The right two digits are for the blue color value, from 00 to FF.
The user can enter a color name for each color, for reference. The color
name should be kept to under 31 characters. The background of the color
name cell will be the color set by the color code.
The opacity setting for the color as displayed on the contour line plot. The
opacity allows transparency of the color so the background can show
through it. The setting can be from 0 to 100.
The width of the contour line in the contour line plots. The range of this
setting is from 0 to 100.
The size of the font for the noise level indicated on the contour lines plots.
The range of this setting is from 0 to 100.
The type of line used for the noise level indicated on the contour lines plots.
The settings provided are solid, dashed, dotted or dashdot.
Setting Description and Specifications
Select ‘Yes’ or ‘No’ to indicate if a marker for each ‘Included’ source should
be shown on the contour line plots.
This is a pull down menu for the style of marker to plot for the source
marker. You can select one of: Star, Circle, Diamond, Square, Pentagon, x, +,
Diamon&X, Circle&+.
This is the size of the marker to be plotted, it is based on character height
and the size will also depend on the Plot Resolution (DPI) settings.
Enter # then a 6 digit hex code for the color of the marker. You can copy the
hex code from one of the settings in the upper panel.
The hexadecimal notation (Hex) code for the color of the source marker in
the contour line plots. The setting can be from a range of #000000 to
#FFFFFF in hexadecimal notation.
The left two digits are for the red color value, from 00 to FF.
The middle two digits are for the green color value, from 00 to FF.
Select ‘Yes’ or ‘No’ to indicate if a marker for each ‘Included’ POR should be
shown on the contour line plots.
dB Foresight, User Guide, Version 3.01
Copyright © 2015 dB Foresight Corporation
Page 35 of 76
Noise Level Prediction And Mapping Software
14 POR Marker Style
15 POR Marker Size
16 POR Marker Color
17 Plot Barriers
18 Barrier Line Width
19 Barrier Color
20 Border Line Width
21 Border Color
22 Plot Height (Inches)
23 Plot Resolution (DPI)
This is a pull down menu for the style of marker to plot for the POR marker.
You can select one of: Star, Circle, Diamond, Square, Pentagon, x, +,
Diamon&X, Circle&+.
This is the size of the marker to be plotted, it is based on character height
and the size will also depend on the Plot Resolution (DPI) settings.
Enter # then a 6 digit hex code for the color of the marker. You can copy the
hex code from one of the settings in the upper panel.
The hexadecimal notation (Hex) code for the color of the POR marker in the
contour line plots. The setting can be from a range of #000000 to #FFFFFF in
hexadecimal notation.
The left two digits are for the red color value, from 00 to FF.
The middle two digits are for the green color value, from 00 to FF.
Select ‘Yes’ or ‘No’ to indicate if each ‘Included’ Barrier should be shown on
the contour line plots.
The width of the barrier line as indicated on the contour line plots. The
range of his setting is from 0 to 100.
The hexadecimal notation (Hex) code for the color of the contour line in the
plot and legend. The setting can be from a range of #000000 to #FFFFFF in
hexadecimal notation.
The left two digits are for the red color value, from 00 to FF.
The middle two digits are for the green color value, from 00 to FF.
The right two digits are for the blue color value, from 00 to FF.
The width of the border line as indicated on the contour line plots. The
range of his setting is from 0 to 100.
The hexadecimal notation (Hex) code for the color of the contour line in the
plot and legend. The setting can be from a range of #000000 to #FFFFFF in
hexadecimal notation.
The left two digits are for the red color value, from 00 to FF.
The middle two digits are for the green color value, from 00 to FF.
The right two digits are for the blue color value, from 00 to FF.
This sets the plot height size in inches. The width will be set proportionally
based on the site coordinates.
This will set the plot resolution.
If the individual cells for the Contour Lines setting is within specifications the cell background will be green. If
the cell value is invalid, the cell background will be red. Further data checks will also be performed just prior to
running the SPL computations.
Preliminary data checking is done as the Contour Lines Settings are updated. If the data is invalid the cell
background will turn red.
dB Foresight, User Guide, Version 3.01
Copyright © 2015 dB Foresight Corporation
Page 36 of 76
Noise Level Prediction And Mapping Software
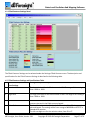
6.14 Filled Contours Settings Panel
The Filled Contours Settings can be selected under the Settings>Filled Contours menu. The description and
specifications for the Filled Contours Settings is described in the following table.
6.15 Filled Contours Settings and Specifications Table
# Filled Contours,
Setting Description and Specifications
User Settings
1 Low Level
The low noise level for the filled contour in dBA. The range of this setting is
from -1000 to 1000.
2
High Level
The high noise level for the filled contour in dBA. The range of this setting is
from -1000 to 1000.
3
Include
4
Color Code
Select ‘Yes’ or ‘No’ to indicate if the noise level is included in the filled
contours plot and in the filled contours legend.
The hexadecimal notation (Hex) code for the color of the filled contour the
plot and legend. The setting can be from a range of #000000 to #FFFFFF in
hexadecimal notation.
The left two digits are for the red color value, from 00 to FF.
dB Foresight, User Guide, Version 3.01
Copyright © 2015 dB Foresight Corporation
Page 37 of 76
Noise Level Prediction And Mapping Software
5
Color Name
6
Opacity
7
Filled Contours Plot,
User Settings
Plot Source Markers
8
Source Marker Style
9
Source Marker Size
10 Source Marker Color
11 Plot POR Markers
12 POR Marker Style
13 POR Marker Size
14 POR Marker Color
15 Plot Barriers
16 Barrier Line Width
17 Barrier Color
The middle two digits are for the green color value, from 00 to FF.
The right two digits are for the blue color value, from 00 to FF.
The user can enter a color name for each color, for reference. The color
name should be kept to under 31 characters. The background of the color
name cell will be the color set by the color code.
The opacity setting for the color as displayed on the filled contours plot. The
opacity allows transparency of the color so the background can show
through it. The range of the setting is from 0 to 100.
Setting Description and Specifications
Select ‘Yes’ or ‘No’ to indicate if a marker for each ‘Included’ source should
be shown on the contour line plots.
This is a pull down menu for the style of marker to plot for the source
marker. You can select one of: Star, Circle, Diamond, Square, Pentagon, x, +,
Diamon&X, Circle&+.
This is the size of the marker to be plotted, it is based on character height
and the size will also depend on the Plot Resolution (DPI) settings.
Enter # then a 6 digit hex code for the color of the marker. You can copy the
hex code from one of the settings in the upper panel.
The hexadecimal notation (Hex) code for the color of the source marker in
the contour line plots. The setting can be from a range of #000000 to
#FFFFFF in hexadecimal notation.
The left two digits are for the red color value, from 00 to FF.
The middle two digits are for the green color value, from 00 to FF.
Select ‘Yes’ or ‘No’ to indicate if a marker for each ‘Included’ POR should be
shown on the contour line plots.
This is a pull down menu for the style of marker to plot for the POR marker.
You can select one of: Star, Circle, Diamond, Square, Pentagon, x, +,
Diamon&X, Circle&+.
This is the size of the marker to be plotted, it is based on character height
and the size will also depend on the Plot Resolution (DPI) settings.
Enter # then a 6 digit hex code for the color of the marker. You can copy the
hex code from one of the settings in the upper panel.
The hexadecimal notation (Hex) code for the color of the POR marker in the
contour line plots. The setting can be from a range of #000000 to #FFFFFF in
hexadecimal notation.
The left two digits are for the red color value, from 00 to FF.
The middle two digits are for the green color value, from 00 to FF.
Select ‘Yes’ or ‘No’ to indicate if each ‘Included’ Barrier should be shown on
the contour line plots.
The width of the barrier line as indicated on the contour line plots. The
range of his setting is from 0 to 100.
The hexadecimal notation (Hex) code for the color of the contour line in the
plot and legend. The setting can be from a range of #000000 to #FFFFFF in
hexadecimal notation.
The left two digits are for the red color value, from 00 to FF.
dB Foresight, User Guide, Version 3.01
Copyright © 2015 dB Foresight Corporation
Page 38 of 76
Noise Level Prediction And Mapping Software
18 Border Line Width
19 Border Color
20 Plot Height (Inches)
21 Plot Resolution (DPI)
The middle two digits are for the green color value, from 00 to FF.
The right two digits are for the blue color value, from 00 to FF.
The width of the border line as indicated on the contour line plots. The
range of his setting is from 0 to 100.
The hexadecimal notation (Hex) code for the color of the contour line in the
plot and legend. The setting can be from a range of #000000 to #FFFFFF in
hexadecimal notation.
The left two digits are for the red color value, from 00 to FF.
The middle two digits are for the green color value, from 00 to FF.
The right two digits are for the blue color value, from 00 to FF.
This sets the plot height size in inches. The width will be set proportionally
based on the site coordinates.
This will set the plot resolution.
If the individual cells for the Filled Contours setting is within specifications the cell background will be green. If
the cell value is invalid, the cell background will be red. Further data checks will also be performed just prior to
running the SPL computations.
Preliminary data checking is done as the Contour Lines Settings are updated. If the data is invalid the cell
background will turn red.
7 Menu Toolbar
7.1 File Menu
The File Menu is used for starting new projects, opening new or recent projects, saving or exiting dB Foresight.
dB Foresight, User Guide, Version 3.01
Copyright © 2015 dB Foresight Corporation
Page 39 of 76
Noise Level Prediction And Mapping Software
7.1.1 File Menu Screenshot
7.2 Edit Menu
To edit the project notes simply click into this window and enter your notes. This is meant for simple notes
relating to your project. Not all of the ‘Edit’ features are available in this window.
dB Foresight, User Guide, Version 3.01
Copyright © 2015 dB Foresight Corporation
Page 40 of 76
Noise Level Prediction And Mapping Software
7.2.1 Edit Menu Screenshot
7.3 Project Menu
7.3.1 Project Settings
The project settings can be edited with features similar to common spreadsheet applications such as Microsoft
Excel or OpenOffice Calc. You can either use the predefined hotkeys or use the Edit menu and select the action
required. The predefined hotkeys show up on the menus, just to the right of each features. You can use the
computer clipboard to copy data from a spreadsheet directly into the Project Settings using Ctrl+C to copy and
Ctrl+V to paste.
IMPORTANT: Note that to complete entering data into a cell you need to either press “Enter” or click on
another cell. If you type data into a cell but do not complete entering the data, it will not be saved when you
save the project file, and will not be processed if you run a ‘Create Maps’ process.
dB Foresight, User Guide, Version 3.01
Copyright © 2015 dB Foresight Corporation
Page 41 of 76
Noise Level Prediction And Mapping Software
7.3.2 Output Data Folder Location
The Output Data Folder Location is the working folder where the files created will be stored. Click on the
“Browse” button to select or create the folder location
7.3.3 Project Menu Screenshot
7.4 Run Menu
To create your noise impact assessment files select the Run>Run Computations menu. This will automatically
take you to the Run>Progress Panel to display the status as the computations are running.
The Run process will first check if the Project Settings are all within specifications, and display a descriptive
warning if they are invalid. As the files are being created the process status updates will be displayed in the
Run>Status Panel. The computation process typically takes a few minutes, depending on the project settings.
During the Run process most application features will not be available and will show as gray on the menus.
Once this process is completed the output files can be accessed in the location identified for the Output Data
Folder Location.
dB Foresight, User Guide, Version 3.01
Copyright © 2015 dB Foresight Corporation
Page 42 of 76
Noise Level Prediction And Mapping Software
7.4.1 Run Menu Screenshot
dB Foresight, User Guide, Version 3.01
Copyright © 2015 dB Foresight Corporation
Page 43 of 76
Noise Level Prediction And Mapping Software
7.5 Map Creation Process, Progress Panel Screenshot
dB Foresight, User Guide, Version 3.01
Copyright © 2015 dB Foresight Corporation
Page 44 of 76
Noise Level Prediction And Mapping Software
7.6 Map Creation Process, Progress Panel Screenshot
7.7 Help Menu
The help menu contains four sub menus which are:
-
About dB Foresight
User Guide
Check For Updates
Support Forum
dB Foresight, User Guide, Version 3.01
Copyright © 2015 dB Foresight Corporation
Page 45 of 76
Noise Level Prediction And Mapping Software
7.7.1 Help, Menu Screenshot
7.7.2 Help About dB Foresight Panel
The Help About Panel contains the Software Version and a link to dB Foresight where you can check for
product upgrades or download the User Manual.
Please review any license changes periodically or check for upgrades at www.dbforesight.com.
dB Foresight, User Guide, Version 3.01
Copyright © 2015 dB Foresight Corporation
Page 46 of 76
Noise Level Prediction And Mapping Software
7.7.3 Help About dB Foresight Panel Screenshot
7.7.4 Help User Guide Panel
The Help User Guide Panel provides the links to either view the dB Foresight User Guide online or to download
a pdf copy of the User Guide.
dB Foresight, User Guide, Version 3.01
Copyright © 2015 dB Foresight Corporation
Page 47 of 76
Noise Level Prediction And Mapping Software
7.7.5 Help User Guide Panel
7.7.6 Help Check For Updates and Forum Menus
The Help Check For Updates panel will open a web browser and take you to the www.elevationmapper.com
site to check for updates for your product.
The Help dB Foresight Forum panel will open a web browser and take you to the dB Foresight Forum. You can
sign into the Forum and view or add comments or questions related to the dB Foresight product.
8 Viewing dB Foresight Created Files
Once you have completed creating the map files you can go to the Output Data Folder Location to view the
files. The following screenshot is the files from a typical project.
dB Foresight, User Guide, Version 3.01
Copyright © 2015 dB Foresight Corporation
Page 48 of 76
Noise Level Prediction And Mapping Software
8.1 Output File Listings
dB Foresight, User Guide, Version 3.01
Copyright © 2015 dB Foresight Corporation
Page 49 of 76
Noise Level Prediction And Mapping Software
If you have Google Earth as your default GIS application, if you double click on either KML file it will
automatically open in Google Earth. You should turn off the Google Earth setting called 3D
View>Terrain>Elevation Exaggeration, or set it to the lowest value, as per the following screenshot. With
Elevation Exaggeration feature turned off the contour borders will appear as straight lines, otherwise they will
follow the terrain elevation levels.
dB Foresight, User Guide, Version 3.01
Copyright © 2015 dB Foresight Corporation
Page 50 of 76
Noise Level Prediction And Mapping Software
Set Terrain>Elevation Exaggeration to lowest value to eliminate map distortion in Google Earth.
8.2 Google Earth Settings
On opening the plot files the legend will be displayed. The legend can be moved or turned off within Google
Earth. The frame around the plot can also be turned off within Google Earth.
If you edit your PNG file names or move them to a new file location, you will need to update the file location
and name in Google Earth. To do this right click on the plot overlay under ‘Places’ in Google Earth. Next click
the ‘Browse’ button to the right of the link and change the path of the PNG file to the new location.
dB Foresight, User Guide, Version 3.01
Copyright © 2015 dB Foresight Corporation
Page 51 of 76
Noise Level Prediction And Mapping Software
The following is a sample georeferenced noise filled contours and contour lines plot on Google Earth. This
example shows the predicted noise levels without considering the noise level attenuation due to the natural
topography in the site area. The noise attenuation due to one 4m tall man-made barrier is included.
8.3 Example Georeferenced Plot, Noise Contour Lines and Contour Fill, No Elevations Included
The following is a sample georeferenced noise filled contours and contour lines plot on Google Earth. This
example shows the predicted noise levels considering the noise level attenuation due to the natural
topography in the site area. The noise attenuation due to one 4m tall man-made barrier is also included.
dB Foresight, User Guide, Version 3.01
Copyright © 2015 dB Foresight Corporation
Page 52 of 76
Noise Level Prediction And Mapping Software
8.4 Example Georeferenced Plot, Noise Contour Lines and Contour Fill, Elevations Included
The following is the elevation contour lines plot for the site area in the previous example. The elevation
contours were used to determine the noise level attenuation due to natural barriers and other effects. For this
example the Source1 is in a valley which is closed off on the west end. The sound levels drop off considerably
as you go move out of the valley on the other side of the ridges. The 4m tall man-made barrier attenuates the
noise to the east of the source. However, for the higher elevation areas east of Source1 the man-made barrier
has less attenuation. This is because the barrier is not in the path of a direct line of sight from Source1 to the
reception area, so has minimal effect.
dB Foresight, User Guide, Version 3.01
Copyright © 2015 dB Foresight Corporation
Page 53 of 76
Noise Level Prediction And Mapping Software
8.5 Sample Georeferenced Elevation Contour Lines Plot On Google Earth
dB Foresight, User Guide, Version 3.01
Copyright © 2015 dB Foresight Corporation
Page 54 of 76
Noise Level Prediction And Mapping Software
The following is a filled contours plot referenced on Google Earth.
8.6 Example Georeferenced Noise Filled Contours Plot
dB Foresight, User Guide, Version 3.01
Copyright © 2015 dB Foresight Corporation
Page 55 of 76
Noise Level Prediction And Mapping Software
The following is a noise contour lines plot georeferenced on Google Earth.
8.7 Example Georeferenced Noise Contour Lines Plot
dB Foresight, User Guide, Version 3.01
Copyright © 2015 dB Foresight Corporation
Page 56 of 76
Noise Level Prediction And Mapping Software
The NoiseLevels_HHMMSS.csv file will contain the latitudes along the left column and the longitudes along the
top row, and the noise level (in dBA) in the remaining cells. These data files can be viewed in common
spreadsheet applications such as Microsoft Excel or OpenOffice Calc. Surface charts or other charts can be
created to view the plot. Note that Microsoft Excel has the following limitations on the amount of data it can
handle. The Project Setting Resolution parameter can be reduced to produce less data points.
8.8 Microsoft Excel Charting Limitations
Microsoft Excel Charting Limitations
Limit
Data series (data series: Related data points that are plotted in a chart. Each data series in a
chart has a unique color or pattern and is represented in the chart legend. You can plot one or
more data series in a chart. Pie charts have only one data series.) in one chart
255
Data points (data points: Individual values that are plotted in a chart. Related data points
make up a data series. Data points are represented by bars, columns, lines, slices, dots, and
other shapes. These shapes are called data markers.) in a data series for 2-D charts
32,000
Data points in a data series for 3-D charts
4,000
Data points for all data series in one chart
256,000
dB Foresight, User Guide, Version 3.01
Copyright © 2015 dB Foresight Corporation
Page 57 of 76
Noise Level Prediction And Mapping Software
The following noise level surface chart was created from the data from the dB Foresight.
8.9 Sample Microsoft Excel Noise Level Surface Chart
dB Foresight, User Guide, Version 3.01
Copyright © 2015 dB Foresight Corporation
Page 58 of 76
Noise Level Prediction And Mapping Software
The following is an example of the OutputData_xxxxxx.csv from a project.
8.10 Sample Output Data Chart
8.11 Sample Plots And Legend
Following are samples of the plot files and legends that are created from the setting in the dB Foresight
default project. These files are used in the KML files to georeference the plots for viewing in GIS applications
such as Google Earth or ArcGIS.
dB Foresight, User Guide, Version 3.01
Copyright © 2015 dB Foresight Corporation
Page 59 of 76
Noise Level Prediction And Mapping Software
8.11.1 Sample Noise Contour Lines PNG File Image
dB Foresight, User Guide, Version 3.01
Copyright © 2015 dB Foresight Corporation
Page 60 of 76
Noise Level Prediction And Mapping Software
8.11.2 Sample Noise Filled Contours PNG File Image
dB Foresight, User Guide, Version 3.01
Copyright © 2015 dB Foresight Corporation
Page 61 of 76
Noise Level Prediction And Mapping Software
8.11.3 Sample Noise Contour Lines Legend
dB Foresight, User Guide, Version 3.01
Copyright © 2015 dB Foresight Corporation
Page 62 of 76
Noise Level Prediction And Mapping Software
8.11.4 Sample Noise Filled Contours Legend
dB Foresight, User Guide, Version 3.01
Copyright © 2015 dB Foresight Corporation
Page 63 of 76
Noise Level Prediction And Mapping Software
9 Noise Level Prediction Methodologies
The dB Foresight model of noise level prediction methodologies comply with the ISO standard 9613-2,
and considers the following parameters for the sound level prediction analysis:
-
GPS location of each sound source
Ground type (porous, mixed or hard)
Source elevations
Source sound height
Source directivity
Source mid-band frequencies
Physical size of the sources (if used as barriers)
POR GPS locations
POR height (noise map height)
POR elevations
POR ambient noise levels
Geometric spreading
Ground effects
Attenuation due to man-make barriers or berms
Attenuation due to natural barriers, berms or elevation effects
Attenuation due to atmospheric conditions
Cmet effects (includes downwind, thermal inversion or other know effects)
Air temperature and relative humidity
Atmospheric absorption
Intermittency of the noise
dB Foresight creates and geo-references predicted noise level contour plots. The geo-referenced
contour plots can be viewed directly on GIS tools such as Google Earth or ArcGIS. dB Foresight also
creates data files containing the contributed and cumulative SPLs at each POR, along with other project
information.
The ISO 9613 computation methodologies produce continuous A-weighted downwind sound pressure
levels. The dBA rating accommodates the fact that the human ear is not equally sensitive to all
frequency ranges, and emphasizes the middle frequency sounds. The user enters the un-weighted octaveband Sound Power Level (SWL) of the Source in decibels (dB), produced by the Source relative to a reference
sound power of one picowatt (1 pW). The SWLs levels are entered for each mid-band frequency that has
noise levels. For example if the Source has are noise levels at all eight mid-band frequencies, the user creates
eight entries for that Source. Refer to the figure 6.3 Source Settings Panel. You will see that Source 5 is
entered as Source5.1, Source5.2 ... Source5.8 to account for the eight mid-band frequencies for that source.
The data and plots that dB Foresight creates will be A-weighted SPL values. dB Foresight uses the A-weighting
methodology as described by ISO-9613-2 which refers to the IEC-651 standard for A-weighting.
dB Foresight, User Guide, Version 3.01
Copyright © 2015 dB Foresight Corporation
Page 64 of 76
Noise Level Prediction And Mapping Software
9.1 Noise level Prediction Confidence
The published accuracy for the ISO 9613-2 standard is as follows:
Height, h
Distance, d
(h is the mean height of the
(d is the distance between the source and receiver.)
source and receiver.)
0 < d < 100 m
100 m < d < 1,000 m
0<h<5m
± 3 dB
± 3 dB
5 m < h < 30 m
± 1 dB
± 3 dB
Accuracy levels beyond 1,000 m are not published. As the distance increases, the associated accuracy in
prediction will decrease. Environmental factors such as wind, temperature inversions, topography and
ground cover all have increasing effects over larger distances. As such, for all receivers within
approximately 1,000 m of the various noise sources, the prediction confidence is considered high, while
for all receivers beyond 1,000 m, the prediction confidence is considered moderate. It is important to
note that, the noise levels calculated in the model must meet the SPLs up to 1,500 m from the site. As
the distance to the receiver increases, the actual noise levels are expected to be lower than that
projected by the model. Therefore, the decreasing accuracy associated with model results beyond
1,000 m is not considered to be as significant.
9.2 Noise Impact Assessment Parameters
The following is the list of the parameters types that are required by the dB Foresight prediction tool to model
the sound pressure level predictions.
-
Project name
GPS location of the assessment area (north and south latitudes, east and west longitudes)
Plot resolution (divisions per axis)
Ground Type (Porous, Mixed or Hard)
Cmet Effect in dB (only if wind, thermal inversion or other conditions are common for the site
area)
Project elevation data input (if the elevation contours are significant for the site area)
GPS location of each sound source
SPL, sound height, frequency bands, and directivity of each source
Physical dimensions of the sources (can be entered as a barrier, enter each panel as a barrier)
Atmospheric absorption constant (based on the air temperature, relative humidity and midband
frequency of the sources)
GPS locations, height and thickness of each man-made barrier
GPS locations, height and ambient SPL for each POR
Plot line and fill settings
The following noise level prediction methodologies are included for illustration only. This information is
provided to present the methodologies dB Foresight uses to predict noise levels. The methodologies are
not meant to be complete or to be used independently for noise level prediction methodologies. The
full extent of the methodologies are provided in the ISO standard 9613-2.
9.3 Geometric Divergence
dB Foresight, User Guide, Version 3.01
Copyright © 2015 dB Foresight Corporation
Page 65 of 76
Noise Level Prediction And Mapping Software
A significant factor for attenuation of the noise level is from geometrical divergence. Geometrical divergence
accounts for the spreading out of the sound source. Depending on the type of source, the geometrical
divergence, and location, the divergence can be spherical, hemispherical or directional. The equation for
attenuation due to spherical divergence is:
Adiv = 20×Log10(d/d0) – 10× Log10(Q) dB
Where:
Adiv is the sound pressure level attenuation due to geometric divergence.
d is the distance from the source to receiver in metres.
d0 is the reference distance (= 1m).
Q is the directivity as described below
9.3.1 Directivity
dB Foresight noise level predictions considers the directivity of each source. The user enters the directivity as
H, N, S, E or W defined as:
H: Hemispherical (Q = 2)
N: North (Q = 4)
S: South (Q = 4)
E: East (Q = 4)
W: West (Q = 4)
Q is the directivity factor of the source as per the following table:
9.3.2 Distance Effects
This effects of this is a doubling of the distance from a facility to the receiver results in a 6 dBA reduction in
sound pressure level. For example, if the sound emitted from a single facility results in a noise level of 40 dBA,
then the doubling of distance from the facility will result in a noise level of 34 dBA. Increasing the distance by
the same amount again, amounts in a reduction to 30.5 dBA, as illustrated in Figure 10.3.3 below.
dB Foresight, User Guide, Version 3.01
Copyright © 2015 dB Foresight Corporation
Page 66 of 76
Noise Level Prediction And Mapping Software
9.3.3 Distance Effect Illustration
9.4 Ground Effects
Ground attenuation is dependent on the type of ground surface, and is mainly the result of sound being
reflected or absorbed by the ground surface. The ground types are divided into three main types defined as:
-
Porous ground is ground covered in grass, trees other vegetation or farm land.
Hard ground includes paving, water, ice or concrete.
Mixed ground is a combination of hard and porous ground, but it mostly porous.
For porous ground type, or mixed ground type but mostly porous, the ground attenuation is calculated as
follows:
dB Foresight, User Guide, Version 3.01
Copyright © 2015 dB Foresight Corporation
Page 67 of 76
Noise Level Prediction And Mapping Software
Agr = 4.8 – (2×hm / d) × [ 17 + (300/d)] ≥ 0 dB
Where:
Agr is the sound pressure level attenuation due to ground effects.
hm is the mean height of the propagation path above the ground, in metres.
d is the distance from the source to receiver, in metres.
Under the following specific conditions:
-
Only the A-weighted sound pressure level at the receiver position is of interest,
The sound propagation occurs over porous ground or mixed ground, most of which is porous
The sound is not a pure tone.
For a hard ground type, the ground attenuation is calculated as follows:
Agr = As + Ar + Am
Where:
Agr is the sound pressure level attenuation due to ground effects
As is the source region sound pressure level attenuation
Ar is the receptor region sound pressure level attenuation
Am is the middle region sound pressure level attenuation.
Where As, Ar and Am regions are defined in the following table:
9.4.1 Ground Attenuation Regions Table
Where:
hs is the height of the source above the ground, in metres
hr is the height of the receiver above the ground in metres
dp is the source-to-receiver distance projected onto the ground plane, in metres.
dB Foresight, User Guide, Version 3.01
Copyright © 2015 dB Foresight Corporation
Page 68 of 76
Noise Level Prediction And Mapping Software
The expressions for each of these regions is defined in the following table:
9.4.2 Expressions Used For Hard Ground Type
9.5 Atmospheric Conditions
dB Foresight requires the user to enter the atmospheric attenuation coefficient which is based on the
temperature, relative humidity and midband frequency. The lowest value of 0.1 considers winter or
summer and high or low humidity conditions. This is also the most conservative (high side) approach to
the noise impact assessment. Table 10.6 below lists the atmospheric absorption coefficients based on
various atmospheric conditions.
9.6 ISO-9613-2 Atmospheric Attenuation Coefficients
dB Foresight, User Guide, Version 3.01
Copyright © 2015 dB Foresight Corporation
Page 69 of 76
Noise Level Prediction And Mapping Software
9.7 Meteorological Conditions
The engineering method for calculation attenuation of sound, specified in ISO 9613, considers common
meteorological conditions favorable to propagation from the sources of sound emission, as described below.
This is not to be confused with Cmet conditions. Cmet is an extra parameter that includes factors for the area
such as downwind propagation, thermal inversions or other effects that are known for the area.
The equations for Cmet are as follows:
Cmet = 0 if dp <= 10(hs+hr)
9.7.1 Downwind Propagation
When a wind is blowing there will always be a wind gradient. This is due to the layer of air next to the ground
being stationary. A wind gradient can result in the sound waves propagating upwind being deflected upwards
and those propagating downwind being deflected downwards. Therefore, a receiver upwind from the source
may have a reduced noise level and a receiver downwind may have an increased noise level.
The ISO 9613 calculation methodology considers conditions with the wind direction within an angle of ± 45° of
the direction connecting the center of the dominant sound source and the center of the specified receiver
region, with the wind blowing from source to receiver, and wind speeds between approximately 1 m/s and 5
m/s, measured at a height of 3 m to 11 m above the ground.
The dB Foresight noise level prediction tool allows for consideration of more extreme downwind propagation
conditions. To account for more extreme downwind conditions the user can include a dB factor in the
settings.
9.7.2 Temperature Inversions
Usually, the air near the surface of the Earth is warmer than the air above it. Temperature inversions are
conditions where the temperature increases with height. This occurs due to unique weather conditions, such
dB Foresight, User Guide, Version 3.01
Copyright © 2015 dB Foresight Corporation
Page 70 of 76
Noise Level Prediction And Mapping Software
as a cold air mass moving over a warm one in winter, or clear nights with calm winds, just after sunset, when
the ground level air cools faster than the air above it.
During a temperature inversion sound waves can be refracted downwards, and therefore may be heard over
longer distances. The ISO 9613 calculation methodology considers propagation under a well-developed
moderate ground-based temperature inversion, such as commonly occurs at night.
More extreme temperature inversion conditions over water surfaces may result in higher sound pressure
levels. These more extreme conditions are not covered by the ISO 9613 propagation calculation methodology.
However, the dB Foresight noise level prediction tool allows for consideration of more extreme temperature
inversion conditions. To account for more extreme temperature inversions the user can include a dB factor in
the settings.
9.8 Multiple Sources
Since noise levels are measured on a logarithmic scale, the combined effect of multiple sources is calculated
accordingly. The following formula is used to combine multiple sources:
This has the effect of a doubling of the number of sources causing a 3dB increase in the noise level at the
receiver. For example, if the sound emitted from a single facility results in a noise level of 40 dBA, then the
emissions from two facilities with the same noise level will result in a noise level of 43 dBA. When a third
facility is added, the noise level increases to 44.8 dBA. The effects of adding noise sources on ambient noise
levels are illustrated in the figure below.
9.8.1 Multiple Sources Effect On Noise Levels
dB Foresight, User Guide, Version 3.01
Copyright © 2015 dB Foresight Corporation
Page 71 of 76
Noise Level Prediction And Mapping Software
9.9 Noise Barriers
To attenuate noise levels natural or man made barriers can have a significant effect. A man made barrier can
be a wall constructed from concrete or other solid material, or a berm of soil. The amount of attenuation for a
barrier depends on its height, distance from the source and POR, thickness, and other factors. dB Foresight
used the formulae provided by ISO 9613-2 to determine the attenuation due to natural or man made barriers.
A natural barrier is considered due to the natural elevation contours of the land between the source and POR.
dB Foresight, User Guide, Version 3.01
Copyright © 2015 dB Foresight Corporation
Page 72 of 76
Noise Level Prediction And Mapping Software
9.9.1 Effect Of Noise Barriers On Attenuation
The noise attenuation calculations for the barrier effects consider many factors including:
-
The wavelength of the sound at the nominal mid-band frequency of the octave band
Geometric values as indicated in the diagram below
The difference between the sound path taken and a path directly from the source to the receiver
The number of barriers in the path
Whether the barrier top is above or below the line of sight between the source and receiver
Correction factor for meteorological effects.
dB Foresight, User Guide, Version 3.01
Copyright © 2015 dB Foresight Corporation
Page 73 of 76
Noise Level Prediction And Mapping Software
9.9.2 Geometric Quantities For a Single Barrier
9.9.3 Geometric Quantities For Two Barriers
The equations to calculation the attenuation due to barriers are included in ISO 9613. dB Foresight also
considers the effects of the source structures on noise level attenuation. The user must enter the overall
dimensions of the source, and they are considered in the barrier attenuation calculations. The expressions
used for barrier attenuation (Abar) are as follows:
Abar = Dz – Agr >0
And for diffraction around a vertical edge:
Abar = Dz >0
dB Foresight, User Guide, Version 3.01
Copyright © 2015 dB Foresight Corporation
Page 74 of 76
Noise Level Prediction And Mapping Software
Where:
Dz is the barrier attenuation for each octave band, equation (14);
Agr is the ground attenuation in the absence of the barrier.
The barrier attenuation Dz, in decibels, shall be calculated for this path by equation (14):
Dz = 10 log [ 3 + (C2/ λ) C3zKmet] dB … (14)
Where:
C2
C3
is equal to 20, and includes the effect of ground reflections; if in special cases ground reflections are
taken into account separately by image sources, C2 = 40;
is equal to 1 for single diffraction, and where
C3 = [1 + (5 λ/d)2 ] / [(1/3) + (5 λ/e)2 ] … (15)
for double diffraction;
λ
z
is the wavelength of sound at the nominal midband frequency of the octave band, in metres;
is the difference between the path lengths of diffracted and direct sound, as calculated by equations (16)
and (17), in metres;
Kmet is the correction factor for meteorological effects, given by equation (18);
e
is the distance between two diffraction edges in the case of double diffraction
For single diffraction, the path length difference z shall be calculated by equation (16):
Z = [(dss + dsr)2 + a2]1/2-d …(16)
Where:
dss
is the distance from the source to the (first) diffraction edge, in metres;
dsr
is the distance from the (second) diffraction edge to the receiver, in metres;
a
is the component distance parallel to the barrier edge between source and receiver, in metres.
If the line of sight between the source and receiver passes above the top of the edge of the barrier, z shall be
given a negative sign.
For double diffraction, the path length difference z shall be calculated by:
Z = [(dss + dsr+e)2 + a2] 1/2-d …(17)
The correction factor Kmet for meteorological conditions in equation (14) shall be calculated using equation
(18):
Kmet = exp [-(1/2000) √ dss dsr d/(2z) ] for z > 0 dB … (18)
Kmet = 1 for z <=0
For lateral diffraction around obstacles, it shall be assumed that Kmet = 1
The barrier attenuation Dz, in any octave band, should not be taken to be greater than 20 dB in the case of
single diffraction (i.e. thin barriers) and 25 dB in the case of double diffraction (i.e. thick barriers).
When Use Elevation Effects is selected, dB Foresight creates a contour map using the elevations, and each
segment is converted into a barrier, and included in the barrier computations. If Included Elevation Effects is
selected the Resolution should be set to approximately double the Number of Elevation Levels settings. If the
Resolution is set too high, compared to the Number of Elevation Levels, false barriers could appear. This is
because the actual elevations are more accurate than the contour lines, so if the elevation drops on one side
dB Foresight, User Guide, Version 3.01
Copyright © 2015 dB Foresight Corporation
Page 75 of 76
Noise Level Prediction And Mapping Software
of a contour line, it would appear as a barrier in the computations. However, with some experimenting and
adjusting of these settings, you will get very precise results.
For conditions where there are 2 or more barriers in a path, that are either man made or part of the elevation
effects, as per ISO 9613, the two most relevant barriers are selected and the barrier attenuation is computed
based on the double diffraction method described above.
For the custom barriers that are solid on the top portion and louvered or open on the bottom, as per ISO
9613, double diffraction is used with one path over the barrier and the other path through the bottom area.
10 Continuous Improvement
We at dB Foresight Corporation would like to continuously improve this product. If you have suggestions for
improvement, comments or issues that you find with the product or associated documentation, please contact us
through the Contact Us page at www.dbforesight.com.
dB Foresight, User Guide, Version 3.01
Copyright © 2015 dB Foresight Corporation
Page 76 of 76