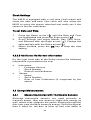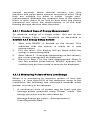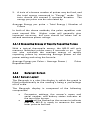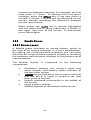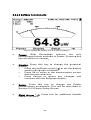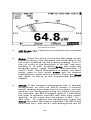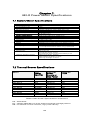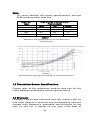
1
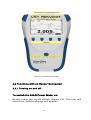
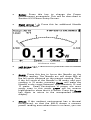
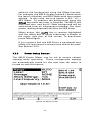
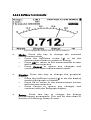
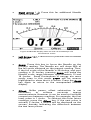
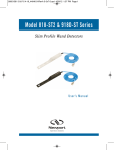
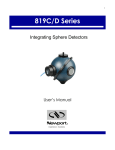
843-R 97x210mm 843-R LASER POWER METER USER MANUAL NEWPORT CORPORATION www.newport.com Table of Contents Chapter 1.Introduction: How to Use This Manual . 3 Chapter 2.Quick Reference ................................ 4 2.1 Getting Started .............................................................. 4 2.2 Functions with no Sensor Connected ....................... 5 2.3 Thermal Sensors........................................................... 7 2.4 Photodiode Sensors ................................................... 10 Chapter 3.The 843-R Power Meter Unit ............. 12 3.1 General Description ................................................... 12 3.2 Smart Connectors ...................................................... 13 3.3 Soft Keys ...................................................................... 14 3.4 Power Up and Shut Down ......................................... 15 3.5 843-R Functions that are Independent of Sensor Type ......................................................................................... 16 3.6 843-R Measurement Screens ............................... 19 3.7 Hardware Functions .............................................. 21 Chapter 4.Operation with Thermopile Absorber Sensors ......................................................... 24 4.1 Thermopile Absorber Sensors .................................. 24 4.2 Startup Configuration ............................................ 25 4.3 Power Measurement ............................................. 25 4.4 Energy Measurement ............................................ 35 Chapter 5.Operation with Photodiode Sensors ... 47 5.1 Photodiode Sensors .............................................. 47 5.2 Startup Configuration ............................................ 47 5.3 Power Measurement ............................................. 48 1 5.4 Special Cases of Power Measurement .............. 60 Chapter 6.Circuit Description ........................... 62 6.1 Analog Module ....................................................... 62 6.2 Processor Board:........................................................ 63 Chapter 7.843-R Power Meter Specifications ..... 64 7.1 System/Meter Specifications ................................... 64 7.2 Thermal Sensor Specifications ................................ 64 7.3 Photodiode Sensor Specifications .......................... 65 7.4 Warranty ...................................................................... 65 7.5 Technical Support Contacts ..................................... 66 2 Chapter 1. Introduction: How to Use This Manual Newport’s 843-R Power Meter is a simple to use microprocessor-based Laser Power/Energy meter that operates with thermopile and photodiode sensors. Based on smart connector technology, just connecting the sensor configures and calibrates the instrument. This manual tells you what you need to know to make full use of the 843-R for all your laser measurement needs. It includes a "Quick Reference", (Chapter 2) to allow you to perform basic measurements immediately, without reading the whole manual. The main measurement sections, Chapters 4 and 5 include a general description and a section detailing operating options. 3 Chapter 2. Quick Reference 2.1 Getting Started To connect a sensor to the 843-R Power Meter, simply insert the 15 pin D type connector of the measuring sensor cable into the socket marked "Sensor Input" on the rear panel of the 843-R Power Meter (see Figure 2.1). 12VDC AN OUT SENSOR INPUT USB OTG Figure 2.1 843-R Rear Panel The 843-R Power Meter is equipped with "soft keys." That is, the functions of the keys change as indicated by the legend above each key (see Figure 2.2). 4 Figure 2.2 843-R Front View 2.2 Functions with no Sensor Connected 2.2.1 Turning on and off. To switch the 843-R Power Meter on: Briefly press the on/off switch (Figure 2.2). The unit will switch on, and the display will appear. 5 Note: With the 843-R Power Meter, sensors are hot swappable. Even after the meter is switched on, you can remove one sensor and insert a different one. The 843-R will recognize the switch and reconfigure itself according to the settings of the new sensor. To toggle the state of the LCD backlight: The backlight for the 843-R’s LCD can be toggled between 3 different levels of illumination. This toggling will be performed by briefly pressing the on/off switch after the 843-R has been switched on. To switch the 843-R off: Press the on/off switch and hold it for about 2 seconds until the display blanks. 2.2.2 Configuring the instrument. To zero instrument: 1. Make sure that the instrument is not in an electrically noisy environment and is undisturbed. 2. Verify that no sensor is connected. If one is connected, then detach before continuing. 3. Press the Zero key. This will bring you to the Zeroing screen 4. Press the Start key. When zeroing finishes press the Save key. To show or hide settings 1. Press the Down arrow until Show Settings is highlighted and press the Enter arrow. 2. Set to Yes to display sensor settings in the measurement screens. Set to No to hide the sensor settings and show a larger graph. 6 To set Line Frequency 1. 2. 3. Setting Line Frequency correctly removes electrical noise that may be introduced to the measurements. Press the Down arrow until Line Frequency is highlighted and press the Enter arrow. Set to 50Hz or 60Hz, depending on the electrical power grid of the area that you are in. To set Date and Time 1. 2. Press the Down arrow until the Date and Time are highlighted and press the Enter arrow. Scroll through and select Month, Day, Year, Hour, and Minutes with the Right arrow. Change the selected item with the Down arrow. Note: The present settings are automatically saved for the next time the 843-R is turned on. 2.2.3 Updating the 843-R Firmware. 1. 2. Download the latest 843-R firmware upgrade package from the Newport website: http://www.newport.com and copy to your target directory. Run the upgrade executable and follow the on screen instructions 2.3 Thermal Sensors 2.3.1 Use of the 843-R with thermal type sensors. Most Thermopile sensors have somewhat different absorption at different wavelengths. In order to compensate for this, each sensor has been calibrated by laser at several wavelengths. When you choose the 7 correct laser wavelength, the correction factor for that wavelength is automatically introduced. Note that the laser wavelength correction in use is displayed in the upper left corner of the display. To set type of laser being used: 1. 2. 3. From the measurement screen, press the Setup key. Press the Down arrow until Laser is highlighted and press the Enter arrow. Select the appropriate laser wavelength and press the OK key. To select a range for power measurement: 1. 2. 3. From the measurement screen, press the Setup key. Press the Down arrow until Range is highlighted and press the Enter arrow. Select the appropriate manual range or AUTO to select autoranging and press the OK key. To choose power or energy measurement: 1. 2. 3. In the main measurement screen, press the Mode key. Select Power or Energy. Press the OK key to return to the measurement screen 2.3.2 Other Settings and Saving the Startup Configuration 1. When measuring power, you can set the period over which to Average the measurements 2. When measuring energy you can set the threshold level in order to screen out false triggers. 3. The present settings are automatically saved for the next time the 843-R is turned on. 8 2.3.3 Power or Single Shot Energy Measurement Warning: Do not exceed maximum sensor limits for power, energy, power density and energy density as listed in Error! Reference source not found. and Table 6 in Chapter 7. Otherwise, there is a risk of damaging the absorber. To simulate an analog needle display on the 843-R: 1. Press the Display key and select Needle. 2. Press OK to continue with measurements. To expand the graph (Bargraph or Needle) scale ±5x about the present reading: 1. Press the Zoom key. 2. Press the Zoom key again to return to the full scale graph. See Section 4.3.1.2 for full details. To subtract background and set current reading to zero: 1. Press the Offset key. 2. Press the Offset key again to cancel. See Section 4.3.1.2 for full details. To use the 843-R to measure laser power: 1. Press the Mode key and select Power 2. Select AUTO for autoranging or the lowest manual range whose maximum is greater than the expected power readings. 3. Power is measured 15 times per second. 9 To use the 843-R to measure laser energy: 1. 2. 3. Press the Mode key and select Energy Energy measurement is performed in manual ranges only. The correct range to select is the lowest one that is larger than the expected pulse energy to be measured. Thermal sensors measure energy in single shot mode. When the 843-R flashes "READY," on and off, fire the laser. 2.4 Photodiode Sensors 2.4.1 Selecting Wavelengths 1. 2. 3. 4. 5. From the measurement screen, press the Setup key. Press the Down arrow until Laser is highlighted and press the Enter arrow. Select the appropriate laser wavelength and press the OK key. If the wavelength you want is not among the wavelengths in the six wavelengths listed press the Modify key. Use the Right and Down arrows to adjust the wavelength as desired. Then press the OK key. 2.4.2 To select a range for power measurement: 1. 2. 3. From the measurement screen, press the Setup key. Press the Down arrow until Range is highlighted and press the Enter arrow. Select the appropriate manual range, AUTO to select autoranging, or dBm to display power in a logarithmic scale. Press the OK key 2.4.3 Other Settings and Saving the Startup Configuration 1. Select Average in order to set the period over which to average the measurements 10 2. 3. Select Filter to IN or OUT according to if the Filter is in place or not. The present settings are automatically saved for the next time the 843-R is turned on. 2.4.4 Power Measurement Warning: Do not exceed maximum sensor limits for power, energy, power density and energy density as listed in Table 6 in Chapter 7. Sensor Specifications. Otherwise, there is a risk of damaging the sensor. To simulate an analog needle display on the 843-R: 1. Press the Display key and select Needle. 2. Press OK to continue with measurements. To expand the graph (Bargraph or Needle) scale ±5x about the present reading: 1. Press the Zoom key. 2. Press the Zoom key again to return to the full scale graph. See Section 5.3.1.2 for full details. To subtract background and set current reading to zero: 1. Press the Offset key. 2. Press the Offset key again to cancel. See Section 5.3.1.2 for full details. 11 Chapter 3. The 843-R Power Meter Unit 3.1 General Description The model 843-R laser power/energy meter represents a new level of sophistication, sensitivity, compactness and accuracy, coupled with ease of operation. It can operate with thermal and photodiode sensors. It has smart connector technology. Simply plugging in the sensor configures and calibrates the 843-R to operate with that sensor. The 843-R’s large size TFT 320x240 screen enhances measurement readouts in ways that smaller displays cannot. The 843-R displays power measurements in both digital and analog form at the same time and also has a needle type display. It can be set to autorange, so you do not have to set scales; or to a manual range if you wish. It will remember what mode you were using before you turned it off and will return to that mode when turned on. You can zoom in on the present reading, or subtract background. The 843-R reads the calibration information that is stored in the sensor’s smart connector and is ready to measure from the moment it’s powered up. You can also zero the 843-R at the touch of a button. The 843-R’s user interface is self-explanatory; you should not have to refer to this manual very often. Above all, the 843-R has advanced circuitry and digital signal processing for excellent sensitivity, signal to noise ratio, accuracy, and response time. It also has special circuitry to reject electromagnetic interference. The 843-R has all the infrastructure for field upgrading of the embedded software, should the need arise. 12 Figure 3.1 843-R displaying power measured with a Thermopile sensor. Displayed in analog needle mode with persistence on. 3.2 Smart Connectors The 843-R meter is versatile and can operate with either thermal or photodiode type laser measuring sensors. The sensor configuration and calibration information is stored in an EEROM in the sensor connector plug. This means that when the sensor is plugged in, the 843-R automatically identifies the sensor type, calibration and configuration. The user does not have to adjust anything. 13 Note: With the 843-R, sensors are hot swappable. Even after the meter is switched on, you can remove one sensor and insert a different one. The 843-R will recognize the switch and reconfigure itself according to the settings of the new sensor. When no sensor is plugged in, the 843-R meter gives the user the opportunity to hide or show settings, change the line frequency setting, and set the real time clock. It also shows the serial number of the instrument, last calibration date and firmware version. The user can also re-zero the instrument. See section 3.5. 3.3 Soft Keys The soft keys have functions defined by the legend above the key. The legend usually indicates what will happen when pressing the key. For example, if "Mode" appears above a key, pressing that key will open a menu to allow user to select between Power and Energy measurement modes. Some functions operate when the key is pressed and are canceled when the key is pressed again. Those keys show reverse highlighting when operational. Pressing the same key again cancels the operation and the highlighting. Key Functions The 843-R has certain conventions as to the meaning of standard key strokes and these are as follows: Highlighted item: The highlighted item is the item that is presently active. OK: Returns to the previous screen with the selected setting for immediate use and saved for next startup. 14 Cancel: Cancels the selection and returns to the previous screen, leaving the settings unchanged. Start: This puts into operation the active item. Exit: This gets you to the previous screen and saves changes made until instrument is turned off. Save: This saves changes permanently. The change is implemented now and is also saved for future use of the instrument. 3.4 Power Up and Shut Down To turn the 843-R on: Briefly press the On/Off Switch. The unit will switch on, and the display will appear. If no sensor is connected, the Setup screen will appear. If a sensor is connected, the appropriate default measurement screen will appear. To toggle the state of the backlight on and off: The backlight for the 843-R’s LCD can be configured to toggle between low, half, and full intensity (see Section 3.7.1 for full details). This toggling will be performed by briefly pressing the On/Off switch after the 843-R has been switched on. To switch the 843-R off: Press the On/Off switch and hold it for about 2 seconds until the display blanks. The current measurement settings will be saved automatically for the next time the 843-R is powered up. 15 3.5 843-R Functions that are Independent of Sensor Type Figure 3.2 843-R Setup Screen with no sensor connected. When no sensor is connected, the 843-R setup screen will be displayed. This gives the user the opportunity to hide or show settings, change the line frequency setting, and set the real time clock. It also shows the firmware version, serial number of the instrument, and last calibration date. The user can also re-zero the instrument. 3.5.1 Show or Hide Settings 1. 2. 3. Press the Down arrow ( ) until Show Settings is highlighted and press the Enter arrow ( ). Set to Yes to display sensor settings in the measurement screens. Set to No to hide the sensor settings and show a larger graph. Press the OK key to keep the new setting. 16 3.5.2 Line Frequency 1. 2. 3. 4. Setting Line Frequency correctly removes electrical noise that may be introduced to the measurements Press the Down arrow ( ) until Line Frequency is highlighted and press the Enter arrow ( ). Set to 50Hz or 60Hz, depending on the electrical power grid of the area that you are in. Press the OK key to keep the new setting. Note: The present settings are automatically saved for the next time the 843-R Power Meter is turned on. 3.5.3 Analog Output The 843-R Power Meter has an analog output with a fullscale output of 1 Volt. For thermal and photodiode sensors in power mode, the analog output is continually updated 15 times per second with the latest power measurement. For thermal sensors in single shot energy mode, the analog output is held fixed until the next pulse triggers. 3.5.4 Clock Settings The 843-R Power Meter is equipped with a real time clock which will show the date and time. This clock will also allow the 843-R Power Meter to query the sensor attached and notify you if the sensor is due for calibration. To set Date and Time 1. 2. Press the Down arrow ( ) until the Date and Time are highlighted and press the Enter arrow ( ). Scroll through and select Month, Day, Year, Hour, and Minutes with the Right arrow ( ). Change the selected item with the Down arrow ( ). 17 3. When finished, press the OK key to keep the new setting. 3.5.5 Zero Adjustments In 843-R Power Meter, all adjustments, including zeroing internal circuits, are done from the software. This ensures simple and accurate realignment. It is recommended to re-zero the 843-R Power Meter every 2 months for best performance. The simple zeroing procedure follows. To zero instrument: 1. If a sensor is connected, disconnect it. 2. Press the Zero key to enter the Zeroing screen 3. Make sure that the instrument is not in an electrically noisy environment and is undisturbed 4. Press the Start key and wait for message, "Zeroing completed successfully". 5. Press the Save key to save the new zero settings. 6. Press the Exit key to return to the Setup screen. Note (for Thermal Sensors only) For best results with thermal sensors, it may be necessary to do the procedure once with the sensor disconnected and a second time with it reconnected. After completing steps 1 - 6 above, Connect the sensor and make sure it is at room temperature and well shielded from any stray thermal power. It may be best advised to lay the sensor with the absorber face down on the table. 7. Connect the thermopile sensor. Ensure that is at room temperature and well shielded from any stray thermal power. It may be best advised to lay the sensor with the absorber face down on the table. Press the Zero key to enter the Zeroing screen 8. Press the Start key and wait for message, "Zeroing completed successfully". 9. Press the Save key to save the new zero settings. 10. Press the Exit key to return to the Setup screen. 18 3.6 843-R Measurement Screens 3.6.1. Bargraph The Bargraph is a ruler-like display in which the graph is filled proportionally to the reading’s being a percentage of full scale. The Bargraph display is available when measuring power or energy. Press the Zoom key to zoom in on a smaller section of the range when readings are fluctuating slightly. If you notice that noise has gotten into the measurement, you can press the Offset key to remove it from the measurement. Figure 3.3 Bargraph with Thermopile Sensor. 3.6.2. Needle A Needle graph simulates an analog display, similar to the style of an analog voltmeter or a car’s speedometer. The Needle display is available when measuring power or energy. Press the Zoom key to zoom in on a smaller section of the range when readings are fluctuating slightly. 19 If you notice that noise has gotten into the measurement, you can press the Offset key to remove it from the measurement. Press the Persist key to continue to display previous readings as well as to show the minimum and maximum measurements. Figure 3.4 Analog Needle with Photodiode Sensor with Persistence Enabled 20 3.7 Hardware Functions 3.7.1. LCD Backlight The LCD backlight is actually a set of LED’s that illuminate the display from behind. Because the 843-R uses a TFT display, the backlight must be constantly on. It can be operated at full intensity for full illumination; or at low or half level to conserve power consummation. The backlight level is toggled by a short press on the On/Off switch. The 843-R backlight consumes considerably less power than competing instruments and therefore it can operate from the battery even when the charger is not plugged in. Nevertheless, since it does shorten the time between charges, it is recommended to set the backlight to less than full intensity when the instrument is operated without the charger. 3.7.2. Charging The 843-R can be operated either by the internal battery or from an AC source with the charger plugged in all the time. Plug the charger into the jack labeled "12VDC" on the back panel (see Figure 3.3). The battery will be charged at the same rate whether the 843-R is switched on or off, and whatever the backlight level. The battery will fully recharge in around 4-5 hours. Note: The charger circuit of the 843-R is designed to allow the charger to be plugged in for an extended period without causing damage to the battery. The approximate time between charges is given in the following table for various configurations: Sensor Type Backlight Level Thermopile and Low 21 Time Between Charges 19 hours Photodiode Thermopile and Photodiode Thermopile and Photodiode Half 17 hours Full 15 hours The battery charge is indicated by the icon. The battery charge is shown approximately by each segment of the icon, e.g. if 2 segments are shown the battery is ½ full. When the battery is charging, the segments turn on in sequence. When the battery is low, the charger should be plugged in. 3.7.3. Analog Output The instrument provides an analog voltage output via the 2.5mm stereo plug on the rear panel marked “AN OUT” (see Figure 3.3). The 843-R is supplied with the mating adapter plug that connects to this socket. The analog output is useful for driving chart recorders and other analog devices. The voltage is proportional to the reading on the display and scaled such that full scale equals 1.00V. The analog output is driven through an impedance of 100 ohm. For best accuracy, is recommended to limit the external load to 100K (or larger). A smaller load (down to 1K) is possible, but may result in loss of accuracy. 12VDC AN OUT SENSOR INPUT USB OTG Figure 3.3 843-R Rear Panel View In power mode, the analog output is continually updated 15 times per second with the latest power measurement. 22 For thermal sensors in single shot energy mode, the analog output is held fixed until the next pulse triggers. 3.7.4. Field Upgrade The 843-R has all of the necessary infrastructure for field upgrading of the embedded software, should the need arise. This is done through the USB OTG port that is found on the rear panel of the instrument. To Update the 843-R Firmware: 1. 2. Download the latest 843-R firmware upgrade package from the Newport website: http://www.newport.com/ and copy to your target directory. Run the upgrade executable and follow the on screen instructions 3.7.5. Sensor Disconnect / Connect Recognition With the 843-R, sensors are hot swappable. Even after the meter is switched on, you can remove one sensor and insert a different one. The 843-R will recognize the switch and reconfigure itself according to the settings of the new sensor. 23 Chapter 4. Operation with Thermopile Absorber Sensors Warning: Before using the sensor for power or energy measurement, check that your laser power, energy and energy density do not exceed the sensor ratings. See Tables 5 and 6 in Chapter 7. If the sensor is a water-cooled type, ensure that the cooling water is flowing at an adequate rate; see table below. Also, note that the reflectance from the absorber could be as much as 10% and with CO2 lasers, the reflected beam can be quite specular, so it is advisable to provide a beam stop for the reflected beam with the highest power lasers. Sensor Type 919P5KW-50 Liters per Minute At Full Power 4.5 Min Pressure Bar 0.8 US Gallons per Minute 1.2 Table 1 Minimum Flow Rates for Water-Cooled Sensors 4.1 Thermopile Absorber Sensors When a radiant heat source, such as a laser, is directed at the absorber sensor aperture, a temperature gradient is created across the thermopile of the enclosed detector disc. This generates a voltage proportional to the incident power. 24 The meter’s electronics amplifies this signal and indicates the power level received by the sensor. At the same time, signal processing software causes the meter to respond faster than the actual thermal rise time of the detector disc, thereby reducing the response time of the 843-R. Energy of a single pulse is measured on the 843-R by digitally integrating the pulse power over time. 4.1.1. Supported Models The 843-R Power Meter is compatible with our new line of 919P Thermal Sensors. Older models of thermal sensors are not compatible. 4.2 Startup Configuration On power up, the 843-R meter checks its own memory as well as the sensor’s to decide on the measurement configuration. For example, if in the last session, the sensor was used to measure power in the Bargraph screen in autoranging with a YAG laser and averaging for 10 seconds, this will be the setup used the next time the system is powered up. These settings can all be easily changed, as will be described fully in the following sections. 4.3 Power Measurement Thermopile sensors measure power continuously at an update rate of 15 times per second. To best ensure measurement accuracy, center the laser beam carefully on the absorber surface. Power measurements can be displayed in Bargraph or Needle graphical formats. Updating measurement parameters is performed in the easy-to-reach Setup screen. 25 4.3.1 Bargraph Display 4.3.1.1 Screen Layout The Bargraph is a ruler-like display in which the graph is filled proportionally to the reading’s being a percentage of full scale. The Bargraph display is composed of the following components: Parameter settings, the sensor’s name and serial number, and battery status indicator at the top of the screen. Large numeric display shown prominently in the middle of the screen. Bargraph displayed close to the bottom. Softkey legends at the bottom of the screen. 4.3.1.2 Softkey Functionality Figure 4.1 Bargraph display with first set of Softkeys Mode: Press this key to change the selected measurement mode. o Press the Up/Down arrow ( ) to set the measurement mode to Power or Energy. o Press OK to return to the measurement screen with the new selection. 26 o Press Cancel to ignore any changes and continue in Power measurement mode. Display: Press this key to change the graphical display. o Press the Up/Down arrow ( ) to set the display mode to Bargraph or Needle. o Press OK to return to the measurement screen with the new selection. o Press Cancel to ignore any changes and continue with the Bargraph display. Setup: Press this key to change the Power measurement parameters. This will be described in Section 4.3.3 Power Setup Screen. Right Arrow ( ): Press this for additional Bargraph screen functions. Figure 4.2 Bargraph display with second set of Softkeys Left Arrow ( ): Press this for previous set of Bargraph functions. Zoom: Press this key to focus the Bargraph on the present reading. The Bargraph will show 20% of the 27 full scale centered on the present reading. Thus, if the full scale of the Bargraph is 20 watts, and your reading is 15 watts, pressing Zoom will make the Bargraph scale range between approximately 13 and 17 watts. Small fluctuations in power are more easily seen in this mode. Zoom will be reverse highlighted to show that it is active. Press the Zoom key again to return to the unexpanded Bargraph display. Offset: If the ambient environment has a thermal background, so that the 843-R shows a nonzero power reading even when there is no laser, you can subtract the background using the Offset function. For example, the 843-R display reads 0.1 Watts when the laser is blocked, and 20.5 Watts with laser power applied. In this case, the true power is 20.5 - 0.1 = 20.4 Watts. To subtract the background, press the Offset key while the laser is blocked. The 843-R will now read zero, and the 0.1 Watt background will be subtracted from all subsequent readings. The laser power reading displayed will thus be 20.4 Watts. When active, the Offset key is reverse highlighted and the offset that is being subtracted is shown in the upper right part of the screen. To deactivate, press Offset again. If you suspect that the 843-R has a permanent zero offset, the instrument’s internal zero should be reset. See Section 3.5.5. 4.3.2 Needle Display 4.3.2.1 Screen Layout A Needle graph simulates an analog display, similar to the style of an analog voltmeter or a car’s speedometer. By making use of the persistence feature, you can know what the full range of measurements actually is, including the maximum and minimum readings of the present set of measurements. The Needle display is composed of the following components: 28 Parameter settings, the sensor’s name and serial number, and battery status indicator at the top of the screen. Needle displayed prominently in the middle of the screen. Large numeric display. Softkey legends at the bottom of the screen. 4.3.2.2 Softkey Functionality Figure 4.3 Needle display with first set of Softkeys Mode: Press this key to change the selected measurement mode. o Press the Up/Down arrow ( ) to set the measurement mode to Power or Energy. o Press OK to return to the measurement screen with the new selection. o Press Cancel to ignore any changes and continue in Power measurement mode. Display: Press this key to change the graphical display. o Press the Up/Down arrow ( ) to set the display mode to Bargraph or Needle. o Press OK to return to the measurement screen with the new selection. o Press Cancel to ignore any changes and continue with the Bargraph display. 29 Setup: Press this key to change the Power measurement parameters. This will be described in Section 4.3.3 Power Setup Screen. Right Arrow ( ): Press this for additional Needle screen functions. Figure 4.4 Needle display with second set of Softkeys and Persistence active Left Arrow ( ): Press this for previous set of Needle functions. Zoom: Press this key to focus the Needle on the present reading. The Needle arc will show 20% of the full scale centered on the present reading. Thus, if the full scale of the Needle is 20 watts, and your reading is 15 watts, pressing Zoom will make the Needle scale range between approximately 13 and 17 watts. Small fluctuations in power are more easily seen in this mode. Zoom will be reverse highlighted to show that it is active. Press the Zoom key again to return to the unexpanded Needle display. Offset: If the ambient environment has a thermal background, so that the 843-R shows a nonzero power reading even when there is no laser, you can 30 subtract the background using the Offset function. For example, the 843-R display reads 0.1 Watts when the laser is blocked, and 20.5 Watts with laser power applied. In this case, the true power is 20.5 - 0.1 = 20.4 Watts. To subtract the background, press the Offset key while the laser is blocked. The 843-R will now read zero, and the 0.1 Watt background will be subtracted from all subsequent readings. The laser power reading displayed will thus be 20.4 Watts. When active, the Offset key is reverse highlighted and the offset that is being subtracted is shown in the upper right part of the screen. To deactivate, press Offset again. If you suspect that the 843-R has a permanent zero offset, the instrument’s internal zero should be reset. See Section 3.5.5. 4.3.3 Power Setup Screen The 843-R Power Meter can be set to various chosen settings while operating. These configuration settings are automatically saved for the next time the meter is turned on with this sensor. Figure 4.5 Setup Screen 31 4.3.3.1 Power Range Autorange In autorange mode, you do not have to change scales. When the reading of the meter is more than 100% of full scale of the present range, the 843-R will reconfigure itself to the next higher range. The ranges are arranged in factors of 1, 10, 100, etc. When the reading falls below 9% of full scale of the present range, the 843-R will reconfigure itself one range down. This change only occurs after a few seconds delay, thereby providing overlap (hysteresis) that limits the 843-R from flipping back and forth when reading close to the end of the scale. Manual Range There are certain disadvantages to autorange since it changes scale even if you don't want it to do so. If you want to measure in the same range all the time, it is better to use manual range. The correct range to select is the lowest one that is larger than the largest expected measurement. To Set the Power Range 1. 2. 3. Press the Down arrow ( ) until Range is highlighted and press the Enter arrow ( ). Using the Down arrow ( ), scroll through the available ranges until you reach the one that is correct for your measurement needs. Press the OK key to keep the new setting. 32 4.3.3.2 Laser Most Thermopile sensors have somewhat different absorption at different wavelengths. In order to compensate for this, each sensor has been calibrated by laser at several wavelengths. When you choose the correct laser wavelength, the correction factor for that wavelength is automatically introduced. Note that the laser wavelength correction in use is displayed in the upper left corner of the display. To set type of laser being used: 1. 2. 3. Press the Down arrow ( ) until Laser is highlighted and press the Enter arrow ( ). Using the Down arrow ( ), scroll through the available lasers until you reach the appropriate laser wavelength. Press the OK key. 4.3.3.3 Average How Averaging Works When a laser output is fluctuating or unstable, it is useful to measure the average power over a certain period. The 843-R gives you this exclusive feature, allowing averaging over periods varying from 1 second to 1 hour. As soon as the main power measurement screen (See Figure 4.2) is entered and the instrument is set to average mode, the instrument displays the average of readings over the period since the screen was entered up to the present. When the time period of the average is reached, the average becomes a running average over the average period backward in time. For instance, if the average period is 1 minute, at 30 seconds, the average is over 30 seconds, at 1 minute it is over 1 minute, at 5 minutes, it is over the period from 4 to 5 minutes (1 minute back from the present). 33 To Set the Average Period: 1. 2. 3. Press the Down arrow ( ) until Average is highlighted and press the Enter arrow ( ). Using the Down arrow ( ), scroll through the list of average periods until you reach the one that is correct for your measurement needs. Set the average period to NONE to disable averaging. Press the OK key to keep the new setting. 4.3.3.4 Other Settings Show or Hide Settings 1. 2. 3. Press the Down arrow ( ) until Show Settings is highlighted and press the Enter arrow ( ). Set to Yes to display sensor settings in the measurement screens. Set to No to hide the sensor settings and show a larger graph. Press the OK key to keep the new setting. Line Frequency The 843-R has built-in circuitry to screen out electrical noise from the local power grid that can introduce errors to the measurements. Set Line Frequency to your power grid’s frequency to screen out the noise correctly. 1. 2. 3. Press the Down arrow ( ) until Line Frequency is highlighted and press the Enter arrow ( ). Set to 50Hz or 60Hz, depending on the electrical power grid of the area that you are in. Press the OK key to keep the new setting. 34 Clock Settings The 843-R is equipped with a real time clock which will show the date and time. This clock will also allow the 843-R to query the sensor attached and notify you if the sensor is due for calibration. To set Date and Time 1. 2. 3. Press the Down arrow ( ) until the Date and Time are highlighted and press the Enter arrow ( ). Scroll through and select Month, Day, Year, Hour, and Minutes with the Right arrow ( ). Change the selected item with the Down arrow ( ). When finished, press the OK key to keep the new setting. 4.3.3.5 Additional On Screen Information On the right hand side of the Setup screen the following information is provided to the user Instrument o Firmware Version o Serial Number o Date of Last Calibration Sensor o Name o Serial Number o Date of Last Calibration (if supported by the sensor 4.4 Energy Measurement 4.4.1 Measuring Energy with Thermopile Sensors Although thermopile sensors are used primarily to measure power, they can measure single shot energy as well, where they integrate the power flowing through the disc over time and thus measure energy. Since the typical time it takes for the disc to heat up and cool down is 35 several seconds, these thermal sensors can only measure one pulse every several seconds at most. Thus they are suitable for what is called “single shot” measurement. Although the response time of the sensor discs is slow, there is no limit to how short the pulses measured are since the measurement is of the heat flowing through the disc after the pulse. 4.4.1.1 Standard Case of Energy Measurement To measure energy of a single pulse, first set up the Energy Range, Laser, and Threshold as described in Section 4.4.4 Energy Setup Screen. 1. 2. 3. 4. Wait until READY is flashed on the screen. This indicates that the sensor is ready for a new measurement Fire the laser. The display will go blank while the energy is being integrated. After about 2 - 4 seconds (depending on the sensor), the correct energy will be displayed. Return to Step 1 for the next measurement. Note: If you fire another pulse before "READY" appears, the reading may be inaccurate or may not be displayed. 4.4.1.2 Measuring Pulses of Very Low Energy When it is necessary to measure pulses of very low energy, i.e., less than 0.5% of the maximum range of the instrument, the following two alternative methods allow greater accuracy to be obtained. 1. A continuous train of pulses may be fired, and the average power measured using “Power” mode. The energy per pulse can be calculated by: Average Energy per pulse = Average power / Pulse Repetition Rate 36 2. A train of a known number of pulses may be fired, and the total energy measured in “Energy” mode. This train should not exceed 5 seconds duration. The energy per pulse can be calculated by: Average Energy per pulse = Total Energy / Number of Pulses In both of the above methods, the pulse repetition rate must exceed 3Hz. Higher rates will generally give improved accuracy, but care should be taken not to exceed maximum power ratings. 4.4.1.3 Measuring Energy of Rapidly Repeating Pulses With a typical thermopile sensor, the 843-R will only measure individual pulses every 5 seconds or so. You can also calculate the average energy of rapidly repeating pulses by measuring average power on the power setting and using the formula: Average Energy per Pulse = Average Power / Repetition Rate 4.4.2 Pulse Bargraph Screen 4.4.2.1 Screen Layout The Bargraph is a ruler-like display in which the graph is filled proportionally to the reading’s being a percentage of full scale. The Bargraph display is composed of the following components: Parameter settings, the sensor’s name and serial number, and battery status indicator at the top of the screen. READY will be flashed on the screen to indicate that the 843-R is ready to measure the next laser pulse to be fired. 37 Large numeric display shown prominently in the middle of the screen. Bargraph displayed close to the bottom. Softkey legends at the bottom of the screen. 4.4.2.2 Softkey Functionality Figure 4.6 Bargraph display with first set of Softkeys Mode: Press this key to change the selected measurement mode. o Press the Up/Down arrow ( ) to set the measurement mode to power or energy. o Press OK to return to the measurement screen with the new selection. o Press Cancel to ignore any changes and continue in Power measurement mode. Display: Press this key to change the graphical display. o Press the Up/Down arrow ( ) to set the display mode to Bargraph or Needle. o Press OK to return to the measurement screen with the new selection. o Press Cancel to ignore any changes and continue with the Bargraph display. 38 Setup: Press this key to change the Energy measurement parameters. This will be described in Section 4.4.4 Energy Setup Screen. Right Arrow ( ): Press this for additional Bargraph screen functions. Figure 4.7 Bargraph display with second set of Softkeys Left Arrow ( ): Press this for previous set of Bargraph functions. Zoom: Press this key to focus the Bargraph on the present reading. The Bargraph will show 20% of the full scale centered on the present reading. Thus, if the full scale of the Bargraph is 30 Joules, and your reading is 15 Joules, pressing Zoom will make the Bargraph scale range between approximately 12 and 18 Joules. Small fluctuations in energy are more easily seen in this mode. Zoom will be reverse highlighted to show that it is active. Press the Zoom key again to return to the unexpanded Bargraph display. Offset: Unlike power, offset subtraction is not necessary to achieve accurate energy measurements. However it can be used to facilitate 39 comparison between readings. For example, the first laser pulse is 1 Joule. To subtract this from future readings, press the Offset key. If the next pulse is actually 3 Joules, 2 Joules will be displayed on the screen, thereby indicating the difference between the two laser pulses. When active, the Offset key is reverse highlighted and the offset that is being subtracted is shown in the upper right part of the screen. To deactivate, press Offset again. 4.4.3 Needle Screen 4.4.3.1 Screen Layout A Needle graph simulates an analog display, similar to the style of an analog voltmeter or a car’s speedometer. By making use of the persistence feature, you can know what the full range of measurements actually is, including the maximum and minimum readings of the present set of measurements. The Needle display is composed of the following components: Parameter settings, the sensor’s name and serial number, and battery status indicator at the top of the screen. READY will be flashed on the screen to indicate that the 843-R is ready to measure the next laser pulse to be fired. Needle displayed prominently in the middle of the screen. Large numeric display. Softkey legends at the bottom of the screen 40 4.4.3.2 Softkey Functionality Figure 4.8 Needle display with first set of Softkeys Mode: Press this key to change the selected measurement mode. o Press the Up/Down arrow ( ) to set the measurement mode to power or energy. o Press OK to return to the measurement screen with the new selection. o Press Cancel to ignore any changes and continue in Power measurement mode. Display: Press this key to change the graphical display. o Press the Up/Down arrow ( ) to set the display mode to Bargraph or Needle. o Press OK to return to the measurement screen with the new selection. o Press Cancel to ignore any changes and continue with the Bargraph display. Setup: Press this key to change the Energy measurement parameters. This will be described in Section 4.4.4 Energy Setup Screen. 41 Right Arrow ( ): Press this for additional Needle screen functions. Figure 4.9 Needle display with second set of Softkeys and Persistence active Left Arrow ( ): Press this for previous set of Needle functions. Zoom: Press this key to focus the Needle on the present reading. The Needle arc will show 20% of the full scale centered on the present reading. Thus, if the full scale of the Needle is 30 Joules, and your reading is 15 Joules, pressing Zoom will make the Needle scale range between approximately 12 and 18 Joules. Small fluctuations in energy are more easily seen in this mode. Zoom will be reverse highlighted to show that it is active. Press the Zoom key again to return to the unexpanded Needle display. Offset: Unlike power, offset subtraction is not necessary to achieve accurate energy measurements. However it can be used to facilitate comparison between readings. For example, the first laser pulse is 1 Joule. To subtract this from future readings, press the Offset key. If the next pulse is actually 3 Joules, 2 Joules will be displayed on the screen, thereby indicating the difference between the two laser pulses. 42 When active, the Offset key is reverse highlighted and the offset that is being subtracted is shown in the upper right part of the screen. To deactivate, press Offset again. 4.4.4 Energy Setup Screen The 843-R Power Meter can be set to various chosen settings while operating. These configuration settings are automatically saved for the next time the meter is turned on with this sensor. Figure 4.10 Setup Screen 4.4.4.1 Energy Range Energy measurment is always made in a set manual range. The correct range to select is the lowest one that is larger than the largest expected measurement. To Set the Energy Range 1. Press the Down arrow ( ) until Range is highlighted and press the Enter arrow ( ). 43 2. 3. Using the Down arrow ( ), scroll through the available ranges until you reach the one that is correct for your measurement needs. Press the OK key to keep the new setting. 4.4.4.2 Laser Most Thermopile sensors have somewhat different absorption at different wavelengths. In order to compensate for this, each sensor has been calibrated by laser at several wavelengths. When you choose the correct laser wavelength, the correction factor for that wavelength is automatically introduced. Note that the laser wavelength correction in use is displayed in the upper left corner of the display. To set type of laser being used: 1. 2. 3. Press the Down arrow ( ) until Laser is highlighted and press the Enter arrow ( ). Using the Down arrow ( ), scroll through the available lasers until you reach the appropriate laser wavelength. Press the OK key. 4.4.4.3 Minimum Energy Threshold If the 843-R is used in a noisy environment or where there is a high level of background thermal radiation, the instrument may trigger spuriously on the noise or background radiation. It would then fail to measure the intended pulse. Since there is always some degree of noise or background radiation, the instrument is designed not to respond to pulses below some preset minimum size. This "Minimum Energy Threshold" is typically set to 0.3% of full scale of the selected range. If this level is found to be too sensitive for the user's particular environment, it may be altered by the user. The threshold 44 should not, however, be raised higher than necessary. This will cause a degradation in the accuracy of energy measurements of pulses below about 4 times the threshold level. The factory setting of energy threshold is "Medium". If the unit triggers on noise, set the threshold to "High". If you are measuring small energies and the unit does not trigger, set the threshold to "Low". To Set the Minimum Threshold Level: 1. 2. 3. Press the Down arrow ( ) until Threshold is highlighted and press the Enter arrow ( ). Using the Down arrow ( ), scroll through the list of threshold levels until you reach the one that is correct for your measurement needs. Press the OK key to keep the new setting. 4.4.4.4 Other Settings Show or Hide Settings 1. 2. 3. Press the Down arrow ( ) until Show Settings is highlighted and press the Enter arrow ( ). Set to Yes to display sensor settings in the measurement screens. Set to No to hide the sensor settings and show a larger graph. Press the OK key to keep the new setting. Line Frequency The 843-R has built-in circuitry to screen out electrical noise from the local power grid that can introduce errors to the measurements. Set Line Frequency to your power grid’s frequency to screen out the noise correctly. 1. 2. Press the Down arrow ( ) until Line Frequency is highlighted and press the Enter arrow ( ). Set to 50Hz or 60Hz, depending on the electrical power grid of the area that you are in. 45 3. Press the OK key to keep the new setting. Clock Settings The 843-R is equipped with a real time clock which will show the date and time. This clock will also allow the 843-R to query the sensor attached and notify you if the sensor is due for calibration. To set Date and Time 1. 2. 3. Press the Down arrow ( ) until the Date and Time are highlighted and press the Enter arrow ( ). Scroll through and select Month, Day, Year, Hour, and Minutes with the Right arrow ( ). Change the selected item with the Down arrow ( ). When finished, press the OK key to keep the new setting. 4.4.4.5 Additional On Screen Information On the right hand side of the Setup screen the following information is provided to the user Instrument o Firmware Version o Serial Number o Date of Last Calibration Sensor o Name o Serial Number o Date of Last Calibration (if supported by the sensor 46 Chapter 5. Operation with Photodiode Sensors Warning: Before using the sensor for power measurement, check that your laser power or energy and energy density does not exceed the sensor ratings. See Table 7 in Chapter 7. 5.1 Photodiode Sensors When a photon source, such as laser, is directed at one of the 918D or 818DB series photodiode detectors, a current is created proportional to the light intensity and dependent on the wavelength. The 843-R Power Meter amplifies this signal and indicates the power level received by the sensor. Due to the superior circuitry of the 843-R, the noise level is very low, and the 918D / 818 series sensors with the 843-R meter have a large dynamic range, from nanowatts to 2 watts. Newport’s 818 and 918D series photodiode sensors come with an attenuation filter, while the 818-xx-L-FC/DB series low cost fiber optic detectors do not. Some of the 819C/D series integrating sphere detectors utilize the 918D series detector, which has an integrated filter. Please refer to their user manuals and web sites for the specifications. A general guideline is to use the filter when the power level of the source is more than a few mW, to avoid sensor saturation. When saturated, the legend "OVER" will appear on the screen. 5.2 Startup Configuration On power up, the 843-R Meter checks its own memory as well as the sensor’s to decide on the measurement configuration. For example, if in the last session, the sensor was used to measure power in the Bargraph 47 screen in autoranging with a 1064 laser and averaging for 10 seconds, this will be the setup used the next time the system is powered up. These settings can all be easily changed, as will be described fully in the following sections. 5.3 Power Measurement Photodiode sensors measure power continuously at an update rate of 15 times per second. To best ensure measurement accuracy, center the laser beam carefully on the absorber surface. Power measurements can be displayed in Bargraph or Needle graphical formats. Updating measurement parameters is performed in the easy-to-reach Setup screen. 5.3.1 Bargraph Display 5.3.1.1 Screen Layout The Bargraph is a ruler-like display in which the graph is filled proportionally to the reading’s being a percentage of full scale. The Bargraph display is composed of the following components: Parameter settings, the sensor’s name and serial number, and battery status indicator at the top of the screen. Large numeric display shown prominently in the middle of the screen. Bargraph displayed close to the bottom. Softkey legends at the bottom of the screen. 48 5.3.1.2 Softkey Functionality Figure 5.1 Bargraph display with first set of Softkeys Power: With Photodiode sensors, the only measurement mode available is Power. Pressing this key will affect no change. Display: Press this key to change the graphical display. o Press the Up/Down arrow ( ) to set the display mode to Bargraph or Needle. o Press OK to return to the measurement screen with the new selection. o Press Cancel to ignore any changes and continue with the Bargraph display. Setup: Press this key to change the Power measurement parameters. This will be described in Section 5.3.3 Power Setup Screen. Right Arrow ( ): Press this for additional Bargraph screen functions. 49 Figure 5.2 Bargraph display with second set of Softkeys and Zoom active Left Arrow ( ): Press this for previous set of Bargraph functions. Zoom: Press this key to focus the Bargraph on the present reading. The Bargraph will show 20% of the full scale centered on the present reading. Thus, if the full scale of the Bargraph is 20 mW, and your reading is 15 mW, pressing Zoom will make the Bargraph scale range between approximately 13 and 17 mW. Small fluctuations in power are more easily seen in this mode. Zoom will be reverse highlighted to show that it is active. Press the Zoom key again to return to the unexpanded Bargraph display. Offset: If the ambient environment has a thermal background, so that the 843-R shows a nonzero power reading even when there is no laser, you can subtract the background using the Offset function. For example, the 843-R display reads 0.1 mW when the laser is blocked, and 20.5 mW with laser power applied. In this case, the true power is 20.5 - 0.1 = 20.4 mW. To subtract the background, press the Offset key while the laser is blocked. The 843-R will now read zero, and the 0.1 mW background will be subtracted from all subsequent readings. The laser power reading displayed will thus be 20.4 mW. 50 When active, the Offset key is reverse highlighted and the offset that is being subtracted is shown in the upper right part of the screen. To deactivate, press Offset again. If you suspect that the 843-R has a permanent zero offset, the instrument’s internal zero should be reset. See Section 3.5.5. 5.3.2 Needle Display 5.3.2.1 Screen Layout A Needle graph simulates an analog display, similar to the style of an analog voltmeter or a car’s speedometer. By making use of the persistence feature, you can know what the full range of measurements actually is, including the maximum and minimum readings of the present set of measurements. The Needle display is composed of the following components: Parameter settings, the sensor’s name and serial number, and battery status indicator at the top of the screen. Needle displayed prominently in the middle of the screen. Large numeric display. Softkey legends at the bottom of the screen. 51 5.3.2.2 Softkey Functionality Figure 5.3 Needle display with first set of Softkeys Power: With Photodiode sensors, the only measurement mode available is Power. Pressing this key will affect no change. Display: Press this key to change the graphical display. o Press the Up/Down arrow ( ) to set the display mode to Bargraph or Needle. o Press OK to return to the measurement screen with the new selection. o Press Cancel to ignore any changes and continue with the Bargraph display. Setup: Press this key to change the Power measurement parameters. This will be described in Section 5.3.3 Power Setup Screen. Right Arrow ( ): Press this for additional Needle screen functions. 52 Figure 5.4 Needle display with second set of Softkeys and Persistence active Left Arrow ( ): Press this for previous set of Needle functions. Zoom: Press this key to focus the Bargraph on the present reading. The Bargraph will show 20% of the full scale centered on the present reading. Thus, if the full scale of the Bargraph is 20 mW, and your reading is 15 mW, pressing Zoom will make the Bargraph scale range between approximately 13 and 17 mW. Small fluctuations in power are more easily seen in this mode. Zoom will be reverse highlighted to show that it is active. Press the Zoom key again to return to the unexpanded Bargraph display. Offset: If the ambient environment has a thermal background, so that the 843-R shows a nonzero power reading even when there is no laser, you can subtract the background using the Offset function. For example, the 843-R display reads 0.1 mW when the laser is blocked, and 20.5 mW with laser power applied. In this case, the true power is 20.5 - 0.1 = 20.4 mW. To subtract the background, press the Offset key while the laser is blocked. The 843-R will now read zero, and the 0.1 mW background will be 53 subtracted from all subsequent readings. The laser power reading displayed will thus be 20.4 mW. When active, the Offset key is reverse highlighted and the offset that is being subtracted is shown in the upper right part of the screen. To deactivate, press Offset again. If you suspect that the 843-R has a permanent zero offset, the instrument’s internal zero should be reset. See Section 3.5.5. 5.3.3 Power Setup Screen The 843-R Power Meter can be set to various chosen settings while operating. These configuration settings are automatically saved for the next time the meter is turned on with this sensor. Figure 5.5 Setup Screen 5.3.3.1 Power Range Autorange In autorange mode, you do not have to change scales. When the reading of the meter is more than 100% of full 54 scale of the present range, the 843-R will reconfigure itself to the next higher range. The ranges are arranged in factors of 1, 10, 100, etc. When the reading falls below 9% of full scale of the present range, the 843-R will reconfigure itself one range down. This change only occurs after a few seconds delay, thereby providing overlap (hysteresis) that limits the 843-R from flipping back and forth when reading close to the end of the scale. Manual Range There are certain disadvantages to autorange since it changes scale even if you don't want it to do so. If you want to measure in the same range all the time, it is better to use manual range. The correct range to select is the lowest one that is larger than the largest expected measurement. Logarithmic Scale The 843-R allows the measurement to be made in units of dBm that is a logarithmic scale. This is useful if you expect the readings to vary over several ranges and want to everything in one scale. The formula for dBm units is defined as 10 x Log (reading in mW). Therefore, at 1mW the reading will be 0 dBm, at 10mW it will be 10 dBm, at 100mW it will be 20 dBm etc. To Set the Power Range 1. 2. 3. Press the Down arrow ( ) until Range is highlighted and press the Enter arrow ( ). Using the Down arrow ( ), scroll through the available ranges until you reach the one that is correct for your measurement needs. Press the OK key to keep the new setting. 55 5.3.3.2 Laser Photodiode sensors have a different sensitivity at different wavelengths. Moreover, the filters used in the sensor have a different transmission at different wavelengths. In order to compensate, each sensor has a built in calibration curve (with 1nm resolution) over the entire measurement range. When you choose the correct laser wavelength, the correction factor for that wavelength is automatically introduced. To set type of laser being used: 1. 2. 3. 4. 5. Press the Down arrow ( ) until Laser is highlighted and press the Enter arrow ( ). Using the Down arrow ( ), scroll through the available lasers until you reach the appropriate laser wavelength. If your wavelength is listed, use the Down arrow ( ) to scroll through the wavelengths until reached and press the OK key. If the wavelength you want is not among the wavelengths in the six wavelengths listed press the Modify key. Use the Right ( ) and Down ( ) arrows to adjust the wavelength as desired. Then press the OK key. 5.3.3.3 Filter When the sensor is equipped with an attenuator filter, as is the case for the 818 or 918D series, the calibration module contains two sets of calibration data, with and without the filter on. When the Filter function is turned on, the calibration data with the filter in is used. 56 Warning: If a Newport photodiode sensor is used in the "Filter IN" setting and the filter is not installed or vice versa the readings will be completely incorrect. If the power of your laser exceeds the maximum for filter in, you can purchase a thermal or integrating sphere sensor for that wavelength. Consult your Newport agent for details. To choose the filter setting: 1. 2. 3. 4. 5. Press the Down arrow ( ) until Filter is highlighted and press the Enter arrow ( ). Using the Down arrow ( ), toggle between OUT and IN to reach the appropriate Filter setting. If you choose wish to work with filter IN, be sure to place the removable filter on the detector sensor. If you choose wish to work with filter OUT, be sure to remove the removable filter from the detector sensor. Press the OK key to keep the new setting. 57 5.3.3.4 Average How Averaging Works When a laser output is fluctuating or unstable, it is useful to measure the average power over a certain period. The 843-R gives you this exclusive feature, allowing averaging over periods varying from 1 second to 1 hour. As soon as the main power measurement screen (See Figure 5.1) is entered and the instrument is set to average mode, the instrument displays the average of readings over the period since the screen was entered up to the present. When the time period of the average is reached, the average becomes a running average over the average period backward in time. For instance, if the average period is 1 minute, at 30 seconds, the average is over 30 seconds, at 1 minute it is over 1 minute, at 5 minutes, it is over the period from 4 to 5 minutes (1 minute back from the present). To Set the Average Period: 1. 2. 3. Press the Down arrow ( ) until Average is highlighted and press the Enter arrow ( ). Using the Down arrow ( ), scroll through the list of average periods until you reach the one that is correct for your measurement needs. Set the average period to NONE to disable averaging. Press the OK key to keep the new setting. 5.3.3.5 Other Settings Show or Hide Settings 1. 2. 3. Press the Down arrow ( ) until Show Settings is highlighted and press the Enter arrow ( ). Set to Yes to display sensor settings in the measurement screens. Set to No to hide the sensor settings and show a larger graph. Press the OK key to keep the new setting. 58 Line Frequency The 843-R has built-in circuitry to screen out electrical noise from the local power grid that can introduce errors to the measurements. Set Line Frequency to your power grid’s frequency to screen out the noise correctly. 1. 2. 3. Press the Down arrow ( ) until Line Frequency is highlighted and press the Enter arrow ( ). Set to 50Hz or 60Hz, depending on the electrical power grid of the area that you are in. Press the OK key to keep the new setting. Clock Settings The 843-R is equipped with a real time clock which will show the date and time. This clock will also allow the 843-R to query the sensor attached and notify you if the sensor is due for calibration. To set Date and Time 1. 2. 3. Press the Down arrow ( ) until the Date and Time are highlighted and press the Enter arrow ( ). Scroll through and select Month, Day, Year, Hour, and Minutes with the Right arrow ( ). Change the selected item with the Down arrow ( ). When finished, press the OK key to keep the new setting. 5.3.3.6 Additional On Screen Information On the right hand side of the Setup screen the following information is provided to the user Instrument o Firmware Version o Serial Number 59 o Date of Last Calibration Sensor o Name o Serial Number o Date of Last Calibration (if supported by the sensor 5.4 Special Cases of Power Measurement 5.4.1 Measuring dB loss using the dB Offset function Since dBm is a logarithmic measurement, the ratio between two measurements will be the difference between the dBm measurements. For instance, if you want to measure the loss in a fiber optic cable where the measurement before the cable is 1mW = 0dBm and the measurement after the cable is 0.1mW = -10dBm. The ratio is then 1:10 = 0.1 and the dB loss is 0 – (-10) = 10dB. The dB offset function allows you to easily measure this. To do so do as follows: 1. When measuring the reference value press “dB Offset”. The value changes to 0 dB (note that now the units are dB, a relative value instead of dBm, an absolute value). 2. Now make your second measurement and the value of the difference in dB = ratio in numerical units will be shown. Note: If there is a zero offset in the reference value, you cannot subtract this using the dB offset function. Instead, before the start of the measurement, press “Offset” and subtract the zero offset. Then follow steps 1 and 2 above. The zero offset subtracted when “Offset” was pressed will be saved in the dBm scale and you can now use the dB Offset setting to measure true ratio without zero offset problems. 60 5.4.2 Measuring Very Low Powers When measuring very low powers, such as picowatt measurements using Newport’s photodiode sensor, there will be a rather large zero offset coming from the detector as well as a considerable noise fluctuation. Nevertheless, you can measure these low values by using the average function and pressing offset to eliminate the detector zero offset. In order to measure very low powers do as follows: 1. In the Setup screen, set the appropriate Average period. Return to the measurement screen. 2. Now block the power source you wish to measure, wait for a few measurement periods and press “Offset” to subtract the zero offset. 3. Now unblock the power source and measure. 61 Chapter 6. Circuit Description The 843-R Power Meter has two circuit boards: the Analog Module with the analog signal processing circuitry, and the Processor Board with the power supplies and user interface components. 6.1 Analog Module 6.1.1 Analog Circuit: The signal from the detector sensor enters the analog circuit and passes through EMI protection components to a differential trans-impedance preamplifier. From there it is further amplified by a programmable gain voltage amplifier and passes to an Analog-to-Digital (A/D) converter. All calibration data for the analog circuit is stored in a memory chip on the main board. There are no mechanical adjustable components (trimmers etc.) in the 843-R. The Analog Module’s on board digital processor receives data from the A/D converter and translates it into a measurement of current in Amps. When used with thermopile sensors, the data is then processed by a sophisticated digital filter that speeds up the effective response time of the sensor and rejects noise. 6.1.2 Analog Output: The analog output is driven through an impedance of 100 ohms and provided as a means of integrating the 843-R meter with other instruments (such as an oscilloscope) 62 6.2 Processor Board: The Processor Board is built around a Freescale i.MX283 ARM9 application processor. The digital circuit includes an upgradeable FLASH chip that can be programmed insitu by the 843-R support software. The Processor Board is responsible for reading the keypad and driving the LCD display, displaying measurement information received from the Analog Module. 6.2.1 Power Supply: The power supply provides the internal DC supply voltages for both the Processor Board and the Analog Module. It also contains the battery charging circuit and the AC supply for the backlight. The power supply circuits consist of high efficiency switch-mode designs. 6.2.2 EMI Protection: The digital processor circuit and the whole 843-R instrument are protected by EMI protection component on all signals that pass in and out of the box. In addition, EMI protection is added internally to prevent disturbances to the normal functioning of the instrument. The instrument meets the requirements of the European Community with respect to electromagnetic compatibility and has the “CE” mark. 63 Chapter 7. 843-R Power Meter Specifications 7.1 System/Meter Specifications Input Specifications Input Ranges A to D Sampling rate A to D resolution Electrical accuracy Electrical input noise level Dynamic range 15nA - 1.5mA full scale in 16 ranges 15Hz 18 bits plus sign ±0.25% ± 20pA new; ±0.5% ±50pA after 1 year 500nV or 1.5pA + 0.0015% of input range @3Hz. 9 9 decades (1:10 ) General Specifications Detector Compatibility Analog output Analog output accuracy Dimensions Mass Display Display digit height LCD lighting Bargraph segments Battery Charger input Operation between charges 919P series, 918D series, 818DB series 1v full-scale; 0.03% resolution. 100 ohms impedance ±0.2% (of reading) ±0.3% of full scale volts 114W x 41D x 212H 470g 320x240 pixel TFT LCD; Active area 70x52mm approx 15mm LED’s. Operates from charger or battery. Lighting level can be adjusted between 3 levels using on/off button. 310 2x Li-Ion 3.7V, 5.2Amp-hour battery pack built in DC 12-16v, 1W Charge time approx. 5 hours Automatically stops charging when battery is full With low backlight: 19 hours With medium backlight: 17 hours With high backlight: 15 hours 7.2 Thermal Sensor Specifications Sensor Max Power (WATTS) Max Avg. Power Density at Max Power Absorber Type 919P-003-10 919P-010-16 919P-020-12 919P-030-18 919P-050-18HP 919P-050-26 919P-040-50 919P-150-26 919P-250-35 919P-500-65 919P-5KW-50 3W 10W 4(20)W 30W 50W 50(150)W 35(150)W 150W 250W 500W 5000W 1000W/cm² 28KW/cm² 23KW/cm² 20KW/cm² 0.5KW/cm² 12KW/cm² 12KW/cm² 12KW/cm² 10KW/cm² 7KW/cm² 3KW/cm² BB BB BB BB PF-DIF BB BB BB BB BB BB Table 5. Max Power Specifications of Sensors PD - Photodiode PF - volume absorber for short pulses and high average powers BB - broadband surface absorber, high power density 64 Note: For more detailed and exact specifications, see the 919P series product web site. Absorber Type P HE BB EX Max Energy Density J/cm² Pulse Length 10ns 1µs 300µs 10 10 10 3 5 15 0.3 0.5 3 0.8 0.9 7 Table 6 Maximum Energy Densities for Various Absorbers (Single pulse). Graph 4. Pulsed Laser Damage Threshold for Thermal Sensors 7.3 Photodiode Sensor Specifications Please refer to the respective product web site for the latest Newport photodiode sensor specifications. 7.4 Warranty Newport Corporation warrants that this product will be free from defects in material and workmanship and will comply with Newport’s published specifications at the time of sale for a period of one year from date of 65 shipment. If found to be defective during the warranty period, the product will either be repaired or replaced at Newport's option. To exercise this warranty, write or call your local Newport office or representative, or contact Newport headquarters in Irvine, California. You will be given prompt assistance and return instructions. Send the product, freight prepaid, to the indicated service facility. Repairs will be made and the instrument returned freight prepaid. Repaired products are warranted for the remainder of the original warranty period or 90 days, whichever first occurs. Limitation of Warranty The above warranties do not apply to products which have been repaired or modified without Newport’s written approval, or products subjected to unusual physical, thermal or electrical stress, improper installation, misuse, abuse, accident or negligence in use, storage, transportation or handling. This warranty also does not apply to fuses, batteries, or damage from battery leakage. THIS WARRANTY IS IN LIEU OF ALL OTHER WARRANTIES, EXPRESSED OR IMPLIED, INCLUDING ANY IMPLIED WARRANTY OF MERCHANTABILITY OR FITNESS FOR A PARTICULAR USE. NEWPORT CORPORATION SHALL NOT BE LIABLE FOR ANY INDIRECT, SPECIAL, OR CONSEQUENTIAL DAMAGES RESULTING FROM THE PURCHASE OR USE OF ITS PRODUCTS. 7.5 Technical Support Contacts North America Newport Corporation Service Dept. 1791 Deere Ave. Irvine, CA 92606 Telephone: (949) 253-1694 Telephone: (800) 222-6440 x31694 66 Europe Newport/MICRO-CONTROLE S.A. Zone Industrielle 45340 Beaune la Rolande, FRANCE Telephone: (33) 02 38 40 51 56 Asia Newport Opto-Electronics Technologies (Wuxi) Co., Ltd 理波光电科技(无锡)有限公司 江苏省无锡市新区出口加工区 J3-8厂房 204028 Lot J3-8, Wuxi Export Processing Zone, New District, Jiangsu China 204028 Telephone: +86-510-8113 2999 Fax: +86-510-8526 9050 843-R Power Meter User Manual Newport P/N 1J06058 6 May 2013 Rev 1.00-2 For latest version please visit our website: http://www.newport.com/ 67