1
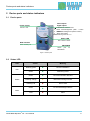
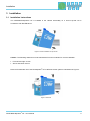
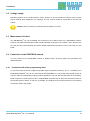
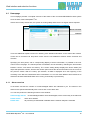
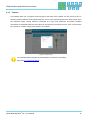
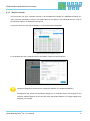
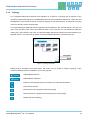
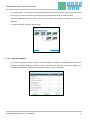
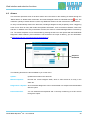
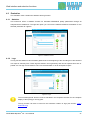
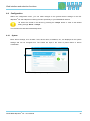
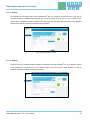
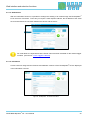
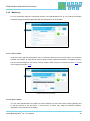
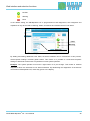
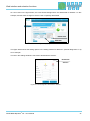
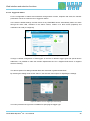
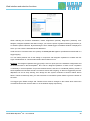
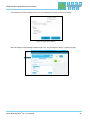
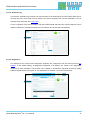
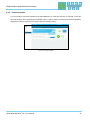
Revision overview Revision overview Date Revision Change(s) 04.06.2015 0 First version © Copyright 2015 Indu-Sol GmbH We reserve the right to amend this document without notice. We continuously work on further developing our products. We reserve the right to make changes to the scope of supply in terms of form, features and technology. No claims can be derived from the specifications, illustrations or descriptions in this documentation. Any kind of reproduction, subsequent editing or translation of this document, as well as excerpts from it, requires the written consent of Indu-Sol GmbH. All rights under copyright law are expressly reserved for Indu-Sol GmbH. Caution! This device may only be put into operation and operated by qualified personnel. Qualified personnel, as referred to in the safety-related information of this manual, are persons who are authorised to put into operation, to earth and to label devices, systems and electrical circuits in accordance with the standards of safety engineering. ® PROFIBUS-INspektor NT - User Manual 3 Contents Contents Revision overview 3 Contents 4 1 General information 6 1.1 Purpose of use 6 1.2 Scope of supply 6 1.3 Safety information 7 2 Device ports and status indicators 8 2.1 Device ports 8 2.2 Status LED 8 3 Installation 9 3.1 Installation instructions 9 3.2 Voltage supply 10 3.3 Measurement location 10 3.4 Connection to the PROFIBUS network 10 3.4.1 Connection with active programming cable 10 3.4.2 Installation at the end of the segment 11 3.4.3 Looping into an existing system 12 3.5 LAN connection 12 3.6 Signal inputs and outputs 13 3.7 LED functions 13 3.7.1 Run 13 3.7.2 Status 13 3.7.3 Alarm 13 4 Web interface and selection functions 14 4.1 Homepage 15 4.1.1 Alarm overview 15 4.1.2 Timeline 16 4.1.3 Device overview 17 4.1.4 Topology 18 4.1.5 Network statistics 19 4.2 Alarms 20 4.3 Evaluation 21 4.3.1 Statistics 21 4.3.2 Logs 21 4.4 Configuration 22 ® PROFIBUS-INspektor NT - User Manual 4 4.4.1 System 22 4.4.1.1 General 23 4.4.1.2 Network 23 4.4.1.3 Notifications 24 4.4.1.4 Information 24 4.4.2 Monitoring 25 4.4.2.1 Device name 25 4.4.2.2 Device status 25 4.4.2.3 Triggers & alarms 28 4.4.2.4 Automatic log 31 4.4.2.5 Diagnostics 31 4.4.3 Firmware update 32 5 Device parameters 33 5.1 Error telegram 33 5.2 Telegram repetition 33 5.2.1 Max. no. of telegram repetitions per bus cycle 33 5.2.2 Total telegram repetitions 33 5.3 Bus device failure 33 5.4 Bus device restart 33 5.5 Bus device internal diagnostics 33 5.6 Bus device external diagnostics 34 6 Support and contact 35 7 Technical data 36 ® PROFIBUS-INspektor NT - User Manual 5 General information 1 General information Please read this document thoroughly from start to finish before you begin installing the device and putting it into operation. 1.1 Purpose of use ® The PROFIBUS-INspektor NT permanently monitors all data traffic in a PROFIBUS DP, FMS or MPI master system. You will receive a maintenance requirement notification when critical changes that could lead to unplanned system downtimes are detected. Based on the log analysis, bus cycle times and the following quality parameters are monitored: Error telegrams Repeat telegrams Device failure / restarts Device errors (internal/external diagnostics) ® Only one PB-INspektor NT is required for each PROFIBUS master system, irrespective of the number of physical segments. In connection with an active programming cable, APKA II (an optional accessory not included in the scope of supply; art. no. 110040001), this can be seamlessly integrated into the fieldbus at any time without negatively impacting ongoing system operations. ® No Profibus addresses or adjustments to the PLC program are required for using the PB-INspektor NT. It works in an entirely manufacturer-independent way; i.e. the analysis works completely independently of the type of control system and bus devices. ® For long-term analysis, the PB-INspektor NT can remain in the bus system without any time restrictions. The relevant telegram traffic is continuously analysed and evaluated in order to detect deviations from normal conditions and trigger alarms. 1.2 Scope of supply The scope of supply comprises the following individual parts: PROFIBUS-INspektor NT ® 3-pole plug-in terminal block (power supply) 6-pole plug-in terminal block (alarm contacts) CD with software for the log analysis and device manual Please check the contents are complete before putting into operation. ® PROFIBUS-INspektor NT - User Manual 6 General information 1.3 Safety information Never open the housing of the PROFIBUS-INspektor NT ® Opening the housing immediately voids any warranty. If you think the device is defective, send it back to the supplier ® PROFIBUS-INspektor NT - User Manual 7 Device ports and status indicators 2 Device ports and status indicators 2.1 Device ports Fault output / digital inputs Power supply 24V DC + PE Potential-free switch contact 1 Alarm acknowledgement (Web + switch 2 contact) Alarm acknowledgement (switch contact) 3 Alarm deactivation GNDreference ground for 1–3 Status LED Run / Status / Alarm Web interface RJ45 network port PROFIBUS Sub-D port PROFIBUS for Figure 1: Device ports 2.2 Status LED LED Colour Flashing green Device initialisation Green ● Measuring mode Green ● PB communication detected Flashing orange Baud rate is being scanned Flashing red Device fault Green ● No unacknowledged alarms Red ● Alarm Run Status Meaning Alarm Table 1: Status LED ® PROFIBUS-INspektor NT - User Manual 8 Installation 3 Installation 3.1 Installation instructions The PROFIBUS-INspektor ® NT is installed in the cabinet horizontally on a 35-mm top-hat rail in accordance with DIN EN 60715. Figure 2: Device installation on top-hat rail Caution: The following distances must be maintained from other modules for correct installation: From left and right: 20 mm Above and below: 50 mm ® Removal for alternate use of the PB-INspektor NT in different master systems is illustrated in Figure 3. Figure 3: Removal ® PROFIBUS-INspektor NT - User Manual 9 Installation 3.2 Voltage supply Operation requires 24 V of external direct current, which is to be connected to the device via the 3-pole plug-in terminal block supplied in the package. The PE contact should be connected to the local PE system. Caution: When connecting, make sure that the polarity is correct. 3.3 Measurement location ® The PB-INspektor NT can essentially be connected to any desired point on a PROFIBUS network. However, the ideal measurement location would preferably be directly on the master / PLC. When this is the case, the bus communication can still be analysed without any problems, even in the event of a line break. 3.4 Connection to the PROFIBUS network You can connect to the PROFIBUS network in different ways. All three options are presented and described below. 3.4.1 Connection with active programming cable In connection with the active programming cable APKA II (optional accessory; art. no. 110040001), the ® PROFIBUS-INspektor NT can be connected to the PROFIBUS in a very simple way through a stub at any time without compromising ongoing system operations. This can also be performed on a temporary basis if required. A requirement for this is a PROFIBUS connector with an open PG connection socket in the existing system, directly on the PLC if possible. The settings of the terminal resistors on the existing connectors remain unchanged. ® PROFIBUS-INspektor NT - User Manual 10 Installation Figure 4: PROFIBUS connection by means of active programming cable 3.4.2 Installation at the end of the segment ® The existing segment end of the bus system is extended up to the PB-INspektor NT, as presented in Figure 5. The open output of the PROFIBUS connector of the last device on the bus is used for this purpose. One piece of PROFIBUS DP cable (from 1.5 MBit/s; at least one metre in length) and a PROFIBUS connector (D-SUB, 9-pole) are required. The terminal resistor usually integrated into the ® connector on what was the final device is to be switched off and the one on the PB-INspektor NT is to be switched on in its place (termination: "ON"). Caution: This connection option causes a PROFIBUS network fault and should be performed during system standstill. Figure 5: PB-INspektor® NT connected as a terminal ® PROFIBUS-INspektor NT - User Manual 11 Installation 3.4.3 Looping into an existing system ® The PB-INspektor NT is "looped" into the bus between two existing devices, as can be seen in Figure 6. To do this, the bus is disconnected. One piece of PROFIBUS DP cable (from 1.5 MBit/s; at least one metre in length) and a PROFIBUS connector (D-SUB, 9-pole) are required. The terminal resistor ® integrated into the connector on the PB-INspektor NT is to be switched off and sits in the "OFF" position, accordingly. Caution: This connection option causes a PROFIBUS network fault and should be performed during system standstill. Figure 6: "Looping in" between two devices 3.5 LAN connection The LAN connection provides the connection to the PB-INspektor ® NT. This involves a 10Base- T/100Base-TX RJ45 interface. A standard Ethernet cable is used as a connection cable to a PC/ laptop (not included in the scope of supply). Both the evaluation of internally recorded data and the parametrisation of the device are possible through this access point. ® The PROFIBUS-INspektor NT is supplied with the following factory-set network configuration: IP address: 192.168.212.212 Subnet mask: 255.255.255.0 A Web-server function is integrated for access to the device and can be opened with an appropriate standard browser (e.g. Microsoft Internet Explorer from version 9 or Mozilla Firefox from version 30; JavaScript must be activated). You can reach the device's user interface by entering the IP address of the ® PB-INspektor NT in the browser's command line. ® PROFIBUS-INspektor NT - User Manual 12 Installation 3.6 Signal inputs and outputs The 6-pole connector terminal block at the top of the device is assigned as follows: Output: - Potential-free switch contact (relay) - Max. 24V DC +20% - Max. 1 A - Opener OUT OUT 1 3 inputs: - Max. 24V DC ±20% - Inactive < 3V - Active > 10V - Maximum current 0.15 mA - Galvanically isolated 2 3 GND GND: - Input earth potential Input 1: Alarm acknowledgement (Web interface + switch contact) Input 2: Alarm acknowledgement (switch contact) Input 3: Alarm deactivation 3.7 LED functions 3.7.1 Run The green Run LED indicates the voltage supply status. This flashes during internal device start-up and lights up permanently in normal operation. When this LED remains off this is a sign that there is no supply voltage or there is an internal defect or tripped overvoltage protection. In both of these cases the device must be sent in for repair. 3.7.2 Status The Status LED can signal many conditions using a multi-colour indicator. In this process the following information is presented: Green: Bus communication has been detected Flashing orange: Looking for bus Flashing red: Device fault 3.7.3 Alarm The Alarm LED lights up red if the PB-INspektor ® NT has detected a fault in the PROFIBUS communication and the trigger for the alarm is activated. If no alarm has been triggered, this LED lights up green. ® PROFIBUS-INspektor NT - User Manual 13 Web interface and selection functions 4 Web interface and selection functions ® To access the Web interface, and thus the recorded data of the PROFIBUS-INspektor NT, use an Internet browser and enter the IP address (standard: 192.168.212.212) to open the Web interface. The following icons are used in the Web interface for a simple overview of the individual statuses of the network and devices: No faults: PROFIBUS communication is working without any problems. Warning: A communication fault or a diagnostic message has appeared in the network, or originated from a device, and this fault or message has not yet led to system failure. The sources of these events should be localised and resolved. Fault: A critical fault has appeared in the network, or originated from a device, and this fault leads to system failure. It is urgently necessary to resolve the fault. The bus communication in the network has failed or cannot be detected by the INspektor (serious fault in the network) or the device is no longer communicating or is not in the network. These devices are slaves that actually exist but are not set up in the configuration. ® PROFIBUS-INspektor NT - User Manual 14 Web interface and selection functions 4.1 Homepage The homepage provides a complete overview of the status of the connected PROFIBUS master system ® since the start of the PB-INspektor NT. If there are no faulty entries here, the system is working stably and there are no urgent actions required. Alarm overview Timeline Figure 7: Complete overview There are additional helpful functions for obtaining more detailed information on the state of the network. These can be accessed via drop-down menus and the two additional windows Alarm Overview and Timeline. Specifying the time period, with a corresponding display of device information, is possible in the submenus of the homepage. The relevant period of evaluation can be selected by switching the time window between 'current', 'last minute' and 'history'. The 'current' setting always displays the device status (live list) at that particular moment, and the 'last minute' option shows the device information over the course of the previous minute. With the 'history' pre-selection, all data is displayed since the beginning of the recording or the last time 'Delete data' was commanded. You can use these different time references to determine whether PROFIBUS faults are occurring occasionally or permanently. 4.1.1 Alarm overview In the alarm overview the number of unacknowledged alarms are indicated to you. The entries in the alarm list are opened automatically with a mouse click on the alarm bell. You can also perform the following functions in this window: Acknowledge alarms: Unacknowledged alarms are acknowledged, but the entries stay in the alarm list Delete alarms: Alarm list is deleted Delete data: All previously recorded data is deleted and the network analysis is restarted ® PROFIBUS-INspektor NT - User Manual 15 Web interface and selection functions 4.1.2 Timeline The timeline offers you a compact visual overview of the state of the network over the course of time. If different network statuses are analysed within the course of the monitoring period, the point in time when the respective status change started is presented as a new node (maximum 50 entries). Detailed information accumulated within this time frame can be opened by selecting one such node. The minimum time period for a status change (new nodes) is one minute. Figure 8: Timeline entry The individual status changes can be adjusted for each device separately. (See point 4.4.2.2 Device status). ® PROFIBUS-INspektor NT - User Manual 16 Web interface and selection functions 4.1.3 Device overview In this overview you get a complete overview of all the addresses possible in a PROFIBUS network (0– 126). These are presented in colour in the matrix based on the status of the individual devices. A key to the individual statuses is displayed in the top left. For greater clarity you can limit the display to 'only present' device addresses. Figure 9: Device overview selection window For a detailed view of the respective device information, select the relevant device. Figure 10: Detailed information window (e.g. address 44) Telegrams assigned to all devices are assigned to address 127 (broadcast address). All telegrams that cannot be specifically assigned to a particular device are assigned to the 'unknown' address window. This is the case when the sender address is no longer legible (error telegram), for example. ® PROFIBUS-INspektor NT - User Manual 17 Web interface and selection functions 4.1.4 Topology For a targeted analysis and effective fault evaluation of a network, a topology with a depiction of the complete, actual wiring sequence of all PROFIBUS devices is a fundamental requirement. That is why the ® PB-INspektor NT provides the option of storing a topology on the Web interface. An automatic scanning of the bus structure cannot be performed. The saved topology is displayed with the respective device statuses in the overview display. This way you get a quick overview of the current and historical states of your network. You can therefore localise the weak point in the network in the event of a fault and initiate appropriate measures for fault resolution in a targeted manner. You also have the option of opening detailed information on the devices here. Navigation Zoom Figure 11: Topology plan display Editing mode is activated via the 'Edit' button, with which you can create or modify a topology. In this mode the following tools are available to you for this purpose: Adds additional devices Adds additional repeaters Edits the corresponding device information (ID, name and description) Connects two devices Moves devices and repeaters within the topology Removes devices, repeaters and connections from the topology Deletes the entire topology ® PROFIBUS-INspektor NT - User Manual 18 Web interface and selection functions As a starting point, it is possible to adopt all detected devices from the device overview into the current plan and to sort and connect them according to the actual sequence using the 'Add all' button. Using the navigation and zoom tools, you can move around the window and adjust the size of the elements. To save all changes, press the 'Adopt' button. Figure 12: Edit mode 4.1.5 Network statistics You obtain a complete overview of all the important quality parameters of a PROFIBUS master system through the 'Network statistics' selection window. These form the basis for a network's stability. The individual parameters are explained in more detail in point 5: 'Device parameters'. Figure 13: Network statistics overview ® PROFIBUS-INspektor NT - User Manual 19 Web interface and selection functions 4.2 Alarms This overview represents a list of all alarm entries since the restart or the resetting of alarms through the 'Delete alarms' or 'Delete data' commands. All unacknowledged entries are indicated with the icon. The maximum quantity of saved alarms is 2,048. Any additional entries over that overwrite the oldest entries. An entry is automatically made in the alarm list, including a telegram record (snapshot), when a triggering event occurs. Such an entry will contain all important information, such as the device address, fault event and time. In addition to an entry in the alarm overview, the value for unacknowledged alarms increases by one. The saved snapshots can be downloaded by pressing the disc icon and opened with the PROFIBUS Diagnostics Suite software. (If this software is not included in the scope of delivery, you can download it at http://www.indu-sol.com/support/downloads/software/). Snapshot Download Figure 14: Alarms The following functions are also available to you in this menu: Update: Updates the entries in the alarm list Manual snapshot: Records the current telegram traffic, which is also stored as an entry in the alarm list. Diagnostics snapshot: All accumulated diagnostics can be summarised in a snapshot and downloaded with this option Download as ZIP: You can download all snapshots and a currently created log as a ZIP archive through this option. ® PROFIBUS-INspektor NT - User Manual 20 Web interface and selection functions 4.3 Evaluation The evaluation menu contains the statistics and log function. 4.3.1 Statistics This sub-menu offers a statistics function for individual PROFIBUS quality parameters through all analysed device addresses. Through this option you can see the address-related accumulation for the selected parameter at a glance. Figure 15: Statistics function 4.3.2 Logs The log function allows for all information gathered since the beginning of the recording to be documented in a report in summary form. These logs are stored in the log directory and can be exported from here or printed out. The logs can be used for one's own documentation or as an acceptance report. Figure 16: Logs The 'Print background' function must be activated in the respective browser for the complete display of the topology in the log print. The log function can also be used for the automatic creation of logs (see section 4.4.2.4 Automatic log). ® PROFIBUS-INspektor NT - User Manual 21 Web interface and selection functions 4.4 Configuration Within the configuration menu, you can make changes to the general device settings of the PB® INspektor NT and adapt the monitoring function specifically to your PROFIBUS network. All entries are saved in the device by pressing the 'Adopt' button or reset to the default setting through 'Reset' + 'Adopt'. The functions are described individually below. 4.4.1 System Basic device settings, such as date / time, device name, IP address, etc., are displayed in the system settings and can be changed here. The entries are kept in the event of power failure or device modification. Figure 17: System settings – device overview ® PROFIBUS-INspektor NT - User Manual 22 Web interface and selection functions 4.4.1.1 General ® The settings for the system time of the PB-INspektor NT are configured in this sub-menu. This can be entered manually or adopted automatically from the local system time of the PC. Also, entries for the device name, installation location, network name and notes can be made, which provide a more detailed description of the device and the network to be monitored. Figure 18: System settings – general 4.4.1.2 Network ® Under this item the network address settings are defined for the PB-INspektor NT (e.g. address, subnet mask, gateway). In this process you can decide whether you want to use a fixed address or if the IP address should be obtained automatically (DHCP). Figure 19: Network settings ® PROFIBUS-INspektor NT - User Manual 23 Web interface and selection functions 4.4.1.3 Notifications With the notification function it is possible to arrange the sending of an email through the PB-INspektor ® NT in the event of an alarm. To do this you require a valid recipient address, the IP address of the email server and an Ethernet connection between the device and the server. Figure 20: 'Notifications' selection window For email alerts it is imperative that the 'Email' action has been activated for the desired trigger condition (see section 4.4.2.3 Triggers & alarms). 4.4.1.4 Information ® Current resource usage and the firmware and hardware versions of the PB-INspektor NT are displayed in the information overview. Figure 21: PB-INspektor® NT device information ® PROFIBUS-INspektor NT - User Manual 24 Web interface and selection functions 4.4.2 Monitoring ® You can specifically adjust the monitoring function of the PB-INspektor NT to your network and define customised trigger and alarm thresholds with the specifications in these fields. Figure 22: Monitoring – complete overview 4.4.2.1 Device name All device names and their descriptions can be customised under the item 'Device names'. It is therefore possible, for example, to adopt and to save the device model, equipment identifier or installation location from the electrical diagrams. All entries are then visible in both the device overview (see item 4.1.3) and in the topology (see item 4.1.4). Figure 23: Device names overview 4.4.2.2 Device status You can make adjustments to the display of device statuses over the entire master system (globally) and to specific devices in this sub-menu. In this process, a device may adopt the following statuses, depending on the fault event and setting: ® PROFIBUS-INspektor NT - User Manual 25 Web interface and selection functions No fault Warning Fault ® In the default setting, the PB-INspektor NT is programmed so that diagnostics, error telegrams and repetitions of any device lead to 'Warning' status; and failures and restarts lead to 'Fault' status. Fault Warning Add filter Figure 24: Device status – default setting By adding and editing additional event fields, the device statuses can be customised. In this process, device-specific settings overwrite global values. This means it is possible to create device-specific settings to hide fault events which are justified in normal system operation. Example: The system operator must enter a light barrier for a part change. This results in external diagnostics which are irrelevant to bus status evaluation. By deselecting the diagnostics of the devices ® concerned in PB-INspektor NT, these stay 'green' in the display. ® PROFIBUS-INspektor NT - User Manual 26 Web interface and selection functions As can be seen in the figure below, the event 'External diagnostics' was deselected for address 7 in this example, and the status change for device 8 was completely deactivated. Delete filter Edit filter Figure 25: Applying filters The figure below shows the setting options in the editing window for address 7 (external diagnostics 0) as an example. The tick in the settings window is removed to deactivate the devices. Deactivate devices Figure 26: External diagnostics deactivated for address 7 ® PROFIBUS-INspektor NT - User Manual 27 Web interface and selection functions 4.4.2.3 Triggers & alarms For the configuration of alarms and evaluation through switch contact, snapshot and email, the relevant parameters can be set under the item 'Triggers & alarms'. In the device's default settings, all fault events of any PROFIBUS device automatically lead to an alarm through the alarm LED, activation of the switch contact, creation of a fault record (snapshot) and notification via email (if configured). Figure 27: Triggers & alarms – default setting Through a variable configuration of fault triggers in the form of different trigger types and special device addresses, it is possible to make the relevant adjustments here for a targeted fault search or targeted device monitoring. The various options for editing individual filters are described in greater detail below. By selecting the editing mode via the edit icon, the selection menu opens for adjusting the settings. Figure 28: Selection menu for trigger type 'status change' The menu presented in Figure 29 is available for specifying the trigger type. ® PROFIBUS-INspektor NT - User Manual 28 Web interface and selection functions Figure 29: Trigger types When selecting the functions breakdown, restart, diagnostics (internal), diagnostics (external), error telegram, telegram repetition and status change, you have the option of global monitoring (all devices) or an address-specific selection. By deselecting the item 'Global trigger' the address window is displayed in which you can enter the individual device addresses. Under the item 'Threshold value' the quantity of events per bus cycle is specified that should lead to a trigger tripping. You can make practical use of this setting in conjunction with telegram repetitions to indicate the first signs of deterioration in communication before device failure occurs. Example: The telegram repetition rate (retry limit) is set to 3 reps/cycle in the hardware configuration and ® the threshold value in the PB-INspektor NT is set to 2 telegram repetitions. If there is now a repetition occasionally in normal operation for process-related reasons, that can be considered perfectly normal. If these repetitions accumulate around 2 successive events due to ageing, an alarm is triggered by the PB® INspektor NT as an early warning; even though the bus system continues to function without device failure. Thanks to this timely alert, you now have time to react before system failure to get to the bottom of the issue. The trigger types 'Status change' and 'Timeline event' relate to changes in the entries which have been recorded under the item 'Device status' or in the timeline display respectively. ® PROFIBUS-INspektor NT - User Manual 29 Web interface and selection functions The measures for when a trigger event occurs are defined in the menu for the item 'Actions'. Figure 30: Trigger actions selection With the settings in the following example (Figure 31), only the failure of device 7 causes a trigger. Figure 31: Device 7 failure trigger setting ® PROFIBUS-INspektor NT - User Manual 30 Web interface and selection functions 4.4.2.4 Automatic log The function 'Automatic log' provides you with the option of documenting the current system status at preset time intervals. These logs are then saved in the device regularly and are thus available to you for opening at any time (see item 4.3.2 Logs). For the completion of the documentation, both the customer data and that of the system inspector can be added. Furthermore, the different sections for log creation can be selected or deselected. Figure 32: Selection window for automatic log creation 4.4.2.5 Diagnostics The settings for the content of the 'diagnostics snapshot' are configured in this sub-menu (see item 4.2 Alarms). In the default setting, all diagnostics telegrams of all devices are saved in the 'diagnostics snapshot' for later evaluation. The function can be global or specified for individual devices by adding address-related entries (see Figure 33: the diagnostics for address 7 have been deselected). Figure 33: Diagnostics – address 7 deselected ® PROFIBUS-INspektor NT - User Manual 31 Web interface and selection functions 4.4.3 Firmware update ® You can perform a firmware update for the PB-INspektor NT using this function, if required. To do this, the new firmware file is selected and uploaded via the 'Search' button. Following successful installation, triggering a restart is required in the device with the "Restart" button. Figure 34: Firmware update ® PROFIBUS-INspektor NT - User Manual 32 Device parameters 5 Device parameters 5.1 Error telegram The 'Error telegram' parameter indicates the quantity of faulty or destroyed telegrams. An error telegram is detected through a checksum error or parity error, for example. 5.2 Telegram repetition If a bus device does not respond after a pre-defined time, it is asked to re-send the data by the master: this is what is referred to as 'telegram repetition'. This also occurs when the master cannot interpret the content of a telegram. The maximum number of telegram repetitions per cycle is set in the master through the 'Retry limit' parameter. 5.2.1 Max. no. of telegram repetitions per bus cycle With 'Max. no. of telegram repetitions per bus cycle', the maximum number of repeat requests to a bus device per bus cycle is recorded. If a bus device fails, the value displayed equates to the set retry limit. 5.2.2 Total telegram repetitions With 'Total telegram repetitions', all telegram repetitions occurring within the recording period are counted. 5.3 Bus device failure The 'Bus device failure' parameter counts all device failures that occur. A bus device failure occurs when the set retry limit (max. number of successive telegram repetitions) is exceeded. 5.4 Bus device restart The parameter 'Bus device restart' counts all device restarts that occur. A restart of a bus device occurs after a failure or a system start when a bus device has its parameters set by the control system without any faults and then begins the cyclical data exchange. 5.5 Bus device internal diagnostics Direct bus module faults are described for internal diagnostics. ® PROFIBUS-INspektor NT - User Manual 33 Device parameters Examples for internal diagnostics are: 5.6 Short circuit on an internal backplane bus or the I/O modules inside the slave Processing of a specific master request without resourcing being available Bus device external diagnostics External events which are not directly associated with the bus or the bus module are detected and reported for external diagnostics. Examples for external diagnostics are: Wire break of an external sensor on an analogue 4–20 mA input Switching off the voltage for an expansion module by opening the safety door Lack of compressed air at a valve terminal module ® PROFIBUS-INspektor NT - User Manual 34 Support and contact 6 Support and contact Should you wish to contact us for any reason or require quick assistance regarding device functions, further information can be accessed from this page. Manuals are also stored here for support. Figure 35: Support and contact ® PROFIBUS-INspektor NT - User Manual 35 Technical data 7 Technical data Voltage supply: +24V DC Tolerance: 10% Power consumption: Max. 200 mA Starting current: Max. 200 mA Dimensions (W x H x D): 55 x 105 x 120 (in mm) Assembly: TS35 DIN top-hat rail (EN 50022) Weight: 0.6 kg Protection class: IP20 Operating temperature: +5°C to +55°C Storage temperature: -20°C to +70°C Relative air humidity: 10%…90% ® PROFIBUS-INspektor NT - User Manual 36