1
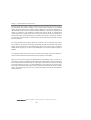
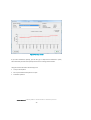
SCENARIO GENERATOR WORKSHOP European Office: SIMUL8 Corp Cochrane House 29 Cochrane Street Glasgow, UK G1 1HL tel: (44) 141 552 6888 / 0870 850 8886 fax: (44) 141 553 2331 / 0870 240 5589 [email protected] www.scenario-generator.com Copyright© SIMUL8 Corporation 2013 Scenario-Generator: powered by SIMUL8 - Simulation Software for Healthcare Improvement Scenario-Generator: powered by SIMUL8 - Simulation Software for Healthcare Improvement Scenario Generator Training Manual TABLE OF CONTENTS Introduction What is Simulation? ...................................................................................................................................... 1 The Scenario Generator ................................................................................................................................ 1 Manual .......................................................................................................................................................... 1 Displays .............................................................................................................................................................. 2 Welcome to the Scenario Generator ............................................................................................................ 2 On-Screen Display ......................................................................................................................................... 3 Toolbar .......................................................................................................................................................... 4 Step by Step Approach ...................................................................................................................................... 5 Step 1: Run Your Health Economy Default Scenario ..................................................................................... 5 Population Input Manager ........................................................................................................................ 5 Running a Scenario ................................................................................................................................... 7 Results ....................................................................................................................................................... 7 Step 2: Configuring the Scenario Generator ................................................................................................. 9 Population ................................................................................................................................................. 9 Prevalence................................................................................................................................................. 9 Calculating Social Care Prevalence From Poppi and Pansi...........................................……………….………………..11 Pathway Referral Rates ........................................................................................................................... 12 Changing Referral Rates.......................................................................................................................... 13 Drawing Steps……………..……………………………………………………………………………………………………..…….…..…..14 Exercise 1: Amending the Default Pathway to Reflect a Local Health System ........................................... 15 Step 3: Creating Pathways .......................................................................................................................... 16 Drawing Steps ......................................................................................................................................... 14 Step Properties ....................................................................................................................................... 17 HLD .......................................................................................................................................................... 18 Cost ......................................................................................................................................................... 19 Duration .................................................................................................................................................. 19 Waits ....................................................................................................................................................... 20 Parallel Steps…………………………………………………………………………………………………………………………..…………20 Unassigned Pathways ............................................................................................................................. 22 Step 4: Pathway Activity.............................................................................................................................. 22 Allocate ICD Conditions to Pathway ....................................................................................................... 22 Assign Percentage Split ........................................................................................................................... 23 Direct Input of Activity ............................................................................................................................ 24 Exercise 2: Creating Pathways..................................................................................................................... 26 Step 5: Developing, Running and Comparing Scenarios ............................................................................. 30 Population Growth ................................................................................................................................. 30 Exercise 3: Healthcare: Using Projections……………………………………………………………………………………………….33 Weightings .............................................................................................................................................. 35 Scenario-Generator: powered by SIMUL8 - Simulation Software for Healthcare Improvement Arrival Rates/Year Variability .................................................................................................................. 35 Time in step/Time in System……………………………………………………………………………………………………….……..35 Waiting breaches .................................................................................................................................... 36 Random Seed……………………………………..…………………………………………………………………………………….……….37 Running Trial……………………………………………………………………………………………………………………………………..37 Caveats………………………………………………………………………………………………………………………………………………39 Step 6: Setting Capacity.............................................................................................................................. 40 Exercise 4: Using Capacity ........................................................................................................................... 44 Step 7: Interpreting Results......................................................................................................................... 48 Using the Tool ......................................................................................................................................... 50 Support ................................................................................................................................................... 50 This tutorial applies to Scenario Generator version 5 Scenario-Generator: powered by SIMUL8 - Simulation Software for Healthcare Improvement Introduction WHAT IS SIMULATION? Simulation is the recreation of any kind of process on a computer. It allows a process to be built up and then experimented with. This will highlight where and why problems occur, such as why a bottleneck builds up. This enables areas for improvement to be identified, new ideas tested out and, most importantly, users can understand how a system works without taking any significant risks. THE SCENARIO GENERATOR The Scenario Generator, SG, is a simulation tool which works by generating a virtual population with the demographics of an actual population and with conditions which are randomly allocated in line with known prevalence data. This gives a number of potential health and social care events for the population that move through a set of care pathways. Each interaction between patient event and pathway step has an impact in terms of resourcing, duration and capacity and these interactions are simulated and their effect captured and reported to the User. The User can then consider the impact of change. THIS MANUAL This manual aims to take you through the steps you need to follow in using the Scenario Generator. This manual should be used in conjunction with the User Guide which is accessed from the Help menu within the tool. At the end of the session, you should understand the purpose of the tool and how you will use it with your local health and/or social care economy. You should be: familiar with the functions of the tool and how to use them able to create a pathway, run a scenario and interpret the results able to use the tool with your local health and social care economy and to continue to develop your skills in using the tool with support from the SIMUL8 team Scenario-Generator: powered by SIMUL8 - Simulation Software for Healthcare Improvement 1 DISPLAYS WELCOME TO THE SCENARIO GENERATOR The next few pages will take you through the various displays you will see when using Scenario Generator. Take your time in getting familiar with these as it will make the learning process much easier. On starting the Scenario Generator the first screen that will appear to you is shown and described below. Saved Scenarios stored in C:\Program Files\Scenario Generator\Scenarios will appear here Latest News & Offers Open Scenarios From other locations Figure 1: Opening Screen To get started on using the Scenario Generator click “Create New Scenario”. Scenario-Generator: powered by SIMUL8 - Simulation Software for Healthcare Improvement 2 ON SCREEN DISPLAY On creating a new scenario you will be displayed with the following screen. Figure 2: On-Screen Display Step Properties Pathway Navigator The pathway navigator shows the five generic pathways built into the tool, these being Mental Health, Urgent, Planned, Unplanned (Maternity) and Social Care. To view another pathway, double click the pathway you wish to view from the Pathway Navigator. If any step within the pathway is clicked, the Step Properties box will show all the properties associated with that step. These properties can also be edited from here. Scenario-Generator: powered by SIMUL8 - Simulation Software for Healthcare Improvement 3 TOOLBAR Take a minute to look over and play about with these tools. Refresh Scenario Applies a grid to the screen Run Scenario Zoom Draw Function Clock: shows the time, day and week in the simulation Stop Scenario Creates a Parallel Step Creates a Wait Creates a Step Figure 3: Toolbar Together these menus will provide you with all the ability to build and input data into your pathways (Pathways), Run (Run), Save and Name pathways (Scenario Management) and analyse all your results (Results). The help menu is also important and provides you with a detailed User Guide that should be used alongside this training manual. Scenario-Generator: powered by SIMUL8 - Simulation Software for Healthcare Improvement 4 STEP BY STEP APPROACH This stage will take you through a Step by Step approach to help you understand how to use Scenario Generator. STEP 1: RUN YOUR HEALTH OR SOCIAL CARE ECONOMY DEFAULT SCENARIO The first step is to run your population through the default scenario. The reason for this is that the default is based on National Average and any inconsistencies must be identified. POPULATION INPUT MANAGER Scenario Generator holds information for healthcare populations in England, Scotland and Canada. This will need to be set to ensure you can access your chosen healthcare population and can be done at Scenario Management > Preferences > Population Preferences, once you have selected your population you should get a message saying “Base Model Updated”. To select your population, go to Population and Activity menu and select Population Input Manager; Figure 4: Population Input Manager From the population options shown in Figure 4, choose your population type, and then enter the relevant code. The codes can be found in the User Guide (Section 13 Appendix A) accessed from the Help Menu. Scenario-Generator: powered by SIMUL8 - Simulation Software for Healthcare Improvement 5 OTHER POPULATION OPTIONS From Figure 4 you can see that there are two options that do not relate to a Health or Social Care Economy, “Last Revised” and “User Defined”. When selected, the last revised option will bring up the last selected population together with any changes you made to it. The user defined option allows you to create and store your own populations, for further details please see the User Guide Section 15 Appendix C. After selecting your population you will be shown the following screen, this is the Population Input Manager. At this screen you can make changes to the data, simply by clicking in the appropriate box and making the required change. Figure 5: Population Input Manager The Scenario Generator ages the population year on year, scroll through the bar at the top (Select Year to View) and watch as the figures change year on year. Now select Population Forecast and choose different information to view various forecast graphs of your population. Once you are comfortable at navigating the Population Input Manager, select OK to populate Scenario Generator with your chosen population. Scenario-Generator: powered by SIMUL8 - Simulation Software for Healthcare Improvement 6 If you want to replace the population data with your own you can use the above method or press the Export button. This will export all this information to a CSV file which you can easily change. After making changes you can then import this data back in by selecting the Import button and choosing the appropriate file. Note If you only import one year of data be sure to click ‘Apply to Future Years’ as this will ensure a population forecast is produced for 50 years. If you are inputting your own population forecast for a given number of years do not press, as this will override years 2 onwards. RUNNING A SCENARIO The next stage is to run the Scenario Generator to get some results. To do this select the Run Menu then Run Scenario. You are going to run the scenario for one year, so select one from the drop down menu. At this stage you are running the scenario with the capacity disabled. This means that results will only be useful for activity levels and costs. Capacities have to be entered by step and depend on local economies. (See Step 6) RESULTS On running the simulation the display will change to show the High Level Display (HLD), as shown below; Figure 6: High Level Display (Run with GP population J82007) You will also notice a bar at the bottom left which shows how long the simulation will take to complete. Scenario-Generator: powered by SIMUL8 - Simulation Software for Healthcare Improvement 7 When the simulation has finished running, check the High Level Display, by clicking on the relevant boxes to display activity. This gives you the aggregated results across the whole health and social care economy. Do the inpatients, outpatients, births and A&E attendances broadly reflect the pattern of health or social care service activity in your economy? The default for the SG has been set to reflect the national picture, so there may be some differences in what you see. Click on the “Close High Level Display” button. You will be taken back to the main screen where the activity for each step is displayed. Each time a scenario is run, you will also generate a .CSV file “Pathway_Details” for that run. Have a look at this now, you can find it at, C:\Programe Files\SCENARIOGENERATOR\Scenarios\Scenario Results. This file describes step by step activity volumes and costs by pathway. Filtering on the HLD column will help you see what parts of the system contribute to the overall result. Try recreating the table shown in Figure 6. Figure 7: Filtering on HLD Result for Admissions It is important to rename these files if you make an important scenario run. If you do not and then run another scenario it will rewrite the results, with those of your current run. The best way to ensure you do not lose results is to name your scenario before you run it. To do this, go to Scenario Management > Scenario Name and name your scenario. This then automatically renames the .CSV file to “namechosen_PathwayDetails.csv”. Note Also you must remember to close this file before running another scenario (if you don’t rename it) as Scenario Generator will not be able to write out the results. Scenario-Generator: powered by SIMUL8 - Simulation Software for Healthcare Improvement 8 STEP 2: CONFIGURING THE SCENARIO GENERATOR At this stage, you need to configure the Scenario Generator to reflect your local health and social care economy, if your first scenario run does not produce the right levels of activity, there are a number of modifications you can make. POPULATION In the Population Input Manager you should check that the following are correct: Starting Population Size Births Deaths Gender and Age Breakdown Note Remember you can upload your own population projections to override those in Scenario Generator. Refer back to Step 1 or User Guide Section 4.1 which provides full details on the Population Input Manager. PREVALENCE You will also want to ensure that; Pregnancy prevalence fits with local fertility rates by age group. Condition prevalence rates reflect those of your local population. Social care prevalence data for your local area is entered into the tool. The default data is based on the national prevalence taken from the DH tools POPPI (www.poppi.org.uk) and PANSI (www.pansi.org.uk). Data for your local authority area can also be found on these sites. To view and change Pregnancy Prevalence select Population and Activity >Activity Algorithm Weightings. Select the Pregnancy Prevalence tab and if you wish to change these simply double click and replace. You can also account for miscarriages and non-resident pregnancies here by entering the additional percentage of these in your selected area. Then by selecting recalculate, activity algorithm percentages for all age groups will automatically update. Scenario-Generator: powered by SIMUL8 - Simulation Software for Healthcare Improvement 9 Figure 8: Activity Algorithm Weightings To view and change Condition Prevalence select, Population and Activity > Prevalence. Scenario Generator uses ICD-10 codes to classify the prevalence of disease by age band. As before, they can be changed by double clicking and entering a replacement value. The import and export function, like the population input manager, is also provided here to allow you to override those provided by default. Figure 9: Condition Prevalence Scenario-Generator: powered by SIMUL8 - Simulation Software for Healthcare Improvement 10 Note For further information on Condition Prevalence Estimates please refer to the User Guide section 4.2. To view and change social care prevalence, select Population and Activity > Prevalence and choose the Chapter 23, the social care chapter Figure 10: Social Care Prevalence CALCULATING SOCIAL FROM POPPI AND PANSI CARE PREVALENCE To input your local social care prevalence from POPPI or PANSI , choose your local authority area and category of interest and download the data. Then, using the same age bands as Scenario Generator, calculate the prevalence as a proportion of the total population number in that age band as in the example below. Scenario-Generator: powered by SIMUL8 - Simulation Software for Healthcare Improvement 11 Figure 11: POPPI/PANSI prevalence PATHWAY REFERRAL RATES You will see that each pathway is made up of a series of steps, each connected by arrows. There are a number of properties associated with each step, and referral rates determine the flow of activity through the steps. If the default scenario reads higher or lower than you might expect, you need to decide whether: Your population is more or less demanding than the national average and alter the referral rates going to self care at the start of the pathway accordingly. GPs refer more or less patients to outpatients and alter referral rates from primary care to referral management in the planned care pathway accordingly. Your population has a higher or lower user of A&E and alter referral rates either to emergency services or from emergency services through to A&E or self-referrals) Your population has a higher or lower admissions rate for urgent, elective or daycase and alter referral rates from A&E to admissions in urgent care, or from outpatient diagnosis to admissions in planned care) Your population is more or less likely to self-fund their care needs Scenario-Generator: powered by SIMUL8 - Simulation Software for Healthcare Improvement 12 CHANGING REFERRAL RATES To change a referral rate, double click on the step you want change the referral rates from. A dialogue box will appear, select “Referral Rates” Figure 12: Edit Step Properties A second dialog box will now appear; double clicking on each entry will allow you to change the referral rates, and also the priority. If you only want to change two referral rates, checks the boxes of those rates you wish to remain the same. This will lock them. Figure 13: Referral Rates The Scenario Generator is based on the flow of events, so change a referral rate at the start of the pathway first and run the scenario before making further alterations. After making an alteration and running the scenario, always click the restart button before rerunning a scenario or making a change. Figure 14: Restart When you are happy with your local default, save your scenario by selecting, Scenario Management > Save Scenario and use this scenario as your baseline model. Scenario-Generator: powered by SIMUL8 - Simulation Software for Healthcare Improvement 13 Note Further information on Referral Rates can be found in the User Guide Section 3.1.6. Also remember that when you reload your saved scenario you will need to select ‘last revised population’ in the Population Input Manager if you have made changes to your population. DRAWING STEPS You can add steps to your pathway using the Create Step, Create Parallel Step or Create Wait function, and linking them using the draw function. You can also remove steps by selecting the required step and pressing Delete. Remember you looked at these when looking at the displays section; Create Functions Figure 15: Draw Step Tools Draw Function Practice by creating a New Pathway by selecting Pathways > New Pathway then on the dialog box that appears selecting your chosen pathway type and clicking OK. Now click on the “Create Step” box and drop a few on to the screen. Then select the arrow (Draw Function) as shown and move the cursor into the centre of the step you wish to connect from and click and then move the cursor to the step you wish to connect to, and click. When creating pathways ensure that all steps are connected, otherwise activity will not flow through all steps in your pathways. You will also need to ensure that you have clearly defined end points in your pathway so that activity can leave. These will appear automatically when a step has no activity flowing out, a start step will also appear automatically when there are no arrows flowing into that step. You must ensure that you only have one start in any pathway. Start End Figure 16: Start and End Points Scenario-Generator: powered by SIMUL8 - Simulation Software for Healthcare Improvement 14 EXERCISE 1 HEALTHCARE: AMENDING THE DEFAULT PATHWAY TO REFLECT A LOCAL HEALTH SYSTEM The aim of this exercise is to take you through the steps you have just read and apply them. This exercise is based on the North East Essex CCG model and how to alter this to reflect the current situation in the Urgent Care Pathway. Go to Population Input Manager and choose CCG population for North East Essex CCG_06T Name your scenario “Before” by going to Scenario Management >Scenario Name. Run the Default Scenario. Look at the results for the urgent care pathway. Let’s say, North East Essex has 75,000 A&E attendances, 19,000 admissions and 24,000 Walk-In Centres or MIU attendances. What are the results in the model? How far away is this from the real situation? Reset the Scenario, and rename it “After” by going to Scenario Management >Scenario Name. Let’s assume that the population of North East Essex is less likely to access health services through the urgent care route, hence the lower number of A&E attendance. Change the referral rates from the Urgent Care start step, to reduce the flow to self-referral by 1% and the calls to 999 emergency services by 1%, with the activity flowing to self-care instead. Let’s also assume that GPs tend to deal with most urgent episodes in primary care, and attendances from Primary Care are reduced by 10% with the activity flowing to self- care instead What results do you get now? How much do you need to decrease the conversion of ‘Leave A&E attendance to admission’ by to get around 19,000 admissions? Now compare your scenarios, go to Results > Scenario Comparison > Load results and select the “Before” and “After” scenarios you have just run. Note As you are only making changes to the Urgent Pathway, the simulation will run quicker if you only run one pathway at a time. To do hits go to Run > Select Pathways to Run and uncheck the pathways you do not wish to run. Scenario-Generator: powered by SIMUL8 - Simulation Software for Healthcare Improvement 15 EXERCISE 1 SOCIAL CARE/HEALTH: AMENDING THE DEFAULT PATHWAY TO REFLECT A LOCAL SOCIAL CARE AND HEALTH SYSTEM The aim of this exercise is to take you through the steps you have just read and apply them. This exercise is based on Bristol health and social care system, and will enable you to alter the default mental health model using NHS Comparators data* on mental health to better reflect the current situation in the mental health in Bristol. Go to Population Input Manager and choose CCG population for Bristol CCG_11H. Name your scenario “Before” by going to Scenario Control >Scenario Name. Run the Default Scenario. Look at the results for the mental health pathway. In reality, Bristol has 4850 total first outpatient appointments and 1825 admissions. What are the results in the model? How far away is this from the real situation? Reset the Scenario, and rename it “After” by going to Scenario Control >Scenario Name. Let’s assume that there are far more admissions from the crisis resolution service than the default model suggests, with fewer patients managed in the community. Change the referral rates from the Crisis Resolution step, to increase the flow to admissions to 2%, and increase referrals from the primary care step to first outpatients to 2.75%, taking those patients from self-care. Also increase referrals from primary care admissions to 1%, taking those patients from community care services. What results do you get now? Can you improve on this? In fact, NHS Comparators also reports that there are 2045 DNAs. Create a new step for DNAs and work out what percentage of referrals are DNAs Now compare your scenarios, go to Scenario Results >Scenario Comparison>Load results and select the “Before” and “After” scenarios you have just run. Note As you are only making changes to the Mental Health Pathway, the simulation will run quicker if you only run one pathway at a time. To do this go to Scenario Control > Select Pathways to Run and uncheck the pathways you do not wish to run. *NHS Comparators gives a health warning to mental health data published Scenario-Generator: powered by SIMUL8 - Simulation Software for Healthcare Improvement 16 STEP 3: CREATING PATHWAYS To develop pathways within Scenario Generator, you can Copy Existing Pathways Modify Existing Pathways Create New Sub-Pathways Import & Export Pathways Delete Pathways There are five default pathways of Mental Health, Urgent, Planned, Unplanned (maternity) and Social Care these can be copied or can be broken down into sub pathways to reflect specific conditions. If you decide that one of the default pathways, or one you have created, would be a useful base for your new pathway, select Pathways > Copy Pathway then name the pathway and define what category you want the sub-pathway to be a part of. If you decide that you want to start a pathway from scratch select Pathways > New Pathway then name the pathway and assign it to one of the five categories. It is also possible to import and export pathways to make sharing your pathways easy. To export a pathway select Pathways > Export Pathway. This will create an .XML document which can then be shared and imported by selecting Pathways > Import Pathway and selecting the relevant .XML file. For more information on pathways see section 2 of the User Guide. STEP PROPERTIES The properties of each step can be changed by double clicking the required step. Figure 17 shows the Edit Step Properties dialog. Scenario-Generator: powered by SIMUL8 - Simulation Software for Healthcare Improvement 17 Figure 17: Step Properties For each step you can define the HLD Category, Cost, Duration, Referral Rates and Capacity associated with it. In the default pathways all these have been set for you; however you can change these to fit your local context. If drawing a pathway from scratch you will also have to set these parameters. You can set properties by double clicking on the step. Capacity always has to be set by you as this varies in each health and social care economy; those used in the default are for display purpose. It is suggested that to start with, you set the duration, cost and High Level Display for the steps in the pathway you are entering or amending. This will give you results surrounding costs and activity. You will cover capacity later in this manual. If you remember you covered referral rates earlier on so the focus now will be on the first three Step Properties. HLD The high level display (HLD) tab allows you to aggregate the results from a particular step together with other step results. There are default categories and details set within the tool which you can use or you can create your own. This is useful for example if you are adding multiple sub-pathways and each pathway has a step that would be counted as an Admission. By setting each steps HLD to Category – Secondary Care and then Detail-Admission, the tool will aggregate these allowing you to validate that your total admissions equates to what it should. Scenario-Generator: powered by SIMUL8 - Simulation Software for Healthcare Improvement 18 COST If you click on cost, you will be taken to dialogue box which gives you various options. If you select Basic this allows you to put in a Basic cost for each event. You can specify an optional fixed cost for each unit of activity processed by the step and/or an optional variable cost based on the number of days or hours the activity spends in the step. Formatted: English (United States) Figure 18: Costs Selecting other cost types by clicking the “Advanced” button, then clicking “add/remove costs” allows you to select from activities with a tariff. You can apply more than one tariff to each step, however you will be required to input the percentage of the activity in that step that is relevant to each cost. By default the tool will apply an equal percentage for each tariff. DURATION Duration allows you to set the time spent in each step by minutes, hours or 24 hour days. You can also apply a selection of distributions to this duration, which are highlighted below. Figure 19: Duration Scenario-Generator: powered by SIMUL8 - Simulation Software for Healthcare Improvement 19 PARALLEL STEPS In Social Care Models Scenario Generator does not use activity. Instead we are using population based prevalence which means that we are dealing with individuals in the pathway. We therefore need to be able to model how patients access their services and in reality patients can be accessing several at once, this can be modelled using Parallel Steps. Figure20: Parallel Process Step The above shows how a parallel process Step can be used. You can select the step by selecting the option on the toolbar. The parallel process step will batch out a number which is set automatically according to the number of connections from it, in figure 20 above for example, if your patient or service user is having a district nurse service as well as home care and a specialist nursing service, you can use the parallel step to split the activity into three parallel sets of activity. The likelihood of patients needing each service will be set as a route out percentage from each decision point of requirement. The parallel step will be act as a dummy step, having no time associated with it and no other characteristics, meaning there will be no results for these steps. WAITS You can set a planned wait between steps by using the oval Create Wait on the toolbar. This allows the flow of activity to wait for a period of time, ensuring that activities do not flow through the simulation too quickly. This is essential in pathways like the maternity pathway, and also useful when trying to model care pathways where patients use a service over a number of months of years, but perhaps only an hour or so a week. You can set the maximum and minimum length of wait required and apply a distribution to this. Loops are covered in more depth in the User Guide. Wait steps are also used where you want to analyse the buildup of queues before a constrained step. When using waits this way, no maximum or minimum duration is set; it is a “dummy” step to enable you to measure waiting times. Scenario-Generator: powered by SIMUL8 - Simulation Software for Healthcare Improvement 20 The figures below show examples of each type of wait. The first shows a planned wait in the maternity pathway, the planned wait time before the next appointment. The second shows a loop wait where there is a minimum weekly wait before the next Early Intervention. The third example shows a dummy wait where capacity has been enabled and the wait times and queues resulting from the constrained Primary Care step are being measured. The fourth shows how you can set a maximum waiting time for a wait after which a service user or patient will exit the wait and go down an alternative pathway. This is useful when modelling the impact of waiting on outcomes. 1.Planned Wait 2. Loop Wait 3. Dummy Wait Scenario-Generator: powered by SIMUL8 - Simulation Software for Healthcare Improvement 21 4. Wait Outcomes Figure 21: Wait Examples UNASSIGNED PATHWAYS You can create a pathway under the unassigned pathway in the same way as outlined above. These pathways are designed to model activity derived from existing pathways. For example, if you want to model end of life care, you can create an end of life pathway under unassigned care and then send activity from individual steps from within the planned and urgent care pathways. To do this, you select the relevant end step from the main pathway, and select referral rates. This will give you the option of sending activity to the relevant step within the end of life unassigned pathway STEP 4: PATHWAY ACTIVITY The Scenario Generator has several methods available to allow you to determine how much activity runs through each pathway, these are discussed below. There are 5 generic pathways which form the basic framework which have pre-defined activity set to them. If you want to make changes to these or add activity to new pathways you create, you can do so by following one of the below methods. ALLOCATE ICD CONDITIONS TO PATHWAY This option is accessed through Population and Activity > Allocate Prevalence Entry to Pathway. Scenario-Generator: powered by SIMUL8 - Simulation Software for Healthcare Improvement 22 You will be presented with age-banded prevalence for ICD10 codes and social care prevalence and asked to assign the relevant codes and/or age bands to your pathway. You can select as many codes as are relevant to your pathway condition and the SG will automatically calculate the percentage of the generic pathway that this represents. Figure 22: Allocate ICD Conditions to Pathway To assign prevalence codes to a pathway, first select “Assign Entries to Pathway” and then select the Generic Pathway of which your sub-pathway is part. Then select the relevant codes you wish to assign to your pathway by clicking on them. To assign multiple conditions hold “Control” and click. Now select the pathway you wish to assign conditions to, this will appear at the bottom of the dialog. Once selected click “Assign”. ASSIGN PERCENTAGE SPLIT You may wish to allocate a simple percentage split to your new pathway without using the ICD10 prevalence data. To do this, access the pathway manager directly through Population and Activity > Pathway Manager. You will be presented by the below dialog and should select Specify Percentage Split. Scenario-Generator: powered by SIMUL8 - Simulation Software for Healthcare Improvement 23 Figure 23: Pathway Manager Remember that if later you decide to try and use prevalence codes to assign activity to pathways you must first change back your option to Auto-Calculate by Prevalence, before assigning codes. Once selected you can now manually change the percentage splits to each sub-pathway by double clicking on the one you wish to change. Figure 24: Percentage Splits DIRECT INPUT OF ACTIVITY You may have access to, or wish to model very precise activity data into your pathway. If this is so, then go to Population and Activity > Activity into Pathways, where you will be able to input your own figures direct by exporting the table and importing your own data. Scenario-Generator: powered by SIMUL8 - Simulation Software for Healthcare Improvement 24 Figure 25: Activity into Pathways Note If your prevalence percentage reflects the level of the condition which is present in your population (rather than the level of activity seen in the health service), remember to reflect the difference between the potential demand and the actual activity (which you will be basing on historic activity for the default) by allocating some of the demand at the start of your pathway to self-care using the referral rates. FOR MORE INFORMATION ON HOW TO INPUT ACTIVITY INPUT PATHWAYS REFER TO SECTION 4.4 CONTROLLING ACTIVITY OF THE USER MANUAL. Scenario-Generator: powered by SIMUL8 - Simulation Software for Healthcare Improvement 25 EXERCISE 2 HEALTHCARE: CREATING A DERMATOLOGY PATHWAY In the Planned Care pathway create a new pathway and call it Dermatology, recreate the pathway below, using the same referral rates. Note Referral rates have been calculated using evidence that dermatology accounts for approximately 10% of a GP’s workload (DIP, Volume 8, Number 4) and from NHS Comparators’ data for dermatology outpatient first and follow-up appointments. Set costs as follows: Step Cost GP First Outpatient Outpatient Follow-up Outpatient Procedure GPwSI GPwSI Follow-up £21 £120 £120 £140 £48 £48 Allocate the whole of the ICD 10 Chapter relating to skin conditions to this pathway. Select only the dermatology pathway to run. Now run the pathway using the North East Essex Population Scenario-Generator: powered by SIMUL8 - Simulation Software for Healthcare Improvement 26 What is the financial impact if you reduce referrals by GPs to outpatients by 2% instead sending activity to GPwSI? TIP: Remember to name your Scenarios to allow easy comparison after scenario runs. Scenario-Generator: powered by SIMUL8 - Simulation Software for Healthcare Improvement 27 EXERCISE 2 SOCIAL CARE: CREATING A TELECARE PATHWAY In the Social Care pathway create a new pathway and call it Telecare, recreate the pathway below, using the same referral rates. Note Referral rates have been calculated assuming that only 30% of people living alone with lifelong limiting illness will use Telecare that senior staff assessment is required in complex cases, and that 30-40% of those using Telecare will need reassessment at different times during the year. Set costs as follows: Step Cost Traditional care packages Select social care cost codes 190-205 and 210-221 Fixed cost £500 Telecare service and Telecare service 2 Allocate social care prevalence relating to older people living alone with illness. Select only the Telecare pathway to run. Scenario-Generator: powered by SIMUL8 - Simulation Software for Healthcare Improvement 28 Now run the pathway using the Bristol Population What is the impact if you increase use of telecare by 5%? TIP: Remember to name your Scenarios to allow easy comparison after scenario runs. Scenario-Generator: powered by SIMUL8 - Simulation Software for Healthcare Improvement 29 STEP 5: DEVELOPING, RUNNING AND COMPARING SCENARIOS You will want to run a range of different scenarios depending on the question you wish to answer. The Scenario Generator has some additional functionality which can help you with this. POPULATION GROWTH The Scenario Generator automatically ages the population year on year. A growing population will generate additional demand. As previously mentioned you can compare population growth estimates with local estimates, select Population and Activity > Population Forecast; Figure 26: Population Forecast You know that you can import your own population forecasts by using the import and export function on the population manager, but what if you want to model the impact of lower or higher levels of population growth. For this you can use the Projections Function. PROJECTIONS You can add or reduce the expected population year on year using the Projections by selecting Advanced > Projections. To add a population projection select “Population” from the right hand side, the following dialog will then be displayed. Scenario-Generator: powered by SIMUL8 - Simulation Software for Healthcare Improvement 30 Figure 27: Population Projection Input the year you wish to change the population and define whether this is an increase or decrease, as well as by how much. You can also make changes to the population by age band and gender, to do this select number by age/gender, and input the changes. Figure 28: Population Projections The figure above provides an example of how to model the impact of an increase in 65+ in the population that will happen in three years. All projections you add can then be seen in the main projection window. Projections can also be applied to disease and population prevalence and selected step properties (Referrals Rates, Duration and Capacity).These are added in a similar manner to the population projections, for more information see the User Guide Section 6 Projections. Scenario-Generator: powered by SIMUL8 - Simulation Software for Healthcare Improvement 31 Figure 29: Step & Prevalence Projections Try running scenarios for 10 years with different population projections and compare activity and cost. Scenario-Generator: powered by SIMUL8 - Simulation Software for Healthcare Improvement 32 EXERCISE 3 HEALTHCARE: USING PROJECTIONS In exercise 2 you identified that there could be savings in GP’s referring activity to GPwSI rather than outpatients. However in the real world it may take a while for this policy to be rolled out and for all GP’s to comply. Therefore you want to model this into our pathway and to do so you will use projections. First you want to run the pathway you created but this time for three years, remember to name the scenario. Now you want to reset the scenario to its original state by changing the referral rate from GP to GPwSI back to 2.1%. Now using the projections function input the following Referral Projections; you are going to gradually increase the amount of activity that the GPwSI sees over the next few years. Year Referral Rate 2 3 GPwSI to 3.1% GPwSI to 4.1% Now rename your scenario “Dermatology with Projections” and run the scenario for three years. Compare your scenarios What is the financial difference in gradually introducing this change? Scenario-Generator: powered by SIMUL8 - Simulation Software for Healthcare Improvement 33 EXERCISE 3 SOCIAL CARE: USING PROJECTIONS In exercise 2 you identified that there could be some savings in increasing the use of Telecare for older people living alone with illness. However in the real world it may take a while for this policy to be put into practice, with some service users and their families needing to be convinced that it is the right course of action. Let’s assume that people take up the opportunity more slowly. To do this you need to use the projections function. First you need to run the pathway you created but this time for three years. Remember to name the scenario and to set the scenario back to its original state changing referrals to telecare back to 30%. Now using the projections function input the following Referral Projections; you are going to gradually increase the amount of activity that is referred to Telecare over the next 3 years. Year Referral Rate 2 Referrals to Telecare 32.5% Referrals to Telecare to 35% 3 Now rename your scenario “Telecare with Projections” and run the scenario for three years. Compare your scenarios What is the financial difference in gradually introducing this change? Scenario-Generator: powered by SIMUL8 - Simulation Software for Healthcare Improvement 34 WEIGHTING In the Population Input Manager, you will find a set of weightings which can be used to simulate expected demand for particular types of population. These can be switched on and off (they are set at off in the default), and different weightings applied ARRIVAL RATES/YEAR VARIABILITY You can also change the Yearly Variability to reflect how the seasonality of demand may affect your system. This can be accessed by selecting Advanced > Seasonality; you can then enter how weekly activity compares to the % of the norm. You can also set the time you wish to run your scenario from. Double click on the clock on the main screen and use the calendar function to change the start date. TIME IN STEP / TIME IN SYSTEM Scenario Generator allows you to measure the time spent in all steps or the time spent in the whole system. To measure the time in system or measure all time in step results you must switch these preferences on, to do so select Scenario Management > Preferences > Results Capture Preferences and check the option you wish to record. To speed up the simulation you can select only the individual steps whose results you are interested in. To do so first ensure that from Results Capture Preferences, record all time in step results is not checked. Next click the step for which you wish to record the time and from the Step Properties Window change Record Time in Step to “Yes”. On running the scenario the results can be accessed from Results > Time in Step Results or Time in System Results. Scenario-Generator: powered by SIMUL8 - Simulation Software for Healthcare Improvement 35 Figure 30: Time in Step Results WAITING BREACHES The property window allows a wait standard to be set between a section of steps, e.g. referral to treatment and the tool will measure whether the standard has been breached. Select a start point for your wait, say primary care in the planned care pathway, (set Wait Standard to Start). Next pick an end point, say outpatient treatment (set Wait Standard to Stop) and also set the Wait Duration (7 day weeks) as 18, to test the likelihood of meeting 18 week targets. Once you have run the simulation you can look at the results in Results > Scenario Comparison > Summary Results. It will tell you the number of standard breaches and the number of possible breaches, see below. Scenario-Generator: powered by SIMUL8 - Simulation Software for Healthcare Improvement 36 Figure 31: Wait Standard Breaches For further information on all of the above see the User Guide Section 8- Results Generation. RANDOM SEED The Scenario Generator is a stochastic tool which means that it uses randomness as events move through steps in the pathway. This occurs in the duration property (unless the fixed option has been selected) and the in the referral property. Running one scenario will not produce a statistically significant result. If you want a result which is statistically significant you need to run the same scenario 20 times, by varying the "random seed number". This function can be found at Scenario Management > Preferences > Random Number Seed Settings. RUNNING TRIALS You need to run a simulation multiple times to remove the aspect of the model that is purely influenced by chance – leaving us only with the true outcome of the model. To make this easier, when you want to run a scenario to look at variability, you can use the “Trials” function. You do this, by selecting Run > Run Trial. You can then choose the number of trials you would like to run as well as the number of years you wish them to run for. The minimum number of trials you can run is 3. Scenario-Generator: powered by SIMUL8 - Simulation Software for Healthcare Improvement 37 Figure 32: Run Trial The High Level Display will then produce results which include confidence levels as can be seen below. The .csv file will also produce results with confidence limits. Figure 33: HLD for Trials For a more detailed comparison, select Results > Scenario Comparison and check the box compare trials. Then select all the trials you wish to compare. You will then be displayed with the below dialog which allows you to compare steps across all the trials you have run. It also gives you the confidence limits surrounding each step. Scenario-Generator: powered by SIMUL8 - Simulation Software for Healthcare Improvement 38 Figure 34: Scenario Comparison CAVEATS If you are running the tool just using the 5 generic pathways, you have already simplified a huge number of processes in your health and social system, so running tests of statistical significance will not necessarily give you a more accurate picture. It will be more helpful to you to vary the scenario you are running e.g. change the population number, alter the referral rate and then compare those results to understand the potential trend and range of possible outcomes. This is why you are given the option of varying the random seed, so that you can tell whether the changes in results are because of your scenario changes or because of random variation. If you are running the tool with a small population or with a single care pathway, then you can set it up to reflect processes much more accurately. It would then be useful to use the random seed to run tests of statistical significance. To ensure statistical significance you should use convergence theory to determine the number of times you run the scenario. However, if you are looking for this level of accuracy, you might be better using the SIMUL8 core product. On the whole it is expected for people to use Scenario Generator more to give comparative guidance rather than a completely accurate answer. If you would like to know more about stochastic variation and statistical significance, then contact SIMUL8 direct. Scenario-Generator: powered by SIMUL8 - Simulation Software for Healthcare Improvement 39 STEP 6: SETTING CAPACITY Once you have established the pathways for your health and social care economy and run them to look at the potential demand and cost to the economy over time. You can set the capacity of the system so that you can see where the constraints may lie. Note The Pathway Details file in Scenario Results tells you the maximum occupancy of each step when running a scenario with capacity disabled. This tells you what capacity you need for your scenario. In the Scenario Generator, capacity can be understood by the constraint placed on a particular step or set of steps. The constraint could be: Workforce – workload of a FTE Beds Equipment – e.g. for diagnostics or adaptations Using Advanced > Edit Capacities, you can add any resource which could act as a constraint on the capacity of a step by selecting Add Resource or edit any existing by double clicking them. Figure 35: Constrained resources When setting the resource you need to identify the number of FTEs or beds etc., the amount of activity they can be dealt with each week, the number of days and hours the resource is available and the number of “queues”. The queue numbers refer to the number of locations of the resource. For example, your system might have 100 GP practices (100 potential queues), but 340 FTE GPs, each of whom can deal with 140 consultations per week. This is understood as your total GP consultation capacity. Scenario-Generator: powered by SIMUL8 - Simulation Software for Healthcare Improvement 40 Figure 36: Edit Resource To associate a step with that resource, select the step on the pathway, choose capacity from step properties and then choose the relevant resource in the dialogue box. You may have also set categories of resource in which case you would select the category and then the required resource form that category. For example, if you want to understand how GP’s time is used, you should associate the relevant GP consultation step in each pathway with this resource – these could be named differently in different pathways, for example “initial appointment” in the maternity pathway would be a GP consultation resource. To run a pathway with capacity enabled, select Advanced > Capacity Options and choose Enable Capacity. Once enabled you should notice that all the symbols on steps with capacity that were previous crossed out, now have a “C” in them. Figure 37: Capacity Enabled As previously mentioned you can use wait steps before steps that are constrained to see the effect the resource has on queue size and wait time, refer back to Steps 3 and 5 if you need to remind yourself. Under the Preferences tab in the Scenario Management menu, you can also set the point at which you want the scenario to stop running if queues start to build up. When you have run a scenario with capacity enabled, a resources details file is created for you in My Documents\Scenarios\Scenario Results. This will show you more detail of how Scenario-Generator: powered by SIMUL8 - Simulation Software for Healthcare Improvement 41 the resource is being utilised across the system. The Scenario Results menu will also display results for time spent in the system or in a step. Resource Name A and E A and E A and E A and E A and E Number FTE Queue Resource Utilisation Average Maximum of Per Serving % in Use in Use Queues Week Queue 5 10 1 1 9.72098 0.09721 1 5 10 2 2 8.5996 0.17199 2 5 10 3 2 8.74127 0.17483 2 5 10 4 2 8.72727 0.17455 2 5 10 5 3 8.75766 0.26273 3 Figure 38: Resource Details File It is important when you are running your scenarios constrained that you remember to remove scaled population. Scaling the population clusters events together and enables the simulation to run much quicker. However this is unsuitable if you are running with capacity enabled as your resource will not deal with multiple events simultaneously. To turn this off select Scenario Management > Preferences > Run Preferences and deselect “Auto set scaling for faster run”. Results for resource Utilisation and a summary of where that resource is used is provided in the Step Properties Window. Simply click the Step Resource Utilisation and the results will be shown in window as you can see below. From here you can look at the results for all resources you have set by selecting them from the drop down menus. Figure 39: Resource Utilisation Scenario-Generator: powered by SIMUL8 - Simulation Software for Healthcare Improvement 42 Note The Scenario Generator will run more slowly with the capacity enabled if you record all time in step values. It will speed up if you only select individual steps to display the time in step. For more information on Capacity refer to Sections 3.1.7 and 8.12 of the User Guide. Scenario-Generator: powered by SIMUL8 - Simulation Software for Healthcare Improvement 43 EXERCISE 4 HEALTHCARE: USING CAPACITY In exercise 2 you looked at the financial impact of GP’s reducing referrals to outpatients and instead referring activity to GPwSI. Now you are going to consider the resource implications of doing this. Using the dermatology scenario you created, create a GP capacity of 9 GPs and 1 queue. You will be running this scenario with 1 GP practice. Ensure that this capacity is assigned to all the steps that need a GP, including the steps that are in the new dermatology pathway. In the dermatology pathway, create a new wait step between GPwSI and GPwSI follow up, this is to allow us to measure the queue build up. In the wait step you create you also want to record the “Time in Step”, remember this is set in the step properties window. Enter GP population J82007. Ensure your dermatology pathway is reset to the default scenario, that all the pathways are switched on and that auto scale is switched off. Enable the capacity, name your scenario “Dermatology with Capacity” and then run the scenario. Scenario-Generator: powered by SIMUL8 - Simulation Software for Healthcare Improvement 44 What is the utilisation of your GPs? How long are activities waiting? Are the GPs coping with this additional demand? Now save your scenario. Now, the system wants to send 10% of outpatient referrals for all other conditions to a primary care enhanced service. In the main planned pathway, set up the new service as follows: Allocate your GP resource to the primary care centre and run again. Can GPs still cope? How long are events waiting? Is this acceptable? Scenario-Generator: powered by SIMUL8 - Simulation Software for Healthcare Improvement 45 EXERCISE 4 SOCIAL CARE: USING CAPACITY In exercise 2 you looked at the financial impact of increasing the use of Telecare on social care costs. Now you are going to consider the social work resource implications of this scenario doing this. Using the Telecare scenario you created, create a social worker capacity of 5 social workers working in 3 teams (3 queues). Add a further social work assessment step before the traditional care package step, with a wait Assign your social work capacity to each step that needs a social worker, there are 3: social work assessment, joint visit with social worker, social work team assessment. Let’s say that each of the social worker steps require an hour of the social worker’s time (60 minutes, normal distribution) In the wait step before the social work is used you also need to record the “Time in Step”, remember this is set in the step properties window. Ensure your Telecare pathway is reset to the default scenario and that auto scale is switched off. Enable the capacity, name your scenario “Telecare with Capacity” and then run the scenario. What is the utilisation of your social workers? How long are activities waiting? Are the social workers coping with demand? Save your scenario. Now, there are local authority cuts and 2 social workers in the team take voluntary redundancy. Reduce the capacity available. Scenario-Generator: powered by SIMUL8 - Simulation Software for Healthcare Improvement 46 Can the 3 remaining social workers cope with demand? What is the impact on waiting times? Scenario-Generator: powered by SIMUL8 - Simulation Software for Healthcare Improvement 47 STEP 7: INTERPRETING RESULTS By now you will have created a range of scenarios to help to answer some of the questions you have about the impact of change on your system. Where possible try and validate results using other data sources, and then look for differences. The Scenario Generator is a demand-based model, and will sometimes produce different results from an activity-based model. For example, if your population is expected to increase by 8%, an activity-based model might increase activity by 8%. The Scenario Generator will increase the activity by a smaller percentage, reflecting that whilst a population may increase, not all of its members will necessarily use secondary care activities. Both results represent two possible scenarios for future demand. The results produced from Scenario Generator should be seen as indicating trend, rather than predictions. In particular, the costing methodology used will not equate to your specific budget, but you will be able to see the distribution of costs across the system in relation to activity which will give you an idea of the affordability of your scenario against projected budgets. The capacity function will also help you to see where the system needs more capacity in order to function and where queues will build up if capacity is not available. When you move from the High Level Display back to the pathway screen, you will see a series of green, amber and red dots which indicate where steps which have not processed all the events that have entered the step. On some steps you will also see a blue line denoting increasing occupancy of a step i.e. a positive difference in the number of events at the step. If you click on the relevant step, and go to the property window you will see a new line “Step results” has appeared. If you click on this, a graph will show you the activity relating to that step in graph form. Scenario-Generator: powered by SIMUL8 - Simulation Software for Healthcare Improvement 48 Figure 40: Step results If you have enabled the capacity, you will also get a “Step Resource Utilisation” option, which will show you how much capacity of the resource is being used and where. Using the Scenario Generator should help you to: Test your assumptions See any unintended consequences of a plan Ask better questions Scenario-Generator: powered by SIMUL8 - Simulation Software for Healthcare Improvement 49 USING THE TOOL You need to decide how to use the tool with your local health and/or social care economy. From work undertaken to date, the team would recommend the following: 1. Define the question you want to answer 2. Involve key stakeholders in this, and determine the kinds of scenarios you are wanting to test Configure the tool to reflect your local population You will need a data analyst to support this work, as well as public health input on demographics and prevalence) 3. Set up new pathways/scenarios that you will want to test 4. Run the Scenario Generator at events with key stakeholders to produce results which can help inform the discussions and subsequent decisions SUPPORT As development on Scenario Generator continues, there will be new releases which should be installed on your computer. Existing scenarios are compatible with the new releases. To discuss progress and share pathways with other users you are invited to join the User Community. This can be reached via the following link; www.scenario-generator.com You can share pathways using the Import and Export Pathway link in the Structure menu The User Guide can be accessed under the Help menu and gives more detail on the functionality of the tool For further support with the tool, contact [email protected] Scenario-Generator: powered by SIMUL8 - Simulation Software for Healthcare Improvement 50 NOTES Scenario-Generator: powered by SIMUL8 - Simulation Software for Healthcare Improvement 51