1
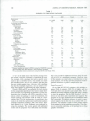
NEW BOOKS IN REVIEW
RESELLER ASSORTMENT DECISION CRITERIA,
Jerker Nilsson and Viggo Host. Aarhus, Denmark:
Aarhus University Press, 1987, 176 pages.
This softcover book contains an extremely detailed study
of the relative importance of criteria used in reseller assortment decisions. As the authors state in the Preface,
"The literature on reseller assortment decision criteria
. . . consists mainly of descriptions of what criteria have
been used in single reseller companies on certain occasions. What is lacking are explanations of how the resellers' criteria are related to the various situational factors." Their study seeks to remedy these shortcomings
by focusing on situational factors ^ a t can affect the use
of certain classes of decision criteria. The chapters are
logically laid out with a preceding outline or introduction
to each and an alphanumeric paragraph numbering system. A Summary chapter is provided at the beginning
for readers not willing to work their way through the
following five chapters. The study is written in a joumal
article style that probably will not appeal to practitioners.
Chapter 1, Problem, is a detailed, dissertation-quality,
theoretical introduction to assortment decisions. The perspective is primarily that of the reseller, but all channel
levels are discussed. Chapter 2, Literature Survey, continues the theoretical discussion with an extremely thorough review of the reseller assortment decision literature. Chapter 2 is continued in Appendix B, where 34
studies containing assortment decision criteria lists are
reviewed in detail. Chapters 1 and 2 (plus the continuation of Chapter 2 in Appendix B) and the Bibliography
fill 87 of the book's 176 pages. The theoretical discussion and literature review alone are worth the purchase
price to any academician or graduate student researching
reseller assortment decision criteria.
Chapter 3, Empirical Bases, is a description of the data
used in the study. The data were collected from a very
large, vertically integrated organization of Swedish consumer cooperatives in 1975. The cooperative organization included more than 2300 retail outlets of several different types with a total assortment of more than 5000
items. The latter part of Chapter 3 includes the data collection instruments and procedures, as well as the variable specifications. Chapter 4 is the Statistical Analysis
chapter. Multiple logit regression analysis was used to
analyze the data because of the binary nature of dependent variables. This chapter includes a brief discussion
of the logit model, selection of the explanatory variables, and goodness-of-fit measures. A more detailed
matrix algebra description of binary choice models is
contained in Appendix A. Chapter 5, Findings, describes the results of the data analysis in terms of both
the seven decision categories and the 14 decision criteria
studied. Conclusions are presented at the end of this
chapter.
This study is very well done, but it does not seem to
be aimed at any particular market other than research
129
academicians and graduate students interested in reseller
assortment decisions. The chief value of this book will
be as a literature review and as an excellent example of
how to organize and conduct dissertation-level research
on a very large, complex database. The study represents
an application of one particular method to one very focused marketing management decision area. The empirical results are probably not generaiizable to U.S. markets given the social and economic system from which
the data were collected. This lack of generalizability, and
the authors' dissertation style of writing, will probably
preclude the book from appealing to practitioner markets.
GEORGE C . HOZIER, JR.
University of New Mexico
SMARTFORECASTS II, Smart Software, Inc., Belmont, MA 02178.
FORECAST PLUS, Walonick Associates, 6500 Nicollet
Avenue South, Minneapolis, MN 55423.
SPSS/PC+ TRENDS, SPSS Inc., 444 N. Michigan
Avenue, Chicago, IL 60611.
FORECAST MASTER, Scientific Systems, 35 Cambridge Park Drive, Cambridge, MA 02140.
FOUR TIME SERIES ANALYSIS PACKAGES
Four packages for analyzing time series data on PCs
are reviewed here: SmartForecasts II (SMII), Forecast
Plus (FP), SPSS/PC+ Trends (Trends), and Forecast
Master (FM). The discussion follows the steps suggested
by Box and Jenkins (1976): identification, estimation,
and diagnosis. Identification is applied to the historical
series with the objective of tentatively determining an
appropriate model. Estimation refers to the task of estimating model parameters. Diagnosis is applied to the
series of residuals with the aim of determining the appropriateness of the tentative model. The process is iterated as necessary.
The capabilities of the packages in these respective
areas are reported in Table 1. In this table, the term "diagnosis" differs somewhat from the its usage by Box and
Jenkins. It refers to a set of tools—such as time plots
or autocovariance function plots—that can be used to
determine the sorts of models that might be appropriate
for a series. "Preprocessing" refers to transformations
that might be applied to a series to make it amenable to
a particular estimation technique. For example, preprocessing might be done to a nonstationary series to make
it stationary. Trends, seasonality, and varying autocorrelations result in nonstationary series. Many useful tools
and techniques—such as the autocorrelation and crosscorrelation functions, simple exponential smoothing, and
ARIMA models—assume that the series is stationary (i.e.,
the mean and variance of the series are independent of
time).
JOURNAL OF MARKETING RESEARCH, FEBRUARY 1989
130
Table 1
OVERVIEW OF FORECASTING PACKAGES
FM
Requirements
RAM
512-640K
Coprocessor support
Yes
Forecasting step identification
Model diagnosis
Plotting series
Yes
Raw series
Yes
Smoothed series
No
Box plots
Yes
Autocorrelations
Cross-correlations
No
Preprocessing
Lead and lags
Yes
Dummy variables
No
Differencing
Simple
Yes
Seasonal
Yes
Log transform
Yes
Component decomposition
Yes
Estimation
Univariate
Curve fitting
Yes
Exponential smoothing
Simple
Yes
Yes
2-parameter (Holt)
Yes
3-parameter (Winter)
Yes
Box-Jenkins
Multivariate
No
Spectral analysis
Regression
Yes
OLS
WLS
No
Two-stage
Yes
State space models
Yes
Vector autoregression
"Dummy variables are created in SPSS by using the COMPUTE command.
*The FP package does offer Harrison's (1967) harmonic smoothing.
'FM accommodates hetereoscedasUcity by using the ARCH model (Engle 1982).
A "no" in the table means only that the package does
not include a specific command to implement the step.
For example, with a package that lacks a specific command to plot a smoothed series, one usually can create
the smoothed series, save it as a variable, and then plot
the new variable against time. Likewise, with a package
that has OLS multiple regression, one can achieve twostage least squares by performing the steps separately.
Overall, SMII and FP are probably the best choices
for the nonspecialist practitioner who wants to make shortterm forecasts in an operating environment. For the academician who is familiar with SPSS, especially at institutions where the package is used for instruction, the
Trends package and manual could be used in a forecasting class. For the academician or practitioner who
wants to do relatively sophisticated multivariate analysis
(multiple dependent variables). FM is the choice. Standard datasets (e.g., Lydia Pinkham) were analyzed by
using the packages. The results agreed with published
results and the programs were sufficiently user friendly
SMII
Trends
FP
2S6K
7
640K
192K
Yes
t
Yi»
Yes
Yes
•m
¥(•
Yes
Yes
Yes
Yes
No
YM
Yes
Yes
Ye» .
Y«t
Yes
Yes
Ym
Yes
Yes
Yes
Yes
Yes
Yes
Yes
Linear
Yes
Tft»
No
YM
Yes
Yes
Yes
Yes
No
Bivartate
No'
y«i
Yes
Yes
No
No
Yet
1^
No
No
Yes
No
No
No
Yes
Yes
Yes
Yet
Y«
that a user would be indifferent between doing the analysis on a PC or a mainframe computer. However, none
of the manuals can stand alone as introduction to time
series analysis, nor do they provide particularly well-organized references to guide a nonspecialist user.
SmartForecasts II
On an IBM PC/XT/AT computer, this package requires 256K of memory, DOS 2.0 or higher, and two
5.25-inch drives (or one drive and a hard disk). Sevenhundred and twenty kilobytes of hard disk space is needed
to store the programs. For the IBM System/2, two 3.5
drives (or one drive and a hard disk) are required. The
program is not copy protected and an installation batch
file is provided. No explicit reference is made to coprocessor support, but it does run on a system with a coprocessor. No mention is made of laser printer support
in the manual or in the installation procedure. This omission is somewhat surprising, as the package has a strong
graphics orientation.
NEW BOOKS IN REVIEW
A single SFII datafile can accommodate up to 60 variables with up to 150 observations per variable. Data entry can be from the keyboard, using a spreadsheet format, or data can be read from (and written to) files stored
in SFII, Lotus, DIF, or ASCII formats. In the spreadsheet format, titles, colunin (variable) labels, and row
(case) labels can be added to the datafile. The spreadsheet structure applies only to data entry; however, new
variables are not created with cell formulas, but by specifying an operation or a formula on a command line.
Useful operation commands include dummy variable
creation (primarily for seasons), differencing, percentage changes, cumulative totals, and leads/lags of variables. SFII's characterization of time series is limited to
year, quarter, monthly (etc.) structures; it does not provide for nonuniform trading days, traditional and special
holidays, and the like.
The screens are well designed and make excellent use
of a color monitor. The program expects a minimal response to a command line and then it prompts for additional information as required. For example, the command for regression analysis requires only that the
dependent variable be specified. The program then
prompts for the independent variables, their seasonality,
and so forth. Context-sensitive help screens are provided.
This package has two distinguishing characteristics.
At one extreme, it provides the ability to forecast by
simply "eyeballing" the data. Thus, the forecaster can
view a plot of the historical data and the results of two
naive forecasting rules (a linear function of all data and
"no change" from last). These can be replaced with other
naive rules (such as constant percentage change). In addition, the forecaster can move the position of a forecast
on the screen and a new set of forecasts will be calculated.
At the other extreme, the forecaster can have the program conduct a "tournament" among a set of procedures
and determine the procedure that does the best job of
fitting a set of historical data. Though very convenient
and relatively speedy, the risks of capitalizing on chance
with such "data crunching" can hardly be ignored. This
problem is not emphasized in the manual. The program
has the capability for aggregating up to 60 series and
then automatically determining the "best" forecasting
procedure for the total (and its components). This procedure would be handy, for example, for forecasting the
sales of shoes of different sizes and widths or deposits
of different kinds in bank branches. However, little
guidance is given as to whether the component series
should first be transformed to stationarity before aggregation. If they are not, a forecaster may be tempted to
apply the automatically determined optimal procedure
for the total to a component for which it is patently inappropriate.
The forecasting tools offered by SFII are at the low
end of the sophistication scale. This level may be consistent with its positioning, which seems to be for series
131
having relatively few cases. This package has the potential of requiring the least mental and physical labor
from a forecaster. It is particularly suited for rapidly and
efficiently analyzing large numbers of relatively short (less
than 150 cases) series. The package is less attractive for
forecasters who want full understanding and control of
a sophisticated analysis of a possibly complex series.
Forecast Plus
Separate versions of the package are available for IBM
PC/XT/AT machines that do and do not have math coprocessors. It is not copy protected. Data are stored in
comma-delimited ASCII files, though DIF files can be
read and written.
Either single or multiple variable flies can be created.
Multiple variable files can contain up to 30 variables.
Year, month, day, or "numbered" labels must be specified for each variable. Missing values are estimated by
linear interpolation. All of the functions and arithmetic/
logical operators of BASIC are available by using an
SPSS-like command structure (i.e., SELECT, RECODE, COMPUTE, etc.).
The package offers relatively sophisticated trading-day
adjustment capability. Nine U.S.A. holidays are part of
the default adjustment table. Up to 24 holidays can be
entered. The user can specify whether the holiday occurs
always on a fixed day, such as July 4th, or on a fixed
day of the week, such as Labor Day; furthermore, one
can specify whether the adjacent day is also a nontrading
day (e.g., if a holiday occurs on a Saturday, the previous
Friday may be a nontrading day).
In addition to the diagnostic plots listed in Table 1,
seasonal box plots and a spread versus level are available. The latter has options for evaluating six variancestabilizing transformations on the fly. FP has the least
satisfactory screen graphics of the four packages, primarily because many of the graphs do not fit within a
single screen and the user must scroll to see the entire
graph. In fact, the default output for FP is the printer;
the only trouble encountered in installing the program
was figuring out that the default option had to be changed
to get any screen output at all. If the printer has continuous-sheet paper, large graphs covering several pages
can be printed. For large series, the diagnostic detail these
reveal is worth the time it takes for them to print.
FP provides an extensive set of smoothing algorithms,
including an adaptive filtering algorithm not listed in Table 1, ARIMA models implemented in the standard BoxJenkins framework, and multiple regression. However,
the last does not provide procedures for handling autocorrelation and heteroscedasticity, such as Cochrane-Orcutt or WLS.
SPSS/PC + Trends
''
- ' •
Trends for SPSS/PC+ is a five-disk add-on for the
SPSS/PC+ statistical series. It can be used as a standalone package, but that would entail leaming the SPSS
command language structure in order to use the Trend
132
package. The user may also want to consider a version
of Microsoft CHART as an add-on to get high quality
graphics. The set will require 10 megabytes of hard disk
space, a coprocessor, and 640K of RAM. For this overhead, the forecaster gets a comprehensive univariate
forecasting package that gives considerable control over
the application of sophisticated estimation procedures.
For example, the ARIMA command uses a maximum
likelihood procedure to model a dependent series with
or without the inclusion of independent regressors. The
procedure can accommodate missing data in the series.
Trend includes a missing data estimation command that
estimates missing values by using linear trend, the mean
or median of surrounding values, the mean or median of
the series, or linear trend at the point. The CREATE
command will create series that are a function of existing
series, including smoothed series based on the Fast Fourier Transform, moving averages, and the T4253H function (Velleman and Hoagling 1981). The NPPLOT command displays normal probability plots of the residual.
Most of the estimation procedures include subcommands
for performing log, differencing, and other transformations on the fly.
Trend's manual has the most professional appearance
and it is the only one that could stand double duty as a
supplemental text in a course. Each of the estimation
tools in the package is discussed in the context of a problem. For example, data on the ozone layer are analyzed
to demonstrate the handling of missing data and the use
of WLS to analyze data in which observations are measured with equal accuracy.
Forecast Master
Forecast Master is the only one of the four packages
that has a substantial multivariate capability. Multivariate procedures are state space forecasting and Bayesian
vector autoregression. The package can work with or
without a math coprocessor, but it is desirable to have
one. Installation on a hard disk system consists of creating a subdirectory, copying all of the disks to the subdirectory, running an INTSTALL.BAT batch file, and
answering the questions that appear on the screen. Commands are written to existing config.sys and autoexec.bat files. If problems arise in running other packages, examine these files to make sure the inserted
commands are not a problem. Once installed, the program is invoked by running the MASTER.BAT batch
program.
The program can be run on a two-drive (or one-drive
hard disk) system. However, a hard disk is even more
desirable than it is for most multiple-package programs.
A characteristic of this package is that numerous small
files are likely to proliferate. First, all series initially are
entered as univariate series stored in ASCII files (a maximum of 2000 observations can be included in a single
series). Associated with each of these series is a "KEY"
file that names the series and describes its calendar characteristics, such as number of periods, starting date, and
JOURNAL O f MARKETING RESEARCH, FEBRUARY 1989
periods per year. Second, each analysis must be preceded by a step in which the variables to be analyzed
are selected. Leads and lags of variables are specified at
this stage, as are created variables, a constant, and some
user-specified transformations. This specification is saved
in a file that is accessed subsequently by the selected
analytic program. Academic forecasters are likely to want
to try different transformations, lags, variables, and so
on and probably would create a file for each analysis.
Finally, the user has the option of creating an audit trail
of all the steps in a forecasting session. This trail is stored
in a file and can be used to reconstruct all the steps that
were performed to create a forecast. It is easy to see that
an active forecaster, especially an academician, could
create a plethora of small files on the storage disk.
The program requires 512K of memory. More memory is preferable because the package relies on extemal
editors to edit datafiles. Though the DOS EDLIN program will fit in 512K, the manual says that memory
problems have been encountered in using some editors
or attempting to run some jirograms under the DOS shell.
With 640K I had no problem using WORD as the editor
or running 1-2-3 under the DOS shell (the shell allows
one to exit the forecasting program, run another program
under DOS, and then reenter the forecasting program at
the point of exit). Being able to exit to a spreadsheet
program is handy because the data transformation capabilities of Forecast Master are limited to exponents,
logs, and arithmetic operations. They do not include
trigonometric functions, dummy variable creation, logical operators, "select i f type operators, and the like.
It was reasonably convenient to use Lotus 1-2-3 to create
complex transformations.
The state space forecasting can accommodate up to 10
endogenous and exogenous variables to forecast multiple
dependent variables simultaneously using a Kalman filterlike recursion algorithm (Akaike 1974, 1976). The
Bayesian vector autoregression is the Litterman (1981)
VAR model (which appears in the RATS package). The
FM package also includes a varying parameter regression program applicable to regression situations in which
the coefficients are time varying, either deterministically
or stochastically (Rosenberg 1973).
JAMES B . WILEY
Temple University
REFERENCES
Akaike, H. (1974), "A New Look at Statistical Model Identification," IEEE Transactions in Automatic Control, AC19, 6, 716-23.
(1976), "Canonical Correlation Analysis and Information Criterion," in System Identification: Advances arui
Case Studies, Metira and Lainiotis, eds. New York: Academic Press, Inc.
Box, G. E. P. and G. M. Jenkens (1976), Time Series Analysis, Forecasting and Control. San Francisco: Holden-Day.
Engle, R. F. (1982), "Autoregressive Condilional Heteroscedasticity with Estimates of the Variance of United Kingdom
Inflation," Econometrica. 50, 987-1007.
NEW BOOKS IN REVIEW
133
Hatrison, P. J. (1967), "Exponential Smoothing and ShortTerm Sales Forecasting," Management Science. 13 (11), 82142.
Litterman. R. B. (1981), RATS User's Manual, Version 4.1.
Minneapolis: VAR Econometrics.
Rosenberg. B. (1973), "The Analysis of a Cross Section of
Time Series by Stochastically Convergent Parameter
Regression." Annals of Economic and Social Measurement,
2, 399-428.
Velleman, P. F. and D. C. Hoagling (1981), Applications,
Basics, and Computing of Exploratory Data Analysis. Boston: Duxbury Press.
Kelly, Janice R. and Joseph E. McGrath. On Time and Method.
Newbury Park. CA: Sage Publieations. Inc.. 1988.
Kinunel. Allan J., Ethics and Values in Applied Social Research.
Newbury Park. CA: Sage Publications. Inc.. 1988.
Krueger. Richard A.. Focus Groups: A Practical Guide for Applied
Research. Newbury Park. CA: Sage Publications. Inc.. 1988.
Maynes. E. Scott, ed.. The Frontier of Research in the Consumer
Interest. Columbia, MO: American Council on Consumer
Interests. 1988.
McCracken, Grant, Culture and Consumption. Bloomington, IN:
Indiana University Press. 1988.
Wittink, Dick R., The Application of Regression Analysis.
Needham Heights, MA: Allyn and Bacon, Inc., 1988.
BOOKS AND SOFTWARE RECEIVED
Software
Books
Devinney, Timothy M., ed., Issttes in Pricing: Theory and
Research. Lexington. MA: Lexington Bcxiks. 1988.
Ehrenberg, A. S. C , Repeat-Buying. 2nd ed. New York: Oxford
University Press. 1988.
Grady. Kathleen E. and Barbara Stnidler Wallston. Research in
Health Care Settings. Newbury Park, CA: Sage Publieations.
Inc.. 1988.
•
1-2-3, Version 2.01, Lotus Development CcHporadon, Cambridge,
MA. 1986.
MARKUPS, Version 1.1, McGraw-Hill Book Company. New
York. i988.
JMR26I1I0
of Marketing
J
ournal
VUftNAL OF MARKETING Published in January. April, July, and October,
this journal contains articles furnishing information on marketing discoveries, techniques, trends, and new ideas that contribute substantive findings
and demonstrate vrorkable solutions to today's marketing problems.
Joumal of Marketing is available for individual as well as corporate (library,
school, business, etc.) use.
'Rates subject to change
Journal of Marketing
AMA Members
No n members
Corporate
$28
$56
$90
Copies may be purchased on an individual basis as well as on
an annual subscription basis.
For subscription information, contact:
The American Marketing Association • Subscriptions Department
250 S. Wacker Dr.. Suite 200 • Chicago, IL 60606-5819
,. .
or call 312/648-0536.
AV1ERIC/1N
/VMRKETING