1
To our customers,
Old Company Name in Catalogs and Other Documents
On April 1st, 2010, NEC Electronics Corporation merged with Renesas Technology
Corporation, and Renesas Electronics Corporation took over all the business of both
companies. Therefore, although the old company name remains in this document, it is a valid
Renesas Electronics document. We appreciate your understanding.
Renesas Electronics website: http://www.renesas.com
April 1st, 2010
Renesas Electronics Corporation
Issued by: Renesas Electronics Corporation (http://www.renesas.com)
Send any inquiries to http://www.renesas.com/inquiry.
Notice
1.
2.
3.
4.
5.
6.
7.
All information included in this document is current as of the date this document is issued. Such information, however, is
subject to change without any prior notice. Before purchasing or using any Renesas Electronics products listed herein, please
confirm the latest product information with a Renesas Electronics sales office. Also, please pay regular and careful attention to
additional and different information to be disclosed by Renesas Electronics such as that disclosed through our website.
Renesas Electronics does not assume any liability for infringement of patents, copyrights, or other intellectual property rights
of third parties by or arising from the use of Renesas Electronics products or technical information described in this document.
No license, express, implied or otherwise, is granted hereby under any patents, copyrights or other intellectual property rights
of Renesas Electronics or others.
You should not alter, modify, copy, or otherwise misappropriate any Renesas Electronics product, whether in whole or in part.
Descriptions of circuits, software and other related information in this document are provided only to illustrate the operation of
semiconductor products and application examples. You are fully responsible for the incorporation of these circuits, software,
and information in the design of your equipment. Renesas Electronics assumes no responsibility for any losses incurred by
you or third parties arising from the use of these circuits, software, or information.
When exporting the products or technology described in this document, you should comply with the applicable export control
laws and regulations and follow the procedures required by such laws and regulations. You should not use Renesas
Electronics products or the technology described in this document for any purpose relating to military applications or use by
the military, including but not limited to the development of weapons of mass destruction. Renesas Electronics products and
technology may not be used for or incorporated into any products or systems whose manufacture, use, or sale is prohibited
under any applicable domestic or foreign laws or regulations.
Renesas Electronics has used reasonable care in preparing the information included in this document, but Renesas Electronics
does not warrant that such information is error free. Renesas Electronics assumes no liability whatsoever for any damages
incurred by you resulting from errors in or omissions from the information included herein.
Renesas Electronics products are classified according to the following three quality grades: “Standard”, “High Quality”, and
“Specific”. The recommended applications for each Renesas Electronics product depends on the product’s quality grade, as
indicated below. You must check the quality grade of each Renesas Electronics product before using it in a particular
application. You may not use any Renesas Electronics product for any application categorized as “Specific” without the prior
written consent of Renesas Electronics. Further, you may not use any Renesas Electronics product for any application for
which it is not intended without the prior written consent of Renesas Electronics. Renesas Electronics shall not be in any way
liable for any damages or losses incurred by you or third parties arising from the use of any Renesas Electronics product for an
application categorized as “Specific” or for which the product is not intended where you have failed to obtain the prior written
consent of Renesas Electronics. The quality grade of each Renesas Electronics product is “Standard” unless otherwise
expressly specified in a Renesas Electronics data sheets or data books, etc.
“Standard”:
8.
9.
10.
11.
12.
Computers; office equipment; communications equipment; test and measurement equipment; audio and visual
equipment; home electronic appliances; machine tools; personal electronic equipment; and industrial robots.
“High Quality”: Transportation equipment (automobiles, trains, ships, etc.); traffic control systems; anti-disaster systems; anticrime systems; safety equipment; and medical equipment not specifically designed for life support.
“Specific”:
Aircraft; aerospace equipment; submersible repeaters; nuclear reactor control systems; medical equipment or
systems for life support (e.g. artificial life support devices or systems), surgical implantations, or healthcare
intervention (e.g. excision, etc.), and any other applications or purposes that pose a direct threat to human life.
You should use the Renesas Electronics products described in this document within the range specified by Renesas Electronics,
especially with respect to the maximum rating, operating supply voltage range, movement power voltage range, heat radiation
characteristics, installation and other product characteristics. Renesas Electronics shall have no liability for malfunctions or
damages arising out of the use of Renesas Electronics products beyond such specified ranges.
Although Renesas Electronics endeavors to improve the quality and reliability of its products, semiconductor products have
specific characteristics such as the occurrence of failure at a certain rate and malfunctions under certain use conditions. Further,
Renesas Electronics products are not subject to radiation resistance design. Please be sure to implement safety measures to
guard them against the possibility of physical injury, and injury or damage caused by fire in the event of the failure of a
Renesas Electronics product, such as safety design for hardware and software including but not limited to redundancy, fire
control and malfunction prevention, appropriate treatment for aging degradation or any other appropriate measures. Because
the evaluation of microcomputer software alone is very difficult, please evaluate the safety of the final products or system
manufactured by you.
Please contact a Renesas Electronics sales office for details as to environmental matters such as the environmental
compatibility of each Renesas Electronics product. Please use Renesas Electronics products in compliance with all applicable
laws and regulations that regulate the inclusion or use of controlled substances, including without limitation, the EU RoHS
Directive. Renesas Electronics assumes no liability for damages or losses occurring as a result of your noncompliance with
applicable laws and regulations.
This document may not be reproduced or duplicated, in any form, in whole or in part, without prior written consent of Renesas
Electronics.
Please contact a Renesas Electronics sales office if you have any questions regarding the information contained in this
document or Renesas Electronics products, or if you have any other inquiries.
(Note 1) “Renesas Electronics” as used in this document means Renesas Electronics Corporation and also includes its majorityowned subsidiaries.
(Note 2) “Renesas Electronics product(s)” means any product developed or manufactured by or for Renesas Electronics.
User’s Manual
SuperH™ RISC engine
Simulator/Debugger
User’s Manual
Renesas Microcomputer
Development Environment
System
Rev.4.00 2007.07
Notes regarding these materials
1. This document is provided for reference purposes only so that Renesas customers may select the appropriate
Renesas products for their use. Renesas neither makes warranties or representations with respect to the
accuracy or completeness of the information contained in this document nor grants any license to any
intellectual property rights or any other rights of Renesas or any third party with respect to the information in
this document.
2. Renesas shall have no liability for damages or infringement of any intellectual property or other rights arising
out of the use of any information in this document, including, but not limited to, product data, diagrams, charts,
programs, algorithms, and application circuit examples.
3. You should not use the products or the technology described in this document for the purpose of military
applications such as the development of weapons of mass destruction or for the purpose of any other military
use. When exporting the products or technology described herein, you should follow the applicable export
control laws and regulations, and procedures required by such laws and regulations.
4. All information included in this document such as product data, diagrams, charts, programs, algorithms, and
application circuit examples, is current as of the date this document is issued. Such information, however, is
subject to change without any prior notice. Before purchasing or using any Renesas products listed in this
document, please confirm the latest product information with a Renesas sales office. Also, please pay regular
and careful attention to additional and different information to be disclosed by Renesas such as that disclosed
through our website. (http://www.renesas.com )
5. Renesas has used reasonable care in compiling the information included in this document, but Renesas
assumes no liability whatsoever for any damages incurred as a result of errors or omissions in the information
included in this document.
6. When using or otherwise relying on the information in this document, you should evaluate the information in
light of the total system before deciding about the applicability of such information to the intended application.
Renesas makes no representations, warranties or guaranties regarding the suitability of its products for any
particular application and specifically disclaims any liability arising out of the application and use of the
information in this document or Renesas products.
7. With the exception of products specified by Renesas as suitable for automobile applications, Renesas
products are not designed, manufactured or tested for applications or otherwise in systems the failure or
malfunction of which may cause a direct threat to human life or create a risk of human injury or which require
especially high quality and reliability such as safety systems, or equipment or systems for transportation and
traffic, healthcare, combustion control, aerospace and aeronautics, nuclear power, or undersea communication
transmission. If you are considering the use of our products for such purposes, please contact a Renesas
sales office beforehand. Renesas shall have no liability for damages arising out of the uses set forth above.
8. Notwithstanding the preceding paragraph, you should not use Renesas products for the purposes listed below:
(1) artificial life support devices or systems
(2) surgical implantations
(3) healthcare intervention (e.g., excision, administration of medication, etc.)
(4) any other purposes that pose a direct threat to human life
Renesas shall have no liability for damages arising out of the uses set forth in the above and purchasers who
elect to use Renesas products in any of the foregoing applications shall indemnify and hold harmless Renesas
Technology Corp., its affiliated companies and their officers, directors, and employees against any and all
damages arising out of such applications.
9. You should use the products described herein within the range specified by Renesas, especially with respect
to the maximum rating, operating supply voltage range, movement power voltage range, heat radiation
characteristics, installation and other product characteristics. Renesas shall have no liability for malfunctions or
damages arising out of the use of Renesas products beyond such specified ranges.
10. Although Renesas endeavors to improve the quality and reliability of its products, IC products have specific
characteristics such as the occurrence of failure at a certain rate and malfunctions under certain use
conditions. Please be sure to implement safety measures to guard against the possibility of physical injury, and
injury or damage caused by fire in the event of the failure of a Renesas product, such as safety design for
hardware and software including but not limited to redundancy, fire control and malfunction prevention,
appropriate treatment for aging degradation or any other applicable measures. Among others, since the
evaluation of microcomputer software alone is very difficult, please evaluate the safety of the final products or
system manufactured by you.
11. In case Renesas products listed in this document are detached from the products to which the Renesas
products are attached or affixed, the risk of accident such as swallowing by infants and small children is very
high. You should implement safety measures so that Renesas products may not be easily detached from your
products. Renesas shall have no liability for damages arising out of such detachment.
12. This document may not be reproduced or duplicated, in any form, in whole or in part, without prior written
approval from Renesas.
13. Please contact a Renesas sales office if you have any questions regarding the information contained in this
document, Renesas semiconductor products, or if you have any other inquiries.
Trademarks
Microsoft, MS-DOS, Windows, Windows NT are registered trademarks of Microsoft Corporation.
Visual SourceSafe is a trademark of Microsoft Corporation.
IBM is a registered trademark of International Business Machines Corporation.
All brand or product names used in this manual are trademarks or registered trademarks of their
respective companies or organizations.
Document Information
Product Code:
Version:
S32HEWM
Copyright © Renesas Technology Corp. 2003. All rights reserved.
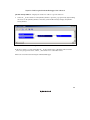
About This Manual
This manual describes the HEW system. This manual is composed of two parts. HEW part
describes information on the basic “look and feel” of the HEW and customizing the HEW
environment and detail the build. Figure in the HEW part are those of the SH series.
Simulator/Debugger part describes Debugger functions of the High-performance Embedded
Workshop.
This manual does not intend to explain how to write C/C++ or assembly language programs, how
to use any particular operating system or how best to tailor code for the individual devices. These
issues are left to the respective manuals.
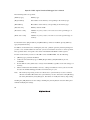
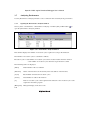
Document Conventions
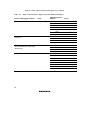
This manual uses the following typographic conventions:
Table 1
Typographic Conventions
Convention
Meaning
[Menu->Menu Option]
Bold text with ‘->’ is used to indicate menu options
(for example, [File->Save As...]).
FILENAME.C
Uppercase names are used to indicate filenames.
“enter this string”
Used to indicate text that must be entered (excluding the “” quotes).
Key + Key
Used to indicate required key presses. For example, CTRL+N means
press the CTRL key and then, whilst holding the CTRL key down,
press the N key.
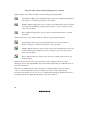
(The “how to” symbol)
When this symbol is used, it is always located in the left hand margin.
It indicates that the text to its immediate right is describing “how to”
do something.
Contents
Section 1 Overview............................................................................................1
Section 2 Simulator/Debugger Functions ..........................................................3
2.1
2.2
2.3
2.4
2.5
2.6
2.7
2.8
2.9
2.10
2.11
2.12
2.13
2.14
2.15
2.16
2.17
2.18
2.19
2.20
2.21
Features............................................................................................................................. 3
Target User Program......................................................................................................... 3
Range of Simulation ......................................................................................................... 4
Functions Supported by SH-4 Series ................................................................................ 7
2.4.1 Bus State Controller (BSC).................................................................................. 7
2.4.2 Direct Memory Access Controller (DMAC)........................................................ 8
External/Internal Clock Ratio ........................................................................................... 9
Endian ............................................................................................................................... 9
Memory Management Unit (MMU) ................................................................................. 10
Cache ................................................................................................................................ 12
2.8.1 Displaying Cache Contents.................................................................................. 12
2.8.2 Cache Hit Rate ..................................................................................................... 18
Timer................................................................................................................................. 19
2.9.1 Supported Range.................................................................................................. 19
2.9.2 Control Registers ................................................................................................. 19
2.9.3 Clocks .................................................................................................................. 21
2.9.4 Using a Timer ...................................................................................................... 21
2.9.5 Notes on Using a Timer ....................................................................................... 22
Control Registers .............................................................................................................. 23
Pipeline Reset Processing ................................................................................................. 25
Exception Processing ........................................................................................................ 26
Memory Management....................................................................................................... 28
Trace ................................................................................................................................. 29
Standard I/O and File I/O Processing................................................................................ 30
Break Conditions .............................................................................................................. 31
Floating-Point Data........................................................................................................... 35
Display of Function Call History ...................................................................................... 36
Performance Measurement ............................................................................................... 37
2.19.1 Profiler ................................................................................................................. 37
2.19.2 Performance Analysis .......................................................................................... 37
Pseudo-Interrupts .............................................................................................................. 38
Coverage ........................................................................................................................... 39
i
Section 3 Debugging .........................................................................................41
3.1
3.2
3.3
3.4
3.5
3.6
ii
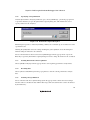
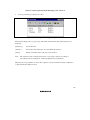
Creating the Workspace for Simulator/Debugger............................................................. 42
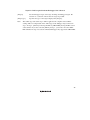
3.1.1 Selecting a Debugging Platform .......................................................................... 42
3.1.2 Setting up a Workspace for the Simulator/Debugger .......................................... 44
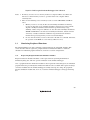
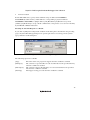
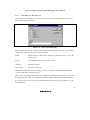
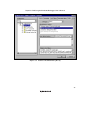
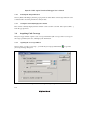
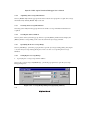
Modifying the Simulator/Debugger Settings .................................................................... 46
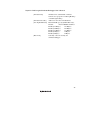
3.2.1 Modifying the Simulator System ......................................................................... 46
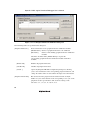
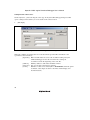
3.2.2 Modifying the Memory Map and Memory Resource Settings ............................ 49
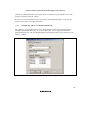
3.2.3 Set Memory Map Dialog Box.............................................................................. 53
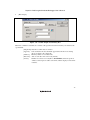
3.2.4 Set State Dialog Box............................................................................................ 55
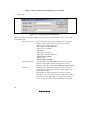
3.2.5 Set Memory Resource Dialog Box ...................................................................... 58
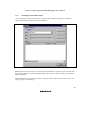
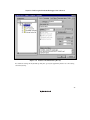
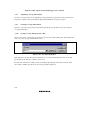
Simulating Peripheral Functions....................................................................................... 59
3.3.1 Registering Peripheral Function Simulation Modules ......................................... 59
3.3.2 Changing the Addresses of Peripheral Functions ................................................ 61
3.3.3 Changing the Interrupt Source Information of Peripheral Functions................... 63
3.3.4 Changing the Address of the Bank Control Register (SH2A-FPU Only) ............ 65
3.3.5 Allocating Memory Resources to the Interrupt Priority Register ........................ 65
3.3.6 Viewing the Names of Connected Peripheral Functions ..................................... 65
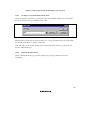
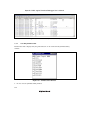
Using the Simulator/Debugger Breakpoints ..................................................................... 66
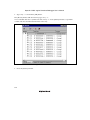
3.4.1 Listing the Breakpoints........................................................................................ 66
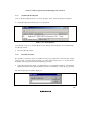
3.4.2 Setting a Breakpoint............................................................................................. 68
3.4.3 Modifying Breakpoints ........................................................................................ 79
3.4.4 Enabling a Breakpoint ......................................................................................... 79
3.4.5 Disabling a Breakpoint ........................................................................................ 79
3.4.6 Deleting a Breakpoint .......................................................................................... 79
3.4.7 Deleting All Breakpoints ..................................................................................... 79
3.4.8 Viewing the Source Line for a Breakpoint .......................................................... 80
3.4.9 Closing Input or Output File................................................................................ 80
3.4.10 Closing All Input and Output Files ...................................................................... 80
Viewing Trace Information............................................................................................... 81
3.5.1 Opening the Trace Window................................................................................. 81
3.5.2 Specifying Trace Acquisition Conditions ............................................................ 81
3.5.3 Acquiring Trace Information ............................................................................... 83
3.5.4 Searching for a Trace Record .............................................................................. 91
3.5.5 Clearing the Trace Information............................................................................ 92
3.5.6 Saving the Trace Information in a File ................................................................ 92
3.5.7 Viewing the Source File ...................................................................................... 92
3.5.8 Trimming the Source ........................................................................................... 92
3.5.9 Analyzing Statistical Information ........................................................................ 93
Viewing the Profile Information ....................................................................................... 94
3.6.1 Stack Information Files........................................................................................ 94
3.6.2 Profile Information Files...................................................................................... 96
3.6.3 Loading Stack Information Files.......................................................................... 98
3.6.4 Enabling the Profile ............................................................................................. 100
3.6.5 Specifying Measurement Mode ........................................................................... 100
3.6.6 Executing the Program and Checking the Results ............................................... 100
3.6.7 List Sheet ............................................................................................................. 101
3.6.8 Tree Sheet ............................................................................................................ 102
3.6.9 Profile-Chart Window.......................................................................................... 105
3.6.10 Types and Purposes of Displayed Data................................................................ 106
3.6.11 Creating Profile Information Files ....................................................................... 108
3.6.12 Notes .................................................................................................................... 109
3.7 Analyzing Performance..................................................................................................... 110
3.7.1 Opening the Performance Analysis Window....................................................... 110
3.7.2 Specifying a Target Function............................................................................... 111
3.7.3 Starting Performance Data Acquisition ............................................................... 111
3.7.4 Resetting Data...................................................................................................... 111
3.7.5 Deleting a Target Function .................................................................................. 111
3.7.6 Deleting All Target Functions.............................................................................. 112
3.7.7 Saving the Currently Displayed Contents ............................................................ 112
3.8 Acquiring Code Coverage................................................................................................. 112
3.8.1 Opening the Coverage Window........................................................................... 112
3.8.2 Acquiring All Coverage Information ................................................................... 116
3.8.3 Clearing All Coverage Information ..................................................................... 116
3.8.4 Viewing the Source Window ............................................................................... 116
3.8.5 Specifying the New Coverage Range .................................................................. 116
3.8.6 Changing the Coverage Range............................................................................. 116
3.8.7 Deleting the Selected Coverage Range ................................................................ 117
3.8.8 Acquiring Coverage Information ......................................................................... 118
3.8.9 Clearing Coverage Information ........................................................................... 118
3.8.10 Saving Coverage Information in a File ................................................................ 118
3.8.11 Loading Coverage Information from a File ......................................................... 119
3.8.12 Updating the Information..................................................................................... 119
3.8.13 Confirmation Request Dialog Box....................................................................... 120
3.8.14 Save Coverage Data Dialog Box ......................................................................... 121
3.8.15 Displaying the Coverage Information in the [Editor] Window............................ 122
3.8.16 Displaying the Coverage Information in the [Disassembly] Window ................. 123
3.9 Generating a Pseudo-Interrupt Manually .......................................................................... 124
3.9.1 [Trigger] Window ................................................................................................ 124
3.9.2 [GUI I/O] Window............................................................................................... 127
3.10 Standard I/O and File I/O Processing................................................................................ 131
iii
3.11
3.12
3.13
3.14
3.10.1 Opening the Simulated I/O Window.................................................................... 131
3.10.2 I/O Functions ....................................................................................................... 132
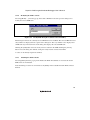
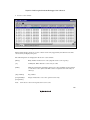
Viewing the TLB Contents ............................................................................................... 135
3.11.1 Opening a TLB Window...................................................................................... 135
3.11.2 Modifying the TLB Contents............................................................................... 141
3.11.3 Flushing the TLB Contents.................................................................................. 141
3.11.4 Searching the TLB Items ..................................................................................... 142
3.11.5 Continuing the TLB Search ................................................................................. 142
3.11.6 Saving the Currently Displayed Contents............................................................ 143
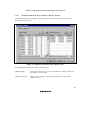
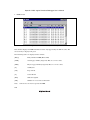
Viewing the Cache Contents............................................................................................. 143
3.12.1 Opening a Cache Window ................................................................................... 143
3.12.2 Modifying the Cache Contents ............................................................................ 151
3.12.3 Flushing the Cache Contents ............................................................................... 151
3.12.4 Searching the Cache Items................................................................................... 152
3.12.5 Continuing the Cache Search............................................................................... 152
3.12.6 Modifying the Cache Capacity ............................................................................ 153
3.12.7 Saving the Currently Displayed Contents............................................................ 158
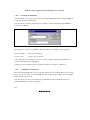
Viewing the Contents of Register Banks .......................................................................... 159
3.13.1 Opening the [Register Bank] Window................................................................. 159
3.13.2 Modifying the Contents of Register Banks.......................................................... 160
3.13.3 Changing the Radix ............................................................................................. 160
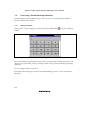
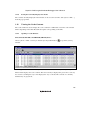
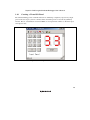
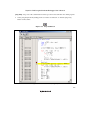
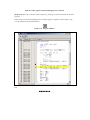
Creating a Virtual I/O Panel ............................................................................................. 161
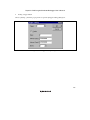
3.14.1 Opening the [GUI I/O] Window .......................................................................... 162
3.14.2 Creating a Button ................................................................................................. 163
3.14.3 Creating a Label................................................................................................... 165
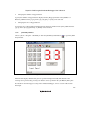
3.14.4 Creating an LED .................................................................................................. 168
3.14.5 Creating Fixed Text ............................................................................................. 171
3.14.6 Changing the Size and Position of an Item .......................................................... 173
3.14.7 Copying an Item .................................................................................................. 173
3.14.8 Deleting an Item .................................................................................................. 173
3.14.9 Showing the Grid................................................................................................. 174
3.14.10 Saving I/O Panel Information .............................................................................. 174
3.14.11 Loading I/O Panel Information............................................................................ 174
Section 4 Windows............................................................................................175
Section 5 Command Lines.................................................................................177
5.1
iv
Commands (Functional Order) ......................................................................................... 177
5.1.1 Execution ............................................................................................................. 177
5.1.2 Download............................................................................................................. 178
5.2
5.1.3 Register ................................................................................................................ 178
5.1.4 Register Bank (SH2A-FPU Only)........................................................................ 179
5.1.5 Memory................................................................................................................ 179
5.1.6 Assemble/Disassemble ........................................................................................ 179
5.1.7 Break.................................................................................................................... 180
5.1.8 Trace .................................................................................................................... 180
5.1.9 Coverage .............................................................................................................. 181
5.1.10 Performance......................................................................................................... 181
5.1.11 Watch ................................................................................................................... 181
5.1.12 Script/Logging ..................................................................................................... 182
5.1.13 Memory Resource................................................................................................ 182
5.1.14 Simulator/Debugger Settings ............................................................................... 182
5.1.15 Standard I/O and File I/O..................................................................................... 183
5.1.16 Utility ................................................................................................................... 183
5.1.17 Project/Workspace ............................................................................................... 184
5.1.18 Test Tool Facility................................................................................................. 184
Commands (Alphabetical Order) ...................................................................................... 185
Section 6 Messages ............................................................................................191
6.1
6.2
Information Messages ....................................................................................................... 191
Error Messages.................................................................................................................. 192
Section 7 Tutorial...............................................................................................197
7.1
7.2
7.3
Preparation ........................................................................................................................ 197
7.1.1 Sample Program................................................................................................... 197
7.1.2 Creating the Sample Program .............................................................................. 197
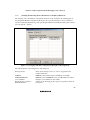
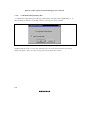
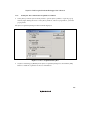
Settings for Debugging ..................................................................................................... 198
7.2.1 Allocating the Memory Resource ........................................................................ 198
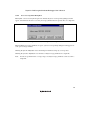
7.2.2 Downloading the Sample Program ...................................................................... 199
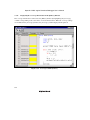
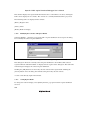
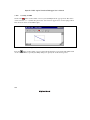
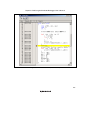
7.2.3 Displaying the Source Program ........................................................................... 200
7.2.4 Setting a PC Breakpoint....................................................................................... 201
7.2.5 Setting the Profiler ............................................................................................... 202
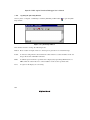
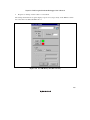
7.2.6 Setting the Simulated I/O..................................................................................... 203
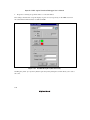
7.2.7 Setting the Trace Information Acquisition Conditions ........................................ 205
7.2.8 Setting the Stack Pointer and Program Counter................................................... 206
Start Debugging ................................................................................................................ 206
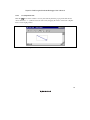
7.3.1 Executing a Program............................................................................................ 206
7.3.2 Using the Trace Buffer......................................................................................... 210
7.3.3 Performing Trace Search ..................................................................................... 211
7.3.4 Checking Simulated I/O....................................................................................... 212
v
7.3.5
7.3.6
7.3.7
7.3.8
vi
Checking the Breakpoints.................................................................................... 213
Watching Variables.............................................................................................. 213
Executing the Program in Single Steps................................................................ 215
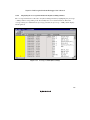
Checking Profile Information .............................................................................. 219
SuperH™ RISC engine Simulator/Debugger User’s Manual
Section 1 Overview
The simulator/debugger is a powerful development environment tool for embedded applications
running on Renesas Technology microcomputers.
The simulator/debugger is used with the High-performance Embedded Workshop (HEW). The
HEW provides a graphical user interface that eases the development and debugging of
applications written in the C/C++ programming languages or assembly language for Renesas
Technology microcomputers. Its aim is to provide a powerful yet intuitive way of accessing,
observing and modifying the debugging platform on which the application is running.
READ the simulator/debugger and HEW help information before using the simulator/debugger.
1
SuperH™ RISC engine Simulator/Debugger User’s Manual
2
SuperH™ RISC engine Simulator/Debugger User’s Manual
Section 2 Simulator/Debugger Functions
This section describes the functions of the SuperH
2.1
TM
RISC engine simulator/debugger.
Features
• Since the simulator/debugger runs on a host computer, software debugging can start without
using an actual user system, thus reducing overall system development time.
• The simulator/debugger provides pseudo-interrupt and I/O-simulation functions for simple
system-level simulation.
• The simulator/debugger offers the following functions that enable efficient program testing
and debugging.
⎯ The ability to handle all of the SuperH
TM
RISC engine series CPUs
⎯ Functions to stop or continue execution when an error occurs during user program
execution
⎯ Profile data acquisition and function-unit performance measurement
⎯ A comprehensive set of break functions
⎯ Functions to set or edit memory maps
⎯ Functions to display function call history
⎯ Coverage information is displayed in the C/C++ or assembly-source level
⎯ Visual debugging functions provided through the display of memory contents as images or
waveforms
• The breakpoints, memory map, performance, and trace can be set through the dialog boxes
®
TM
under Windows . Environments corresponding to each memory map of the SuperH RISC
engine microcomputers can be set through the dialog box.
⎯ Intuitive user interface
⎯ Online help
⎯ Common display and operability
2.2
Target User Program
Load modules in the Elf/Dwarf2 format can be symbolically debugged with the
simulator/debugger. Load modules in other formats can be downloaded, and their instructions can
be executed; however, they cannot be symbolically debugged. For details, refer to section 17.18.2,
Elf/Dwarf2 Support in the High-performance Embedded Workshop V.4.03 User’s Manual.
3
SuperH™ RISC engine Simulator/Debugger User’s Manual
2.3
Range of Simulation
TM
(1) The simulator/debugger provides simulation functions for the SuperH RISC engine series
(SH-1, SH-2, SH-2E, SH-3, SH-3E, SH2-DSP, SH3-DSP, SH-4, SH2A-FPU, and SH-4A
series) microcomputers.
(2) The SH2-DSP series consists of the SH2-DSP (Core), the SH2-DSP (SH7410), and the SH2DSP (SH7065) which do not have cache, and the SH2-DSP (SH7612) which has on-chip cache.
In this manual, the SH2-DSP series refers to the SH2-DSP (Core), the SH2-DSP (SH7410), the
SH2-DSP (SH7065), and the SH2-DSP (SH7612).
(3) The SH3-DSP series consists of the SH3-DSP (Core) and the SH3-DSP; these two types have
different DSP functions. In this manual, the SH3-DSP series refers to the SH3-DSP (Core) and
the SH3-DSP.
(4) The SH-4 series consists of two types of microcomputers, SH-4 and SH-4 (SH7750R), which
have different cache specifications. In addition, the SH-4 has two different versions of
microcomputers; one improves the simulation speed by limiting part of the simulation
functions (called SH-4 in this manual) and the other provides high-level functions (called SH4BSC in this manual). Note that in this manual, the SH-4 series refers to the SH-4, the SH4BSC, and the SH-4 (SH7750R).
(5) The SH-4A series consists of the SH4AL-DSP that incorporates the DSP, and the SH-4A that
incorporates the FPU. The extended version is not supported. In this manual, the SH-4A series
refers to the SH4AL-DSP and the SH-4A.
(6) Pipeline simulation is supported for the SH-1, SH-2, SH-2E, SH-3, SH-3E, SH2-DSP, SH3DSP, and SH-4 series microcomputers. As well as pipeline simulation, a further type of
debugging target platform is available for the SH3-DSP and SH-4 microcomputers: a
functional simulator that supports instruction-unit simulation. Inclusion of “Functional
Simulator” in the name of the debugging target indicates this kind of target. In a functional
simulator, the number of executed instruction cycles is calculated on the assumption that each
instruction is executed in one cycle.
4
SuperH™ RISC engine Simulator/Debugger User’s Manual
(7) The SH-4A series and SH2A-FPU microcomputers have two types of debugger target.
Inclusion of “Cycle Base Simulator” in the debugger target name indicates support for pipeline
simulation while the inclusion of “Functional Simulator” indicates support for instruction-unit
simulation. In a functional simulator, the number of executed instruction cycles is calculated
on the assumption that each instruction is executed in one cycle. In a cycle-based simulator,
the number of executed instruction cycles is calculated according to the contents of a table that
defines the internal operation of instructions and the state of usage of resources such as
registers as a result of instruction-set level simulation. The number of cycles, however, still
might not match the result on the actual device. To figure out the exact number of execution
cycles (execution time), we recommend that you use the actual device on the emulator or
evaluation board.
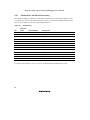
(8) The simulator/debugger supports the following SuperH
functions:
•
All CPU instructions
•
Exception processing
•
Registers
•
All address space
•
Peripheral functions shown in table 2.1
TM
RISC engine series microcomputer
5
SuperH™ RISC engine Simulator/Debugger User’s Manual
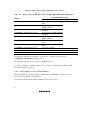
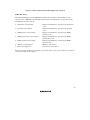
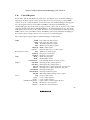
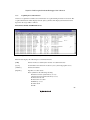
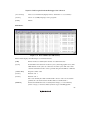
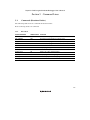
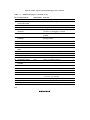
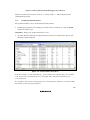
Table 2.1
Simulator/Debugger Functions and Corresponding CPUs
Names of Debugging
Platforms
Endian
MMU
Cache
Register
BSC
DMAC
Timer
SH-1
⎯
⎯
⎯
⎯
⎯
⎯
Ì
SH-2
{
⎯
⎯
⎯
⎯
⎯
Ì
SH-2E
⎯
⎯
⎯
⎯
⎯
⎯
Ì
SH-3
{
{
{
{
⎯
⎯
Ì
SH-3E
{
{
{
{
⎯
⎯
⎯
SH3-DSP
{
{
{
{
⎯
⎯
Ì
SH3-DSP Functional Simulator
{
⎯
{
{
⎯
⎯
Ì
SH3-DSP (Core)
{
{
{
{
⎯
⎯
Ì
SH-4
{
{
{
{
Ì
⎯
Ì
SH-4 Functional Simulator
{
⎯
{
{
⎯
⎯
Ì
SH-4BSC
{
{
{
{
{
{
Ì
SH-4 (SH7750R)
{
{
{
{
Ì
⎯
Ì
SH2-DSP (SH7410)
⎯
⎯
⎯
⎯
⎯
⎯
⎯
SH2-DSP (Core)
⎯
⎯
⎯
⎯
⎯
⎯
Ì
SH2-DSP (SH7065)
{
⎯
⎯
⎯
⎯
⎯
Ì
SH2-DSP (SH7612)
{
⎯
{
{
⎯
⎯
⎯
SH-2A-FPU
⎯
⎯
{
{
⎯
⎯
Ì
SH-4A
{
{
{
{
⎯
⎯
Ì
SH-4AL-DSP
{
{
{
{
⎯
⎯
Ì
Note: {: Supported
⎯: Not supported
Ì: Partly supported
6
SuperH™ RISC engine Simulator/Debugger User’s Manual
TM
(9) The simulator/debugger does not support the following SuperH RISC engine series MCU
TM
functions. Programs that use these functions must be debugged with the SuperH RISC engine
series emulator.
•
Serial communication interface (SCI)
•
I/O ports
(10) The SH2A-FPU supports register banks that allow fast save/restore operations in interrupt
processing. Up to 15 register banks (banks 0 to 14) are supported.
2.4
Functions Supported by SH-4 Series
2.4.1
Bus State Controller (BSC)
For the SH-4BSC, the simulator/debugger has the functions for specifying and modifying the
memory map in accordance with the BSC setting so that a user program using the BSC can be
debugged.
For the SH-4 and SH-4 (SH7750R), the simulator/debugger does not support the bus control
function in the BSC, only SRAM, bus width, and the number of states can be specified.
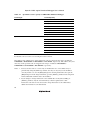
Table 2.2 is a list of memory types that can be specified for the SH-4BSC, SH-4, and SH-4
(SH7750R).
7
SuperH™ RISC engine Simulator/Debugger User’s Manual
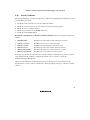
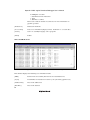
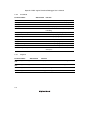
Table 2.2
Memory Types for SH-4BSC, SH-4, and SH-4 (SH7750R) Simulator/Debugger
Specifiable Memory Types
Address
SH-4BSC
SH-4/SH-4 (SH7750R)
H'00000000 to H'03FFFFFF (area 0)
Normal memory, burst ROM, and SRAM
MPX
H'04000000 to H'07FFFFFF (area 1)
Normal memory, byte control
SRAM, and MPX
H'08000000 to H'0BFFFFFF (area 2)
Normal memory, DRAM, SDRAM,
and MPX
H'0C000000 to H'0FFFFFFF (area 3)
Normal memory, DRAM, SDRAM,
and MPX
H'10000000 to H'13FFFFFF (area 4)
Normal memory, byte control
SRAM, and MPX
H'14000000 to H'17FFFFFF (area 5)
Normal memory, burst ROM, and
MPX
H'18000000 to H'1BFFFFFF (area 6)
Normal memory, burst ROM, and
MPX
H'1C000000 to H'1FFFFFFF (area 7)
Cannot be specified
H'7C000000 to H'7C001FFF
Internal RAM (cannot be changed)
H'E0000000 to H'FFFFFFFF
I/O (cannot be changed)
The high-order three bits of the addresses for areas 0 to 7 in table 2.2 must be ignored;
H'00000000 and H'20000000 are both in area 0.
The simulator/debugger does not support the PCMCIA interface.
For details on settings of memory mapping, refer to section 3.2.2, Modifying the Memory Map
and Memory Resource Settings.
2.4.2
Direct Memory Access Controller (DMAC)
For the SH-4BSC, the simulator/debugger simulates the 4-channel DMAC operations; the user
program using the DMAC can be debugged.
For the SH-4 and SH-4 (SH7750R), the DMA function cannot be used.
8
SuperH™ RISC engine Simulator/Debugger User’s Manual
2.5
External/Internal Clock Ratio
The external/internal clock ratio is 1:1. This can be modified by the CLOCK_RATE command
only for the SH-4 series. For details on the CLOCK_RATE command, refer to the help
information of the simulator/debugger.
2.6
Endian
In the SH-2 series, SH-3, SH-3E, SH3-DSP series, SH-4 series, SH-4A series, SH2-DSP
(SH7065), and SH2-DSP (SH7612), the byte order according to little endian as well as big endian
can be specified as the data allocation format in the memory. This enables a user program created
in the little endian format to be simulated and debugged.
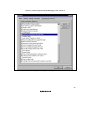
Specify the endian when selecting the debugging platform. When “(Little endian)” is added to the
platform name, it indicates little endian (otherwise big endian).
The specified endian is valid for all accesses to external memory. It is also valid for accesses to the
X or Y memory with the SH3-DSP series, the L memory with the SH-4A series, and the X, Y, or
U memory with the SH4AL-DSP series. Word or longword data is written to or read from the
memory in the specified byte order.
Note: The specified endian is applied to all accesses to external memory in common. The SH2DSP (SH7612) and SH2-DSP (SH7065) have the function to specify endian in memory
area units, but the simulator/debugger does not support this function.
9
SuperH™ RISC engine Simulator/Debugger User’s Manual
2.7
Memory Management Unit (MMU)
For the SH-3, SH-3E, SH3-DSP series, SH-4 series, and SH-4A series, the simulator/debugger
simulates MMU operations such as TLB operations, address translation, or MMU-related
exceptions (TLB miss exception, TLB protection exception, TLB invalid exception, and initial
page write exception). The user program using address translation by the MMU can thus be
simulated and debugged. In addition, the MMU-related exception handler routines can be
simulated and debugged. The MMU functions differ depending on the CPU.
SH-3, SH-3E, and SH3-DSP Series:
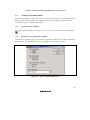
The following window and dialog boxes are provided to manipulate the 32-entry 4-way TLB
contents.
• TLB window: Displays and flushes the TLB contents
• TLB item modify dialog boxes: Modifies the TLB items
• TLB item find dialog boxes: Searches for the TLB items
For details, refer to section 3.11, Viewing the TLB Contents.
The TLB is mapped in the range of addresses H'F2000000 to H'F3FFFFFF (all entries of the TLB
are allocated within this range).
Note: The SH3-DSP functional simulator and SH3 functional simulator do not simulate MMU
operations.
10
SuperH™ RISC engine Simulator/Debugger User’s Manual
SH-4 Series and SH-4A Series:
The following windows and dialog boxes are provided to manipulate the 4-entry instruction TLB
and 64-entry unified TLB contents:
• Instruction TLB window: Displays and flushes the instruction TLB contents
• Unified TLB window: Displays and flushes the unified TLB contents
• TLB item modify dialog boxes: Modifies the TLB items
• TLB item find dialog boxes: Searches for the TLB items
In the SH-4A, the following window is also provided to manipulate the 16-entry instruction PMB
contents:
• PMB window: Displays and flushes the PMB contents
For details, refer to section 3.11, Viewing the TLB Contents.
The simulator/debugger does not support data array 2 for both the instruction TLB and unified
TLB.
As well as during simulation, the MMU translates virtual addresses into physical addresses during
address display or input in the dialog boxes or windows. Therefore, in the dialog boxes and
windows, memory can be accessed with the virtual addresses used in the user program. Note,
however, that physical addresses must be used in [Memory map] and [System memory resource].
Notes: 1. If an associative write to a TLB entry is performed using the [Memory] window, the
entry may not be modified correctly. In this case, use the [Edit] dialog box in the
longword format. To open the [Edit] dialog box in the longword format, open the
[Memory] window in the longword format and double-click the data to be modified.
2. Some devices do not incorporate the PMB.
3. The SH-4 functional simulator does not simulate MMU operations.
11
SuperH™ RISC engine Simulator/Debugger User’s Manual
2.8
Cache
For the SH-3, SH-3E, SH3-DSP series, SH-4 series, SH2A-FPU series, SH-4A series, and SH2DSP (SH7612), the simulator/debugger simulates cache operations and displays the cache contents
and cache hit rate. This allows cache operations to be monitored during user program execution.
The cache contents differ depending on the CPU.
2.8.1
Displaying Cache Contents
SH-3, SH-3E, SH3-DSP Series, and SH2-DSP (SH7612):
The following window and dialog boxes are provided to manipulate the cache contents:
• Cache window: Displays and flushes the cache contents
• Cache item modify dialog boxes: Modifies the cache items
• Cache item find dialog boxes: Searches for the cache items
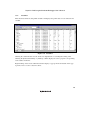
For the SH-3 and SH-3E series, the [Cache Capacity] dialog box enables the cache capacity to be
specified. This function is unique to this simulator/debugger. Half of the cache can be specified as
the internal RAM. Table 2.3 shows the cache capacity and the ways to be used.
Table 2.3
Specifiable Cache Capacity for SH-3 and SH-3E Series Simulator/Debugger
Cache Capacity
Ways to Be Used
Internal RAM Specification
(Ways that Can Be Used as Internal RAM)
8 Kbytes
Ways 0 to 3
Ways 2 and 3 can be used as internal RAM
4 Kbytes
Ways 0 and 1
Way 1 can be used as internal RAM
2 Kbytes
Way 0
No way can be used as internal RAM (internal
RAM specification is ignored)
For details, refer to section 3.12, Viewing the Cache Contents.
The cache is mapped in the range of addresses H'F0000000 to H'F1FFFFFF in the SH-3, SH-3E,
and SH3-DSP series. In the SH2-DSP (SH7612), the address array is mapped in the range of
addresses H'60000000 to H'7FFFFFFF, and the data array is mapped in the range of addresses
H'C0000000 to H'C0000FFF.
12
SuperH™ RISC engine Simulator/Debugger User’s Manual
SH-4 and SH-4BSC:
The simulator/debugger simulates operations of the 8-kbyte instruction cache, the 16-kbyte
operand cache, and two 32-byte store queues (SQ). The following windows and dialog boxes are
provided to manipulate the cache contents:
• Instruction cache window: Displays and flushes the instruction cache contents
• Operand cache window: Displays and flushes the operand cache contents
• Cache item modify dialog boxes: Modifies the cache items
• Cache item find dialog boxes: Searches for the cache items
For details, refer to section 3.12, Viewing the Cache Contents.
The instruction cache is mapped in the range of addresses H'F0000000 to H'F1FFFFFF, the
operand cache is mapped in the range of addresses H'F4000000 to H'F5FFFFFF, and the SQ is
mapped in the range of addresses H'E0000000 to H'E3FFFFFF.
Note: If an associative write to a cache entry or modification of a cache address array is
performed by using the [Memory] window, the entry or array may not be modified
correctly. In this case, use the [Edit] dialog box in the longword format. To open the [Edit]
dialog box in the longword format, open the [Memory] window in the longword format
and double-click the data to be modified.
The simulator/debugger does not change the high-order three bits of the address tag stored in a
cache address array to zeros.
When loading a program to the area where the cache is mapped by using the [Load Object File]
dialog box or by copying memory data to this area via the [Copy Memory] dialog box, clear the
AT bit of the MMUCR to zero to disable the MMU.
13
SuperH™ RISC engine Simulator/Debugger User’s Manual
SH-4 (SH7750R):
The simulator/debugger simulates operations of the 16-kbyte instruction cache, the 32-kbyte
operand cache, and two 32-byte store queues (SQ). The following windows and dialog boxes are
provided to manipulate the cache contents:
• Instruction cache window: Displays and flushes the instruction cache contents
• Operand cache window: Displays and flushes the operand cache contents
• Cache item modify dialog boxes: Modifies the cache items
• Cache item find dialog boxes: Searches for the cache items
For details, refer to section 3.12, Viewing the Cache Contents.
The instruction cache is mapped in the range of addresses H'F0000000 to H'F1FFFFFF, the
operand cache is mapped in the range of addresses H'F4000000 to H'F5FFFFFF, and the SQ is
mapped in the range of addresses H'E0000000 to H'E3FFFFFF.
Note: If an associative write to a cache entry or modification of a cache address array is
performed by using the [Memory] window, the entry or array may not be modified
correctly. In this case, use the [Edit] dialog box in the longword format. To open the [Edit]
dialog box in the longword format, open the [Memory] window in the longword format
and double-click the data to be modified.
The simulator/debugger does not change the high-order three bits of the address tag stored in a
cache address array to zeros.
When loading a program to the area where the cache is mapped by using the [Load Object File]
dialog box or by copying memory data to this area via the [Copy Memory] dialog box, clear the
AT bit of the MMUCR to zero to disable the MMU.
14
SuperH™ RISC engine Simulator/Debugger User’s Manual
SH2A-FPU Series:
The simulator/debugger for the SH2A-FPU simulates the operation of the instruction cache,
operand cache, and ROM cache. The following windows and dialog boxes are provided for the
manipulation of cache contents:
• Instruction cache window:
Displays and flushes the contents of the instruction
cache.
• Operand cache window:
Displays and flushes the contents of the operand
cache.
• ROM prefetch cache window:
Displays and flushes the contents of the ROM
prefetch cache.
• ROM prefetch miss cache window:
Displays and flushes the contents of the ROM
prefetch miss cache.
• ROM operand cache window:
Displays and flushes the contents of the ROM
operand cache.
• Modify cache dialog box:
Modifies cache entries.
• Find cache dialog box:
Searches for cache entries.
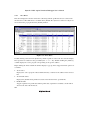
The [Cache Capacity] dialog box enables specification of the cache capacity. Table 2.4 shows the
cache type and the cache capacity.
15
SuperH™ RISC engine Simulator/Debugger User’s Manual
Table 2.4
Specifiable Cache Capacity for SH2A-FPU Simulator/Debugger
Cache Type
Cache Capacity
Instruction cache
8 Kbytes
16 Kbytes
32 Kbytes
64 Kbytes
128 Kbytes
256 Kbytes
512 Kbytes
1 Mbyte
Operand cache
8 Kbytes
16 Kbytes
32 Kbytes
64 Kbytes
128 Kbytes
256 Kbytes
512 Kbytes
1 Mbyte
For details, refer to section 3.12, Viewing the Cache Contents.
The address array and data array of the instruction cache are mapped to the ranges of addresses
H'F0000000 to H'F07FFFFF and H'F1000000 to H'F17FFFFF, respectively. The address array and
data array of the operand cache are mapped to the ranges of addresses H'F0800000 to
H'F0FFFFFF and H'F1800000 to H'F1FFFFFF, respectively.
Notes: 1. If an associative write to a cache entry or modification of a cache address array is
performed by using the [Memory] window, the entry or array may not be modified
correctly. In this case, use the [Edit] dialog box in the longword format. To open the
[Edit] dialog box in the longword format, open the [Memory] window in the longword
format and double-click the data to be modified.
2. If you attempt to change instruction-cache enabled data via the [Disassembly] or
[Memory] window, only the external memory content is updated; the actual
instruction-cache data are not affected. To change instruction-cache enabled data,
disable the instruction cache beforehand.
16
SuperH™ RISC engine Simulator/Debugger User’s Manual
SH-4A Series:
The simulator/debugger simulates operations of the instruction cache and the operand cache. With
the SH-4A, level-2 cache and two 32-byte store queues (SQ) are simulated. The following
windows and dialog boxes are provided to manipulate the cache contents:
• Instruction cache window: Displays and flushes the instruction cache contents
• Operand cache window: Displays and flushes the operand cache contents
• Level-2 cache window (SH-4A only): Displays and flushes the level-2 cache contents
• Cache item modify dialog boxes: Modifies the cache items
• Cache item find dialog boxes: Searches for the cache items
The [Cache Capacity] dialog box enables the cache capacity to be specified. This function is
unique to this simulator. Table 2.5 shows the cache type and the cache capacity.
Table 2.5
Specifiable Cache Capacity for SH-4A and SH4AL-DSP Simulator/Debugger
Cache Type
Cache Capacity
Instruction cache
8 Kbytes
16 Kbytes
32 Kbytes
64 Kbytes
128 Kbytes
Operand cache
8 Kbytes
16 Kbytes
32 Kbytes
64 Kbytes
128 Kbytes
Level-2 cache (SH-4A only)
128 Kbytes
256 Kbytes
512 Kbytes
1 Mbyte
For details, refer to section 3.12, Viewing the Cache Contents.
17
SuperH™ RISC engine Simulator/Debugger User’s Manual
The instruction cache is mapped in the range of addresses H'F0000000 to H'F1FFFFFF and the
operand cache is mapped in the range of addresses H'F4000000 to H'F5FFFFFF. For the SH-4A,
the level-2 cache is mapped in the range of addresses H'F8000000 to H'F9FFFFFF and the SQ is
mapped in the range of addresses H'E0000000 to H'E3FFFFFF.
Notes: 1. If an associative write to a cache entry or modification of a cache address array is
performed by using the [Memory] window, the entry or array may not be modified
correctly. In this case, use the [Edit] dialog box in the longword format. To open the
[Edit] dialog box in the longword format, open the [Memory] window in the longword
format and double-click the data to be modified.
2. Some devices do not incorporate the level-2 cache.
When loading a program to the area where the cache is mapped by using the [Load Object File]
dialog box or by copying memory data to this area via the [Copy Memory] dialog box, clear the
AT bit of the MMUCR to zero to disable the MMU.
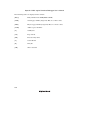
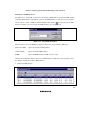
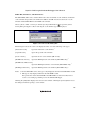
2.8.2
Cache Hit Rate
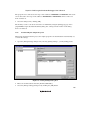
Checking and Displaying the Cache Hit Rate: The simulator/debugger acquires the rate of the
number of cache hits count to the cache access count as the cache hit rate. The cache hit rate is
displayed in percentage in the [Platform] sheet in the [Status] window. The cache hit rate is
obtained by dividing the cache hit count by the cache access count (the sum of the cache hit count
and cache miss count).
The cache hit count and cache miss count are also displayed.
Initializing the Cache Hit Rate: The displayed cache hit rate is initialized when the
simulator/debugger is initiated, the pipeline is reset, or the CCR control register value is modified.
In the SH3-DSP series, the cache hit rate is initialized also when the CCR2 control register value
is modified.
18
SuperH™ RISC engine Simulator/Debugger User’s Manual
2.9
Timer
2.9.1
Supported Range
The simulator/debugger only supports channel 0 of each timer.
In addition, the simulator/debugger also supports interrupts by an overflow, underflow, or
compare match, but does not support functions with the input and output of the pin such as the
input capture.
2.9.2
Control Registers
This simulator/debugger supports timer control registers. Table 2.6 shows the control registers
supported by the simulator/debugger.
The addresses of the timer control registers, interrupt vector numbers, and positions of the
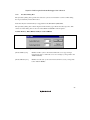
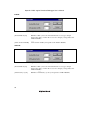
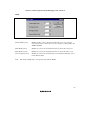
interrupt priority registers can be changed in the [Peripheral Module Configuration] dialog box.
For details on the [Peripheral Module Configuration] dialog box, refer to section 3.3, Simulating
Peripheral Functions.
19
SuperH™ RISC engine Simulator/Debugger User’s Manual
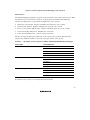
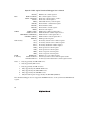
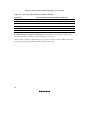
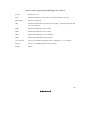
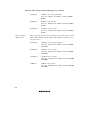
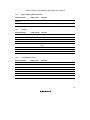
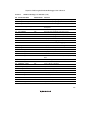
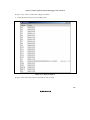
Table 2.6
Timer Control Registers Supported by the Simulator/Debugger
Names of Debugging Platforms
SH-1
SH-2/SH-2E/SH2-DSP (SH7065)/
SH2A-FPU
SH-3/SH3-DSP/SH3-DSP (Core)
/SH-4/SH-4BSC/SH-4 (SH7750R)
/SH4AL-DSP
SH-4A
20
Supported Control
Register
Timer
ITU0
CMT0
TMU0
TMU0
Status
TSTR
Ì
TCR
Ì
TIER
{
TSR
{
TCNT
{
GRA
{
GRB
{
CMSTR
{
CMCSR
{
CMCNT
{
CMCOR
Ì
TCR
Ì
TCNT
{
TSTR
{
TOCR
{
TSTR0
{
TCOR0
{
TCNT0
{
TCR0
Ì
TSTR1
{
TCOR3
{
TCNT3
{
TCR3
Ì
SuperH™ RISC engine Simulator/Debugger User’s Manual
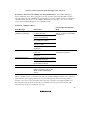
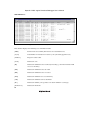
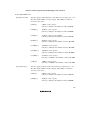
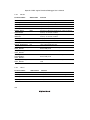
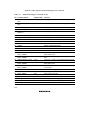
Table 2.6
Timer Control Registers Supported by the Simulator/Debugger (cont)
Names of Debugging Platforms
SH2-DSP (Core)
Supported Control
Register
Timer
FRT0
Status
TIER
Ì
FTCSR
Ì
FRC
{
OCRA
{
OCRB
{
TCR
Ì
TOCR
Ì
Note: {: Supported
Ì: Partly supported (bits for the function described in section 2.9.1, Supported Range)
2.9.3
Clocks
The simulator/debugger supports an internal clock that provides timing in access to memory, a
peripheral function clock, and clocks for operating the timers.
The numbers of cycles of the internal clock required for access to memory correspond to the
specifications for the memory map. Set the frequency ratio of the internal clock to the peripheral
function clock in the [Set Peripheral Function Simulation] dialog box.
Use the timer control register to specify the division ratio to create the clock for operating the
timers.
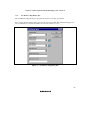
2.9.4
Using a Timer
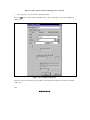
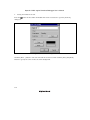
To use a timer, the timer module must be registered in the [Set Peripheral Function Simulation]
dialog box, which is opened at initiation of the simulator/debugger.
For details on the timer module registration, refer to section 3.3, Simulating Peripheral Functions.
21
SuperH™ RISC engine Simulator/Debugger User’s Manual
2.9.5
Notes on Using a Timer
1. Even if the actual CPU can only clear a bit to 0, the simulator can write 1 to this bit.
2. During simulation, the SH-2DSP (core) accesses the 16-bit registers via a temporary register.
However, during command access, the SH-2DSP (core) directly accesses those registers
without using the temporary register.
3. The user can select whether or not to cause a break when a timer interrupt occurs. This can be
set in the [Simulator System] dialog box or by the EXEC_STOP_SET command.
22
SuperH™ RISC engine Simulator/Debugger User’s Manual
2.10
Control Registers
For the SH-3, SH-3E, SH3-DSP series, SH-4 series, and SH-4A series, the simulator/debugger
supports the memory-mapped control registers that are used for exception processing, MMU
control, and cache control. In addition, for the SH-4 series, the simulator/debugger also supports
the control registers that are used for BSC and DMAC control. For the SH2A-FPU, the
simulator/debugger supports the memory-mapped control registers that are used for cache control
and register bank control. For the SH2-DSP (SH7612), the simulator/debugger only supports the
CCR register that is used for cache control. Therefore, a user program using exception processing,
MMU control, cache control, BSC control, and DMAC control can be simulated and debugged.
For control registers related to timers, refer to section 2.9.2, Control Registers.
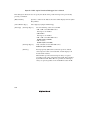
The control registers supported by the simulator/debugger are listed below.
MMU
PTEH:
PTEL:
TTB:
TEA:
MMUCR:
*3*4
PASCR :
Exception processing
TRA:
EXPEVT:
INTEVT:
*5
INTC
IBCR :
*5
IBNR :
*3
USERIMASK :
*3
INTC2
INT2PRI0:
INT2PRI1:
INT2A0:
INT2A1:
INT2MSKR:
INT2MSKCR:
INT2B0:
Cache
CCR:
*5
CCR1 :
*1*5
CCR2 :
*2*3
QACR0 and QACR1 :
*5
RCCR :
*5
RCCR2 :
Page table entry high register
Page table entry low register
Translation table base register
TLB exception address register
MMU control register
Physical address space control register
TRAPA exception register
Exception event register
Interrupt event register
Bank control register
Bank number register
User interrupt mask level setting register
Interrupt priority setting register 0
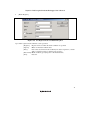
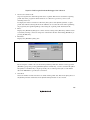
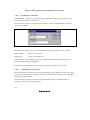
Interrupt priority setting register 1
Interrupt source register (mask state not affected)
Interrupt source register (mask state affected)
Interrupt mask register
Interrupt mask clear register
Individual module interrupt source register
Cache control register
Cache control register 1
Cache control register 2
Queue address control registers 0 and 1
ROM cache control register
ROM cache control register 2
23
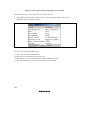
SuperH™ RISC engine Simulator/Debugger User’s Manual
*5
RCCR4 :
*2
BSC
BCR1 and BCR2 :
*2
WCR1 and WCR2 :
*6
WCR3 :
*6
MCR :
*6
RTCSR :
*6
RTCNT :
*6
RTCOR :
*6
RFCR :
*6
DMAC
SAR0 to SAR3 :
*6
DAR0 to DAR3 :
*6
DMATCR0 to DMATCR3 :
*6
CHCR0 to CHCR3 :
*6
DMAOR :
*3
X/Y memory
XSA :
*3
YSA :
*3
XDA :
*3
YDA :
*3
XPR :
*3
YPR :
*3
XER :
*3
YER :
*5
RAM
RAMACYC :
*4
L memory
LSA0 and LSA1 :
*4
LDA0 and LDA1 :
ROM cache control register 4
Bus control registers 1 and 2
Wait state control registers 1 and 2
Wait state control register 3
Individual memory control register
Refresh timer control/status register
Refresh timer/counter
Refresh time constant register
Refresh count register
DMA source address registers 0 to 3
DMA destination address registers 0 to 3
DMA transfer count registers 0 to 3
DMA channel control registers 0 to 3
DMA operation register
X memory transfer source address register
Y memory transfer source address register
X memory destination address register
Y memory destination address register
X bus protection control register
Y bus protection control register
X bus exception control register
Y bus exception control register
RAM access cycle setting register
L memory transfer source control register 0 and 1
L memory transfer destination control register 0 and 1
Notes: 1. Only supported by the SH3-DSP series.
2. Only supported by SH-4 series.
3. Only supported by the SH-4A series.
4.
Only supported by the SH4AL-DSP series.
5.
Only supported by the SH2A-FPU series.
6.
Only supported by the SH-4BSC series.
7.
Only the CCR register is supported by the SH2-DSP (SH7612).
The simulator/debugger does not support the PCMCIA interface or the synchronous DRAM mode
register.
24
SuperH™ RISC engine Simulator/Debugger User’s Manual
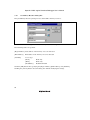
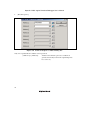
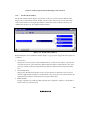
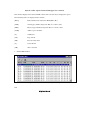
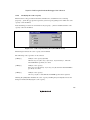
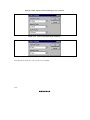
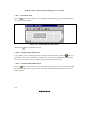
To modify or display a control register value, use the [IO] window. For details, refer to section
17.6, Looking at I/O Memory, in the High-performance Embedded Workshop V.4.03 User’s
Manual.
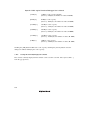
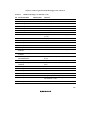
In the SH-4/SH-4 (SH7750R), the simulator supports only a part of bits of the following registers.
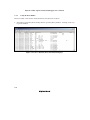
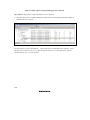
Table 2.7
Control Registers Supported by SH-4/SH-4 (SH7750R) Simulator/Debugger
Register Name
Bit Name
BCR1
ENDIAN
BCR2
A6SZ-A0SZ
WCR1
A6IW-A0IW
WCR2
A6W-A0W
Note: Values of the registers that are not supported can be modified or referenced via the [IO]
window, etc., but the simulator/debugger execution will not be affected.
2.11
Pipeline Reset Processing
The simulator/debugger that simulates the pipeline execution, resets the pipeline when:
• The program counter (PC) is modified after the instruction simulation stops and before it
restarts.
• The Run command to which the execution start address has been specified is executed.
• Initialization is performed or the program is loaded.
When the pipeline is reset, data already fetched and decoded is discarded, and new data is fetched
and decoded from the current PC. In addition, the number of executed instructions and the number
of instruction execution cycles are zero-cleared.
25
SuperH™ RISC engine Simulator/Debugger User’s Manual
2.12
Exception Processing
The simulator/debugger detects the generation of exceptions corresponding to TRAPA
instructions, general illegal instructions, slot illegal instructions, and address errors. In addition,
for the SH-3, SH-3E, SH3-DSP series, SH-4 series, and SH-4A series, the simulator/debugger
simulates MMU-related exception processing (TLB miss, TLB protection exception, TLB invalid
exception, and initial page write). For the SH-2E, SH-3E, SH-4 series, and SH-4 series, the
simulator/debugger also simulates FPU exception processing. Accordingly, simulation can be
performed even when an exception occurs.
The simulator/debugger simulates exception processing with the following procedures, depending
on the [Execution Mode] setting in the [Simulator System] dialog box.
SH-1, SH-2, SH-2E, SH2A-FPU, and SH2-DSP Series:
• When [Continue] is selected (continuation mode):
1. Detects an exception during instruction execution.
2. Saves the PC and SR in the stack area.
3. Reads the start address from the vector address corresponding to the vector number.
4. Starts instruction execution from the start address. If the start address is 0, the
simulator/debugger stops exception processing, shows that an exception processing error
has occurred, and enters the command input wait state.
• When [Stop] is selected (stop mode):
Executes steps 1 to 3 above, then stops.
SH-3, SH-3E, SH3-DSP Series and SH4AL-DSP:
• When [Continue] is selected (continuation mode):
1. Detects an exception during instruction execution.
2. Saves the PC and SR to the SPC and SSR, respectively.
3. Sets the BL bit, RB bit, and MD bit in the SR to 1.
4. Sets an exception code in control register EXPEVT. If necessary, appropriate values are set
in other control registers.
5. Sets the PC to the vector address corresponding to the exception source. (If an exception is
detected when the BL bit in the SR is 1, reset vector address H'A0000000 is set in the PC
regardless of the exception source.)
6.
26
Starts instruction execution from the address set in the PC.
SuperH™ RISC engine Simulator/Debugger User’s Manual
• When [Stop] is selected (stop mode):
Executes steps 1 to 5 above, then stops.
SH-4 Series and SH-4A:
• When [Continue] is selected (continuation mode):
1. Detects an exception during instruction execution.
2. Saves the PC and SR to the SPC and SSR, respectively.
3. Sets the BL bit, RB bit, and MD bit in the SR to 1.
4. Sets the FD (FPU disable) bit in the SR to 0 at reset.
5. Sets an exception code in control register EXPEVT. If necessary, appropriate values are set
in other control registers.
6. Sets the PC to the vector address corresponding to the exception source. (If an exception is
detected when the BL bit in the SR is 1, reset vector address H'A0000000 is set in the PC
regardless of the exception source.)
7. Starts instruction execution from the address set in the PC.
• When [Stop] is selected (stop mode):
Executes steps 1 to 6 above, then stops.
27
SuperH™ RISC engine Simulator/Debugger User’s Manual
2.13
Memory Management
Memory Map Specification: A memory map is used to calculate the number of memory access
cycles during simulation. The following items can be specified:
• Memory type
• Start and end addresses of the memory area
• Number of memory access cycles
• Memory data bus width
The memory types that can be specified differ depending on the CPU. For details, refer to
section 3.2, Modifying the Simulator/Debugger Settings. The user program can be executed in all
areas except for the internal I/O area.
Memory Resource Specification: A memory resource must be specified to load and execute a
user program. The following items can be specified:
• Start address
• End address
• Access type
The access type can be readable/writable, read-only, or write-only.
Since an error occurs if the user program attempts an illegal access (for example, trying to write to
read-only memory), such an illegal access in the user program can be easily detected.
For details on memory resource setting, refer to section 3.2.2, Modifying the Memory Map and
Memory Resource Settings.
28
SuperH™ RISC engine Simulator/Debugger User’s Manual
2.14
Trace
The simulator/debugger writes the execution results of each instruction into the trace buffer. The
conditions for trace information acquisition can be specified in the [Trace Acquisition] dialog box.
Right-clicking on the [Trace] window displays the pop-up menu. Choose [Acquisition...] from the
pop-up menu to display the [Trace Acquisition] dialog box. The acquired trace information is
displayed in the [Trace] window. The trace information displayed in the [Trace] window differs
according to the CPU.
The trace information can be searched. The search conditions can be specified in the [Trace
Search] dialog box. Right-clicking on the [Trace] window displays the pop-up menu. Choose
[Find...] from the pop-up menu to display the [Trace Search] dialog box.
For details, refer to section 3.5, Viewing Trace Information.
29
SuperH™ RISC engine Simulator/Debugger User’s Manual
2.15
Standard I/O and File I/O Processing
The simulator/debugger enables the standard I/O and file I/O processing listed in table 2.8 to be
executed by the user program. When the I/O processing is executed, the [Simulated I/O] window
must be open. Table 2.8 shows the supported I/O functions.
Table 2.8
I/O Functions
No.
Function
Code
Function Name
Description
1
H'21
GETC
Inputs one byte from the standard input
2
H'22
PUTC
Outputs one byte to the standard output
3
H'23
GETS
Inputs one line from the standard input
4
H'24
PUTS
Outputs one line to the standard output
5
H'25
FOPEN
Opens a file
6
H'06
FCLOSE
Closes a file
7
H'27
FGETC
Inputs one byte from a file
8
H'28
FPUTC
Outputs one byte to a file
9
H'29
FGETS
Inputs one line from a file
10
H'2A
FPUTS
Outputs one line to a file
11
H'0B
FEOF
Checks for end of the file
12
H'0C
FSEEK
Moves the file pointer
13
H'0D
FTELL
Returns the current position of the file pointer
For details on I/O functions, refer to section 3.10, Standard I/O and File I/O Processing.
30
SuperH™ RISC engine Simulator/Debugger User’s Manual
2.16
Break Conditions
The simulator/debugger provides the following conditions for interrupting the simulation of a user
program during execution.
• Break due to the satisfaction of a break command condition
• Break due to the detection of an error during execution of the user program
• Break due to a trace buffer overflow
• Break due to execution of the SLEEP instruction
• Break due to the [STOP] button
Break Due to Satisfaction of a Break Command Condition: There are six break commands as
follows:
• BREAKPOINT:
Break based on the address of the instruction executed
• BREAK_ACCESS:
Break based on access to a memory range
• BREAK_CYCLE
Break based on the number of execution cycles
• BREAK_DATA:
Break based on the value of data written to memory
• BREAK_REGISTER:
Break based on the value of data written to a register
• BREAK_SEQUENCE:
Break based on a specified execution sequence
If [Stop] is specified as the action for when a break condition is satisfied, user program execution
stops when the break condition is satisfied. For details, refer to section 3.4, Using the
Simulator/Debugger Breakpoints.
When a break condition is satisfied and user program execution stops, the instruction at the
breakpoint may or may not be executed before a break depending on the type of break, as listed in
table 2.9.
31
SuperH™ RISC engine Simulator/Debugger User’s Manual
Table 2.9
Processing When a Break Condition is Satisfied
Command
Instruction When a Break Condition is Satisfied
BREAKPOINT
Not executed
BREAK_ACCESS
Executed
BREAK_CYCLE
Executed
BREAK_DATA
Executed
BREAK_REGISTER
Executed
BREAK_SEQUENCE
Not executed
For BREAKPOINT and BREAK_SEQUENCE, if a breakpoint is specified at an address other
than the beginning of an instruction, the break will not be detected.
When a break condition is satisfied during user program execution, a break condition satisfaction
message is displayed in the [Output] window and execution stops.
32
SuperH™ RISC engine Simulator/Debugger User’s Manual
Break Due to Error Detection during User Program Execution: The simulator/debugger
detects simulation errors, that is, program errors that cannot be detected by the CPU exception
generation functions. The [Simulator System] dialog box specifies whether to stop or continue the
simulation when such an error occurs. Table 2.10 lists the error messages, error causes, and the
action of the simulator/debugger in the continuation mode.
Table 2.10 Simulation Errors
Processing in Continuation
Mode
Error Message
Error Cause
Memory Access Error
(Address: H’nnnnnnnn)
Access to a memory area that has On memory write, nothing is
written; on memory read, all bits
not been allocated
Write to a memory area having the are read as 1.
write-protected attribute
Read from a memory area having
the read disable attribute
Access to an area where memory
data do not exist
Access to a control register in an
invalid size
Illegal Operation
Zero division executed by the DIV1 Operates in the same way as the
instruction
actual device operation.
Writing zero by the SETRC
instruction
Illegal DSP Operation
Shift of more than 32 bits executed
by the PSHA instruction
Shift of more than 16 bits executed
by the PSHL instruction
Invalid DSP Instruction Code Invalid DSP instruction code
TLB Multiple Hit
Always stops.
Hit to multiple TLB entries at MMU Undefined.
address translation (only for the
SH-3, SH-3E, and SH3-DSP
series)
When a simulation error occurs in the stop mode, the simulator/debugger returns to the command
input wait state after stopping instruction execution and displaying the error message. When a
memory access error occurs, the address where the error occurred is also displayed. Table 2.11
lists the states of the program counter (PC) at a simulation error stop. The status register (SR)
value does not change at a simulation error stop.
33
SuperH™ RISC engine Simulator/Debugger User’s Manual
Table 2.11 Register States at Simulation Error Stop
Error Message
PC Value
Memory Access Error •
When an instruction is read:
⎯ SH2-DSP and SH3-DSP series
The third instruction address before the instruction that caused the
error.
⎯ SH-1, SH-2, SH-2E, SH-3, SH-3E, and SH-4 series
The instruction address before the instruction that caused the error.
The slot address if an error occurs when a branch destination is
read.
•
When an instruction is executed:
The instruction address following the instruction that caused the error.
Illegal Operation
The instruction address following the instruction that caused the error.
Illegal DSP Operation The second instruction address following the instruction that caused the
error.
Invalid DSP
Instruction Code
The second instruction address following the instruction that caused the
error.
TLB Multiple Hit
The address of the instruction that caused the error.
Use the following procedure when debugging programs that include instructions that generate
simulation errors.
1. First execute the program in the stop mode and confirm that there are no errors except those in
the intended locations.
2. After confirming the above, execute the program in the continuation mode.
Note: If an error occurs in the stop mode and simulation is continued after changing the
simulator/debugger mode to the continuation mode, simulation may not be performed
correctly. When restarting simulation, always restore the register contents (general, control,
and system registers) and the memory contents to the state prior to the occurrence of the
error.
34
SuperH™ RISC engine Simulator/Debugger User’s Manual
Break Due to a Trace Buffer Overflow: After the [Break] mode is specified with [Trace Buffer
Full Handling] in the [Trace Acquisition] dialog box, the simulator/debugger stops execution
when the trace buffer becomes full. The following message is displayed in the [Output] window
when execution is stopped.
Trace Buffer Full
Break Due to Execution of the SLEEP Instruction: When the SLEEP instruction is executed
during instruction execution, the simulator/debugger stops execution. The following message is
displayed in the [Output] window when execution is stopped.
Sleep
Note: When restarting execution, change the PC value to the instruction address at the restart
location.
Break Due to the [STOP] Button: Users can forcibly terminate execution by clicking the
[STOP] button during instruction execution. The following message is displayed in the [Output]
window when execution is stopped.
Stop
Execution can be resumed with the GO or STEP command.
2.17
Floating-Point Data
Floating-point numbers can be used for the following real-number data, which makes floatingpoint data processing easier. The following data can be specified for floating-point data:
• Data when the break type is set to [Break Data] or [Break Register] in the [Select Break Type]
dialog box
• Data in the [Memory] window
• Data in the [Fill Memory] dialog box
• Data in the [Search Memory] dialog box
• Input data in the [Register] dialog box
The floating-point data format conforms to the ANSI C standard.
35
SuperH™ RISC engine Simulator/Debugger User’s Manual
In simulator/debugger, the rounding mode depends on the debugging platform as shown below:
Debugging Platform
[Round Mode]
SH-3, SH3-DSP series, SH-4 series, or SH4A-series
Round to Zero (RZ)
Others
Round to Nearest (RN)
If a denormalized number is specified for binary-to-decimal or decimal-to-binary conversion, it is
converted to zero in RZ mode, and left as a denormalized number in RN mode. If an overflow
occurs during decimal-to-binary conversion, the maximum floating-point value is returned in RZ
mode, and the infinity is returned in RN mode.
2.18
Display of Function Call History
The simulator/debugger displays the function call history in the [Stack Trace] window when
simulation stops, which enables program execution flow to be checked easily. Selecting a function
name in the [Stack Trace] window displays the corresponding source program in the [Editor]
window. This allows the function that has called the current function to also be checked.
The displayed function call history is updated in the following cases:
• When simulation stops due to the break conditions described in section 2.16, Break Conditions.
• When register values are modified while simulation stops due to the above break conditions.
• While single-step execution is performed.
For details, refer to section 17.15, Viewing the Function Call History in the High-performance
Embedded Workshop V.4.03 User’s Manual.
36
SuperH™ RISC engine Simulator/Debugger User’s Manual
2.19
Performance Measurement
The simulator/debugger has the profiler function and performance analysis function for
performance measurement of the user program.
2.19.1
Profiler
The profiler function displays the memory address and size allocated to functions and global
variables, the number of function calls, and the profile data for the entire user program. The
profile data to be displayed depends on the CPU.
Profile information is displayed in list, tree, and chart formats.
Profile information is useful in optimizing user programs by reducing the size and putting the most
frequently called functions in-line.
When using the profile information saved in a file, it is possible to optimize user programs based
on dynamic information using the optimizing linkage editor.
For details, refer to section 3.6, Viewing the Profile Information, and description of PROfile in
section 4.2.4, Optimize Option in the Optimizing Linkage Editor User's Manual.
2.19.2
Performance Analysis
The performance analysis function displays the number of execution cycles and function calls for
the specified function in the user program. Since performance data for only the specified function
is acquired, faster simulation is possible. For details, refer to section 3.7, Analyzing Performance.
37
SuperH™ RISC engine Simulator/Debugger User’s Manual
2.20
Pseudo-Interrupts
The simulator/debugger can generate pseudo-interrupts during simulation in the following two
ways:
1. Pseudo-interrupts generated by satisfaction of break conditions
A pseudo-interrupt can be generated using a break command to specify [Interrupt] as the action
when a break condition is satisfied. For details, refer to section 3.4, Using the
Simulator/Debugger Breakpoints.
2. Pseudo-interrupts generated from windows
A pseudo-interrupt can be generated by clicking a button in the [Trigger] or [GUI I/O] window.
For details, refer to section 3.9, Generating a Pseudo-Interrupt Manually.
If another pseudo-interrupt occurs between a pseudo-interrupt occurrence and its acceptance, only
the interrupt that has a higher priority can be processed.
3. Break by pseudo-interrupts
The user can select whether or not to cause a break when a pseudo-interrupt occurs. This can
be set in the [Simulator System] dialog box or by the EXEC_STOP_SET command.
Note: Whether an interrupt is accepted is determined by the specifications of the CPU for the
selected debugging platform. Note however that when H'11 is specified as the priority
level of an interrupt, that interrupt is always accepted. The simulator/debugger does not
simulate the operation of the interrupt controller.
38
SuperH™ RISC engine Simulator/Debugger User’s Manual
2.21
Coverage
The simulator/debugger acquires instruction coverage information during instruction execution
within the measurement range specified by the user.
This address range can either be a range entered directly by the user or through a source file, in
which it covers several ranges dedicated for the functions.
The state of each instruction execution can be monitored through the instruction coverage
information. In addition, this information can be used to determine which part of a program has
not been executed.
The [Coverage] window displays the acquired instruction coverage information:
The instruction coverage information can be displayed in the [Editor] window by highlighting the
column corresponding to the source line of the executed instruction.
The statistic of the instruction executed within a range, or a function is also displayed, in
percentage. This gives the user a clear idea how much the program has been executed.
The instruction coverage information can be saved in or loaded from a file. Only a file in
the .COV format can be loaded.
For details, refer to section 3.8, Acquiring Code Coverage.
39
SuperH™ RISC engine Simulator/Debugger User’s Manual
40
SuperH™ RISC engine Simulator/Debugger User’s Manual
Section 3 Debugging
This section describes the simulator/debugger operations and their related windows and dialog
boxes.
For details on the functions common to the HEW listed below, refer to the HEW help information.
⎯ Preparations for Debugging
⎯ Viewing a Program
⎯ Operating Memory
⎯ Displaying Memory Contents as Waveforms
⎯ Displaying Memory Contents as an Image
⎯ Modifying the Memory Contents
⎯ Viewing the I/O Memory
⎯ Looking at Registers
⎯ Executing Your Program
⎯ Viewing the Current Status
⎯ Synchronizing Multiple Debugging Platforms
⎯ Debugging with the Command Line Interface
⎯ Elf/Dwarf2 Support
⎯ Looking at Labels
41
SuperH™ RISC engine Simulator/Debugger User’s Manual
3.1
Creating the Workspace for Simulator/Debugger
To use the simulator/debugger, a workspace for the simulator/debugger must be created. This
section only describes the procedures specific to the simulator/debugger. For details, refer to the
HEW help.
3.1.1
Selecting a Debugging Platform
When you create a new workspace, the dialog box shown below appears. Specify the debugging
platform (depending on the CPU type, endian, and simulator type) in step 7.
Figure 3.1 Debugger Target Setting Display (Step 7)
42
SuperH™ RISC engine Simulator/Debugger User’s Manual
[Targets]
Sets the debugger targets. Select (by checking) the debugger targets. No
selection or a selection of more than one target is possible.
[Target type]
Specifies the type of the targets displayed in [Targets].
Note:
The endian type selected in step 2 will be applied to the compiler and assembler
settings. This is not dependent on the endian type of the debugger target selected in
step 7. In step 1, [SH-2A] not having the FPU or [SH2A-FPU] having the FPU can be
selected. Even if you have selected [SH-2A] in step 1, you need to select the SH2AFPU simulator in step 7 because the simulator/debugger only supports the SH2A-FPU.
43
SuperH™ RISC engine Simulator/Debugger User’s Manual
3.1.2
Setting up a Workspace for the Simulator/Debugger
Set up the workspace for the simulator/debugger in step 8.
Figure 3.2 Debugger Option Setting Display (Step 8)
44
[Configuration name]
By default, the HEW generates two configurations: [Release] and
[Debug]. If a debugger target has been selected, a configuration for
the selected target is also generated (an abbreviation including the
target name). This configuration name can be changed in
[Configuration name].
[Detail options]
Sets the debugger target options. To modify an option, select [Item]
and click [Modify]. If the selected item cannot be modified,
[Modify] remains gray even when [Item] is selected.
SuperH™ RISC engine Simulator/Debugger User’s Manual
[Simulator I/O]
Simulation for standard I/O or file I/O
from the user program is enabled ([Enable])
or disabled ([Disable]).
[Simulator I/O addr.]
Address for the above simulated I/O.
[On-chip ROM mode] Internal ROM capacity (SH2A-FPU only).
Disable:
Internal ROM is disabled
Enable (128K byte):
128 Kbytes
Enable (256K byte):
256 Kbytes
Enable (512K byte):
512 Kbytes
Enable (1M byte):
1 Mbytes
Enable (2M byte):
2 Mbytes
[Bus mode]
Currently cannot be used by the
simulator/debugger.
45
SuperH™ RISC engine Simulator/Debugger User’s Manual
3.2
Modifying the Simulator/Debugger Settings
This section describes how to modify the simulator system, memory map, and memory resource
settings after the simulator/debugger is started.
3.2.1
Modifying the Simulator System
The [System] tab in the [Simulator System] dialog box is used to modify the location to start the
simulated I/O or execution mode.
Choose [Setup -> Simulator -> System...] or click the [Simulator System] toolbar button
open the [System] tab in this dialog box.
Figure 3.3 Simulator System Dialog Box (System Tab)
46
to
SuperH™ RISC engine Simulator/Debugger User’s Manual
The following items can be specified in this dialog box:
[CPU]
Current CPU. (The CPU must be specified in the [Debug Settings] dialog box.)
For the SH2-DSP (SH7410), select [Internal Mode] or [External Mode].
For SH2-DSP (SH7065), one of the followings can be selected:
[ROM Disable/Fast Mode] Internal ROM disabled/fast access mode
[ROM Disable/Slow Mode] Internal ROM disabled/slow access mode
[ROM Enable/Fast Mode]
Internal ROM enabled/fast access mode
[ROM Enable/Slow Mode] Internal ROM enabled/slow access mode
For SH2-DSP (Core), either of the followings can be selected:
[ROM Disable]
Internal ROM disabled mode
[ROM Enable]
Internal ROM enabled mode
[Bit size]
Address bus width fixed to 32 bits
[Endian]
Currently selected endian
[Clock Rate] This can be specified only for SH-4 series.
Specify the internal clock ratio when the external clock is assumed 1. (H’1 to H’10)
[Simulated I/O Address]
Start address of a simulated I/O that performs standard input/output
or file input/output processing from the user program.
[Enable]
Checking this box enables the simulated I/O.
[Response]
Window refresh timing; that is, how many instructions should be
executed between refresh operations (D'1 to D'2,147,483,647. The
default is D’40000).
[Execution Mode]
Whether the simulator/debugger stops or continues operation when a
simulation error occurs. An interrupt is assumed as a simulation error. It is
also possible to specify an action to take place when an interrupt occurs by
clicking the [Detail…] button.
[Stop]
Stops simulation.
[Continue] Continues simulation.
47
SuperH™ RISC engine Simulator/Debugger User’s Manual
[Step Unit]
This can be specified only for the SH-3, SH3-DSP series, and SH-4 series.
Select the status of the instruction executed when STEP command is
executed, and a PC break is satisfied.
[Stage]
Stops before instruction is executed.
Pipeline operation is not affected.
[Instruction]
Stops after instruction is executed.
Pipeline operation is affected, and as a result, the
number of effective cycles becomes incorrect.
Clicking the [OK] or [Apply] button stores the modified settings. Clicking the [Cancel] button
closes this dialog box without modifying the settings.
48
SuperH™ RISC engine Simulator/Debugger User’s Manual
3.2.2
Modifying the Memory Map and Memory Resource Settings
The [Memory] tab in the [Simulator System] dialog box is used to set and modify the memory
map and memory resource.
Figure 3.4 Simulator System Dialog Box (Memory Tab)
The following items can be specified in this dialog box:
[Memory Map]
Displays the memory type, start and end addresses, data bus width, and
the number of access cycles.
[Memory Resource]
Displays the access type and start and end addresses of the current
memory resource.
49
SuperH™ RISC engine Simulator/Debugger User’s Manual
[Memory Map] can be added, modified, or deleted using the following buttons:
Adds [Memory Map] items. Clicking this button opens the [Set Memory Map] dialog
box (figure 3.5), and memory map items can be added.
Modifies [Memory Map] items. Select an item to be modified in the list box and click
this button. The [Set Memory Map] dialog box (figure 3.5) opens and memory map
items can be modified.
Deletes [Memory Map] items. Select an item to be deleted in the list box and click
this button.
[Memory Resource] can be added, modified, or deleted using the following buttons:
Adds [Memory Resource] items. Clicking this button opens the [Set Memory
Resource] dialog box, and memory map items can be specified.
Modifies [Memory Resource] items. Select an item to be modified in the list box and
click this button. The [Set Memory Resource] dialog box opens and memory map
items can be modified.
Deletes [Memory Resource] items. Select an item to be deleted in the list box and
click this button.
[Memory Resource] is the same setting information as that of [Memory Resource] of the
[Debugger] sheet in the [SuperH RISC engine Standard Toolchain] dialog box. Modifications are
reflected on both items.
When there is a linkage list file (.map) output by the optimizing linkage editor, the memory
resource can be automatically allocated according to the memory map and linkage map
information. For details, refer to section 13.1.9, Automatically Allocating the Memory Resource,
in the High-performance Embedded Workshop V.4.03 User’s Manual.
50
SuperH™ RISC engine Simulator/Debugger User’s Manual
In the [Memory Map], the start address, end address, memory type, data bus width, read cycles,
and write cycles are displayed in that order. The memory types are as follows:
• SH-1, SH-2, SH-2E, SH2A-FPU, SH-3, and SH-3E
ROM (internal ROM), RAM (internal RAM), EXT (external memory), I/O (internal I/O)
• SH2-DSP (SH7410)/SH3-DSP
XROM (internal XROM), YROM (internal YROM), XRAM (internal XRAM), YRAM
(internal YRAM), EXT (external memory), I/O (internal I/O)
• SH2-DSP (SH7612)
XRAM (internal XRAM), YRAM (internal YRAM), INTRAM (internal RAM), EXT (external
memory), I/O (internal I/O)
• SH2-DSP (SH7065)
XRAM (internal XRAM), YRAM (internal YRAM), INTROM (internal ROM), EXT (external
memory), I/O (internal I/O)
• SH2-DSP (Core)
XRAM (internal XRAM), YRAM (internal YRAM), INTROM (internal ROM), INTRAM
(internal RAM), EXT (external memory), I/O (internal I/O)
• SH3-DSP (Core)
XRAM (internal XRAM), YRAM (internal YRAM), URAM (user RAM), EXT (external
memory), I/O (internal I/O)
• SH-4/SH-4 (SH7750R)
NORMAL (normal memory), INTRAM (internal RAM), I/O (internal I/O)
• SH-4BSC
NORMAL (normal memory), MPX (Multiplex), BCSRAM (byte-control SRAM), BSTROM
(burst ROM and burst count), DRAM (DRAM), SDRAM (synchronous DRAM), INTRAM
(internal RAM), I/O (internal I/O)
• SH-4A
LRAM (internal RAM), URAM (user RAM), EXT (external memory), I/O (internal I/O)
• SH4AL-DSP
XRAM (internal XRAM), YRAM (internal YRAM), URAM (user RAM), EXT (external
memory), I/O (internal I/O)
51
SuperH™ RISC engine Simulator/Debugger User’s Manual
Note: For the SH-4BSC, the following must be noted:
⎯ The access cycle count is displayed as --.
⎯ Memory map entries cannot be newly created or canceled. Therefore, only the
[Modify] button can be used for [Memory Map].
⎯ For the internal RAM and I/O, the memory map entries cannot be modified. To
enable or disable the internal RAM, use the ORA bit of the CCR control register.
⎯ The memory map contents depend on the BSC settings in addition to the settings
in the [Memory Map Modify] dialog box. If the memory map contents cannot be
determined due to BSC incorrect settings, this dialog box shows ?????? for memory
types and ?? for the bus width.
[Memory Map] and [Memory Resource] can be reset to the default value by the
button.
Clicking the [OK] or [Apply] button stores the modified settings. Clicking the [Cancel] button
closes this dialog box without modifying the settings.
52
SuperH™ RISC engine Simulator/Debugger User’s Manual
3.2.3
Set Memory Map Dialog Box
The [Set Memory Map] dialog box specifies the memory map of the target CPU.
The contents displayed in this dialog box depend on the target CPU. The simulator/debugger uses
the specified data to calculate the number of cycles for memory accesses.
Figure 3.5 Set Memory Map Dialog Box
53
SuperH™ RISC engine Simulator/Debugger User’s Manual
The following items are specified:
[Memory type]
Memory type
[Begin address]
Start address of the memory corresponding to the memory type
[End address]
End address of the memory corresponding to the memory type
[Data bus size]
Memory data bus width
[Read state count]
Number of cycles (“states”) for read access to the specified type of
memory
[Write state count]
Number of cycles (“states”) for write access to the specified type of
memory
For the SH-4 series, [Begin address] and [End address] cannot be modified. Specify [Memory
type] and [Data bus size].
In addition, for the SH-4 series, clicking the [Set state...] button opens the [Set State] dialog box
(section 3.2.4), and the number of wait-state cycles to be inserted in areas 0 to 7 can be specified.
The specified values correspond to the values in the WCR1 and WCR2 control registers.
In terms of the memory resources of the SH-4 series and SH2A-FPU, note the following.
•
[Memory type] cannot be modified.
•
Unless the selected memory type is EXT, [Begin address] and [End address] are not
modifiable.
•
For the SH-4A series, [Write state count] is not modifiable, regardless of the selected type of
memory.
•
When an instruction-unit simulator is in use, settings for numbers of read cycles are invalid
because the simulator/debugger handles one instruction per cycle.
Note: The memory map setting for the area allocated to a system memory resource cannot be
deleted or modified. First delete the system memory resource allocation on the [Memory]
tab of the [Simulator System] dialog box, then delete or modify the memory map setting.
Clicking the [OK] button stores the settings. Clicking the [Cancel] button closes this dialog box
without modifying the settings.
54
SuperH™ RISC engine Simulator/Debugger User’s Manual
3.2.4
Set State Dialog Box
The [Set State] dialog box specifies the wait-state cycles to be inserted in each area. This dialog
box is provided only for the SH-4 series.
Note that only the normal memory is supported for the SH-4/SH-4 (SH7750R).
The [Set State] dialog box contents depend on the memory type allocated to the target area. The
values set in this dialog box are also set in the WCR1 and WCR2 control registers.
Normal Memory, Burst ROM, and Byte-Control SRAM:
Figure 3.6 Set State Dialog Box (Normal Memory)
[Inserted Idle Cycle]
Number of idle cycles to be inserted when the access type changes
from read to write, or when the access area changes (corresponds to the
AnIW in WCR1)
[Inserted Wait Cycle]
Number of wait-state cycles to be inserted in all accesses (corresponds
to the AnW in WCR2)
55
SuperH™ RISC engine Simulator/Debugger User’s Manual
DRAM:
Figure 3.7 Set State Dialog Box (DRAM)
[Inserted Idle Cycle]
Number of idle cycles to be inserted when the access type changes
from read to write, or when the access area changes (corresponds to the
AnIW in WCR1)
[CAS Assertion Width]
CAS assertion width (corresponds to the AnW in WCR2)
SDRAM:
Figure 3.8 Set State Dialog Box (SDRAM)
[Inserted Idle Cycle]
Number of idle cycles to be inserted when the access type changes
from read to write, or when the access area changes (corresponds to the
AnIW in WCR1)
[CAS Latency Cycle]
Number of CAS latency cycles (corresponds to AnW in WCR2)
56
SuperH™ RISC engine Simulator/Debugger User’s Manual
MPX:
Figure 3.9 Set State Dialog Box (MPX)
[Inserted Idle Cycle]
Number of idle cycles to be inserted when the access type changes
from read to write, or when the access area changes (corresponds to the
AnIW in WCR1)
[First Read Cycle]*
Number of cycles to be inserted in the first cycle for the read access
[First Write Cycle]*
Number of cycles to be inserted in the first cycle for the write access
[Second After Cycle]*
Number of cycles to be inserted in the second and the following cycles
for the burst transfer
Note: The items marked with * correspond to the AnW in WCR2.
57
SuperH™ RISC engine Simulator/Debugger User’s Manual
3.2.5
Set Memory Resource Dialog Box
The [Set Memory Resource] dialog box sets and modifies memory resources.
Figure 3.10 Set Memory Resource Dialog Box
The following items are specified:
[Begin Address] Start address of the memory area to be allocated
[End Address]
End address of the memory area to be allocated
[Attribute]
Access type
[Read]
[Write]
[Read/Write]
Read only
Write only
Readable/writable
Click the [OK] button after specifying the [Begin Address], [End Address], and [Attribute].
Clicking the [Cancel] button closes this dialog box without modifying the settings.
58
SuperH™ RISC engine Simulator/Debugger User’s Manual
Notes: 1. If memory resources are set, memory in the host computer will be used. If the user
allocates too much memory resources, operation of the host computer will be
extremely slow.
2. There are the following notes on memory resources for the SH2A-FPU and SH-4A
series:
3.3
a.
Memory resources can only be allocated on 64-kbyte boundaries. If memory
resource is allocated across a 64-kbyte boundary, this memory resource will be
aligned to 64-kbyte boundaries that include the specified memory range.
Similarly, address ranges for attributes are also allocated on 64-kbyte boundaries.
XRAM and YRAM are also allocated on 64-kbyte boundaries; thus the amount
of memory actually used must be within the range defined in the hardware
manual when specifying memory resource less than 64 kbytes.
b.
Do not clear the memory resources allocated as the I/O area at default. Otherwise,
the operation of the MMU or cache memory will be incorrect.
Simulating Peripheral Functions
The simulator/debugger is able to simulate peripheral functions by using DLL modules. This
section describes how to register the peripheral function simulation modules to enable the
simulation of individual peripheral functions, and how to set their configurations.
3.3.1
Registering Peripheral Function Simulation Modules
Peripheral function simulation modules can be registered in the [Set Peripheral Function
Simulation] dialog box, which is opened on initiation of the simulator/debugger.
Once a peripheral function simulation module has been registered in this dialog box, the simulated
peripheral function provided by that simulation module becomes available. The registered settings
cannot be modified after the simulator/debugger has fully started up. To change the peripheral
function simulation modules that are in use, restart the simulator/debugger to bring up this dialog
box.
59
SuperH™ RISC engine Simulator/Debugger User’s Manual
Figure 3.11 Set Peripheral Function Simulation Dialog Box
The following items are specified in this dialog box:
[Peripheral Functions]
[Enable All]
Enables all peripheral functions.
[Disable All]
Disables all peripheral functions.
[Detail…]
Opens the [Peripheral Module Configuration] dialog box, allowing
you to view information on the corresponding peripheral function, and
change the address where it starts and the interrupt-source information.
[Peripheral Clock Rate]
60
Shows information on the peripheral function simulation modules.
[Module Name] Names of peripheral functions to be simulated
[File Name]
Names of files holding peripheral function simulation
modules
Check the checkbox under [Module Name] to register the
corresponding peripheral function simulation module and make it
available.
The ratio between the peripheral clock and the internal clock (the
number of cycles of the internal clock corresponding to one cycle of the
peripheral clock) is specified here. The clock rate setting can be
selected as 1, 2, 3, 4, 6, 8, 12, 16, 24, or 32.
SuperH™ RISC engine Simulator/Debugger User’s Manual
Clicking the [OK] button makes the settings effective. Clicking the [Cancel] button closes this
dialog box without storing the settings.
If you do not wish this dialog box to be opened when the simulator/debugger is subsequently
initiated, check [Don’t show this dialog box].
3.3.2
Changing the Addresses of Peripheral Functions
The addresses of peripheral functions can be changed in the [Address] tab of the [Peripheral
Module Configuration] dialog box. To open this dialog box, select a peripheral function in
[Peripheral Functions] of the [Set Peripheral Function Simulation] dialog box and then press the
[Detail…] button.
Figure 3.12 Peripheral Module Configuration Dialog Box (Address Tab)
61
SuperH™ RISC engine Simulator/Debugger User’s Manual
The following items can be set or displayed in this dialog box:
[Module]
Name of the peripheral function supported by the selected peripheral
function simulation module
[Start Address]
Start address of the peripheral function selected in [Module]
[Register Address]
Names and addresses of registers of the peripheral function selected in
[Module]. It is not possible to change the register addresses.
Clicking the [OK] or [Set] button makes the settings effective. Clicking the [Cancel] button closes
this dialog box without storing the settings.
62
SuperH™ RISC engine Simulator/Debugger User’s Manual
3.3.3
Changing the Interrupt Source Information of Peripheral Functions
The interrupt source information of peripheral functions can be changed in the [Interrupt] tab of
the [Peripheral Module Configuration] dialog box. To open this dialog box, select a peripheral
function in [Peripheral Functions] of the [Set Peripheral Function Simulation] dialog box and then
press the [Detail…] button.
Figure 3.13 Peripheral Module Configuration Dialog Box (Interrupt Tab)
The following items can be displayed in this dialog box:
Interrupt Source:
INTEVT:
INTEVT/INTEVT2:
Vector Number:
Priority Register Address/
Bit Field Position:
Name of the interrupt source (or sources) supported by the
peripheral function
INTEVT value for SH-3, SH-4, and SH-4A series CPUs
INTEVT value and INTEVT2 value for SH3-DSP series CPUs
Interrupt vector number for other CPUs
Address of the interrupt priority register and positions of bits in
the register
63
SuperH™ RISC engine Simulator/Debugger User’s Manual
To change the interrupt-source information, open the [Set Interrupt Source Information] dialog
box by double-clicking on the line for the interrupt source to be changed.
Figure 3.14 Set Interrupt Source Information Dialog Box
The following items can be set or displayed in this dialog box:
Interrupt Source:
INTEVT:
INTEVT2:
Interrupt Vector Number:
Priority Register Address:
Priority Register Size:
Priority Register Bit Position:
Interrupt source name
INTEVT value for SH-3, SH-4, SH-4A, and SH3-DSP series
CPUs (when the prefix is omitted, values input are taken as
hexadecimal, and the display is in hexadecimal notation)
INTEVT2 value for SH3-DSP series CPUs only
(when the prefix is omitted, values input are taken as
hexadecimal, and the display is in hexadecimal notation)
Interrupt vector number for other CPUs
(when the prefix is omitted, values input are taken as decimal,
and the display is in decimal notation)
Address of the interrupt priority register
Size of the interrupt priority register
Positions of bits in the interrupt priority register
Clicking the [OK] button makes the settings effective. Clicking the [Cancel] button closes this
dialog box without storing the settings.
64
SuperH™ RISC engine Simulator/Debugger User’s Manual
3.3.4
Changing the Address of the Bank Control Register (SH2A-FPU Only)
The following commands are used to display and change the addresses of the bank control register
(IBCR) and the bank number register (IBNR) for products of the SH2A-FPU series.
REGISTER_ADDRESS_GET command:
Displays the address of the bank control register
REGISTER_ADDRESS_SET command:
Sets the address of the bank control register
For details on the commands, refer to the simulator help.
3.3.5
Allocating Memory Resources to the Interrupt Priority Register
The peripheral function simulation module does not allocate the interrupt priority register (IPR) to
a location in memory. Allocate the memory resource for the interrupt priority register (IPR)
through user operation. For details on the setting of memory resources, refer to section 3.2.2,
Modifying the Memory Map and Memory Resource Settings.
3.3.6
Viewing the Names of Connected Peripheral Functions
After the simulator/debugger has been initiated, [Peripheral Modules] on the [Platform] sheet of
the [Status] window shows the names of the peripheral functions that are connected.
65
SuperH™ RISC engine Simulator/Debugger User’s Manual
3.4
Using the Simulator/Debugger Breakpoints
Sophisticated breakpoint functions are available in the simulator/debugger in addition to the HEW
standard PC breakpoints. The user can specify break conditions and actions after a break condition
is satisfied, and can display the breakpoints set.
3.4.1
Listing the Breakpoints
Choose [View -> Code -> Eventpoints] or click the [Eventpoints] toolbar button
[Event] window, which lists the breakpoints set.
Figure 3.15 Event Window
66
to open the
SuperH™ RISC engine Simulator/Debugger User’s Manual
The following items are displayed:
[Type]
Break types
[BP]: PC break
[BA]: Access break
[BD]: Data break
[BR]: Register break (register name)
[BS]: Sequential break
[BCY]: Number-of cycles break
[State]
Whether the breakpoint is enabled or disabled.
[Enable]: Valid
[Disable]: Invalid
[Condition] Condition that causes a break. The contents to be displayed depend on the type of the
break. When the type of the break is BR, the register name is displayed, and when
the type of the break is BCY, the number of cycles is displayed.
BP: PC = Program counter (Corresponding file name, line, and symbol name)
BA: Address = Address (Symbol name)
BD: Address = Address (Symbol name)
BR: Register = Register name
BS: PC = Program counter (Corresponding file name, line, and symbol name)
BCY: Cycle = Number of cycles (displayed in hexadecimal)
[Action]
Operation of the simulator/debugger when a break condition is satisfied.
[Stop]: Execution halts
[File Input] (file name) [File state]: Memory data is read from file
[File Output] (file name) [File state]: Memory data is written to file
[Interrupt] (Interrupt type/priority): Interrupt processing.
Only for the SH3-DSP, (Interrupt type 1,
interrupt type 2/priority) is displayed.
Conditions specifying [Stop] for [Action] is displayed on the [Software Break] tab and the
conditions specifying another action type is on the [Software Event] tab.
67
SuperH™ RISC engine Simulator/Debugger User’s Manual
3.4.2
Setting a Breakpoint
Selecting [Add...] from the pop-up menu in the [Event] window opens the [Select Break Type]
dialog box, which allows the user to set a breakpoint.
Two further dialog boxes can be opened from the [Select Break Type] dialog box: [Set xx
Condition] for specifying a break condition and [Set xx Action] for specifying an action to take
when the break condition is satisfied. To open the [Select Break Type] dialog box from the
[Event] window when you wish to select [Stop] as [Action type] in the [Select Break Type] dialog
box, select [Add...] from the pop-up menu on the [Software Break] tab; if you wish to select
another action type, select [Add...] from the pop-up menu on the [Software Event] tab.
68
SuperH™ RISC engine Simulator/Debugger User’s Manual
Selecting a Break Type:
Selecting [Add...] from the popup menu on the [Event] window opens the [Select Break Type]
dialog box. Select a break type in the [Break type] combo box of this dialog box.
Figure 3.16 Select Break Type Dialog Box
The following options are available:
[Break type]
[PC Breakpoint]: Breakpoint set at an instruction
[Break Access]: Break on access to a memory range
[Break Data]: Break on detection of a memory value
[Break Register]: Break on detection of a register value
[Break Sequence]: Sequential breakpoints
[Break Cycle]: Break after the specified number of cycles
Setting Break Conditions:
Click on [Detail…] after selecting the break type in the [Select Break Type] dialog box. This
opens a dialog box that allows you to set conditions for the selected break type.
•
[PC Breakpoint]
Figure 3.17 Set PC Breakpoint Condition Dialog Box
69
SuperH™ RISC engine Simulator/Debugger User’s Manual
Up to 1024 PC-breakpoint conditions can be specified.
[Address]: Address of the instruction where a break will occur
[Count]:
Number of times that the specified instruction is fetched
(1 to 16,383; the default value is 1; if the prefix is omitted, values input
are taken as decimal, and the display is in decimal notation).
•
[Break Access]
Figure 3.18 Set Access Break Condition Dialog Box
Up to 1024 access break conditions can be specified.
[Begin address]:
First address of the range of memory for which access
generates a break
[End address]:
Last address of the range of memory for which access
generates a break (if no data is input, the range corresponds to
the first address alone)
[Access type]:
Read, write, or read/write
70
SuperH™ RISC engine Simulator/Debugger User’s Manual
•
[Break Register]
Figure 3.19 Set Register Break Condition Dialog Box
Up to 1024 register break conditions can be specified.
[Register]: Register name for which the break condition is specified
[Option]:
Match or mismatch with the data
[Data]:
Data value used in the break condition (if no data is input here, a break
will occur whenever data is written to the register)
[Data mask]: Mask condition (specifying 0 for a bit masks the bit)
[Size]:
Data size
71
SuperH™ RISC engine Simulator/Debugger User’s Manual
•
[Break Sequence]
Figure 3.20 Set Break Sequence Condition Dialog Box
Only one sequential break condition can be specified.
[Address1] to [Address8]:
Addresses that must be passed as conditions to
generate the break (not all of the eight breakpoints
have to be set).
72
SuperH™ RISC engine Simulator/Debugger User’s Manual
•
[Break Cycle]
Figure 3.21 Set Number-of-Cycles Break Condition Dialog Box
Up to 1024 number-of-cycles break conditions can be specified.
[Cycle]:
Number of cycles required to cause a break (H'1 to H'FFFFFFFF).
The condition will be satisfied by execution for the number of cycles in
the [Cycle] setting × n.
However, the specified number of cycles may differ from the number
of cycles on which the condition is satisfied.
[Count]:
Number of times the break will occur
[ALL]: The break will occur whenever the condition is satisfied.
[Times]: The break will only occur up to the number of times specified as
[Times] (1 to 65535; if the prefix is omitted, values input are taken as
hexadecimal, and the display is in hexadecimal notation).
73
SuperH™ RISC engine Simulator/Debugger User’s Manual
•
[Break Data]
Figure 3.22 Set Data Break Condition Dialog Box
Data break conditions should be set as follows.
Up to 1024 data break conditions can be specified.
[Address]: Address in memory for which the break condition is specified
[Option]:
How the data value is used to form the condition that must be satisfied
for break generation
[Equal]:
The value written to memory matches [Data].
[Not equal]:
The value written to memory does not match [Data].
[Inverse sign]*: The sign of the value written to memory is the inverse of that
for the previous value.
[Difference]*: The difference between the current and previous values
written to memory exceeds [Data].
[Data]:
Data value used in the break condition
[Data mask]: Mask condition (specifying 0 for a bit masks the bit). This option is
only available when [Equal] or [Not equal] has been selected.
[Size]:
Data size
[Sign]:
Sign of the data.
This option is only available when [Difference] has been selected.
Note: Since [Inverse sign] and [Difference] require comparison of the data with the value
previously written to memory, the break will never occur on the first test after a reset or
break generation when either of these conditions has been selected.
74
SuperH™ RISC engine Simulator/Debugger User’s Manual
•
Point for Caution
For the SH3-DSP series, specify values within the range of addresses H'A5000000 to
H'A501FFFF (X and Y memory virtual addresses, corresponding to physical addresses
H'05000000 to H'0501FFFF) as [Begin address] and [End address] in [Break Access] and as
[Address] in [Break Data] to set up a break condition that corresponds to access to X or Y memory
by the MOVX or MOVY instruction.
Selecting an Action in Response to a Break:
If you click on [OK] after setting break conditions in the dialog boxes described on the preceding
pages, the [Select Break Type] dialog box is opened again. Select an action type in the [Action
type] combo box of this dialog box.
Figure 3.23 Select Break Type Dialog Box
The following options are available:
[Stop]:
[File Input]:
[File Output]:
[Interrupt]:
Execution of the user program is stopped when the condition is satisfied.
The contents of a specified file are read out and written to the specified memory
when the condition is satisfied.
The contents of the specified memory are read out and written to the specified
file when the condition is satisfied.
Interrupt processing proceeds when the condition is satisfied.
75
SuperH™ RISC engine Simulator/Debugger User’s Manual
Setting Details of the Action:
Click on [Detail…] after selecting the action type in the [Select Break Type] dialog box. This
opens a dialog box that allows you to set details of the selected action.
•
[File Input]
Figure 3.24 Set File Input Action Dialog Box
When the condition is satisfied, data are read out from the specified file and written to the
specified location in memory.
[Input file]: File from which data are to be read out. When reading out by the
simulator/debugger reaches the end of the file, reading out
recommences from the beginning of the same file.
[Address]: Memory address to which data should be written.
[Data size]: Size of each data value in bytes (1/2/4/8).
[Count]:
Number of values to be written (H’1 to H’FFFFFFFF; when the prefix
is omitted, values input are taken as decimal, and the display is in
decimal notation).
76
SuperH™ RISC engine Simulator/Debugger User’s Manual
•
[File Output]
Figure 3.25 Set File Output Action Dialog Box
When the condition is satisfied, the contents at the specified location in memory are written to the
specified file.
[Output file]: Data file to which data are written.
[Append]: Selects whether the data should be appended to the file if an existing
file is specified as the output file.
[Address]: Memory address to read data from.
[Data size]: Size of each data value to be read (1/2/4/8).
[Count]:
Number of values to be read (H’1 to H’FFFFFFFF; when the prefix is
omitted, values input are taken as decimal, and the display is in decimal
notation).
77
SuperH™ RISC engine Simulator/Debugger User’s Manual
•
[Interrupt]
Figure 3.26 Set Interrupt Action Dialog Box
When the condition is satisfied, interrupt processing proceeds. For details, refer to section 2.20,
Pseudo-Interrupts.
[Interrupt type 1]:
Sets the following values for each CPU (when the prefix is
omitted, values input are taken as hexadecimal, and the
display is in hexadecimal notation)
• SH-1, SH-2, and SH2-DSP series
Interrupt vector number
• SH2A-FPU
Interrupt vector number
• SH-3, SH-4, and SH3-DSP series
INTEVT (H'0 to H'FFF)
• SH-4A series
INTEVT (H'0 to H'3FFF)
[Interrupt type 2]:
Only selectable for the SH3-DSP series (when the prefix is
omitted, values input are taken as hexadecimal, and the
display is in hexadecimal notation): INTEVT2 (H'0 to H'FFF)
[Priority]
Interrupt priority (H'0 to H'11; when the prefix is omitted,
values input are taken as hexadecimal, and the display is in
hexadecimal notation).
When H'10 is specified, the interrupt is always accepted
regardless of the value of the I bit value in SR, but is masked
by the BL bit in SR. When H'11 is specified, the interrupt is
always accepted regardless of the I and BL bit values in SR.
78
SuperH™ RISC engine Simulator/Debugger User’s Manual
•
Point for Caution
When the same file is specified for multiple [File Input] actions, the simulator/debugger will read
data from the file in the order of condition satisfaction. When the same file is specified for
multiple [File Output] actions, the simulator/debugger will write data to the file in the order of
condition satisfaction. However, when the same file is specified for [File Input] and [File Output],
the only valid action is that for the first condition to be satisfied.
3.4.3
Modifying Breakpoints
Select a breakpoint to be modified, and choose [Edit...] from the pop-up menu to open the [Select
Break Type] dialog box, which allows the user to modify the break conditions. The [Edit...] menu
is only available when one breakpoint is selected.
3.4.4
Enabling a Breakpoint
Select a breakpoint and choose [Enable] from the pop-up menu to enable the selected breakpoint.
3.4.5
Disabling a Breakpoint
Select a breakpoint and choose [Disable] from the pop-up menu to disable the selected breakpoint.
When a breakpoint is disabled, the breakpoint will remain in the list, but a break will not occur
when the specified conditions have been satisfied.
3.4.6
Deleting a Breakpoint
Select a breakpoint and choose [Delete] from the pop-up menu to remove the selected breakpoint.
To retain the breakpoint but not have it cause a break when its conditions are met, use the
[Disable] option (see section 3.4.5, Disabling a Breakpoint).
3.4.7
Deleting All Breakpoints
Choose [Delete All] from the pop-up menu to remove all breakpoints.
79
SuperH™ RISC engine Simulator/Debugger User’s Manual
3.4.8
Viewing the Source Line for a Breakpoint
Select a breakpoint and choose [Go to Source] from the pop-up menu to open the [Source] or
[Disassembly] window at the address of the breakpoint. The [Go to Source] menu is only available
when one breakpoint is selected.
3.4.9
Closing Input or Output File
Select a breakpoint and choose [Close File] from the pop-up menu to close the selected [File
Input] or [File Output] data file and to reset the address to read the file.
3.4.10
Closing All Input and Output Files
Choose [Close All Files] from the pop-up menu to close all [File Input] and [File Output] data
files and to reset the address for reading the file.
80
SuperH™ RISC engine Simulator/Debugger User’s Manual
3.5
Viewing Trace Information
The simulator/debugger acquires the results of each instruction execution as trace information and
displays it in the [Trace] window. The conditions for the trace information acquisition can be
specified in the [Trace Acquisition] dialog box.
3.5.1
Opening the Trace Window
To open the [Trace] window, choose [View -> Code -> Trace] or click the [Trace] toolbar button
.
3.5.2
Specifying Trace Acquisition Conditions
After the [Trace] window opens, specify the trace acquisition conditions in the [Trace Acquisition]
dialog box. To open this dialog box, choose [Acquisition...] from the pop-up menu.
Figure 3.27 Trace Acquisition Dialog Box
81
SuperH™ RISC engine Simulator/Debugger User’s Manual
This dialog box specifies the conditions for trace information acquisition.
[Trace Start/Stop]
[Disable]
[Enable]
Disables trace information acquisition.
Enables trace information acquisition.
[Instruction Type]
[Instruction]
[Subroutine]
Acquires trace information for all instructions.
Acquires trace information for the subroutine instructions only.
[Trace Buffer Full Handling]
[Continue]
Continues acquiring trace information even if the trace information
acquisition buffer becomes full.
[Break]
Stops execution when the trace information acquisition buffer becomes full.
The trace buffer capacity can be selected from 1 Kbyte (1,024 records), 4 Kbytes (4,096 records),
16 Kbytes (16,384 records), 32 Kbytes (32,768 records), 64 Kbytes (65,536 records), 128 Kbytes
(131,072 records), or 256 Kbytes (262,144 records) in [Trace Capacity].
Clicking the [OK] button stores the settings. Clicking the [Cancel] button closes this dialog box
without modifying the settings.
82
SuperH™ RISC engine Simulator/Debugger User’s Manual
3.5.3
Acquiring Trace Information
After trace acquisition is enabled, trace information is acquired during instruction execution. The
acquired information will be displayed in the [Trace] window. The displayed information items
depend on the target CPU as follows:
SH-1, SH-2, SH-2E, and SH2-DSP Series:
Figure 3.28 Trace Window (for SH-1, SH-2, SH-2E, and SH2-DSP Series)
This window displays the following trace information items:
[PTR]
Pointer in the trace buffer (0 for the last executed instruction)
[Cycle]
Total number of instruction execution cycles (cleared by pipeline reset)
[Address]
Instruction address
[Pipeline]
Pipeline execution status
Each symbol has the following meaning:
F: Instruction fetch (with memory access)
f: Instruction fetch (without memory access)
D: Instruction decode
E: Instruction execution
M: Memory access
W: Write back
P: DSP
83
SuperH™ RISC engine Simulator/Debugger User’s Manual
m: Multiplier execution
–: Stall inherent in the instruction
>: Split
<: Stall due to conflict
Refer to the software manual of each device for more information on
pipeline operation.
[Instruction]
Instruction mnemonic
[Access Data]
Data access information (display format: destination <- accessed data)
[Source]
C/C++ or assembly-language source programs
[Label]
Labels
SH-3 and SH-3E Series:
Figure 3.29 Trace Window (for SH-3 and SH-3E Series)
This window displays the following trace information items:
[PTR]
Pointer in the trace buffer (0 for the last executed instruction)
[Cycle]
Total number of instruction execution cycles (cleared by pipeline reset)
[Address Bus]
Data on the address bus
[Data Bus]
Data on the data bus
84
SuperH™ RISC engine Simulator/Debugger User’s Manual
[Code]
Instruction code
[No]
Instruction number (corresponds to execution number in each stage)
[Instruction]
Instruction mnemonic
[IF]
Instruction number that was fetched (enclosed by [ ] when the instruction did
not access memory)
[DE]
Instruction number that was decoded
[EX]
Instruction number that was executed
[MA]
Instruction number that accessed memory
[SW]
Instruction number that wrote back data
[Access Data]
Data access information (display format: destination <- accessed data)
[Source]
C/C++ or assembly-language source programs
[Label]
Labels
85
SuperH™ RISC engine Simulator/Debugger User’s Manual
SH3-DSP Series:
Figure 3.30 Trace Window (for SH3-DSP Series)
This window displays the following trace information items:
[PTR]
Pointer in the trace buffer (0 for the last executed instruction)
[Cycle]
Total number of instruction execution cycles (cleared by pipeline reset)
[Address]
Program counter value
[Code]
Instruction code
[IF]
Instruction number that was fetched (enclosed by [ ] when the instruction did
not access memory)
[DE]
Instruction number that was decoded
[EX]
Instruction number that was executed
[MA]
Instruction number that accessed memory
[SW]
Instruction number that wrote back data
[No]
Instruction number (corresponds to execution number in each stage)
[Instruction]
Instruction mnemonic
86
SuperH™ RISC engine Simulator/Debugger User’s Manual
[Access Data]
Data access information (display format: destination <- accessed data)
[Source]
C/C++ or assembly-language source programs
[Label]
Labels
SH-4 Series:
Figure 3.31 Trace Window (for SH-4 Series)
This window displays the following trace information items:
[PTR]
Pointer in the trace buffer (0 for the last executed instruction)
[Cycle]
Total number of instruction execution cycles (cleared by pipeline reset). The
CPU internal clock cycles are counted as execution cycles. The rates of the
external and internal clocks can be specified using the Clock Rate command.
[Address Bus]
Program counter value
[Code1]
Fetched code 1
[Code2]
Fetched code 2
The code currently decoded is marked with *. If two codes are executed in
parallel, the code fetched at the smaller address is marked with *.
[EX-EAS]
Instruction number that was executed (in the E stage), accessed memory
(in the A stage), or wrote back data (in the S stage) in the EX pipeline
87
SuperH™ RISC engine Simulator/Debugger User’s Manual
[LS-EAS]
Instruction number that was executed, accessed memory, or wrote back data
in the LS pipeline
[BR-EAS]
Instruction number that was executed, accessed memory, or wrote back data
in the BR pipeline
[FP-EXASD]
Instruction number that was executed, accessed memory, or wrote back data
in the FP pipeline (only for FSCA, FSRRA, FIPR, and FTRV instructions in
the X stage, and for FDIV and FSQRT instructions in the D stage)
[No]
Instruction number (corresponds to execution number in each stage)
[Address]
Executed instruction address
[Code]
Executed instruction code
[Instruction]
Executed instruction mnemonic
[Access Data]
Data access information (display format: destination <- accessed data)
[Source]
C/C++ or assembly-language source programs
[Label]
Labels
88
SuperH™ RISC engine Simulator/Debugger User’s Manual
SH2A-FPU and SH-4A Series:
Figure 3.32 Trace Window (SH-4A Series)
This window displays the following trace information items:
[PTR]
Pointer in the trace buffer (0 for the last executed instruction)
[Cycle]
Total number of instruction execution cycles (cleared by pipeline reset)
[Address]
Program counter value
[Code]
Executed instruction code
[Pipeline]
Pipeline execution status
Each symbol has the following meaning:
F: Instruction fetch
P: Instruction pre-decode (SH-4A series only)
D: Instruction decode
E: Instruction execution
M: Memory access
W: Write back
Refer to the software manual of each device for more information on
pipeline operation. When a functional simulator is in use, there is no pipeline
information. In this case, x will be displayed here. If the pipeline information
exceeds the display space (the right edge of the [Pipeline] column), the
display continues from the start (the left edge) of the column.
89
SuperH™ RISC engine Simulator/Debugger User’s Manual
[Instruction]
Executed instruction mnemonic
[Access Data]
Data access information (display format: destination <- accessed data)
[Source]
C/C++ or assembly-language source program
[Label]
Labels
90
SuperH™ RISC engine Simulator/Debugger User’s Manual
3.5.4
Searching for a Trace Record
Use the [Trace Search] dialog box to search for a trace record. To open this dialog box, choose
[Find...] from the pop-up menu.
Figure 3.33 Trace Search Dialog Box
This dialog box specifies the conditions for searching trace information. Specify a search item in
[Item] and search for the specified contents in [Value].
[PTR]
Pointer in the trace buffer (0 for the last executed instruction, specify in the
form of -nnn)
[Cycle]
Total number of instruction execution cycles
[Address]
Instruction address
[Instruction]
Instruction mnemonic
Clicking the [OK] button stores the settings and starts searching. Clicking the [Cancel] button
closes this dialog box without searching.
When a trace record that matches the search conditions is found, the line for the trace record will
be displayed in blue. When no matching trace record is found, a message dialog box will appear.
If a search operation is successful, choosing [Find Next] from the pop-up menu will move to the
next found item.
91
SuperH™ RISC engine Simulator/Debugger User’s Manual
3.5.5
Clearing the Trace Information
Choose [Clear] form the pop-up menu to empty the trace buffer that stores the trace information. If
more than one [Trace] window is open, all [Trace] windows will be cleared as they all access the
same buffer.
3.5.6
Saving the Trace Information in a File
Choose [Save...] from the pop-up menu to open the [Save As] dialog box, which allows the user to
save the contents of the trace buffer as a text file. A range can be specified based on [PTR]. Note
that this file cannot be reloaded into the trace buffer.
3.5.7
Viewing the Source File
The [Editor] window corresponding to the selected trace record can be displayed in the following
two ways:
• Select a trace record and choose [View Source] from the pop-up menu.
• Double-click a trace record
The [Editor] or [Disassembly] window opens and the selected line is marked with a cursor.
3.5.8
Trimming the Source
Choose [Trim Source] from he pop-up menu to remove the white space from the left side of the
source.
When the white space is removed, a check mark is shown to the left of the [Trim Source] menu.
To restore the white space, choose [Trim Source] while the check mark is shown.
92
SuperH™ RISC engine Simulator/Debugger User’s Manual
3.5.9
Analyzing Statistical Information
Choose [Statistic] from the pop-up menu to open the [Trace Statistic] dialog box and analyze
statistical information under the specified conditions.
Figure 3.34 Trace Statistic Dialog Box
This dialog box allows the user to analyze statistical information concerning the trace information.
The target of analysis is specified in [Item] and the input value or character string is specified by
[Start] and [End].
When [Default] is selected, the input value or character string cannot be specified as a range. To
specify a range, select [Range].
93
SuperH™ RISC engine Simulator/Debugger User’s Manual
[Set]
Adds a new condition to the current one
[New]
Creates a new condition
[Result]
Obtains the result of statistical information analysis
[Clear]
Clears all condition and results of statistical information analysis
Clicking the [Close] button closes this dialog box.
3.6
Viewing the Profile Information
The profile function enables function-by-function measurement of the performance of the
application program in execution. This makes it possible to identify parts of an application
program that degrade its performance and the reasons for such degradation.
The HEW displays the results of measurement in three windows, according to the method and
purpose of viewing the profile data.
3.6.1
Stack Information Files
The profile function allows the HEW to read the stack information files (extension: .SNI) which
are output by the optimizing linkage editor (ver. 7.0 or later). Each of these files contains
information related to the calling of static functions in the corresponding source file. Reading the
stack information file makes it possible for the HEW to display information related to the calling
of functions without executing the user application (i.e. before measuring the profile data).
However, this feature is not available when [Setting->Only Executed Functions] is checked in the
pop-up menu of the [Profile] window.
When the HEW does not read any stack information files, only the data on the functions executed
during measurement will be displayed by the profile function.
To make the linkage editor create a stack information file, choose [Build -> SuperH RISC engine
Standard Toolchain...], and select [Other] from the [Category] list box and check the [Stack
information output] box in the [Link/Library] sheet of the [Standard Toolchain] dialog box.
94
SuperH™ RISC engine Simulator/Debugger User’s Manual
Figure 3.35 Standard Toolchain Dialog Box (1)
95
SuperH™ RISC engine Simulator/Debugger User’s Manual
3.6.2
Profile Information Files
To create a profile information file, measure a profile data of the application program then choose
the [Output Profile Information Files…] menu option from the pop-up menu of the [Profile]
window and specify the file name.
This file contains information on the number of times functions are called and global variables are
accessed. The optimizing linkage editor (ver. 7.0 or later) is capable of reading the profile
information file and optimizing the allocation of functions and variables in correspondence with
the state of the actual operation of the program.
To input the profiler information file to the linkage editor, choose [Optimize] from the [Category]
list box and check the [Include profile] box in the [Link/Library] sheet of the [Standard Toolchain]
dialog box, and specify the name of the profile information file.
96
SuperH™ RISC engine Simulator/Debugger User’s Manual
Figure 3.36 Standard Toolchain Dialog Box (2)
To enable the settings in the [Include profile] box, specify the [Optimize] list box as some setting
other than [None].
97
SuperH™ RISC engine Simulator/Debugger User’s Manual
3.6.3
Loading Stack Information Files
You can select whether or not to read the stack information file in a message box for confirmation
that is displayed when a load module is loaded. Clicking the [OK] button of the message box loads
the stack information file. The message box for confirmation will be displayed when:
• There are stack information files (extension: .SNI).
• The [Load Stack Information Files (SNI files)] check box is checked in the [Confirmation] tab
of the [Options] dialog box (figure 3.37) that can be opened by choosing
[Setup -> Options…] from the main menu.
98
SuperH™ RISC engine Simulator/Debugger User’s Manual
Figure 3.37 Options Dialog Box
99
SuperH™ RISC engine Simulator/Debugger User’s Manual
3.6.4
Enabling the Profile
Choose [View->Performance->Profile] to open the [Profile] window.
Choose [Enable Profiler] from the pop-up menu of the [Profile] window. The item on the menu
will be checked.
3.6.5
Specifying Measurement Mode
You can specify whether to trace functions calls while profile data is acquired. When function
calls are traced, the relations of function calls during user program execution are displayed as a
tree diagram. When not traced, the relations of function calls cannot be displayed, but the time for
acquiring profile data can be reduced.
To stop tracing function calls, choose [Disable Tree (Not traces function call)] from the pop-up
menu in the [Profile] window (a check mark is shown to the left of the menu item).
When acquiring profile data of the program in which functions are called in a special way, such as
task switching in the OS, stop tracing function calls.
3.6.6
Executing the Program and Checking the Results
After the user program has been executed and execution has been halted, the results of
measurement are displayed in the [Profile] window.
The [Profile] window has two sheets; a [List] sheet and a [Tree] sheet.
100
SuperH™ RISC engine Simulator/Debugger User’s Manual
3.6.7
List Sheet
This sheet lists functions and global variables and displays the profile data for each function and
variable.
Figure 3.38 List Sheet
Clicking the column header sorts the items in an alphabetical or ascending/descending order.
Clicking the [Function/Variable] or [Address] column displays the source program corresponding
to the address in the line.
Right-clicking on the mouse within the window displays a pop-up menu. For details on this popup menu, refer to section 3.6.8, Tree Sheet.
101
SuperH™ RISC engine Simulator/Debugger User’s Manual
3.6.8
Tree Sheet
This sheet displays the relation of function calls along with the profile data that are values when
the function is called. This sheet is available when [Disable Tree (Not traces function call)] is not
selected from the pop-up menu in the [Profile] window.
Figure 3.39 Tree Sheet
Double-clicking a function in the [Function] column expands or reduces the tree structure display.
The expansion or reduction is also provided by the “+” or “-” key. Double-clicking the [Address]
column displays the source program corresponding to the specific address.
Right-clicking the mouse within the window displays a pop-up menu. Supported menu options are
as follows:
• View Source
Displays the source program or disassembled memory contents for the address in the selected
line.
• View Profile-Chart
Displays the [Profile-Chart] window focused on the function in the specified line.
• Enable Profiler
Toggles acquisition of profile data. When profile data acquisition is enabled, a check mark is
shown to the left of the menu text.
102
SuperH™ RISC engine Simulator/Debugger User’s Manual
• Not trace the function call
Stops tracing function calls while profile data is acquired. This menu is used when acquiring
profile data of the program in which functions are called in a special way, such as task
switching in the OS.
To display the relation of function calls in the [Tree] sheet of the [Profile] window, acquire
profile data without selecting this menu. In addition, do not select this menu when optimizing
the program by the optimizing linkage editor using the acquired profile information file.
• Find...
Displays the [Find Text] dialog box to find a character string in the [Function] column. Search
is started by entering a character string to be found in the edit box and clicking [Find Next] or
pressing the Enter key.
• Find Data...
Displays the [Find Data] dialog box.
Figure 3.40 Find Data Dialog Box
By selecting the column to be searched in the [Column] combo box and the search type in the
[Find Data] group then pressing [Find Next] button or Enter key, search is started. If the [Find
Next] button or the Enter key is input repeatedly, the second larger data (the second smaller
data when Minimum is specified) is searched for.
• Clear Data
Clears the number of times functions are called and the profile data. Data in the [List] sheet of
the [Profile] window and the data in the [Profile-Chart] window are also cleared.
103
SuperH™ RISC engine Simulator/Debugger User’s Manual
• Output Profile Information Files...
Displays the [Save Profile Information Files] dialog box. Profiling results are saved in a profile
information file (.pro extension). The optimizing linkage editor optimizes user programs
according to the profile information in this file. For details of the optimization using the profile
information, refer to the manual of the optimizing linkage editor.
Note: If profile information has been acquired by choosing the [Not trace the function call] menu,
the program cannot be optimized by the optimizing linkage editor.
• Output Text File...
Displays the [Save Text of Profile Data] dialog box. Displayed contents are saved in a text file.
• Setting
This menu has the following submenus (the menus available only in the [List] sheet are also
included).
⎯ Show Functions/Variables
Displays both functions and global variables in the [Function/Variable] column.
⎯ Show Functions
Displays only functions in the [Function/Variable] column.
⎯ Show Variables
Displays only global variables in the [Function/Variable] column.
⎯ Only Executed Functions
Only displays the executed functions. If a stack information file (.sni extension) output
from the optimizing linkage editor does not exist in the directory where the load module is
located, only the executed functions are displayed even if this check box is not checked.
⎯ Include Data of Child Functions
Sets whether or not to display information for a child function called in the function as
profile data.
• Properties...
This menu cannot be used in this simulator/debugger.
104
SuperH™ RISC engine Simulator/Debugger User’s Manual
3.6.9
Profile-Chart Window
The [Profile-Chart] window displays the relation of calls for a specific function. This window
displays the specified function in the middle, with the callers of the function on the left and the
callees of the function on the right. The numbers of times the function calls the functions or is
called by the functions are also displayed in this window.
Figure 3.41 Profile-Chart Window
Right-clicking the mouse within the window displays a pop-up menu. Supported menu options are
as follows:
• View Source
Displays the source program or disassembled memory contents for the address of the function
on which the cursor is placed when the right-hand mouse button is clicked. If the cursor is not
placed on a function when the right-hand mouse button is clicked, this menu option remains
gray.
• View Profile-Chart
Displays the [Profile-Chart] window for the specific function on which the cursor is placed
when the right-hand mouse button is clicked. If the cursor is not placed on a function when the
right-hand mouse button is clicked, this menu option remains gray.
• Enable Profiler
Toggles acquisition of profile data. When profile data acquisition is enabled, a check mark is
shown to the left of the menu text.
105
SuperH™ RISC engine Simulator/Debugger User’s Manual
• Clear Data
Clears the number of times functions are called. Data in the [List] and [Tree] sheets of the
[Profile] window are also cleared.
• Multiple View
If a further [Profile-Chart] window is opened while an existing [Profile-Chart] window is
already open, this option selects whether a new window is opened or the new data is displayed
in the existing window. When a check mark is shown to the left of this menu item, a new
window will be opened.
• Output Profile Information Files...
Displays the [Save Profile Information Files] dialog box. Profiling results are saved in a profile
information file (.pro extension). The optimizing linkage editor optimizes user programs
according to the profile information in this file. For details on optimization with the profile
information, refer to the user’s manual for the optimizing linkage editor.
• Expands Size
Redo the display with larger intervals between functions. The "+" key can also be used to do
this.
• Reduces Size
Redo the display with smaller intervals between functions. The “-” key can also be used to this.
3.6.10
Types and Purposes of Displayed Data
The profile function is able to acquire the following information:
Address
You can view the locations in memory to which the functions are allocated.
Sorting the list of functions and global variables in order of their addresses
allows the user to view the way the items are allocated in the memory space.
Size
Sorting in order of size makes it easy to find small functions that are frequently
called. Setting such functions as inline may reduce the overhead of function
calls. If you are using a device which incorporates a cache memory,
greater amount of cache memory will need to be updated when you execute
larger functions. This information allows you to check if those functions that
may cause cache misses are frequently called.
Stack Size
When there is deep nesting of function calls, pursue the route of the function
calls and obtain the total stack size for all of the functions on that route to
estimate the amount of stack being used.
106
SuperH™ RISC engine Simulator/Debugger User’s Manual
Times
Sorting by the number of calls or accesses makes it easy to identify the
frequently called functions and frequently accessed global variables.
Profile Data
Measurement of a variety of CPU-specific data is also available as follows:
• SH-1/SH-2/SH-2E Series, SH2-DSP (SH7410), SH-2DSP (Core), and SH2-DSP (SH7065):
[Cycle] (the number of execution cycles),
[Ext_mem] (the number of external memory accesses),
[I/O_area] (the number of internal I/O area accesses),
[Int_mem] (the number of internal memory accesses)
• SH-3/SH-3E/SH3-DSP Series and SH2-DSP (SH7612):
[Cycle] (the number of execution cycles),
[Cache miss] (the number of cache misses),
[Ext_mem] (the number of external memory accesses),
[I/O_area] (the number of internal I/O area accesses),
[Int_mem] (the number of internal memory accesses)
• SH2A-FPU, SH-4 Series and the SH-4A Series:
[Cycle] (the number of execution cycles),
[ICache miss] (the number of instruction cache misses),
[OCache miss] (the number of operand cache misses),
[Ext_mem] (the number of external memory accesses),
[I/O_area] (the number of internal I/O area accesses),
[Int_mem] (the number of internal memory accesses)
The number of execution cycles and cache misses are calculated by subtracting the total execution
cycles or cache misses at a specific function call instruction execution from the total execution
cycles or cache misses at a return instruction execution of a specific function.
107
SuperH™ RISC engine Simulator/Debugger User’s Manual
3.6.11
Creating Profile Information Files
To create a profile information file, choose the [Output Profile Information Files…] menu option
from the pop-up menu. The [Save Profile Information Files] dialog box is displayed. Pressing the
[Save] button after selecting a file name will write the profile information to the selected file.
Pressing the [Save All] button will write the profile information to all of the profile information
files.
Figure 3.42 Save Profile Information Files Dialog Box
108
SuperH™ RISC engine Simulator/Debugger User’s Manual
3.6.12
Notes
1. The number of executed cycles for an application program as measured by the profile function
includes a margin of error. The profile function only allows the measurement of the
proportions of execution time that the functions occupy in the overall execution of the
application program. Use the Performance Analysis function to precisely measure the numbers
of executed cycles.
2. The names of the corresponding functions may not be displayed when the profile information
on a load module with no debugging information is measured.
3. The stack information file (extension: .SNI) must be in the same directory as the load module
file (extension: .ABS).
4. It is not possible to store the results of measurement.
5. It is not possible to modify the results of measurement.
109
SuperH™ RISC engine Simulator/Debugger User’s Manual
3.7
Analyzing Performance
Use the [Performance Analysis] window to select a function name and analyze the performance.
3.7.1
Opening the Performance Analysis Window
Choose [View -> Performance -> Performance Analysis] or click the [PA] toolbar button
open the [Performance Analysis] window.
to
Figure 3.43 Performance Analysis Window
This window displays the number of execution cycles required for each specified function.
The number of execution cycles is calculated as follows:
Execution cycles = total number of execution cycles when execution returns from the function
– total number of execution cycles when the target function is called
The following items are displayed:
[Index]
Index number of the set condition
[Function]
Name of the function to be measured (or the start address of the function)
[Cycle]
Total number of instruction execution cycles
[Count]
Total number of calls for the function
[%]
Ratio of execution cycle count required for the function to the execution cycle count
required for the whole program
[Histogram] Histogram display of the above ratio
110
SuperH™ RISC engine Simulator/Debugger User’s Manual
3.7.2
Specifying a Target Function
After the [Performance Analysis] window is open, choose [Add Range...] from the pop-up menu
or press the Insert key to open the [Performance Option] dialog box, which allows the user to
specify a function to be analyzed.
Figure 3.44 Performance Option Dialog Box
This dialog box specifies a function (including a label) to be evaluated. Up to 255 functions can be
specified in total.
Clicking the [OK] button stores the setting. Clicking the [Cancel] button closes this dialog box
without setting the function to be evaluated.
Select a function that has been set and choose [Edit Range] from the pop-up menu or press the
Enter key to open the [Performance Option] dialog box and to change the function to be evaluated.
3.7.3
Starting Performance Data Acquisition
Choose [Enable Analysis] from the pop-up menu to start acquiring performance analysis data.
3.7.4
Resetting Data
Choose [Reset Counts/Times] from the pop-up menu to clear the current performance analysis
data.
3.7.5
Deleting a Target Function
Select a function and choose [Delete Range] from the pop-up menu to delete the selected target
function and to recalculate the data within other ranges. The selected function can also be deleted
by the Delete key.
111
SuperH™ RISC engine Simulator/Debugger User’s Manual
3.7.6
Deleting All Target Functions
Choose [Delete All Ranges] from the pop-up menu to delete all the current target functions to be
evaluated and to clear the performance analysis data.
3.7.7
Saving the Currently Displayed Contents
The contents currently displayed in the window can be saved in a text file. Select [Save to File…]
from the pop-up menu.
3.8
Acquiring Code Coverage
The [Coverage] window acquires code coverage information (C0 coverage and C1 coverage) in
the range specified by the user, and displays the information.
3.8.1
Opening the Coverage Window
Choose [View -> Code -> Coverage...] or click the [Coverage] toolbar button
[Coverage Setting] dialog box.
Figure 3.45 Coverage Setting Dialog Box
112
to open the
SuperH™ RISC engine Simulator/Debugger User’s Manual
This dialog box specifies the coverage acquiring range. To set coverage for a new range, the
following two ways are available:
•
Specifying the start and end addresses on the new coverage range
[Start Address]
Start address of coverage information display
(When a prefix is omitted, values input are taken as hexadecimal.)
[End Address]
End address of coverage information display
(When a prefix is omitted, values input are taken as hexadecimal.)
•
Specifying the file on the new coverage range
[File]
Source file whose extension is .C or .CPP in the current project.
Functions in the specified file can be set as the coverage range.
If the extension of the file is omitted, .C is complemented.
The file that has other extensions than .C or .CPP cannot be specified.
A placeholder or the [Browse…] button is available.
113
SuperH™ RISC engine Simulator/Debugger User’s Manual
To use the settings saved in a coverage information file, choose the file from [Open a recent
coverage file], or open a file open dialog box by [Browse to another coverage file] and select the
file. When [Open a recent coverage file] is selected, up to four recent files that have been saved
are displayed.
Clicking [OK] opens the [Coverage] window.
When the [Coverage] window has already been displayed for specifying address, settings are
added in the window.
•
Coverage window (specifying address)
Figure 3.46 Coverage Window (Specifying Address)
This window displays the coverage range and statistical information. The following items are
displayed:
[Range]
Address range
[Statistic]
Percentage of the instruction executed within the function
[Status]
Enabled or Disable status of the coverage range
When the [Coverage] window is closed, the acquired coverage information and the conditions to
acquire information will be cleared.
114
SuperH™ RISC engine Simulator/Debugger User’s Manual
•
Coverage window (specifying source file)
Figure 3.47 Coverage Window (Specifying Source File)
This window displays the coverage range and statistical information. The following items are
displayed:
[Functions]
List of functions
[Statistic]
Percentage of the instruction executed within the function
[Status]
Enable or Disable status of the respective function
Note: The functions can be sorted by their names or percentage, either in ascending or
descending order, by clicking the column tab ([Functions] or [Statistic]).
When the [Coverage] window is closed, the acquired coverage information and the conditions to
acquire information will be cleared.
115
SuperH™ RISC engine Simulator/Debugger User’s Manual
3.8.2
Acquiring All Coverage Information
Choose [Enable All] from the pop-up menu and execute the user program to acquire all coverage
information. By default, [Enable All] is selected.
3.8.3
Clearing All Coverage Information
Choosing [Clear All] from the popup menu clears all the coverage information that has been
acquired.
3.8.4
Viewing the Source Window
Choose [View Source] from the pop-up menu to open the [Editor] window and to display the
[Editor] window corresponding to the cursor location in the [Coverage] window.
3.8.5
Specifying the New Coverage Range
Choose [Add Range...] from the pop-up menu to open the [Coverage Setting] dialog box (figure
3.45). For the [Coverage Setting] dialog box, refer to section 3.8.1, Opening the Coverage
Window.
3.8.6
•
Changing the Coverage Range
Specifying the coverage range with an address
Choose the coverage range and [Edit Range...] from the pop-up menu to open the [Coverage
Range] dialog box.
Figure 3.48 Coverage Range Dialog Box (Specifying Address)
116
SuperH™ RISC engine Simulator/Debugger User’s Manual
This dialog box specifies the condition to acquire instruction execution information. The following
items can be specified.
[Start address]
Start address (When a prefix is omitted, values input are taken as hexadecimal.)
[End address]
End address (When a prefix is omitted, values input are taken as hexadecimal.)
Clicking [OK] changes the coverage range.
•
Specifying the coverage range with a source file
Choose [Edit Range...] from the pop-up menu to open the [Coverage Range] dialog box.
Figure 3.49 Coverage Range Dialog Box (Specifying Source File)
This dialog box specifies the condition to acquire instruction execution information. The following
items can be specified.
[File]
Source file whose extension is .C or .CPP in the current project.
Functions in the specified file can be set as the coverage range.
If the extension of the file is omitted, .C is complemented.
The file that has other extensions than .C or .CPP cannot be specified.
A placeholder or the [Browse…] button is available.
Clicking [OK] changes the coverage range.
3.8.7
Deleting the Selected Coverage Range
Select a coverage range and choose [Delete Range] from the pop-up menu to delete the selected
coverage range.
117
SuperH™ RISC engine Simulator/Debugger User’s Manual
3.8.8
Acquiring Coverage Information
Specify a coverage range, choose [Enable Coverage] from the pop-up menu, and execute the user
program to acquire coverage information. By default, [Enable Coverage] is selected.
3.8.9
Clearing Coverage Information
Specify a coverage range and choose [Clear Data] from the pop-up menu to clear the acquired
coverage information.
3.8.10
Saving Coverage Information in a File
Choose [Save Data...] from the pop-up menu to open the [Save Data] dialog box, which allows the
user to save the coverage information in a file.
Figure 3.50 Save Data Dialog Box
This dialog box specifies the location and name of a coverage information file to be saved. The
placeholder or the [Browse...] button can be used.
If a file name extension is omitted, .COV is automatically added. If a file name extension other
than .COV or .TXT is specified, an error message will be displayed.
118
SuperH™ RISC engine Simulator/Debugger User’s Manual
3.8.11
Loading Coverage Information from a File
Choose [Load Data...] from the pop-up menu to open the [Load Data] dialog box, which allows
the user to load the coverage information from a file.
Figure 3.51 Load Data Dialog Box
This dialog box specifies the location and name of a coverage information file to be loaded. The
placeholder or the [Browse...] button can be used.
Only .COV files can be loaded. If a file name extension other than .COV is specified, an error
message will be displayed.
3.8.12
Updating the Information
Choose [Refresh] from the pop-up menu to update the [Coverage] window to the latest
information.
119
SuperH™ RISC engine Simulator/Debugger User’s Manual
3.8.13
Confirmation Request Dialog Box
A confirmation request dialog box will appear when [Clear All], [Clear Data], [Edit Range...], or
[Delete Range] is clicked or an attempt is made to close the [Coverage] window.
Figure 3.52 Confirmation Request Dialog Box
Clicking [OK] clears the coverage data. Choosing [Save Coverage data] opens the [Save Data]
dialog box (figure 3.50) to save the coverage data in a file before it is cleared.
120
SuperH™ RISC engine Simulator/Debugger User’s Manual
3.8.14
Save Coverage Data Dialog Box
When [File -> Save Session] menu option is clicked, the [Save Coverage Data] dialog box will
appear, which allows the user to save the [Coverage] window data in separate files or a single file.
Figure 3.53 Save Coverage Data Dialog Box
When multiple [Coverage] windows are open, a [Save Coverage Data] dialog box will appear for
each open coverage window.
Clicking the [No To All] button closes the dialog box without saving any coverage data.
Clicking the [Yes To All] button saves the data of all [Coverage] windows in a single file.
Note: If a file is specified for the coverage range, not all [Coverage] windows can be saved in a
single file.
121
SuperH™ RISC engine Simulator/Debugger User’s Manual
3.8.15
Displaying the Coverage Information in the [Editor] Window
The coverage information is reflected to the [Editor] window by highlighting the [Coverage]
columns corresponding to the source lines of executed instructions. When the coverage settings
are modified in the [Coverage] window, the [Coverage] column display will be updated.
Figure 3.54 Coverage Column (Source)
122
SuperH™ RISC engine Simulator/Debugger User’s Manual
3.8.16
Displaying the Coverage Information in the [Disassembly] Window
The coverage information is reflected to the [Disassembly] window by highlighting the [Coverage
– ASM] columns corresponding to the disassembly lines of executed instructions. When the
coverage settings are modified in the [Coverage] window, the [Coverage – ASM] column display
will be updated.
Figure 3.55 Coverage Column (Disassembly)
123
SuperH™ RISC engine Simulator/Debugger User’s Manual
3.9
Generating a Pseudo-Interrupt Manually
Windows [Trigger] and [GUI I/O] allow the user to generate a pseudo-interrupt manually by
pressing a button on the window.
3.9.1
[Trigger] Window
Choose [View -> CPU -> Trigger] or click the [Trigger] toolbar button
window.
to open the [Trigger]
Figure 3.56 Trigger Window
This window displays trigger buttons that generate pseudo-interrupts manually. The details of the
interrupt to be generated by pressing each trigger button can be specified in the [Trigger Setting]
dialog box.
Up to 256 trigger buttons can be used.
For details on the interrupt processing in the simulator/debugger, refer to section 2.20, PseudoInterrupts.
124
SuperH™ RISC engine Simulator/Debugger User’s Manual
•
Setting a trigger button
Choose [Setting...] from the pop-up menu to open the [Trigger Setting] dialog box.
Figure 3.57 Trigger Setting Dialog Box
125
SuperH™ RISC engine Simulator/Debugger User’s Manual
This dialog box allows the user to specify the details of the pseudo-interrupt to be generated by
pressing each trigger button.
[Trigger]
Selects the trigger button to be specified in detail
[Name]
Specifies a name for the selected trigger button; the name will be displayed in
the [Trigger] window
[Enable]
Checking this box enables the trigger button.
[Interrupt Type1]
Sets the following values for each CPU
• SH-1, SH-2, and SH2-DSP series
Interrupt vector number
• SH2A-FPU
Interrupt vector number
• SH-3, SH-4, and SH3-DSP series
INTEVT (H'0 to H'FFF)
• SH-4A series
INTEVT (H'0 to H'3FFF)
[Interrupt Type2]
Only selectable for the SH3-DSP series: INTEVT2 (H'0 to H'FFF)
[Priority]
Interrupt priority (H'0 to H'11; when the prefix is omitted, values input are
taken as hexadecimal, and the display is in hexadecimal notation).
When H'10 is specified, the interrupt is always accepted regardless of the
value of the I bit value in SR, but is masked by the BL bit in SR. When H'11 is
specified, the interrupt is always accepted regardless of the I and BL bit values
in SR.
Clicking the [OK] button stores the setting. Clicking the [Cancel] button closes this dialog box
without setting the details of the interrupt.
Note: If the [Cancel] button is clicked after multiple trigger button settings are modified, the
modifications of all those buttons are canceled.
126
SuperH™ RISC engine Simulator/Debugger User’s Manual
•
Changing the number of trigger buttons
Specify the number of trigger buttons displayed in the [Trigger] window in the [Number of
Buttons] submenu in the pop-up menu. [4], [16], [64], or [256] can be selected.
•
Changing the size of trigger buttons
Specify the size of trigger buttons displayed in the [Trigger] window in the [Size] submenu in the
pop-up menu. [Large], [Normal], or [Small] can be selected.
3.9.2
[GUI I/O] Window
Choose [View -> Graphic -> GUI I/O] or click the [GUI I/O] toolbar button
I/O] window.
to open the [GUI
Figure 3.58 GUI I/O Window
This window displays buttons that generate pseudo-interrupts manually. The details of the
interrupt to be generated by pressing each button can be specified in the [Set Button] dialog box.
For details on the interrupt processing in the simulator/debugger, refer to section 2.20, PseudoInterrupts.
127
SuperH™ RISC engine Simulator/Debugger User’s Manual
•
Setting a button
Choose [Create Button] from the pop-up menu or click the [Create Button] toolbar button ( ).
The mouse cursor turns into a “+” symbol. Create the button by dragging the mouse cursor from a
higher-left to a lower-right position.
Figure 3.59 GUI I/O Window (Create Button)
Double-click the created button to open the [Set Button] dialog box.
128
SuperH™ RISC engine Simulator/Debugger User’s Manual
Figure 3.60 Set Button Dialog Box
129
SuperH™ RISC engine Simulator/Debugger User’s Manual
This dialog box allows the user to specify the details of the pseudo-interrupt to be generated by
pressing each button.
[Button Name]
Specifies a name for the button; the name will be displayed in the [GUI
I/O] window
[Select Button Type]
Select [Input] or [Input and Interrupt].
[Interrupt]
[Interrupt Type1]
[Interrupt Type2]
[Priority]
130
Sets the following values for each CPU
• SH-1, SH-2, and SH2-DSP series
Interrupt vector number
• SH2A-FPU
Interrupt vector number
• SH-3, SH-4, and SH3-DSP series
INTEVT (H'0 to H'FFF)
• SH-4A series
INTEVT (H'0 to H'3FFF)
Only selectable for the SH3-DSP series:
INTEVT2 (H'0 to H'FFF)
Interrupt priority (H'0 to H'11; when the prefix is omitted,
values input are taken as hexadecimal, and the display is in
hexadecimal notation).
When H'10 is specified, the interrupt is always accepted
regardless of the value of the I bit value in SR, but is masked
by the BL bit in SR. When H'11 is specified, the interrupt is
always accepted regardless of the I and BL bit values in SR.
SuperH™ RISC engine Simulator/Debugger User’s Manual
3.10
Standard I/O and File I/O Processing
Use the [Simulated I/O] window to enable the simulation for standard I/O and file I/O from the
user program.
3.10.1
Opening the Simulated I/O Window
Choose [View -> CPU -> Simulated I/O] or click the [Simulated I/O] toolbar button
the [Simulated I/O] window.
to open
Figure 3.61 Simulated I/O Window
The standard output from the user program is displayed in this window. The key input from this
window is handled as the standard input to the user program.
131
SuperH™ RISC engine Simulator/Debugger User’s Manual
3.10.2
I/O Functions
Table 3.1 lists the supported I/O functions.
Table 3.1
I/O Functions
No.
Function
Code
Function Name
Description
1
H'21
GETC
Inputs one byte from the standard input
2
H'22
PUTC
Outputs one byte to the standard output
3
H'23
GETS
Inputs one line from the standard input
4
H'24
PUTS
Outputs one line to the standard output
5
H'25
FOPEN
Opens a file
6
H'06
FCLOSE
Closes a file
7
H'27
FGETC
Inputs one byte from a file
8
H'28
FPUTC
Outputs one byte to a file
9
H'29
FGETS
Inputs one line from a file
10
H'2A
FPUTS
Outputs one line to a file
11
H'0B
FEOF
Checks for end of file
12
H'0C
FSEEK
Moves the file pointer
13
H'0D
FTELL
Returns the current position of the file pointer
To perform I/O processing, use the [Simulated I/O Address] in the [Simulator System] dialog box
(refer to section 3.2.1, Modifying the Simulator System) in the following procedure.
1. Set the address specialized for I/O processing in the [System Call Address], select [Enable]
and execute the program.
2. When detecting a subroutine call instruction (BSR, JSR, or BSRF), that is, a simulated I/O
instruction to the specified address during user program execution, the simulator/debugger
performs I/O processing by using the R0 and R1 values as the parameters.
132
SuperH™ RISC engine Simulator/Debugger User’s Manual
Therefore, make the following settings in the user program before issuing a simulated I/O
instruction:
• Set the function code (table 3.1) to the R0 register
MSB 1 byte
H'01
1 byte
Function
code
LSB
• Set the parameter block address to the R1 register (for the parameter block, refer to each
function description)
MSB
LSB
Parameter block address
• Reserve the parameter block and input/output buffer areas
Each parameter of the parameter block must be accessed in the parameter size.
After the I/O processing, the simulator/debugger resumes simulation from the instruction that
follows the simulated I/O instruction.
Note: When a JSR, BSR, or BSRF instruction is used as a simulated I/O instruction, the
instruction following the JSR, BSR, or BSRF instruction is executed as a normal
instruction, not a slot instruction. Therefore, the instruction placed immediately after the
simulated I/O instruction (JSR, BSR, or BSRF) must not be one that produces different
results depending on whether executed as a normal instruction or as a slot instruction.
Refer to the simulator/debugger help about each I/O function.
133
SuperH™ RISC engine Simulator/Debugger User’s Manual
The following shows an example for inputting one character as a standard input (from a keyboard).
MOV.L
PAR_ADR,R1
MOV.L
REQ_COD,R0
MOV.L
CALL_ADR,R3
JSR
@R3
NOP
STOP
SYS_CALL
NOP
NOP
.ALIGN
4
CALL_ADR
.DATA.L
SYS_CALL
REQ_COD
.DATA.L
H’01210000
PAR_ADR
.DATA.L
PARM
PARM
.DATA.L
INBUF
INBUF
.RES.B
2
.END
134
SuperH™ RISC engine Simulator/Debugger User’s Manual
3.11
Viewing the TLB Contents
The TLB window is used to display the TLB contents in a CPU with the MMU (Memory
Management Unit) function. The TLB window differs depending on the CPU. Read the
description corresponding to your CPU.
3.11.1
Opening a TLB Window
SH-3, SH-3E, and SH3-DSP Series:
Choose [View -> CPU -> TLB] or click the [TLB] toolbar button [
] to open the [TLB] window.
Figure 3.62 TLB Window (SH-3/SH-3E/SH3-DSP Series)
This window displays the TLB contents. The selected entry is displayed in green. Since each way
has one sheet, clicking the way’s sheet displays the way’s contents. The contents of a currently
disabled way are grayed out.
135
SuperH™ RISC engine Simulator/Debugger User’s Manual
The following items are displayed in the window:
[Entry]
Entry number in the TLB (H’00 to H’FF)
[VPN]
Virtual page number (longword). Bits 31 to 10 are valid.
[PPN]
Physical page number (longword). Bits 31 to 10 are valid.
[ASID]
Address space identifier
[V]
Validity bit
[SZ]
Page-size bit
[PR]
Protection key field
[C]
Cacheable bit
[D]
Dirty bit
[SH]
Share status bit
136
SuperH™ RISC engine Simulator/Debugger User’s Manual
SH-4 Series and SH-4A Series:
The SH-4 series and the SH-4A series have two kinds of TLB windows: instruction TLB window
and unified TLB window. The SH-4A series has the PMB window as well as those two windows.
Choose [View -> CPU -> TLB] or click the [TLB] toolbar button [ ] to open the [Select TLB]
dialog box (figure 3.63) for selecting the TLB window type to be displayed.
Figure 3.63 Select TLB Dialog Box
This dialog box selects the TLB to be displayed. Select one of the following TLB types:
[Instruction TLB]
Opens the instruction TLB window.
[Unified TLB]
Opens the unified TLB window.
[PMB]
Opens the PMB window (the SH-4A series only)
Clicking the [OK] button displays the selected TLB window. Clicking the [Cancel] button closes
the dialog box without opening a TLB window.
• Instruction TLB window
Figure 3.64 Instruction TLB Window (SH-4 Series)
137
SuperH™ RISC engine Simulator/Debugger User’s Manual
This window displays the instruction TLB contents. The selected entry is displayed in green.
The following items are displayed in the window:
[Entry]
Entry number in the instruction TLB (H’0 to H’3)
[VPN]
Virtual page number (longword). Bits 31 to 10 are valid.
[PPN]
Physical page number (longword). Bits 31 to 10 are valid.
[ASID]
Address space identifier
[V]
Validity bit
[SZ]
Page-size bit
[PR]
Protection key field
[C]
Cacheable bit
[SH]
Share status bit
• Unified TLB window
Figure 3.65 Unified TLB Window (SH-4 Series)
138
SuperH™ RISC engine Simulator/Debugger User’s Manual
This window displays the unified TLB contents. The selected entry is displayed in green.
The following items are displayed in the window:
[Entry]
Entry number in unified TLB (H’00 to H’3F)
[VPN]
Virtual page number (longword). Bits 31 to 10 are valid.
[PPN]
Physical page number (longword). Bits 31 to 10 are valid.
[ASID]
Address space identifier
[V]
Validity bit
[SZ]
Page-size bit
[PR]
Protection key field
[C]
Cacheable bit
[D]
Dirty bit
[SH]
Share status bit
[WT]
Write-through bit
139
SuperH™ RISC engine Simulator/Debugger User’s Manual
• PMB window
Figure 3.66 PMB Window (SH-4A Series)
This window displays the PMB information and is only supported by the SH-4A series. The
selected entry is displayed in green.
The following items are displayed in the window:
[Entry]
Entry number in PMB (H’0 to H’F)
[VPN]
Virtual page number (longword). Bits 31 to 24 are valid.
[PPN]
Physical page number (longword). Bits 31 to 24 are valid.
[V]
Validity bit
[SZ]
Page-size bit
[C]
Cacheable bit
[WT]
Write-through bit
[UB]
Whether or not to write to the buffer
Note: Some devices do not incorporate the PMB.
140
SuperH™ RISC engine Simulator/Debugger User’s Manual
3.11.2
Modifying the TLB Contents
Selecting [Modify…] from the pop-up menu with a TLB item selected opens the dialog box to
modify the selected TLB item.
Figure 3.67 Modify TLB Dialog Box (VPN is Selected in SH-3)
This dialog box allows the currently selected TLB item to be modified. The selected TLB item and
entry number are displayed in the caption of the dialog box. The way number is also displayed for
a TLB with ways. The item name in the dialog box displays the selected TLB item.
Clicking the [OK] button stores the newly entered contents in the TLB. Clicking the [Cancel]
button closes the dialog box without storing the newly entered contents in the TLB.
A value can be directly input in the window.
3.11.3
Flushing the TLB Contents
Selecting [Flush] from the pop-up menu flushes the TLB. All valid bits are cleared to 0 and all
TLB entries are invalidated.
Note that during execution of an instruction, the [Flush] menu is disabled and the TLB cannot be
flushed.
141
SuperH™ RISC engine Simulator/Debugger User’s Manual
3.11.4
Searching the TLB Items
Selecting [Find…] from the pop-up menu opens the [Find TLB] dialog box in which a TLB item
can be searched for in column units.
Note that during execution of an instruction, the [Find…] menu is disabled and the TLB item
cannot be searched for.
Figure 3.68 Find TLB Dialog Box
This dialog box searches for a TLB item. The following search conditions can be specified:
[Search column]
Item to be searched for
[Search value]
Value to be searched for
After setting the search conditions, the search can be started by clicking the [OK] button. As a
result, the matching entry is highlighted.
Clicking the [Cancel] button closes the dialog box without searching for a TLB item.
3.11.5
Continuing the TLB Search
The next matching TLB item can be searched for with the search conditions that have previously
been set. In the state where a matching TLB item was found in the preceding search, select [Find
Next] from the pop-up menu.
Note that during execution of an instruction, the [Find Next] menu is disabled and the next
matching TLB item cannot be searched for.
142
SuperH™ RISC engine Simulator/Debugger User’s Manual
3.11.6
Saving the Currently Displayed Contents
The contents currently displayed in the window can be saved in a text file. Select [Save to File…]
from the pop-up menu.
3.12
Viewing the Cache Contents
The cache window is used to display the cache contents in a CPU with cache. The cache window
differs depending on the CPU. Read the description corresponding to the CPU.
3.12.1
Opening a Cache Window
SH-3, SH-3E, SH3-DSP, and SH2-DSP (SH7612) Series:
Choose [View -> CPU -> Cache] or click the [Cache] toolbar button [
window.
] to open the [Cache]
Figure 3.69 Cache Window (SH-3/SH-3E/SH3-DSP/SH2-DSP (SH7612) Series)
This window displays the cache contents. The selected entry is displayed in green. Since each way
has one sheet, clicking the way’s sheet displays the way’s contents. The contents of a currently
disabled way are grayed out.
143
SuperH™ RISC engine Simulator/Debugger User’s Manual
The following items are displayed in the window:
[Entry]
Entry number in the cache. The specifiable value depends on the CPU.
• SH-3 and SH-3E series: H'00 to H'7F
• SH3-DSP series: H'00 to H'FF
• SH2-DSP (SH7612): H'00 to H'3F
[V]
Validity bit. When this bit is 1, the entry is valid.
[U]
Update bit. When this bit is 1, the entry has been written to.
[LRU]
Numerical string that determines which way's entry should be replaced when
a cache miss occurs. (The same LRU value is assigned to the same entry in
all ways.)
[Tag Address]
Tag address
[Longword0] to
[Longword3]
Longword data 0 to 3 set to the cache entry
144
SuperH™ RISC engine Simulator/Debugger User’s Manual
SH2A-FPU, SH-4 Series, and SH-4A Series:
The SH2A-FPU, SH-4 series, and the SH-4A series have two kinds of cache windows: instruction
cache window and operand cache window. In addition, the SH-4A series has the level-2 cache
window and the SH2A-FPU has the ROM-cache window.
Choose [View -> CPU -> Cache] or click the [Cache] toolbar button [ ] to open the [Select
Cache] dialog box (figure 3.70) for selecting the cache window type to be displayed.
Figure 3.70 Select Cache Dialog Box
This dialog box selects the cache to be displayed. Select one of the following cache types:
*1
[Instruction Cache]
Opens the instruction cache window.
[Operand Cache]
Opens the operand cache window.
[Level-2 Cache]
Opens the level-2 cache window (SH-4A only).
[ROM Prefetch Cache]
Opens the ROM prefetch cache window (SH2A-FPU only).
*1
*2
[ROM Prefetch Miss Cache]
*2
Opens the ROM prefetch miss cache window (SH2A-FPU only).
[ROM Operand Cache]
*2
Opens the ROM operand cache window (SH2A-FPU only).
Notes: 1. For the SH2A-FPU series, this type is only displayed when the internal ROM is invalid.
2. This type is only displayed when the internal ROM is valid.
For specification of the internal ROM of the SH2A-FPU as valid or invalid, refer to
section 3.1.2, Setting up a Workspace for the Simulator/Debugger.
Clicking the [OK] button displays the selected cache window. Clicking the [Cancel] button closes
the dialog box without opening a cache window.
145
SuperH™ RISC engine Simulator/Debugger User’s Manual
• Instruction cache window
Figure 3.71 Instruction Cache Window (SH-4 (SH7750R))
This window displays the instruction cache contents. The selected entry is displayed in green.
Each way has a sheet, and the contents are displayed when the tab for the sheet to be displayed is
clicked. Invalid ways are displayed in gray. (The SH-4 and SH-4BSC have only one way.)
146
SuperH™ RISC engine Simulator/Debugger User’s Manual
The following items are displayed in the instruction cache window:
[Entry]
Entry number in the instruction cache (depends on the cache capacity)
[V]
Validity bit. When this bit is 1, the entry is valid.
[LRU]
Numerical string that determines which way's entry should be replaced when
a cache miss occurs. (The same LRU value is assigned to the same entry in
all ways.)
[Tag Address]
Tag address
[Longword0] to
[Longword7]
Longword data 0 to 7 set to the instruction cache entry.
In the SH2A-FPU, longword data 0 to 3.
• Operand cache window
Figure 3.72 Operand Cache Window (SH-4 (SH7750R))
This window displays the operand cache contents. The selected entry is displayed in green. Each
way has a sheet, and the contents are displayed when the tab for the sheet to be displayed is
clicked. Invalid ways are displayed in gray. (The SH-4 and SH-4BSC have only one way.)
147
SuperH™ RISC engine Simulator/Debugger User’s Manual
The following items are displayed in the operand cache window:
[Entry]
Entry number in the operand cache (depends on the cache capacity)
[V]
Validity bit. When this bit is 1, the entry is valid.
[U]
Update bit. When this bit is 1, the entry has been written to.
[LRU]
Numerical string that determines which way's entry should be replaced when
a cache miss occurs. (The same LRU value is assigned to the same entry in
all ways.)
[Tag Address]
Tag address
[Longword0] to
[Longword7]
Longword data 0 to 7 set to the operand cache entry.
In the SH2A-FPU, longward data 0 to 3.
148
SuperH™ RISC engine Simulator/Debugger User’s Manual
• Level-2 cache window
Figure 3.73 Level-2 Cache Window (SH-4A)
This window displays the level-2 cache contents and is only supported by the SH-4A series. The
selected entry is displayed in green.
The following items are displayed in the level-2 cache window:
[Entry]
Entry number in the level-2 cache (depends on the cache capacity)
[V]
Validity bit. When this bit is 1, the entry is valid.
[LRU]
Numerical string that determines which way's entry should be replaced when
a cache miss occurs. (The same LRU value is assigned to the same entry in
all ways.)
[Tag Address]
Tag address
[Longword0] to
[Longword7]
Longword data 0 to 7 set to the operand cache entry
Note: Some devices do not incorporate the level-2 cache.
149
SuperH™ RISC engine Simulator/Debugger User’s Manual
• ROM cache window
Figure 3.74 ROM Cache Window (Prefetch Cache)
This window displays the ROM cache contents and is only supported by the SH2A-FPU. There
are three types of ROM cache windows; ROM prefetch cache window, ROM prefetch miss cache
window, and ROM operand cache window. Items displayed in these three windows are the same.
The selected entry is displayed in green.
The following items are displayed in the ROM cache window:
[Entry]
Entry number in the ROM cache
[V]
Validity bit. When this bit is 1, the entry is valid.
[LRU]
Numerical string that determines which way's entry should be replaced when
a cache miss occurs. (The same LRU value is assigned to the same entry in
all ways.)
[Tag Address]
Tag address
[Longword0] to
[Longword3]
Longword data 0 to 3 set to the operand cache entry
150
SuperH™ RISC engine Simulator/Debugger User’s Manual
3.12.2
Modifying the Cache Contents
Selecting [Modify…] from the pop-up menu with a cache item selected opens the dialog box to
modify the selected cache item.
Note that during execution of an instruction, the [Modify…] menu is disabled and the cache items
cannot be modified.
Figure 3.75 Modify Cache Dialog Box (Tag Address is Selected in SH-3)
This dialog box allows the currently selected cache item to be modified. The selected cache item
and entry number are displayed in the caption of the dialog box. The way number is also displayed
for a cache with ways. The item name in the dialog box displays the selected cache item.
Clicking the [OK] button stores the newly entered contents in the cache. Clicking the [Cancel]
button closes the dialog box without storing the newly entered contents in the cache.
A value can be directly input in the window.
3.12.3
Flushing the Cache Contents
Selecting [Flush] from the pop-up menu flushes cache. All V, U, and LRU bits are cleared to 0
and all cache entries are invalidated.
Note that during execution of an instruction, the [Flush] menu is disabled and cache cannot be
flushed.
151
SuperH™ RISC engine Simulator/Debugger User’s Manual
3.12.4
Searching the Cache Items
Selecting [Find…] from the pop-up menu opens the [Find Cache] dialog box in which a cache
item can be searched for in column units.
Note that during execution of an instruction, the [Find…] menu is disabled and the cache item
cannot be searched for.
Figure 3.76 Find Cache Dialog Box
This dialog box searches for a cache item. The following search conditions can be specified:
[Find Column]
Item to be searched for
[Find Value]
Value to be searched for
After setting the search conditions, the search can be started by clicking the [OK] button. As a
result, the matching entry is highlighted.
Clicking the [Cancel] button closes the dialog box without searching for a cache item.
3.12.5
Continuing the Cache Search
The next matching cache item can be searched for with the search conditions that have previously
been set. In the state where a matching cache item was found in the preceding search, select [Find
Next] from the pop-up menu.
Note that during execution of an instruction, the [Find Next] menu is disabled and the next
matching cache item cannot be searched for.
152
SuperH™ RISC engine Simulator/Debugger User’s Manual
3.12.6
Modifying the Cache Capacity
This function is only provided for the SH-3, SH-3E series, and SH-4A series. Selecting
[Capacity…] from the pop-up menu opens the [Cache Capacity] dialog box in which the cache
capacity can be modified.
Note that during execution of an instruction, the [Capacity…] menu is disabled and the cache
capacity cannot be modified.
Figure 3.77 Cache Capacity Dialog Box (SH-3/SH-3E Series)
This dialog box allows the cache capacity to be modified.
The following cache capacities can be selected:
[8-Kbyte]
8-Kbyte cache capacity (default)
All four ways, way 0 to way 3 (two ways, way 0 and way 1, when the
internal RAM is specified), are valid.
[4-Kbyte]
4-Kbyte cache capacity
Two ways, way 0 and way 1 (one way, way 0, when the internal RAM is
specified), are valid.
[2-Kbyte]
2-Kbyte cache capacity
One way, way 0, is valid. The internal RAM specification is ignored.
Clicking the [OK] button modifies the cache capacity. Clicking the [Cancel] button closes the
dialog box without modifying the cache capacity.
153
SuperH™ RISC engine Simulator/Debugger User’s Manual
Figure 3.78 Cache Capacity Dialog Box (SH-4A)
Figure 3.79 Cache Capacity Dialog Box (SH2A-FPU and SH4AL-DSP)
This dialog box allows the cache capacity to be modified.
154
SuperH™ RISC engine Simulator/Debugger User’s Manual
The following cache capacities can be selected depending on the cache type:
For the SH-4A series:
[Instruction Cache]:
[Operand Cache]:
Sets the capacity of the instruction cache. Four ways, way 0 to way 3, are
all valid, and the number of entry changes. (The number of entries in
each way is the same.)
[8-Kbyte]:
8-Kbyte cache capacity
(One way: 2 Kbytes, the number of entries: H’000 to
H’03F)
[16-Kbyte]:
16-Kbyte cache capacity
(One way: 4 Kbytes, the number of entries: H’000 to
H’07F)
[32-Kbyte]:
32-Kbyte cache capacity (default)
(One way: 8 Kbytes, the number of entries: H’000 to
H’0FF)
[64-Kbyte]:
64-Kbyte cache capacity
(One way: 16 Kbytes, the number of entries: H’000 to
H’1FF)
[128-Kbyte]:
128-Kbyte cache capacity
(One way: 32 Kbytes, the number of entries: H’000 to
H’3FF)
Sets the capacity of the operand cache. Four ways, way 0 to way 3, are
all valid, and the number of entry changes. (The number of entries in
each way is the same.)
[8-Kbyte]:
8-Kbyte cache capacity
(One way: 2 Kbytes, the number of entries: H’000 to
H’03F)
[16-Kbyte]:
16-Kbyte cache capacity
(One way: 4 Kbytes, the number of entries: H’000 to
H’07F)
155
SuperH™ RISC engine Simulator/Debugger User’s Manual
[Level-2 Cache]
(SH-4A only):
156
[32-Kbyte]:
32-Kbyte cache capacity (default)
(One way: 8 Kbytes, the number of entries: H’000 to
H’0FF)
[64-Kbyte]:
64-Kbyte cache capacity
(One way: 16 Kbytes, the number of entries: H’000 to
H’1FF)
[128-Kbyte]:
128-Kbyte cache capacity
(One way: 32 Kbytes, the number of entries: H’000 to
H’3FF)
Sets the capacity of the level-2 cache. Four ways, way 0 to way 3, are all
valid, and the number of entry changes. (The number of entries in each
way is the same.)
[128-Kbyte]:
128-Kbyte cache capacity (default)
(One way: 32 Kbytes, the number of entries: H’0000
to H’03FF)
[256-Kbyte]:
256-Kbyte cache capacity
(One way: 64 Kbytes, the number of entries: H’0000
to H’07FF)
[512-Kbyte]:
512-Kbyte cache capacity
(One way: 128 Kbytes, the number of entries: H’0000
to H’0FFF)
[1-Mbyte]:
1-Mbyte cache capacity
(One way: 256 Kbytes, the number of entries: H’0000
to H’1FFF)
SuperH™ RISC engine Simulator/Debugger User’s Manual
For the SH2A-FPU series:
[Instruction Cache]:
[Operand Cache]:
Sets the capacity of the instruction cache. Four ways, way 0 to way 3, are
all valid, and the number of entry changes. (The number of entries in
each way is the same.)
[8-Kbyte]
8-Kbyte cache capacity
(One way: 2 Kbytes, the number of entries: H’007F)
[16-Kbyte]
16-Kbyte cache capacity
(One way: 4 Kbytes, the number of entries: H’00FF)
[32-Kbyte]
32-Kbyte cache capacity (default)
(One way: 8 Kbytes, the number of entries: H’01FF)
[64-Kbyte]
64-Kbyte cache capacity
(One way: 16 Kbytes, the number of entries: H’03FF)
[128-Kbyte]
128-Kbyte cache capacity
(One way: 32 Kbytes, the number of entries: H’07FF)
[256-Kbyte]
256-Kbyte cache capacity
(One way: 64 Kbytes, the number of entries: H’0FFF)
[512-Kbyte]
512-Kbyte cache capacity
(One way: 128 Kbytes, the number of entries: H’1FFF)
[1-Mbyte]
1-Mbyte cache capacity
(One way: 256 Kbytes, the number of entries: H’3FFF)
Sets the capacity of the operand cache. Four ways, way 0 to way 3, are
all valid, and the number of entry changes. (The number of entries in
each way is the same.)
[8-Kbyte]
8-Kbyte cache capacity
(One way: 2 Kbytes, the number of entries: H’007F)
[16-Kbyte]
16-Kbyte cache capacity
(One way: 4 Kbytes, the number of entries: H’00FF)
157
SuperH™ RISC engine Simulator/Debugger User’s Manual
[32-Kbyte]
32-Kbyte cache capacity (default)
(One way: 8 Kbytes, the number of entries: H’01FF)
[64-Kbyte]
64-Kbyte cache capacity
(One way: 16 Kbytes, the number of entries: H’03FF)
[128-Kbyte]
128-Kbyte cache capacity
(One way: 32 Kbytes, the number of entries: H’07FF)
[256-Kbyte]
256-Kbyte cache capacity
(One way: 64 Kbytes, the number of entries: H’0FFF)
[512-Kbyte]
512-Kbyte cache capacity
(One way: 128 Kbytes, the number of entries: H’1FFF)
[1-Mbyte]
1-Mbyte cache capacity
(One way: 256 Kbytes, the number of entries: H’3FFF)
Clicking the [OK] button modifies the cache capacity. Clicking the [Cancel] button closes the
dialog box without modifying the cache capacity.
3.12.7
Saving the Currently Displayed Contents
The contents currently displayed in the window can be saved in a text file. Select [Save to File…]
from the pop-up menu.
158
SuperH™ RISC engine Simulator/Debugger User’s Manual
3.13
Viewing the Contents of Register Banks
The [Register Bank] window is used to view the contents of the register banks when using the
SH2A-FPU simulator/debugger.
3.13.1
Opening the [Register Bank] Window
Choose [View -> CPU -> Register Bank] or click the [Register Bank] toolbar button
the [Register Bank] window.
to open
Figure 3.80 [Register Bank] Window
159
SuperH™ RISC engine Simulator/Debugger User’s Manual
This window displays the register bank information. Since each bank has one sheet, clicking the
bank’s sheet displays the its contents. The contents of a currently disabled bank are grayed out.
The following items are displayed in the window:
[Name] Register name
[Value] Value
[Radix] Radix for display
3.13.2
Modifying the Contents of Register Banks
Selecting [Modify…] from the pop-up menu with a register bank item selected opens the dialog
box to modify the selected register bank item.
Figure 3.81 Register Value Setting Dialog Box
This dialog box allows the currently selected register bank item to be modified. The selected
register bank item and bank number are displayed in the caption of the dialog box. The item name
in the dialog box displays the selected register bank item.
Clicking the [OK] button stores the newly entered contents in the register bank. Clicking the
[Cancel] button closes the dialog box without storing the newly entered contents.
A value can be directly input in the window.
3.13.3
Changing the Radix
To change the radix for display, select [Radix] from the pop-up menu with a register bank item
selected.
160
SuperH™ RISC engine Simulator/Debugger User’s Manual
3.14
Creating a Virtual I/O Panel
The simulator/debugger has a GUI I/O function for simulating a simple key-input or key-output
panel of the user target system in a window. This virtual I/O panel is created in the [GUI I/O]
window. That is, virtual buttons and virtual LEDs are arranged in this window to allow the input
and output of data.
Figure 3.82 Example of a GUI I/O Window
161
SuperH™ RISC engine Simulator/Debugger User’s Manual
3.14.1
Opening the [GUI I/O] Window
Choose [View -> Graphic -> GUI I/O] or click the [GUI I/O] toolbar button
I/O] window.
to open the [GUI
Figure 3.83 [GUI I/O] Window
This window is used to arrange the following items.
Button: Press a button for input of data to a virtual port or generation of a virtual interrupt.
Label:
A character string which is shown when the value written to a selected address or bit was
the specified value and hidden otherwise.
LED:
A defined region in which a specified color is displayed (representing illumination of a
LED) when the value written to a selected address or bit was the specified value.
Text:
A region for the display of a text string.
162
SuperH™ RISC engine Simulator/Debugger User’s Manual
3.14.2
Creating a Button
Click on the
button of the toolbar or choose [Create Button] from the pop-up menu. The
mouse cursor turns into a “+” symbol. Create the button by dragging the mouse cursor from a
higher-left to a lower-right position.
Figure 3.84 GUI I/O Window (Create Button)
163
SuperH™ RISC engine Simulator/Debugger User’s Manual
•
Specifying the event generated by clicking the button
Press the
button on the toolbar and double-click on the created button to open the [Set Button]
dialog box.
Figure 3.85 Set Button Dialog Box
Enter the name of the button, input port address, and input data. The button name must not include
white space.
164
SuperH™ RISC engine Simulator/Debugger User’s Manual
3.14.3
Creating a Label
Click on the
button of the toolbar or choose [Create Label] from the pop-up menu. The mouse
cursor turns into a “+” symbol. Drag the mouse cursor from a higher-left to a lower-right position.
This shows the frame for the label.
Figure 3.86 GUI I/O Window (Create Label)
Press the
button on the toolbar or choose [Select Item] from the pop-up menu and double-click
on the created label to open the [Set Label] dialog box. Specify the responses to events. The label
name must not include white space.
165
SuperH™ RISC engine Simulator/Debugger User’s Manual
•
Response to writing of either value to a selected bit
The settings shown below set up display of the character string “Printing in progress” or “Printer
ready” when the value of bit 3 at address 0x3E0 is 0 or 1, respectively.
Figure 3.87 Set Label Dialog Box (Bit Selection)
166
SuperH™ RISC engine Simulator/Debugger User’s Manual
•
Response to writing of specified values to a selected address
The settings shown below set up display of the character string “Printing in progress” or “Printer
ready” when the value 0x10 or 0x20, respectively, is written to address 0x3E0.
Figure 3.88 Set Label Dialog Box (Data Selection)
167
SuperH™ RISC engine Simulator/Debugger User’s Manual
3.14.4
Creating an LED
Click on the
button on the toolbar or choose [Create LED] from the pop-up menu. The mouse
cursor turns into a “+” symbol. Drag the mouse cursor from an upper left to a lower right position.
This shows the frame for the LED output.
Figure 3.89 GUI I/O Window (Create LED)
Press the
button on the toolbar or choose [Select Item] from the pop-up menu and double-click
on the created LED to open the [Set LED] dialog box. Specify the events and responses.
168
SuperH™ RISC engine Simulator/Debugger User’s Manual
•
Response to writing of either value to a selected bit
The settings shown below set up the display of green or red, respectively, in the LED area when
the value of bit 2 at address 0x3E0 is 0 or 1.
Figure 3.90 Set LED Dialog Box (Bit Selection)
169
SuperH™ RISC engine Simulator/Debugger User’s Manual
•
Response to writing of specified values to a selected address
The settings shown below set up the display of green or red, respectively, in the LED area when
the value 0x10 or 0x20 is written to address 0x3E0.
Figure 3.91 Set LED Dialog Box (Data Selection)
Clicking the [Color 1] or [Color 2] button opens the [Color] dialog box, which allows you to select
the color.
170
SuperH™ RISC engine Simulator/Debugger User’s Manual
3.14.5
Creating Fixed Text
Click the
button on the toolbar or choose [Create Text] from the pop-up menu. The mouse
cursor turns into a “+” symbol. Create the text box by dragging the mouse cursor from a higherleft to a lower-right position.
Figure 3.92 GUI I/O Window (Create Fixed Text)
171
SuperH™ RISC engine Simulator/Debugger User’s Manual
•
Setting the format for the text
Press the
button on the toolbar and double-click on the created text to open the [Set Text]
dialog box.
Figure 3.93 Set Text Dialog Box
Click the [Font…] button to select the font and size for the text. Then click the [Text] and [Back]
buttons to specify the colors of the text and its background.
172
SuperH™ RISC engine Simulator/Debugger User’s Manual
3.14.6
Changing the Size and Position of an Item
Press the
button on the toolbar and click on the item. The item is selected as shown in the
figure below.
Figure 3.94 GUI I/O Window (Item Selected)
Drag the item to change its position or the control points to change its size.
3.14.7
Copying an Item
Press the
button on the toolbar or choose [Copy] from the pop-up menu. The mouse cursor
turns into a “+” symbol. In this state, click on the item you wish to copy. Press the
button on
the toolbar or choose [Paste] from the pop-up menu to create a new item with the same size and
attributes.
3.14.8
Deleting an Item
Press the
button on the toolbar or choose [Delete] from the pop-up menu. The mouse cursor
turns into a “+” symbol. In this state, click on the item you wish to delete.
173
SuperH™ RISC engine Simulator/Debugger User’s Manual
3.14.9
Showing the Grid
Press the
button on the toolbar or choose [Display Grid] from the pop-up menu. This displays
the grid on the background.
Figure 3.95 GUI I/O Window (Show Grid)
Clicking the
button again hides the grid.
3.14.10 Saving I/O Panel Information
It is possible to reuse created I/O panels by saving the information in files. Press the
button on
the toolbar or choose [Save] from the pop-up menu to open the [Save GUI I/O Panel File] dialog
box. Specify the directory where the file is to be stored and enter the file name.
3.14.11 Loading I/O Panel Information
Press the
button on the toolbar or choose [Load] from the pop-up menu to open the [Load GUI
I/O Panel File] dialog box. Specify the file you wish to load. Panel information prior to the load
will be deleted.
174
SuperH™ RISC engine Simulator/Debugger User’s Manual
Section 4 Windows
Table 4.1 lists the windows.
Refer to the simulator/debugger help about the toolbar buttons.
Table 4.1
Simulator/Debugger Windows
Window Name
Function
Cache
Viewing the cache contents
Command Line
Debugging with the Command Line Interface
Coverage
Acquiring Code Coverage
Disassembly
Viewing the Assembly-Language Code
Editor
Viewing a Program
Event
Using the Simulator/Debugger Breakpoints
GUI I/O
Creating a Virtual I/O Panel
Image
Displaying Memory Contents as an Image
IO
Viewing the I/O Memory
Label
Looking at Labels
Local
Looking at Variables (local variables)
Memory
Viewing a Memory Area
Profile/Profile-Chart
Viewing the Profile Information
Performance Analysis
Analyzing Performance
Register
Looking at Registers
Register Bank
Viewing the Contents of Register Banks
Simulated I/O
Standard I/O and File I/O Processing
Stack Trace
Viewing the Function Call History
Status
Viewing the Current Status
TLB
Viewing the TLB contents
Trace
Viewing the Trace Information
Trigger
Generating a Pseudo-Interrupt Manually
Watch
Looking at Variables (any variables)
Wave
Displaying Memory Contents as Waveforms
175
SuperH™ RISC engine Simulator/Debugger User’s Manual
176
SuperH™ RISC engine Simulator/Debugger User’s Manual
Section 5 Command Lines
5.1
Commands (Functional Order)
The following tables show the commands in functional order.
Refer to the help about each command.
5.1.1
Execution
Command Name
Abbreviation
Function
GO
GO
Executes user program
GO_RESET
GR
Executes user program from reset vector
GO_TILL
GT
Executes user program until temporary breakpoint
HALT
HA
Halts the user program
RESET
RE
Resets CPU
STEP
ST
Steps program (by instructions or source lines)
STEP_MODE
SM
Selects the step mode
STEP_OUT
SP
Steps out of the current function
STEP_OVER
SO
Steps program, not stepping into functions
STEP_RATE
SR
Sets or displays rate of stepping
STEP_UNIT
SN
Sets the unit of execution
177
SuperH™ RISC engine Simulator/Debugger User’s Manual
5.1.2
Download
Command Name
Abbreviation
Function
BUILD
BU
Performs a build on the current project
BUILD_ALL
BL
Performs a build all on the current project
BUILD_FILE
BF
Compiles files
BUILD_MULTIPLE
BM
Builds multiple projects
CLEAN
CL
Deletes intermediate and output files produced
in building
DEFAULT_OBJECT_FORMAT
DO
Sets the default object (program) format
FILE_LOAD
FL
Loads an object (program) file
FILE_LOAD_ALL
LA
Loads all object (program) files
FILE_SAVE
FS
Saves memory to a file
FILE_UNLOAD
FU
Unloads an object (program) file from memory
FILE_UNLOAD_ALL
UA
Unloads all object (program) files from memory
FILE_VERIFY
FV
Verifies file contents against memory
GENERATE_MAKE_FILE
GM
Generates a build makefile for the current
workspace
5.1.3
Register
Command Name
Abbreviation
Function
REGISTER_ADDRESS_ RAG
GET
Displays the address of the bank control register
REGISTER_ADDRESS_ RAS
SET
Sets the address of the bank control register
REGISTER_DISPLAY
RD
Displays CPU register values
REGISTER_SET
RS
Changes CPU register contents
178
SuperH™ RISC engine Simulator/Debugger User’s Manual
5.1.4
Register Bank (SH2A-FPU Only)
Command Name
Abbreviation
Function
REGISTER_BANK_
DISPLAY
RBD
Displays register bank values
REGISTER_BANK_SET RBS
5.1.5
Changes the contents of register banks
Memory
Command Name
Abbreviation
Function
CACHE
-
Sets caching on or off
MEMORY_COMPARE
MC
Compares memory contents
MEMORY_DISPLAY
MD
Displays memory contents
MEMORY_EDIT
ME
Modifies memory contents
MEMORY_FILL
MF
Modifies the content of a memory area by specifying
data
MEMORY_FIND
MI
Finds a string in an area of memory
MEMORY_MOVE
MV
Moves a block of memory
MEMORY_TEST
MT
Tests a block of memory
5.1.6
Assemble/Disassemble
Command Name
Abbreviation
Function
ASSEMBLE
AS
Assembles instructions into memory
DISASSEMBLE
DA
Disassembles memory contents
SYMBOL_ADD
SA
Defines a symbol
SYMBOL_CLEAR
SC
Deletes a symbol
SYMBOL_LOAD
SL
Loads a symbol information file
SYMBOL_SAVE
SS
Saves a symbol information file
SYMBOL_VIEW
SV
Displays symbols
179
SuperH™ RISC engine Simulator/Debugger User’s Manual
5.1.7
Break
Command Name
Abbreviation
Function
BREAKPOINT
BP
Sets a breakpoint at an instruction address
BREAK_ACCESS
BA
Specifies a memory range access as a break condition
BREAK_CLEAR
BC
Deletes breakpoints
BREAK_CYCLE
BCY
Specifies a cycle as a break condition
BREAK_DATA
BD
Specifies a memory data value as a break condition
BREAK_DATA_
DIFFERENCE
BDD
Specifies a difference between two values of data in
memory as a break condition
BREAK_DATA_
INVERSE
BDI
Specifies inversion of the sign of a value of data in
memory as a break condition
BREAK_DISPLAY
BI
Displays a list of breakpoints
BREAK_ENABLE
BE
Enables or disables a breakpoint
BREAK_REGISTER
BR
Specifies a register data as a break condition
BREAK_SEQUENCE
BS
Sets sequential breakpoints
SET_DISASSEMBLY_ SDB
SOFT_BREAK
Sets or deletes a software breakpoint at the
disassembly level
SET_SOURCE_
SOFT_BREAK
SSB
Sets or deletes a software breakpoint at the source level
STATE_
DISASSEMBLY_
SOFT_BREAK
TDB
Enables or disables a software breakpoint at the
disassembly level
STATE_SOURCE_
SOFT_BREAK
TSB
Enables or disables a software breakpoint at the source
level
5.1.8
Trace
Command Name
Abbreviation
Function
TRACE
TR
Displays trace information
TRACE_ACQUISITION
TA
Enables or disables trace information acquisition
TRACE_SAVE
TV
Outputs trace information into a file
TRACE_STATISTIC
TST
Analyzes statistic information
180
SuperH™ RISC engine Simulator/Debugger User’s Manual
5.1.9
Coverage
Command Name
Abbreviation
Function
COVERAGE
CV
Enables or disables coverage measurement
COVERAGE_DISPLAY
CVD
Displays coverage information
COVERAGE_LOAD
CVL
Loads coverage information
COVERAGE_RANGE
CVR
Sets a coverage range
COVERAGE_SAVE
CVS
Saves coverage information
5.1.10
Performance
Command Name
Abbreviation Function
ANALYSIS
AN
Enables or disables performance analysis
ANALYSIS_RANGE
AR
Sets or displays performance analysis functions
ANALYSIS_RANGE_DELETE
AD
Deletes a performance analysis range
PROFILE
PR
Enables or disables profile
PROFILE_DISPLAY
PD
Displays profile information
PROFILE_SAVE
PS
Saves the profile information to file
5.1.11
Watch
Command Name
Abbreviation Function
WATCH_ADD
WA
Adds an item for watching
WATCH_AUTO_UPDATE
WU
Selects or cancels automatic updating of watched
items
WATCH_DELETE
WD
Deletes a watched item
WATCH_DISPLAY
WI
Displays the contents of the Watch window
WATCH_EDIT
WE
Edits the value of a watched item
WATCH_EXPAND
WX
Expands or collapses a watched item
WATCH_RADIX
WR
Changes the radix for display of watched items
WATCH_RECORD
WO
Outputs the history of updating of the values of a
watched item to a file
WATCH_SAVE
WS
Saves the contents of the Watch window to a file
181
SuperH™ RISC engine Simulator/Debugger User’s Manual
5.1.12
Script/Logging
Command Name
Abbreviation
Function
!
-
Comment
ASSERT
-
Checks if an expression is true or false
AUTO_COMPLETE
AC
Enables or disables the auto-complete function
ERASE
ER
Clears the [Command Line] window
EVALUATE
EV
Evaluates an expression
LOG
LO
Controls command output logging
SLEEP
-
Delays command execution
SUBMIT
SU
Executes a command file
TCL
-
Displays TCL information
5.1.13
Memory Resource
Command Name
Abbreviation
Function
MAP_DISPLAY
MA
Displays memory resource settings
MAP_SET
MS
Allocates a memory area
5.1.14
Simulator/Debugger Settings
Command Name
Abbreviation
Function
CLOCK_RATE
CKR
Sets a clock rate
EXEC_MODE
EM
Sets and displays execution mode
EXEC_STOP_SET
ESS
Sets or displays the execution mode at the
occurrence of an interrupt
182
SuperH™ RISC engine Simulator/Debugger User’s Manual
5.1.15
Standard I/O and File I/O
Command Name
Abbreviation
SIMULATEDIO_CLEAR
SIOC
Clears the contents of the [Simulated I/O] window
TRAP_ADDRESS
TP
Sets a simulated I/O address
TRAP_ADDRESS_DISPLAY
TD
Displays simulated I/O address settings
TRAP_ADDRESS_ENABLE
TE
Enables or disables the simulated I/O
5.1.16
Function
Utility
Command Name
Abbreviation
Function
HELP
HE
Displays the command line help
INITIALIZE
IN
Initializes the debugging platform
QUIT
QU
Exits HEW
RADIX
RA
Sets default input radix
RESPONSE
RP
Sets an interval to refresh the window
STATUS
STA
Displays the debugging platform status
TOOL_INFORMATION
TO
Outputs information on the currently registered tool to
a file
183
SuperH™ RISC engine Simulator/Debugger User’s Manual
5.1.17
Project/Workspace
Command Name
Abbreviation Function
ADD_FILE
AF
Adds a file to the current project
CHANGE_CONFIGURATION
CC
Sets the current configuration
CHANGE_PROJECT
CP
Sets the current project
CHANGE_SESSION
CS
Changes the current session
CHANGE_SUB_SESSION
CB
Changes the currently active session when
simultaneous debugging is enabled
CLEAR_OUTPUT_WINDOW
COW
Clears the contents of the specified tab in the
[Output] window
CLOSE_WORKSPACE
CW
Close the current workspace
OPEN_WORKSPACE
OW
Opens a workspace
REFRESH_SESSION
RSE
Updates information on the session
REMOVE_FILE
REM
Removes a file from the current project
SAVE_SESSION
SE
Saves the current session
SAVE_WORKSPACE
SW
Saves the current workspace
UPDATE_ALL_DEPENDENCIES UD
5.1.18
Updates all build dependencies of the current
project
Test Tool Facility
Command Name
Abbreviation
Function
CLOSE_TEST_SUITE
CTS
Closes a test suite
COMPARE_TEST_DATA
CTD
Compares test data
OPEN_TEST_SUITE
OTS
Opens a test suite
RUN_TEST
RT
Executes a test
184
SuperH™ RISC engine Simulator/Debugger User’s Manual
5.2
Commands (Alphabetical Order)
Table 5.1 lists the commands in alphabetical order.
Refer to the help about each command.
Table 5.1
Simulator/Debugger Commands
No. Command Name
Abbreviation Function
1
!
-
Comment
2
ADD_FILE
AF
Adds a file to the current project
3
ANALYSIS
AN
Enables or disables performance analysis
4
ANALYSIS_RANGE
AR
Sets or displays performance analysis functions
5
ANALYSIS_RANGE_
DELETE
AD
Deletes a performance analysis range
6
ASSEMBLE
AS
Assembles instructions into memory
7
ASSERT
-
Checks if an expression is true or false
8
AUTO_COMPLETE
AC
Enables or disables the auto-complete function
9
BREAKPOINT
BP
Sets a breakpoint at an instruction address
10
BREAK_ACCESS
BA
Specifies a memory range access as a break condition
11
BREAK_CLEAR
BC
Deletes breakpoints
12
BREAK_CYCLE
BCY
Specifies a cycle as a break condition
13
BREAK_DATA
BD
Specifies a memory data value as a break condition
14
BREAK_DATA_
DIFFERENCE
BDD
Specifies a difference between two values of data in
memory as a break condition
15
BREAK_DATA_
INVERSE
BDI
Specifies inversion of the sign of a value of data in
memory as a break condition
16
BREAK_DISPLAY
BI
Displays a list of breakpoints
17
BREAK_ENABLE
BE
Enables or disables a breakpoint
18
BREAK_REGISTER
BR
Specifies a register data as a break condition
19
BREAK_SEQUENCE
BS
Sets sequential breakpoints
20
BUILD
BU
Performs a build on the current project
21
BUILD_ALL
BL
Performs a build all on the current project
22
BUILD_FILE
BF
Compiles files
23
BUILD_MULTIPLE
BM
Builds multiple projects
185
SuperH™ RISC engine Simulator/Debugger User’s Manual
Table 5.1
Simulator/Debugger Commands (cont)
No. Command Name
Abbreviation
Function
24
CACHE
-
Sets caching on or off
25
CHANGE_
CONFIGURATION
CC
Sets the current configuration
26
CHANGE_PROJECT
CP
Sets the current project
27
CHANGE_SESSION
CS
Changes the current session
28
CHANGE_SUB_
SESSION
CB
Changes the currently active session when
simultaneous debugging is enabled
29
CLEAN
CL
Deletes intermediate and output files produced in
building
30
CLEAR_OUTPUT_
WINDOW
COW
Clears the contents of the specified tab in the
[Output] window
31
CLOCK_RATE
CKR
Sets a clock rate
32
CLOSE_TEST_SUITE
CTS
Closes a test suite
33
CLOSE_WORKSPACE
CW
Close the current workspace
34
COMPARE_TEST_
DATA
CTD
Compares test data
35
COVERAGE
CV
Enables or disables coverage measurement
36
COVERAGE_DISPLAY
CVD
Displays coverage information
37
COVERAGE_LOAD
CVL
Loads coverage information
38
COVERAGE_RANGE
CVR
Sets a coverage range
39
COVERAGE_SAVE
CVS
Saves coverage information
40
DEFAULT_OBJECT_
FORMAT
DO
Sets the default object (program) format
41
DISASSEMBLE
DA
Disassembles memory contents
42
ERASE
ER
Clears the [Command Line] window
43
EVALUATE
EV
Evaluates an expression
44
EXEC_MODE
EM
Sets and displays execution mode
45
EXEC_STOP_SET
ESS
Sets or displays the execution mode at the
occurrence of an interrupt
46
FILE_LOAD
FL
Loads an object (program) file
47
FILE_LOAD_ALL
LA
Loads all object (program) files
48
FILE_SAVE
FS
Saves memory to a file
186
SuperH™ RISC engine Simulator/Debugger User’s Manual
Table 5.1
Simulator/Debugger Commands (cont)
No. Command Name
Abbreviation
Function
49
FILE_UNLOAD
FU
Unloads an object (program) file from memory
50
FILE_UNLOAD_ALL
UA
Unloads all object (program) files from memory
51
FILE_VERIFY
FV
Verifies file contents against memory
52
GENERATE_MAKE_FILE GM
Generates a build makefile for the current
workspace
53
GO
GO
Executes user program
54
GO_RESET
GR
Executes user program from reset vector
55
GO_TILL
GT
Executes user program until temporary breakpoint
56
HALT
HA
Halts the user program
57
HELP
HE
Displays the command line help
58
INITIALIZE
IN
Initializes the debugging platform
59
LOG
LO
Controls command output logging
60
MAP_DISPLAY
MA
Displays memory resource settings
61
MAP_SET
MS
Allocates a memory area
62
MEMORY_COMPARE
MC
Compares memory contents
63
MEMORY_DISPLAY
MD
Displays memory contents
64
MEMORY_EDIT
ME
Modifies memory contents
65
MEMORY_FILL
MF
Modifies the content of a memory area by specifying
data
66
MEMORY_FIND
MI
Finds a string in an area of memory
67
MEMORY_MOVE
MV
Moves a block of memory
68
MEMORY_TEST
MT
Tests a block of memory
69
OPEN_TEST_SUITE
OTS
Opens a test suite
70
OPEN_WORKSPACE
OW
Opens a workspace
71
PROFILE
PR
Enables or disables profile
72
PROFILE_DISPLAY
PD
Displays profile information
73
PROFILE_SAVE
PS
Saves the profile information to file
74
QUIT
QU
Exits HEW
75
RADIX
RA
Sets default input radix
76
REFRESH_SESSION
RSE
Updates information on the session
187
SuperH™ RISC engine Simulator/Debugger User’s Manual
Table 5.1
Simulator/Debugger Commands (cont)
No. Command Name
Abbreviation
Function
77
REGISTER_ADDRESS_
GET
RAG
Displays the address of bank control registers
78
REGISTER_ADDRESS_
SET
RAS
Sets the address of bank control registers
79
REGISTER_DISPLAY
RD
Displays CPU register values
80
REGISTER_SET
RS
Changes CPU register contents
81
REGISTER_BANK_
DISPLAY
RBD
Displays register bank values
82
REGISTER_BANK_SET
RBS
Changes the contents of register banks
83
REMOVE_FILE
REM
Removes a file from the current project
84
RESET
RE
Resets CPU
85
RESPONSE
RP
Sets an interval to refresh the window
86
RUN_TEST
RT
Executes a test
87
SLEEP
-
Delays command execution
88
SAVE_SESSION
SE
Saves the current session
89
SAVE_WORKSPACE
SW
Saves the current workspace
90
SET_DISASSEMBLY_
SOFT_BREAK
SDB
Sets or deletes a software breakpoint at the
disassembly level
91
SET_SOURCE_
SOFT_BREAK
SSB
Sets or deletes a software breakpoint at the source
level
92
SIMULATEDIO_CLEAR
SIOC
Clears the contents of the [Simulated I/O] window
93
STATE_DISASSEMBLY_ TDB
SOFT_BREAK
Enables or disables a software breakpoint at the
disassembly level
94
STATE_SOURCE_
SOFT_BREAK
TSB
Enables or disables a software breakpoint at the
source level
95
STATUS
STA
Displays the debugging platform status
96
STEP
ST
Steps program (by instructions or source lines)
97
STEP_MODE
SM
Selects the step mode
98
STEP_OUT
SP
Steps out of the current function
99
STEP_OVER
SO
Steps program, not stepping into functions
100 STEP_RATE
SR
Sets or displays rate of stepping
101 STEP_UNIT
SN
Sets the unit of execution
188
SuperH™ RISC engine Simulator/Debugger User’s Manual
Table 5.1
Simulator/Debugger Commands (cont)
No. Command Name
Abbreviation
Function
102 SUBMIT
SU
Executes a command file
103 SYMBOL_ADD
SA
Defines a symbol
104 SYMBOL_CLEAR
SC
Deletes a symbol
105 SYMBOL_LOAD
SL
Loads a symbol information file
106 SYMBOL_SAVE
SS
Saves a symbol information file
107 SYMBOL_VIEW
SV
Displays symbols
108 TCL
-
Enables or disables the TCL
109 TOOL_INFORMATION TO
Outputs information on the currently registered tool
to a file
110 TRACE
Displays trace information
TR
111 TRACE_ACQUISITION TA
Enables or disables trace information acquisition
112 TRACE_SAVE
TV
Outputs trace information into a file
113 TRACE_STATISTIC
TST
Analyzes statistic information
114 TRAP_ADDRESS
TP
Sets a simulated I/O address
115 TRAP_ADDRESS_
DISPLAY
TD
Displays simulated I/O address settings
116 TRAP_ADDRESS_
ENABLE
TE
Enables or disables the simulated I/O
117 UPDATE_ALL_
DEPENDENCIES
UD
Updates all build dependencies of the current
project
118 WATCH_ADD
WA
Adds an item for watching
119 WATCH_AUTO_
UPDATE
WU
Selects or cancels automatic updating of watched
items
120 WATCH_DELETE
WD
Deletes a watched item
121 WATCH_DISPLAY
WI
Displays the contents of the Watch window
122 WATCH_EDIT
WE
Edits the value of a watched item
123 WATCH_EXPAND
WX
Expands or collapses a watched item
124 WATCH_RADIX
WR
Changes the radix for display of watched items
125 WATCH_RECORD
WO
Outputs the history of updating of the values of a
watched item to a file
126 WATCH_SAVE
WS
Saves the contents of the Watch window to a file
189
SuperH™ RISC engine Simulator/Debugger User’s Manual
190
SuperH™ RISC engine Simulator/Debugger User’s Manual
Section 6 Messages
6.1
Information Messages
The simulator/debugger outputs information messages as listed in table 6.1 to notify users of
execution status.
Table 6.1
Information Messages
Message
Contents
Break Access (Access
Address: H'nnnnnnnn,
Type: xxxx, Access
Size: yyyy)
An access break condition was satisfied so execution has stopped. The
information in parentheses shows the satisfied access break condition
(accessed address, access type, and access unit).
Break Cycle
(Cycle: H'nnnnnnnn)
A number-of-cycles condition was satisfied so execution has stopped. The
information in parentheses shows the satisfied number-of-cycles condition
(number of cycles).
A data break condition ([Equal] or [Not equal]) was satisfied so execution
Break Data (Access
Address: H'nnnnnnnn, has stopped. The information in parentheses shows the satisfied data
Data: H'mmmmmmmm) break condition (accessed address and value).
Break Data (Access
Address: H'nnnnnnnn,
Previous Data:
H'mmmmmmmm,
Current Data:
H'mmmmmmmm)
A data break condition ([Inverse sign] or [Difference]) was satisfied so
execution has stopped. The information in parentheses shows the
satisfied data break condition (accessed address, and previous and
current values).
Break Register
(Register: XX, Value:
H'mmmmmmmm)
A register break condition was satisfied so execution has stopped. The
information in parentheses shows the satisfied register break condition
(register name and value).
Break Sequence
(PC: H'nnnnnnnn)
A sequential break condition was satisfied so execution has stopped. The
information in parentheses shows the satisfied sequential break condition
(address of the last instruction).
I/O DLL Stop
The peripheral function has stopped.
PC Breakpoint
(PC: H'nnnnnnnn)
A PC breakpoint condition was satisfied so execution has stopped. The
information in parentheses shows the satisfied PC-breakpoint condition
(instruction address).
Sleep
Execution has been stopped by the SLEEP instruction.
Step Normal End
The step execution succeeded.
191
SuperH™ RISC engine Simulator/Debugger User’s Manual
Table 6.1
Information Messages (cont)
Message
Contents
Stop
Execution has been stopped by the [Stop] button.
Trace Buffer Full
Since the Break mode was selected by [Trace buffer full handling] in the
[Trace Acquisition] dialog box and the trace buffer became full, execution
was terminated.
6.2
Error Messages
The simulator/debugger outputs error messages to notify users of the errors of user programs or
operation. Table 6.2 lists the error messages.
Table 6.2
Error Messages
Message
Contents
Address Error
One of the following states occurred:
•
The PC value was an odd number.
•
An instruction was read from the internal I/O area.
•
Word data was accessed to an address that was not a multiple of 2.
•
Longword data was accessed to an address that was not a multiple of 4.
•
The VBR or SP value was not a multiple of 4.
•
An error occurred in the exception processing of an address error.
Correct the user program to prevent the error.
Exception Error
An error occurred during exception processing.
Correct the user program to prevent the error.
File Open Error
An error occurred during opening a file with the file-input/output action of
Break. Correct the file setting.
File Input Error
An error occurred during reading a file with file-input/output action of Break.
Correct the file setting.
File Output Error
An error occurred during writing to a file with file-input/output action of Break.
Correct the file setting.
FPU Disable
An attempt was made to execute an FPU instruction while the FPU is disabled
(SR.FD = 1). Correct the user program to prevent the error.
192
SuperH™ RISC engine Simulator/Debugger User’s Manual
Table 6.2
Error Messages (cont)
Message
Contents
FPU Error
One of the following states occurred during floating-point operation:
•
An FPU error
•
An invalid operation
•
A division by zero
•
An overflow
•
An underflow
•
An inaccurate operation
Correct the user program to prevent the error.
General Invalid
Instruction
Either of the following states occurred:
•
A code other than an instruction was executed.
•
An error occurred in the exception processing of a reserved instruction
exception.
Correct the user program to prevent the error.
Illegal CCR2 Set
The CCR2 value is illegal. Check the setting.
Illegal Combination An attempt was made to access the area for which the BSC register setting
BSC Register
was invalid. Correct the user program to prevent the error.
Illegal DSP
Operation
Either of the following states occurred:
•
A shift of more than 32 bits was executed with the PSHA instruction.
•
A shift of more than 16 bits was executed with the PSHL instruction.
Correct the user program to prevent the error.
Illegal LRU Set
The LRU value of the cache is invalid. Check the setting.
Illegal Operation
Either of the following states occurred:
•
A division by zero occurred during DIV1 instruction execution.
•
Zero was written to by the SETRC instruction.
Correct the user program to prevent the error.
Illegal PR bit
An attempt was made to execute an FPU instruction while the PR bit value of
the FPSCR is illegal. Correct the user program to prevent the error.
Initial Page Write
An initial page write exception occurred during simulation. Take necessary
procedures such as updating the TLB contents.
Instruction TLB
Illegal LRU
The LRU value in the instruction TLB is illegal. Check the setting.
193
SuperH™ RISC engine Simulator/Debugger User’s Manual
Table 6.2
Error Messages (cont)
Message
Contents
Instruction TLB Miss
An instruction TLB miss occurred during memory access. Take
necessary procedures such as updating the instruction TLB contents.
Instruction TLB Multiple
Hit
Multiple instruction TLB entries were hit when a virtual address was
accessed during simulation or command execution. The instruction TLB
is not correctly set. Modify instruction TLB contents and user program
(handler routine).
Instruction TLB
Protection Violation
An instruction TLB protection exception occurred during memory
access. Take necessary procedures such as updating the instruction
TLB contents.
Interrupt Exception
An interrupt exception occurred, execution halted.
Invalid DSP Instruction
Code
An invalid instruction code was detected in the DSP parallel instruction.
Correct the user program to prevent the error.
Invalid Slot Instruction
Either of the following states occurred:
•
An instruction that changes the PC value (a branch instruction)
immediately after a delayed branch instruction was executed.
•
An error occurred during the exception processing of an invalid slot
instruction.
Correct the user program to prevent the error.
Invalid Register Bank
Number
A bank or entry that does not exist was specified in a STBANK or
LDBANK instruction. Specify a correct bank or entry.
I/O area not exist
An attempt was made to delete the I/O area. Be sure to set the I/O area.
I/O DLL Illegal Interrupt
Information on interrupts is incorrect. [errNum] shows the details on this
Information (errNum=2xx) error. Correct the information.
[errNum]
200: The specified vector is outside the supported range.
201: The specified priority is outside the supported range.
I/O DLL Memory Access An error has occurred during a memory access to the peripheral
function. [errNum] shows the details on this error and [Address] shows
Error (errNum=0xx,
Address=0xXXXXXXXX) the address where this error occurred. Correct the user program
according to the error information.
[errNum]
001: The specified address is outside the supported range.
002: No memory exists in the specified area.
003: The required memory cannot be allocated.
004: The specified data size is outside the supported range.
005: The specified address cannot be accessed.
194
SuperH™ RISC engine Simulator/Debugger User’s Manual
Table 6.2
Error Messages (cont)
Message
Contents
I/O DLL Register Access An error has occurred during a register access to the peripheral
Error (errNum=1xx,
function. [errNum] shows the details on this error and [RegisterName]
RegisterName=xxxx)
shows the register where this error occurred. Correct the user program
according to the error information.
[errNum]
100: The register description is incorrect.
101: The specified data value is incorrect.
Memory Access Error
(Address: H'nnnnnnnn)
One of the following events occurred (the information in parentheses
shows the target address for the operation that generated the error):
•
A memory area that had not been allocated was accessed.
•
Data was written to a memory area having the write-protected
attribute.
•
Data was read from a memory area having the read-disabled
attribute.
•
A memory area in which memory does not exist was accessed.
Allocate memory, change the memory attribute, or correct the user
program to prevent the memory from being accessed.
Multiple Exception
Multiple exceptions occurred. Correct the user program to prevent the
error.
PMB Multiple Hit
Multiple PMB entries were hit when a virtual address was accessed
during simulation or command execution. PMB is not correctly set.
Modify PMB contents and user program (handler routine).
PMB Miss
PMB miss occurred during simulation or command execution. Take
necessary procedures such as updating the PMB contents.
Register Bank Overflow
An interrupt that uses register banks was generated after acceptance of
register bank overflows had been selected and data had been saved in
all register banks.
Register Bank Underflow A RESBANK instruction was executed when no data had been saved in
the register banks.
Slot FPU Disable
An attempt was made to execute an FPU instruction in a delay slot while
the FPU is disabled (SR.FD = 1). Correct the user program to prevent
the error.
System Call Error
Simulated I/O error occurred. Modify the incorrect contents of registers
R0, R1, and parameter block.
195
SuperH™ RISC engine Simulator/Debugger User’s Manual
Table 6.2
Error Messages (cont)
Message
Contents
The memory resource
has not been set up
The memory resource was set outside the range of memory mapping.
Modify the memory resource settings so that no error will occur.
TLB Invalid
TLB invalid exception occurred during simulation or command
execution. Take necessary procedures such as updating the TLB
contents.
TLB Miss
TLB miss occurred during simulation or command execution. Take
necessary procedures such as updating the TLB contents.
TLB Multiple Hit
Multiple TLB entries were hit when a virtual address was accessed
during simulation or command execution. TLB is not correctly set.
Modify TLB contents and user program (handler routine).
TLB Protection Violation
Illegal TLB protection exception occurred during simulation. Take
necessary procedures such as updating the TLB contents.
Unified TLB Miss
A unified TLB miss occurred during memory access. Take necessary
procedures such as updating the unified TLB contents.
Unified TLB Multiple Hit
Multiple unified TLB entries were hit when a virtual address was
accessed during simulation or command execution. The unified TLB is
not correctly set. Modify the unified TLB contents and user program
(handler routine).
Unified TLB Protection
Violation
A unified TLB protection exception occurred during memory access.
Take necessary procedures such as updating the unified TLB contents.
196
SuperH™ RISC engine Simulator/Debugger User’s Manual
Section 7 Tutorial
7.1
Preparation
The basic functions of the simulator/debugger will be described in this section using a sample
program.
Note: The contents of usage examples (figures) in this section will differ depending on the
compiler version.
7.1.1
Sample Program
The HEW demonstration program is used for the sample program and is written in C language. It
first sorts ten random data in the ascending order, and then in the descending order. The sample
program:
(1) Generates random data for sorting using the main function.
(2) Inputs the array which stores the random data that is generated by the main function, then sorts
the data in the ascending order using the sort function.
(3) Inputs the array generated by the sort function, and sorts the data in the descending order using
the change function.
(4) Displays the random data and the sorted data using the printf function.
The HEW demonstration program is used as the sample program.
7.1.2
Creating the Sample Program
Note the following when creating the HEW demonstration program:
• Specify [Demonstration] for [Project Type] in [Creating a New Workspace].
• Specify [SH-1] for [CPU Series:].
• Specify [SH-1 Simulator] for [Target:].
• Specify [SimDebug_SH-1] (
building the project.
) for the configuration on the toolbar before
• Specify [SimSession_SH-1] (
) for the session on the toolbar.
• This demonstration program uses no peripheral function (timer). In the [Set Peripheral
Function Simulation] dialog box that opens when the session is changed, check [Don’t show
this dialog box] and then press the [OK] button.
197
SuperH™ RISC engine Simulator/Debugger User’s Manual
Since this section explains the debugging function, [Demonstration] has not been optimized. Do
not change this setting.
7.2
Settings for Debugging
7.2.1
Allocating the Memory Resource
The allocation of the memory resource is necessary to run the application being developed. When
using the demonstration project, the memory resource is allocated automatically, so check the
setting.
• Select [Simulator->Memory Resource...] from the [Setup] menu, and display the allocation of
the current memory resource.
Figure 7.1 Simulator System Dialog Box (Memory Page)
198
SuperH™ RISC engine Simulator/Debugger User’s Manual
The program area is allocated to the range of the addresses H'00000000 to H'00007FFF. The stack
area is allocated to the range of the addresses H'0FFFE000 to H'0FFFFFFF, which can be read
from or written to.
• Close the dialog box by clicking [OK].
The memory resource can also be referred to or modified by using the [Debugger] page on the
[SuperH RISC engine Standard Toolchain] dialog box. Changes made in either of the dialog
boxes are reflected.
7.2.2
Downloading the Sample Program
When using the demonstration project, the sample program to be downloaded is automatically set,
so check the settings.
• Open the [Debug Setting] dialog box by selecting [Debug Settings...] on the [Debug] menu.
Figure 7.2 Debug Settings Dialog Box
• Files to be downloaded are listed in [Download Modules].
• Close the [Debug Settings] dialog box by clicking the [OK] button.
199
SuperH™ RISC engine Simulator/Debugger User’s Manual
• Download the sample program by selecting [Download Modules->All Download Modules]
from the [Debug] menu.
7.2.3
Displaying the Source Program
The HEW supports source-level debugging. Display the source file ("Tutorial.c") in the [Source]
window.
• Open the [Source] window by double-clicking Tutorial.c on the [Workspace] window.
Figure 7.3 Source Window (Displaying the Source Program)
200
SuperH™ RISC engine Simulator/Debugger User’s Manual
7.2.4
Setting a PC Breakpoint
Breakpoints can be set easily via the [Source] window. To set a breakpoint on a line that includes
the sort function call:
• Place the cursor in the line that includes the sort function call and click the right mouse button
to launch the pop-up menu, and select [Toggle Breakpoint] from the pop-up menu.
Figure 7.4 Source Window (Setting the Breakpoint)
A [ • ] is displayed at the line that includes the sort function call, indicating that the PC breakpoint
is set at the address.
201
SuperH™ RISC engine Simulator/Debugger User’s Manual
7.2.5
Setting the Profiler
• Open the [Profile] window by selecting [Profile] from the [View->Performance] menu.
Figure 7.5 Profile Window
• Open the pop-up menu by right clicking the mouse on the [Profile] window, and select [Enable
Profiler] to enable acquisition of the profile information.
202
SuperH™ RISC engine Simulator/Debugger User’s Manual
7.2.6
Setting the Simulated I/O
When the demonstration project is used, the simulated I/O is automatically set, so check the
setting.
• Open the [Simulator System] dialog box by selecting [Simulator->System] from the [Setup]
menu.
Figure 7.6 Simulator System Dialog Box (System Page)
• Confirm that [Enable] of [Simulated I/O Address] is checked.
• Click the [OK] button to enable the simulated I/O.
• Select [Simulated I/O] from the [View->CPU] menu and open the [Simulated I/O] window.
The simulated I/O will not be enabled if the [Simulated I/O] window is not open.
203
SuperH™ RISC engine Simulator/Debugger User’s Manual
Figure 7.7 Simulated I/O Window
204
SuperH™ RISC engine Simulator/Debugger User’s Manual
7.2.7
Setting the Trace Information Acquisition Conditions
• Select [Trace] from the [View->Code] menu to open the [Trace] window. Open the pop-up
menu by right clicking the mouse on the [Trace] window, and select [Acquisition...] from the
pop-up menu.
The [Trace Acquisition] dialog box below will be displayed.
Figure 7.8 Trace Acquisition Dialog Box
• Set [Trace Start/Stop] to [Enable] in the [Trace Acquisition] dialog box, and click the [OK]
button to enable the acquisition of the trace information.
205
SuperH™ RISC engine Simulator/Debugger User’s Manual
7.2.8
Setting the Stack Pointer and Program Counter
To execute the program, the program counter must be set from the location of the reset vector. In
the reset vector of the sample program, the PC value H'800 is written, and the SP value
H'0FFFFFF0 is written.
• Select [Reset CPU] from the [Debug] menu, or click the [Reset CPU] button on the toolbar.
Set the program counter to H'800, and the stack pointer to H'0FFFFFF0 from the reset vector.
Figure 7.9 Reset CPU Button
7.3
Start Debugging
7.3.1
Executing a Program
• Select [Go] from the [Debug] menu, or click the [Go] button on the toolbar.
Figure 7.10 Go Button
The program halts where a breakpoint is set. An arrow is displayed in the [Source] window,
indicating the location the execution has stopped. As the termination cause, [PC Breakpoint (PC:
H’000013F8)] is displayed in the [Output] window.
206
SuperH™ RISC engine Simulator/Debugger User’s Manual
Figure 7.11 Source Window (Break Status)
207
SuperH™ RISC engine Simulator/Debugger User’s Manual
The termination cause can be displayed in the [Status] window.
• Select [Status] from the [View->CPU] menu to open the [Status] window, and select the
[Platform] sheet in the [Status] window.
Figure 7.12 Status Window
The above status window indicates that:
(1) The cause of break is a PC breakpoint
(2) Execution is performed from the pipeline reset
(3) The number of executed instructions by the GO command is 57,801
(4) The executed number of cycles from the pipeline reset is 116,463
208
SuperH™ RISC engine Simulator/Debugger User’s Manual
Register values can be checked in the [Register] window.
• Select [Registers] from the [View->CPU] menu.
Figure 7.13 Register Window
Register values when the program is terminated can be checked.
209
SuperH™ RISC engine Simulator/Debugger User’s Manual
7.3.2
Using the Trace Buffer
The trace buffer can be used to clarify the history of instruction execution.
• Select [Trace] from the [View->Code] menu to open the [Trace] window. Scroll up to the very
top of the window.
Figure 7.14 Trace Window (Trace Information Display)
210
SuperH™ RISC engine Simulator/Debugger User’s Manual
7.3.3
Performing Trace Search
Click the right mouse button on the [Trace] window to launch the pop-up menu, and select
[Find...] to open the [Trace Search] dialog box.
Figure 7.15 Trace Search Dialog Box
Setting the item to be searched to [Item] and the contents to be searched to [Value] and clicking
the [OK] button begins the trace search. When the searched item is found, the first line is
highlighted. To continue searching the same contents [Value], click the right mouse button in the
[Trace] window to display the pop-up menu, and select [Find Next] from the pop-up menu. The
next searched line is highlighted.
211
SuperH™ RISC engine Simulator/Debugger User’s Manual
Figure 7.16 Trace Window (Searched Result)
7.3.4
Checking Simulated I/O
Random data that is displayed by the printf function can be checked in the [Simulated I/O]
window.
Figure 7.17 Simulated I/O Window
• Do not close the [Simulated I/O] window.
212
SuperH™ RISC engine Simulator/Debugger User’s Manual
7.3.5
Checking the Breakpoints
A list of all the breakpoints that are set in the program can be checked in the [Event] window.
• Select [Eventpoints] from the [View -> Code] menu.
Figure 7.18 Event Window
A breakpoint can be set, a new breakpoint can be defined, and a breakpoint can be deleted using
the [Event] window.
• Close the [Event] window.
7.3.6
Watching Variables
It is possible to watch the values of variables used in your program and to verify that they change
in the way that you expected. For example, set a watch on the long-type array “a” declared at the
beginning of the program, by using the following procedure:
• Select [Watch] from the [View -> Symbol] menu to open the [Watch] window. And click the
right mouse button on the [Watch] window and choose [Add Watch...] from the pop-up menu.
The following dialog box will be displayed.
Figure 7.19 Add Watch Dialog Box
213
SuperH™ RISC engine Simulator/Debugger User’s Manual
• Type array “a” and click the [OK] button.
The [Watch] window will show the long-type array “a”.
You can double-click the + symbol to the left of array “a” in the [Watch] window to expand the
variable and show the individual elements in the array.
Figure 7.20 Watch Window
• Close the [Watch] window.
214
SuperH™ RISC engine Simulator/Debugger User’s Manual
7.3.7
Executing the Program in Single Steps
The simulator/debugger has various stepping menus that are useful in debugging the program.
Menu
Description
Step In
Executes each statement (includes statements within the function)
Step Over
Executes a function call in a single step
Step Out
Steps out of a function, and stops at the next statement of the program that called
the function
Step...
Executes the specified number of steps at the specified speed
[Step In]: Enters the called function and stops at the statement at the start of the called function.
• To step in the sort function, select [Step In] from the [Debug] menu, or click the [Step In]
button on the toolbar.
Figure 7.21 Step In Button
215
SuperH™ RISC engine Simulator/Debugger User’s Manual
Figure 7.22 Source Window (Step In)
• The PC location display (=>) in the [Source] window moves to the statement at the start of the
sort function.
216
SuperH™ RISC engine Simulator/Debugger User’s Manual
[Step Out]: Steps out of the called function and stops at the next statement in the called program.
• Select [Step Out] from the [Debug] menu to exit the sort function, or click the [Step Out]
button on the toolbar.
Figure 7.23 Step Out Button
Figure 7.24 Source Window (Step Out)
217
SuperH™ RISC engine Simulator/Debugger User’s Manual
[Step Over]: Executes a function call in a single step, and stops at the next statement in the main
program.
Select [Step Over] from the [Debug] menu or click the [Step Over] button on the toolbar to step
over the statements in the printf function.
Figure 7.25 Step Over Button
Figure 7.26 Source Window (Step Over)
218
SuperH™ RISC engine Simulator/Debugger User’s Manual
When the printf function has been executed, *** Sorting results *** will be displayed in the
[Simulated I/O] window.
7.3.8
Checking Profile Information
The profile information can be checked in the [Profile] window.
• Clicking the [Go] button and continuing execution from the current PC executes the SLEEP
instruction and then stops.
[List] Sheet: Displays the profile information as a list.
• Open the [Profile] window by selecting [Profile] from the [View->Performance] menu. The
[List] sheet will be displayed.
Figure 7.27 Profile Window (List Sheet)
In the above figure, it can be found that the __flclose function was called six times, the execution
cycle was 447, the external memory was accessed nine times, and the internal memory was
accessed 63 times.
It is possible to search for the critical path, such as a function that is called or accesses the memory
many times, for the program performance.
219
SuperH™ RISC engine Simulator/Debugger User’s Manual
[Tree] Sheet: Displays the profile information as a tree diagram.
• Select the [Tree] sheet. Double-clicking the function name in the [Profile] window expands or
minimizes the tree structure.
Figure 7.28 Profile Window (Tree Sheet)
In above figure, it can be found that the __flclose function was called three times from the _fclose
function, the execution cycle was 315, the external memory was accessed three times, and the
internal memory was accessed 45 times.
220
SuperH™ RISC engine Simulator/Debugger User’s Manual
[Profile-Chart] Window: Displays the relation of calls for a specific function.
• Select the __flclose function on the [Profile] window. Open the pop-up menu by right clicking
the mouse on the [Profile] window, and select [View Profile-Chart] to display the [ProfileChart] window.
Figure 7.29 Profile-Chart Window
In the above figure, it can be found that the __flclose function was called three times from the
_fclose and _freopen functions, and the _close function was called three times.
This is the end of the tutorial using the simulator/debugger.
221
SuperH™ RISC engine Simulator/Debugger User’s Manual
222
Renesas Microcomputer Development Environment System
User's Manual
SuperHTM RISC engine Simulator/Debugger
Publication Date: Rev.4.00, July 25, 2007
Published by:
Sales Strategic Planning Div.
Renesas Technology Corp.
Edited by:
Customer Support Department
Global Strategic Communication Div.
Renesas Solutions Corp.
© 2007. Renesas Technology Corp., All rights reserved. Printed in Japan.
Sales Strategic Planning Div.
Nippon Bldg., 2-6-2, Ohte-machi, Chiyoda-ku, Tokyo 100-0004, Japan
RENESAS SALES OFFICES
http://www.renesas.com
Refer to "http://www.renesas.com/en/network" for the latest and detailed information.
Renesas Technology America, Inc.
450 Holger Way, San Jose, CA 95134-1368, U.S.A
Tel: <1> (408) 382-7500, Fax: <1> (408) 382-7501
Renesas Technology Europe Limited
Dukes Meadow, Millboard Road, Bourne End, Buckinghamshire, SL8 5FH, U.K.
Tel: <44> (1628) 585-100, Fax: <44> (1628) 585-900
Renesas Technology (Shanghai) Co., Ltd.
Unit 204, 205, AZIACenter, No.1233 Lujiazui Ring Rd, Pudong District, Shanghai, China 200120
Tel: <86> (21) 5877-1818, Fax: <86> (21) 6887-7898
Renesas Technology Hong Kong Ltd.
7th Floor, North Tower, World Finance Centre, Harbour City, 1 Canton Road, Tsimshatsui, Kowloon, Hong Kong
Tel: <852> 2265-6688, Fax: <852> 2730-6071
Renesas Technology Taiwan Co., Ltd.
10th Floor, No.99, Fushing North Road, Taipei, Taiwan
Tel: <886> (2) 2715-2888, Fax: <886> (2) 2713-2999
Renesas Technology Singapore Pte. Ltd.
1 Harbour Front Avenue, #06-10, Keppel Bay Tower, Singapore 098632
Tel: <65> 6213-0200, Fax: <65> 6278-8001
Renesas Technology Korea Co., Ltd.
Kukje Center Bldg. 18th Fl., 191, 2-ka, Hangang-ro, Yongsan-ku, Seoul 140-702, Korea
Tel: <82> (2) 796-3115, Fax: <82> (2) 796-2145
Renesas Technology Malaysia Sdn. Bhd
Unit 906, Block B, Menara Amcorp, Amcorp Trade Centre, No.18, Jalan Persiaran Barat, 46050 Petaling Jaya, Selangor Darul Ehsan, Malaysia
Tel: <603> 7955-9390, Fax: <603> 7955-9510
Colophon 6.0
SuperH™ RISC engine Simulator/Debugger
User’s Manual
1753, Shimonumabe, Nakahara-ku, Kawasaki-shi, Kanagawa 211-8668 Japan
REJ10B0210-0400