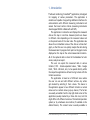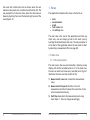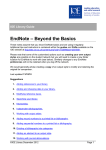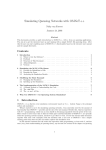
1
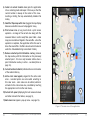
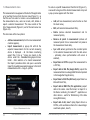
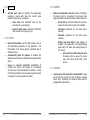
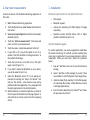
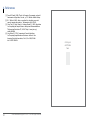
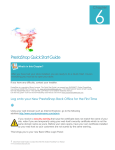
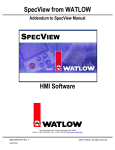
USER MANUAL (for version 1.53) www.routemonitoring.net [email protected] 2014 Dear customer, thank you for choosing the Route monitoring for AndroidTM application for your mapping needs. We hope that the application will serve you really well and support you with all the functionality that you need. With kind regards, Dr. Toni Petrovič Prodesign Table of Contents 1. Introduction...........................................................7 1. Views....................................................................9 1.1 Main view.............................................................9 1.1.1 View description ..............................................9 1.1.2 Current Info panel description............................ 12 1.1.3 Averaging data in certain radius from origin location... 14 1.1.3 Map pop-up menu description............................. 16 1.1.4 Main menu description...................................... 16 1.2 Measurements view.............................................. 18 1.3 Graph view......................................................... 20 1.4 Color scales view.................................................. 22 1.5 Settings view....................................................... 24 1.5.1 MEASUREMENT................................................ 24 1.5.2 MEASUREMENTLOCATION................................... 24 1.5.3 MAP DISPLAY.................................................. 25 1.5.4 ALERTS......................................................... 26 1.5.5 OTHER.......................................................... 26 1.5.6 SERVER......................................................... 27 1.5.7 EXPORT......................................................... 27 2. Start new measurement........................................... 28 3. Installation........................................................... 29 Minimal requirements for the Android device................. 29 Quick installation guide:........................................... 29 4. References........................................................... 30 1. Introduction The Route monitoring for AndroidTM (application) is designed for mapping of various parameters. The application is modular and capable of supporting additional interfaces for communication with different measuring instruments and sensors that meet certain criteria (measuring instruments should support RS232 or Bluetooth with SPP). The application is interactive and displays the measured data on the map in real time. Measured points are shown in different colors depending on the measured values and on the preset levels of the color scale. The application also allows for an immediate review of the data on a time-chart graph, so that the user can quickly analyze the data during the measurement in progress. Each point on the graph can be displayed on the map at the actual measurement location. All of the captured data is stored in the database for later access, analysis or export. The user can export the measured data in various formats (*.CSV - Comma-separated values, *.KML - Google Earth, *.XLSX - MS Excel, etc.) to be opened directly within the respective applications without having to deal with the format conversions. The application is based on of different views where the user can see and edit different actions. Any action gets invoked by selecting it from a menu. The menus in the application appear in two different formats: as normal menus and as context menus (pop-up menus). The former are usually accessible from the top right-hand corner of the application (usually marked by a three dots icon, but this might differ with different versions of the Android operation system) or by a hardware menu button (if available on the Android device). The context menu is usually available in www.routemonitoring.net I © 2012 - 2014 I All rights reserved 7 the views that contain lists and are shown when the user executes a long touch over a certain record from the list. The only exception is in the main view, where the main menu is shown by touching the icon at the bottom right corner of the view (Figure1-11). 1. Views The application is based on five views, referred to as: • • • • • main, measurements, graph, color scales and the settings view. The main view is the root of the application and from any other view, one can always go back to the main view by touching the Android device back icon. The only exception is at the start of the application where the user needs to start by selecting a measurement first (see page 28). 1.1 Main view 1.1.1 View description The main view is the one used most often, featuring a map display with all the recorded points on it. In the main view, the user can select and view every recorded point. Figure 1 illustrates the main view that consists of the: 1) Measurements view icon (invokes the measurement view), 2) Measurement info panel (the title of current measurement and the info about the connection to the active measurement device), 3) Start/Stop icon (starts the measurement and a long touch stops it – the icon changes accordingly), 8 www.routemonitoring.net I © 2012 - 2014 I All rights reserved www.routemonitoring.net I © 2012 - 2014 I All rights reserved 9 4) Center at current location icon (puts the application into a centering mode and keeps it that way so that the current location is always at the center of the view touching or sliding the map automatically disables this mode), 5) Satellite / Topo map switch icon (toggles the map display between a satellite view and a topographic view), 6) Print screen icon (a long touch starts a print screen operation - an image of the current view along with the measured data in surfer-ready files (excel table + base map) are recorded and zipped in the same file - when the operation is complete, the application offers the user to share the created file - the file is also stored on the device under the /RouteMonitoring/screenshots/ folder), 7) Remove selected point information overlay (removes the map overlay with the information on the previously selected point – this icon only becomes visible when a point information overlay is active - see description on page 14), 8) Current location indicator (indicates the current location of the android device), 9) Active color scale legend (a legend for the active color scale - recorded points are color-coded according to this color scale - color scales can be edited, added or activated in the color scales view, reachable by touching the appropriate icon from the main menu), 10)Current info panel (displaying the last measured values and other relevant information, see page 9), 11)Main menu icon (opens a pop-up menu - see page 14). Figure 1: The main view of the application 10 www.routemonitoring.net I © 2012 - 2014 I All rights reserved www.routemonitoring.net I © 2012 - 2014 I All rights reserved 11 1.1.2 Current Info panel description The Current info panel shows all the current or last received data from the measurement device (Figure 2-7) and the last known geo-location data (Figure 2-8). 5) a red disconnected plug icon indicates that the application tried to send data over an internet connection to the data server, but that there was a problem sending, 6) a CF display indicates that a user changed a calibration factor in the plug-in settings for the current measuring device and that the measured value is being corrected by multiplying the received value by the CF value, 7) the collected value - modified by the CF parameter when the latter is not set to unity, 8) the number of accumulated measured points and the geolocation data, collected from the GPS or via a network provider: • N – the number of recorded values, • acc – estimated location accuracy of the current location (defined as the radius of a 68% confidence circle - it is assumed that the location errors are random with a normal distribution, so the 68% confidence circle radius represents one standard deviation - note that in practice, location errors do not always follow such a simple distribution - further, this is only a horizontal accuracy estimator and does not indicate the accuracy of bearing or velocity), • the location provider is shown in round brackets, 2) a red satellite icon indicates that the GPS location might be old or inaccurate, • E – location longitude, • N – location latitude, 3) a red shield indicates the application is rejecting new data due to a tight proximity to a previously recorded point (see Minimum distance between measurements in the section Settings view), • h – location elevation (this value is correct only when the application is in normal mode (not in averaging) with a GPS location provider). Figure 2: Current info panel This panel also indicates via different icons when some of the other functions are either activated or not working: 1) a red dot icon indicates that the application is connected to the measuring device and is collecting data from it, 4) a green arrow indicates that the application is sending data to the data server, 12 www.routemonitoring.net I © 2012 - 2014 I All rights reserved www.routemonitoring.net I © 2012 - 2014 I All rights reserved 13 1.1.3 Averaging data in certain radius from origin location The application can average the received data within a radius (Figure 3-1) around a desired area. To activate the averaging, one needs to enable the “Average measurements in the selected radius” option in the settings (see the Settings view description). With this option enabled, the user can set the radius of the averaging area. When recording the measurements in the averaging mode, the final value will be recorded by its σn = s2n Equation 3: Standard deviation at point n (n − 1)xn−1 + xn ) xn − xn−1 = xn−1 + n 2 n sn 3-3), • its standard deviation ( σn )= (Figure • mean value ( xn )= (Figure 3-2), • the number of averaged points (n) (Figure 3-4) and • the averaged longitude and latitude (in the current info panel, current location data is shown and not the averaged one). When the device location is outside the green circled area, a new center of the averaging circle is defined, a new averaging procedure starts with n=0 and the value of recorded points in the database (N) is incremented by one. The application uses an incremental algorithm [1-4] to calculate the mean and the standard deviation on the fly: xn = (n − 1)xn−1 + xn xn − xn−1 = xn−1 + n n Equation 1: Mean value at point n s2n = (n − 2) 2 (xn − x̄n−1 )2 sn−1 + , n>1 (n − 1) n Equation 2: Sample variance at point n 14 www.routemonitoring.net I © 2012 - 2014 I All rights reserved Figure 3: The main view in averaging mode www.routemonitoring.net I © 2012 - 2014 I All rights reserved 15 1.1.3 Map pop-up menu description • Backup (a backup of the current database is created and stored on the device under the /RouteMonitoring/ db/ folder - the filename of the backup file is created automatically from the current timestamp in a YEAR-MONTH-DAY-HOUR-MIN-SEC-rm.db format the application also backups the database on its own once every 10 exit actions - the filename of the auto backup file includes, in addition, a string “auto” right before the “rm” part – only the last ten automatically generated backup files are kept, others are erased automatically), • Restore Backup (restores the database from the last manual or automatic backup - when the restore procedure starts, the user is prompted to type a PIN number for safety, so that the current database cannot be erased by mistake - the PIN can be set in the settings view), WARNING: When the database is restored, the previous database is irreversibly lost! • Check for updates (the application will check for online software updates on the web server), • About (displays the version of the application, as well as data of the end user license, the software author and the memory usage), • Exit (closes the application after an additional popup prompt). A quick check on the information pertaining to a particular measured point on the map, or a manual setting of the location, can be achieved by a long touch on the desired location on the map. A pop-up menu will appear, displaying two options: • Show nearest point info (show the information on the nearest recorded point - to remove the resulting overlay, touch the icon of Figure 1-7), • Set location manually (to manually set the current location, useful for work in the areas without a GPS signal - to switch back to a geo-location provider, repeat the same steps, but select remove manual location from the pop-up). 1.1.4 Main menu description The icon 11 of Figure 1 brings up the main pop-up menu, consisting of the following options: 16 • Color scale (a Color scales view appears, where users can create, edit or activate color scales), • Measuring devices (a pop-up list appears with all the measuring device plug-ins available, allowing the user to switch to another measuring device and to connect to it), • Graph (opens up a view with all the measured data plotted as a function of time), • Settings (opens a Settings view, where one can edit individual preferences), www.routemonitoring.net I © 2012 - 2014 I All rights reserved www.routemonitoring.net I © 2012 - 2014 I All rights reserved 17 1.2 Measurements view The measurements view appears at the start of the application or by touching the icon from the main view (Figure 1-1), so that the user can select or create a new measurement. In the measurements view, users can create, edit, delete or export a selected measurement. This view consists of the list of measurements (Figure 4-1) and of the main menu icon (Figure 4-2). The main menu offers two options: • Add new measurement (a form for new measurement creation appears), • Import measurement (a pop-up list with all the exported measurements for the current measuring device is displayed - all the Route monitoring export files (*.rme or *.rmex) are stored on the device under the /RouteMonitoring/export/rmex/ folder - after selection of a stored measurement the import procedure starts and upon a successful import the loaded measurements appear in the list of measurements with a »Copy of« prefix). Figure 4: Measurements view 18 www.routemonitoring.net I © 2012 - 2014 I All rights reserved To work on a specific measurement from the list (Figure 4-1), one needs to long-touch the desired measurement entry and a pop-up menu appears with the items: • Add (add new measurement, same function as from the main menu), • Edit (edit selected measurement title), • Delete (remove selected measurement and its measured points), • Remove all points in measurement (remove all measured points from a measurement but preserve the measurement main data), • Sync with server (synchronize the recorded points in the selected measurement with the data server - optionally, when synchronization with server is enabled), • Export data to CSV file (export the measurement to a CSV file), • Export data to KML file (Google Earth) (export the measurement data to a Google KML file to be imported in the Google Earth application), • Export data to XLSX file (MS Excel) (export data to a Microsoft Excel file), • Export data to RMEX file (this application) (export data in the native .rmex file format, to import it in the Route monitoring for AndroidTM application on other devices - useful for field-sharing of the data among field teams), • Export data to GK, zone 5 (csv) (Export data to a CSV file, with coordinates referred in a Gauss-Krüger coordinate system, zone 5). www.routemonitoring.net I © 2012 - 2014 I All rights reserved 19 After a successful export, the user is prompted to share the exported data through third party applications (Dropbox, if installed on the device, e-mail, etc...). All the exported files are stored on the device under the /RouteMonitoring/export/{extension of exported file}/ folder. When the user entered the measurements view from the main view, they can return to the main view by touching the back button. 1.3 Graph view The graph view is accessible via the main menu of the main view (Figure 1-11). It provides for a quick online view of the data values plotted over time (Figure 5-2). This graph is interactive and updates automatically whenever new points are recorded. The chart supports panning and zoom options. The chart can be zoomed vertically (Figure 5-1) and horizontally (Figure 5-3) by touching the +/- icons that appear after touching the view. To see the entire dataset, touch the 1:1 icon. At a certain zoom level, the long-touch pop-up menu also becomes enabled to allow certain actions with the selected point: • Show point on map (the chart view is closed and the selected point is shown highlighted in the main view on the map), • Delete selected point (a point deletion procedure begins), • Synchronize point (starts a synchronization of the selected point with the data server - optional, when server synchronization is enabled). Figure 5: Graph view 20 www.routemonitoring.net I © 2012 - 2014 I All rights reserved www.routemonitoring.net I © 2012 - 2014 I All rights reserved 21 1.4 Color scales view Color scale view is accessible via the main menu of the main view (Figure 1-11). It allows for creation of custom color scales in the database so that one can quickly switch between color scales suited to different field conditions. This view consists of a list of color scales (Figure 6-1) and a main menu icon (Figure 6-2). Every color scale group is created from a color scale object that contains a color scale title and its child color objects, called levels. When the view loads, only the color scale objects are visible in the list. Touching on a specific color scale title displays a nested tree of its child level objects. Every level has a range (Figure 6-3) and its associated color (Figure 6-4) information. Upon a long-touch on a level object, a pop-up menu appears with the following options: • Add level (add new level to the same parent color scale object), • Remove level (remove selected level), • Edit level (edit selected level). The main menu consists of one item called Add new color scale. By touching it, a color scale pop-up form appears, asking for the name of the new color scale. After the addition of a new color scale, it appears in the list. A long touch on a color scale object opens a pop-up menu, consisting of: 22 • Add new color scale (same functionality as when invoked from the main menu), • Activate color scale (the selected color scale becomes active and its legend is visible in the main view - Figure 1-9 - The user can also activate a certain color scale by touching the checkmark icon to the right-hand side of the color scale title in the list (Figure 6-5) – the currently active color scale has green checkmark next to it), • Edit (to edit the selected color scale title), • Delete (a delete procedure for an entire color scale item starts), • Add level (a new level form appears, asking for an upper limit and level color, the latter being settable by touching the circle next to the »Color« label). www.routemonitoring.net I © 2012 - 2014 I All rights reserved Figure 6: Color scales view www.routemonitoring.net I © 2012 - 2014 I All rights reserved 23 1.5 Settings view Upon touching the Settings item in the main pop-up menu (see page 14), the settings view appears. It contains the parameters that users can modify according to their needs. Parameters are grouped into larger groups: 1.5.1 MEASUREMENT • Enable acquire interval (when enabled, a minimum time between two consecutive data-points will be enforced, this time is specified in the field below), o Data acquire interval (the acquisition interval in seconds - example: when setting the acquisition to 5 seconds, the application will only accept one data-point within each 5 second interval - all other incoming data will be ignored). • • 1.5.2 MEASUREMENTLOCATION • Minimum time to refresh GPS fix (how often the device checks for fresh GPS information (in seconds) - for reliable data, it is preferred to have this value set to one second), • Minimum distance between measurements (set a minimum distance between two consecutive measured points – ignore incoming data until the www.routemonitoring.net I © 2012 - 2014 I All rights reserved Enable network provider (when checked, the application augments geo-location with additional data by the network provider). 1.5.3 MAP DISPLAY • Show GEO data (if enabled, the geo-location data is shown in the current info panel of the main view Figure 2), • Location format (set the display format for latitude and longitude in the current info panel of the main view - this is only for display purposes - latitude and longitude are always stored in the database in a decimal degree format), • Refresh points interval (set the number of points accumulated when the overlays on the map get updated - example: if the value is set to five, the map overlays update with every fifth recorded point useful when a large number of points are on the map and the update procedure takes too much time to draw all the overlays on the map), • Size of points on map (define the size of the measurement points on the map - defined in the density independent pixel format of the android system), • Show color scale (if checked, the color scale legend is shown in the main view - Figure 1-9). Average measurements in the selected radius (with this option enabled, the application will average all data acquired within a specific radius (see below) around the first recorded location), o Radius of the averaging area (the averaging area radius in meters). 24 device is moved a certain distance from the location of the previously measured point), www.routemonitoring.net I © 2012 - 2014 I All rights reserved 25 1.5.4 ALERTS • Activate alert value (If checked, the application produces a sound alert when the current value exceeds a limit value, set below): 1.5.6 SERVER • o Limit value (the threshold value for the activation of a sound alert), o Server URL (an internet address of the server where the server side scripts are installed), o Sound for alert value (a selection of different alert sounds from a pop-up list). o Username (username for the data server account), o Password (password for the data server account), 1.5.5 OTHER 26 Enable communication with the server (if enabled, the device will be connected to the server side application that has to be installed on the data server) • Restore PIN number (set the PIN number used in the restoration procedure of the database - this PIN number is for safety against accidental loss of database data), • Automatically check for updates (if enabled, the application will check for updates at every application start), • Secure or insecure bluetooth connection (if checked, the device will connect to a measuring device via an insecure bluetooth connection - useful if the bluetooth device on the measuring device does not support a secure connection mode). www.routemonitoring.net I © 2012 - 2014 I All rights reserved o Enable auto-send data to the server (if enabled, the application will automatically send every N-th point (see setting below) to the server), Auto-send every Nth measured point to server (enter a value of N, where every N-th value will be sent to the server). 1.5.7 EXPORT • Overlay point size exported to Google Earth (scale the size of the overlay icon that is shown in Google Earth after importing the exported KML data to Google Earth application). www.routemonitoring.net I © 2012 - 2014 I All rights reserved 27 2. Start new measurement 3. Installation Connect the device with the Route Monitoring application in this order: Minimal requirements for the Android device: • GPS support, 1. Start the Route Monitoring application. • Bluetooth support, 2. Touch the Try button or enter license information for full version. • working 3G networking (for field display of Google maps tiles), 3. Select your measuring device from the list (example: Automess [Sv/h]). • Operation system: Android version 4.0.3 or higher (tested to Android version 4.4.3). 4. Touch the “Add new measurement” in the menu and enter a title for your measurement. 5. Touch the newly created measurement in the list 6. If your GPS is off, you will be asked to turn it on (enable “Use GPS satellites in Settings/Location” in the android OS settings). 7. Touch the record icon (a red dot icon) in the rightupper corner (Figure 1-3). 8. If you didn’t enable the Bluetooth on your device, you will be asked to turn it on. 9. Select the Bluetooth device (if it’s not paired yet, proceed by touching the “Search for devices” icon and pair the devices - some devices cause pairing problems within the application -if so, please perform the pairing procedure in the Android system). 10. When the device is connected it will show a red dot in the info panel at the bottom of the page (Figure 2-1) and will start to receive records from the measuring device. 28 www.routemonitoring.net I © 2012 - 2014 I All rights reserved Quick installation guide: To use the application, you need an application installation file (Route monitoring for android v{version number}.apk) and a plug-in application for your measuring device ({device name}.apk). When you have both, follow the procedure below: 1. Copy all *.apk files to the root of your android device storage, 2. locate *.apk files in a file manager (if you don’t have one installed, try ES File Explorer from Google Play), 3. install each apk file by touching it in the file manager (to install apk files locally, enable Unknown sources in Settings/Applications), 4. Start the Route Monitoring for AndroidTM and follow the procedure of section 2. www.routemonitoring.net I © 2012 - 2014 I All rights reserved 29 4. References [1] Donald E. Knuth (1998). The Art of Computer Programming, volume 2: Seminumerical Algorithms, 3rd edn., p. 232. Boston: Addison-Wesley. [2] B. P. Welford (1962).«Note on a method for calculating corrected sums of squares and products«. Technometrics 4(3):419–420. [3] Chan, Tony F.; Golub, Gene H.; LeVeque, Randall J. (1983). Algorithms for Computing the Sample Variance: Analysis and Recommendations. The American Statistician 37, 242-247. http://www.jstor.org/ stable/2683386 [4] Ling, Robert F. (1974). Comparison of Several Algorithms for Computing Sample Means and Variances. Journal of the American Statistical Association, Vol. 69, No. 348, 859-866. doi:10.2307/2286154 30 www.routemonitoring.net I © 2012 - 2014 I All rights reserved stick your certificate here Route monitoring for AndroidTM PRODESIGN, Toni Petrovič s.p. Pečice 8 SI-3257 Podsreda Slovenia, Europe [email protected] www.routemonitoring.net