1
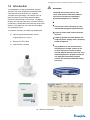
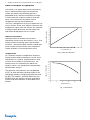
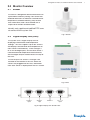
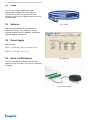
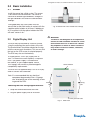
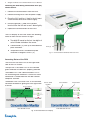
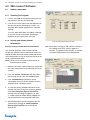
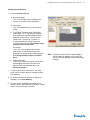
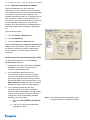
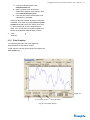
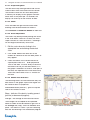
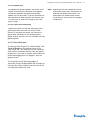
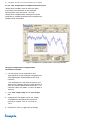
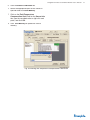
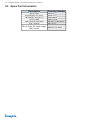
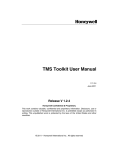
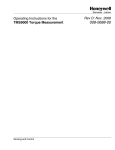
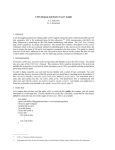
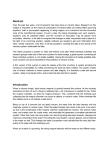
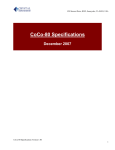
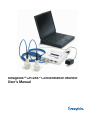
Swagelok® CR-288® Concentration Monitor User’s Manual 2 Swagelok CR-288 Concentration Monitor User’s Manual Contents 1.0 Introduction . . . . . . . . . . . . . . . . . . . . . . . . . . . . . . . . . . . . . . . . . . . . . . . . . . . . . . . . . . 3 Basic Principles of Operation . . . . . . . . . . . . . . . . . . . . . . . . . . . . . . . . . . . . . . . . . . . . . 4 2.0 Monitor Overview . . . . . . . . . . . . . . . . . . . . . . . . . . . . . . . . . . . . . . . . . . . . . . . . . . . . . . 5 2.1 Sensor ......................................................... 5 2.2 Digital Display Unit . . . . . . . . . . . . . . . . . . . . . . . . . . . . . . . . . . . . . . . . . . . . . . . . . 5 2.3 Cable .......................................................... 6 2.4 Software . . . . . . . . . . . . . . . . . . . . . . . . . . . . . . . . . . . . . . . . . . . . . . . . . . . . . . . . . . 6 2.5 Power Supply. . . . . . . . . . . . . . . . . . . . . . . . . . . . . . . . . . . . . . . . . . . . . . . . . . . . . . 6 2.6 Serial to USB Adapter . . . . . . . . . . . . . . . . . . . . . . . . . . . . . . . . . . . . . . . . . . . . . . . 6 3.0 Basic Installation . . . . . . . . . . . . . . . . . . . . . . . . . . . . . . . . . . . . . . . . . . . . . . . . . . . . . . . 7 3.1 Sensor ......................................................... 7 3.2 Digital Display Unit (DDU) . . . . . . . . . . . . . . . . . . . . . . . . . . . . . . . . . . . . . . . . . . . . 7 3.3 Cable .......................................................... 9 3.4 Software. . . . . . . . . . . . . . . . . . . . . . . . . . . . . . . . . . . . . . . . . . . . . . . . . . . . . . . . . . 9 4.0 288-connect Software . . . . . . . . . . . . . . . . . . . . . . . . . . . . . . . . . . . . . . . . . . . . . . . . . . 10 4.1 Basic Functions . . . . . . . . . . . . . . . . . . . . . . . . . . . . . . . . . . . . . . . . . . . . . . . . . . . . 10 4.1.1 Opening the Program . . . . . . . . . . . . . . . . . . . . . . . . . . . . . . . . . . . . . . . . . . . 10 4.1.2 Editing and Saving Sensor Information . . . . . . . . . . . . . . . . . . . . . . . . . . . . . 10 4.1.3 Chemical Calibration of Sensor . . . . . . . . . . . . . . . . . . . . . . . . . . . . . . . . . . . 12 4.1.4 Data Graphing . . . . . . . . . . . . . . . . . . . . . . . . . . . . . . . . . . . . . . . . . . . . . . . . 13 4.1.4.1 Graph Navigation . . . . . . . . . . . . . . . . . . . . . . . . . . . . . . . . . . . . . . . . . 14 4.1.4.2 Zoom . . . . . . . . . . . . . . . . . . . . . . . . . . . . . . . . . . . . . . . . . . . . . . . . . . . 14 4.1.4.3 Scale Adjustment . . . . . . . . . . . . . . . . . . . . . . . . . . . . . . . . . . . . . . . . . 14 4.1.4.4 Shown Data. . . . . . . . . . . . . . . . . . . . . . . . . . . . . . . . . . . . . . . . . . . . . . 14 4.1.4.5 Update Info . . . . . . . . . . . . . . . . . . . . . . . . . . . . . . . . . . . . . . . . . . . . . . 15 4.1.4.6 Pause Data Collection . . . . . . . . . . . . . . . . . . . . . . . . . . . . . . . . . . . . . 15 4.1.4.7 Clear All Graphs . . . . . . . . . . . . . . . . . . . . . . . . . . . . . . . . . . . . . . . . . . 15 4.1.4.8 Find Temperature Compensation Coefficient . . . . . . . . . . . . . . . . . . . 16 4.1.5 Data Logging . . . . . . . . . . . . . . . . . . . . . . . . . . . . . . . . . . . . . . . . . . . . . . . . . 18 4.2 Advanced Functions . . . . . . . . . . . . . . . . . . . . . . . . . . . . . . . . . . . . . . . . . . . . . . . . 19 4.2.1 Using the Digital Outputs. . . . . . . . . . . . . . . . . . . . . . . . . . . . . . . . . . . . . . . . 19 4.2.2 Chemical Concentration Offset . . . . . . . . . . . . . . . . . . . . . . . . . . . . . . . . . . 21 4.2.3 Rolling Averages . . . . . . . . . . . . . . . . . . . . . . . . . . . . . . . . . . . . . . . . . . . . . . 22 5.0 Maintenance . . . . . . . . . . . . . . . . . . . . . . . . . . . . . . . . . . . . . . . . . . . . . . . . . . . . . . . . . . 23 5.1 Re-Zero . . . . . . . . . . . . . . . . . . . . . . . . . . . . . . . . . . . . . . . . . . . . . . . . . . . . . . . . . . 23 5.2 Window Cleaning . . . . . . . . . . . . . . . . . . . . . . . . . . . . . . . . . . . . . . . . . . . . . . . . . . . 24 6.0 Monitor Operation: Stand Alone DDU . . . . . . . . . . . . . . . . . . . . . . . . . . . . . . . . . . . . . . 25 6.1 Initial Setup. . . . . . . . . . . . . . . . . . . . . . . . . . . . . . . . . . . . . . . . . . . . . . . . . . . . . . . . 25 6.2 Using the Analog Outputs to Collect Data . . . . . . . . . . . . . . . . . . . . . . . . . . . . . . . 25 7.0 Troubleshooting . . . . . . . . . . . . . . . . . . . . . . . . . . . . . . . . . . . . . . . . . . . . . . . . . . . . . . . 27 8.0 Glossary . . . . . . . . . . . . . . . . . . . . . . . . . . . . . . . . . . . . . . . . . . . . . . . . . . . . . . . . . . 29 9.0 Spare Part Information . . . . . . . . . . . . . . . . . . . . . . . . . . . . . . . . . . . . . . . . . . . . . . . . . . 30 Swagelok CR-288 Concentration Monitor User’s Manual 1.0 Introduction The Swagelok CR-288 concentration monitor provides real-time, temperature-compensated concentration measurement in a compact, ultrahigh-purity package. The monitor uses an optical system to accurately measure liquid chemical concentrations in real time. The digital display unit and 288-connect® software combine convenient, scalable data interface and acquisition options via a graphical user interface and liquid crystal display (LCD). WARNING Touching live electrical parts can cause fatal shocks and severe burns. Incorrectly installed or improperly grounded equipment is a hazard. ● ● The monitor includes the following components: ● ● Optical liquid concentration sensor ● Digital display unit (DDU) ● Sensor-to-DDU cable ● 288-connect software 3 ● ● Sensor Do not touch live electrical parts. No user serviceable parts are in the CR-288. Refer servicing to your authorized Swagelok representative. Keep all panels and covers securely in place. Properly ground the DDU before use. Plug the power supply unto a properly wired receptacle. Follow local electrical codes and the guidelines in the manual when installing the CR-288. Failure to do so may create an electrical shock hazard. Shock hazards can exist even when equipment is properly installed. The operator should be properly trained and follow established safety practices. Cable 288-connect Software DDU Fig. 1 Monitor Components 4 Swagelok CR-288 Concentration Monitor User’s Manual Basic Principles of Operation Index of Refraction Common chemical solutions have a linear relationship similar to the one shown in Fig. 2, with refractive index increasing when concentration increases. The concentration monitor incorporates actual refractive measurement from the process stream to obtain a true concentration value. 1.43 1.42 Index of Refraction The sensor is an optical device that continuously emits a monochromatic light into the process stream and collects the reflected light on a photodiode array, where the location of the light is associated with a specific index of refraction value. It also measures the internal sensor temperature and the fluid temperature. The DDU is designed to survey the response of up to four sensors at one time. Index of refraction and temperature signals from the sensors are captured in a digital signal processor and translated into information displayed on the LED screen. 1.41 1.40 1.39 1.38 1.37 1.36 1.35 1.34 1.33 1.32 0 5 10 20 25 30 35 40 45 Concentration, % Fig. 2 Index of Refraction Temperature 1.384 1.383 Index of Refraction As a chemical solution's temperature increases, refractive index tends to decrease in a non-linear relationship. At a specific temperature this value is known as the Index of Refraction (IoR). The monitor tracks this relationship to obtain the IoR@20, which is the temperature compensated concentration analysis. The refractive measurements are standardized at 20˚C to allow baseline characterization of the relationship between changing temperatures and the IoR. The monitor’s software determines the IoR@20 when the monitor has been exposed to system fluid and conditions as described in this manual. 15 1.382 1.381 1.380 1.379 1.378 1.377 1.376 1.375 1.374 20 25 30 35 Temperature, ˚C Fig. 3 Temperature 40 45 Swagelok CR-288 Concentration Monitor User’s Manual 2.0 Monitor Overview 2.1 Sensor The sensor is designed to be mounted inline with liquid chemical delivery tubing. Each sensor has onboard thermistors to measure fluid and sensor temperatures, onboard memory (2kb) to store basic information, and is laser-etched with a unique serial number for identification. Internally, only sapphire and modified PTFE come into contact with the system fluid. Fig. 4 Sensor 2.2 Digital Display Unit (DDU) The system uses a Digital Display Unit for displaying concentration and temperature readings. The DDU supports up to four sensors and displays concentration and temperature for each sensor simultaneously. There are eight 4 to 20 mA analog outputs, one for each sensor’s concentration and temperature measurements, and two digital outputs located across the top of the DDU. Top The serial inputs for sensors 1 through 4 are mounted on the bottom of the unit. When the sensors are plugged into the DDU, information from each sensor is displayed on the LCD screen. Bottom Fig. 5 DDU Sensor 1 Input Sensor 2 Input Sensor 3 Input Sensor 4 Input Fig. 6 Digital Display Unit Sensor Ports 5 6 Swagelok CR-288 Concentration Monitor User’s Manual 2.3 Cable A 10 ft (3 m) cable is supplied with the concentration monitor. The serial end (HD 15) connects to the DDU and the IP67 end connects to the sensor. Cable extensions are not recommended. 2.4 Software Fig. 7 Cable 288-connect® software is provided on the enclosed CD-ROM. This Windows® based software enables sensor calibration, monitoring, and data logging capabilities. 2.5 Power Supply Specifications: Input — 100 to 240 V (ac), 50 / 60 Hz, 32 W Output — 24 V (dc) 5 %, 1 A 2.6 Serial to USB Adapter Fig. 8 Software The included adapter hardware and software permit the user to connect the DDU to a USB port if needed. Fig. 9 Power Supply Swagelok CR-288 Concentration Monitor User’s Manual 7 3.0 Basic Installation 3.1 Sensor Install the sensor into a fluid system. The sensor is not sensitive to flow direction. The sensor is sensitive to ambient light conditions, changes in the light conditions will effect the concentration readings. During operation, the fluid system must be pressurized so that fluid comes in contact with the sapphire optical window at all times. If bubbles or air is in contact with the optical window the DDU will read "sensor in air." 3.2 Digital Display Unit The DDU may be mounted to a vertical surface using the mounting tabs on the sides of the unit. The terminal block should be oriented on the top, with the sensor ports face down. This ensures that the text on the LCD screen is oriented properly. The DDU may also rest horizontally. Fig. 10 Sensor with Fine Thread Flare Fittings WARNING The DDU is not designed to be exposed to chemicals and should be installed in a safe environment such as an electrical cabinet. Any exposure to water or other chemicals may result in electrical shorts, corrosion, or other damage. To supply power, a 24 V (dc) supply with at least 1 A maximum current capacity is required. A 24 V (dc) power supply is included with the monitor. A user-supplied power source must comply with necessary electromagnetic compatibility requirements. Terminal Block The DDU will use approximately 0.5 A at 24 V (dc) when 4 sensors are connected. Note: It is recommended that any electrical component be grounded. Use a 14 gauge wire attached to one of the mounting screws to ground the DDU. Powering the DDU Using Supplied Source Mounting Tabs Mounting Tabs 1. Snap the terminal block onto the DDU. 2. Plug the power supply into an AC outlet. Sensor Ports Fig. 11 DDU Front 8 Swagelok CR-288 Concentration Monitor User’s Manual Powering the DDU Using an Alternate 24 V (dc) Power Source 1. Remove the terminal block from the DDU. 2. Remove existing wires from the power supply. 3. Place the 24 V positive (+) lead in the left most screw terminal and screw it down tightly. 4. Place the ground (–) lead in the second terminal from the left and screw it down tightly. 5. Replace the terminal block on the DDU. The LCD display on the DDU shows the following items for each sensor from left to right: ● ● ● Two-digit ID based on the last two digits of serial number etched on the sensor Concentration (%) with up to three decimal place resolution Temperature with a two decimal place resolution in degrees Celsius (˚C) 24 V (+) Ground Fig. 12 Terminal Block Removed from the DDU Assessing Status of the DDU The DDU unit has three LEDs to the right-hand side of the LCD screen. The top LED is the Power LED. It will illuminate green whenever the device is properly powered. The middle LED is the Communications LED. It will illuminate green whenever a successful serial connection is established with the 288-connect computer software. The bottom LED is the Error LED. It will illuminate red when the board is getting an error signal from a sensor. Sensor Serial Sensor Serial Number Concentration Temperature Number Power LED Communications LED Concentration Port # 1 2 3 4 Power LED Communications LED Error LED Error LED Temperature One Sensor in Use Four Sensors in Use Fig. 13 CR-288 DDU LCD Display Swagelok CR-288 Concentration Monitor User’s Manual 3.3 9 Cable 1. Align the arrows and connect the IP67 end of the cable to the top of the sensor. 2. Connect the HD 15 end of the cable to one of the four sensor input ports on the bottom of the DDU. IP67 End 3. Use a screwdriver to secure the HD 15 end to the DDU. HD 15 End Fig. 14 Sensor Cable 3.4 Software 1. Run the Setup_288-connect_V366.exe installation program found on the 288-connect CD provided in the shipping box. An icon for 288-connect will appear on your desktop and a default data storage location will be created on your computer's hard drive. The default location is C:\CR288Data but can be changed to any desired hard drive location. 2. Connect the serial cable to the DDU and your computer. If your computer lacks a serial port, use the supplied USB serial port converter. Note: A driver for the converter must be installed prior to use. Run the installation program found on the USB converter CD provided with the converter kit. It is important to use the supplied converter as not all USB serial port converters support the full range of functionality needed by the monitor. Fig. 15 Software Installer Dialog Box 10 Swagelok CR-288 Concentration Monitor User’s Manual 4.0 288-connect Software 4.1 Basic Functions 4.1.1 Opening the Program 1. Launch the program by double clicking on the 288-connect icon on your desktop. 2. Click on the "Auto Open" box that appears on the left side of the data display screen. The message box should respond with “Opened, Talking.” The LCD data replication will update, showing all current sensor information, providing a duplicate of the display from the DDU. 4.1.2 Editing and Saving Sensor Information Saving Factory-Loaded Sensor Information This function provides a way to back-up and restore the onboard sensor information. Back-up should be done for each sensor connected to the DDU and provides a way to reset the sensor to the factory loaded information. Note: Do not use a file saved for one sensor to restore another sensor. Fig. 16 LCD Data Display Screen Note: Each open session of 288-connect software will support one DDU, which supports 4 sensors. To support more sensors, a second session of 288-connect must be opened. 1. Identify the sensor’s port number by inspecting the cable connection or by matching the serial number. 2. Click the Sensor Calibration tab and select the desired sensor from the dropdown box. 3. Click Load Memory to bring all sensor information from the sensor memory into the program to be viewed onscreen. 4. To save the factory loaded information to an external file the first time the sensor is loaded, click Save Complete Sensor Info to File and store the resulting file (approx. 2k, with a *.cr288 extension automatically added) in a secure location on the computer hard drive. 5. Stored information can be restored from the hard drive by clicking on Load Complete Sensor Info from File and selecting the desired file. Fig. 17 Load and Save Swagelok CR-288 Concentration Monitor User’s Manual 11 Editing Sensor Memory 6. Click the Sensor Info tab. ● ● ● ● ● 7. Sensor Number This is the number laser etched on the sensor. This value cannot be edited. Comments This may be edited to any 20 character string. Fluid Temp Compensation Coefficient (RIU/degC) This is the primary method of changing the thermal compensation behavior of the sensor. Typical values range from –0.00004 to –0.00030. It is recommended to edit this for each system fluid used. See Find Temperature Compensation Coefficient. AO Range The 4 to 20 mA analog outputs allow adjustment of the concentration and temperature ranges of the analog outputs. See Using Analog Outputs to Collect Data. Rolling Averages This can be used to increase the amount of averaging that the DDU processor performs on the collected data. See Rolling Averages. To edit a field, point and click on the field. Enter the new information in the pop-up box that appears. 8. To update the sensor memory to apply the changes, click Save Memory. 9. To back-up the updated information to an external file on the computer hard drive, repeat step 4 using a different file name. Fig. 18 Edit Sensor Info Window Note: Once the sensor info has been edited, a red text box will appear in the lower left corner of the displayed screen indicating a change. 12 Swagelok CR-288 Concentration Monitor User’s Manual 4.1.3 Chemical Calibration of Sensor Chemical calibration tells the sensor the characteristics of the chemical to be monitored. The relationship between concentration and index of refraction is linear for most chemicals at a constant temperature and so can be defined with only two points. However, some chemicals do have a non-linear relationship making it necessary to enter additional data points. 288-connect accepts up to ten data points to compensate for non-linear relationships, allowing for polynomial fits. From the main screen: 1. Click the Sensor Calibration tab. 2. Click Load Memory. 3. Click the Chemical Calibration tab. Follow Constructing a Chemical Concentration Table to enter the process chemical data. Once the process chemical has been established in sensor memory, the sensor and software are functional. Constructing a Chemical Concentration Table To add a new chemical, click the Chemical Concentration tab and: Fig. 19 Chemical Calibration Window 1. Change the chemical name and click Delete All Points. This clears all data from the chemical concentration table. 2. If the relationship between IoR and concentration for your chemical is known: Leave the Get IoR@20 from Sensor check box empty. Input the points from your table by entering IoR@20 and Concentration. Click Add Calibration Point after each set of data. Repeat until entire table has been entered. 3. If the relationship between IoR and concentration for your table is unknown: Determine the relationship by running various known concentrations of the new chemical through the sensor and building the table manually. Use these steps: a. Check the Get IoR@20 from Sensor box. b. Flow the first known concentration through the sensor. Note: The calibration should completely span the desired process temperature range. Swagelok CR-288 Concentration Monitor User’s Manual c. Enter the concentration in the Concentration box. d. Allow sufficient time for process stabilization (approx. one minute), then click Add Calibration Point. e. Flow the next fluid concentration until calibration is complete. When the desired number of points have been recorded, save them by clicking Save Current Chemical To File, which will create a file with a *.chem extension on the computer hard drive. This file can then be used to import the chemical calibration table to other sensors. 4. Click Save Memory to update the sensor memory. 4.1.4 Data Graphing The software provides real-time graphical representation of the sensor output. These features can be accessed by clicking on the Data Graph tab. Update Info Find Temp Comp Pause Data Collection Clear All Graphs Fig. 20 Data Graph Screen 13 14 Swagelok CR-288 Concentration Monitor User’s Manual 4.1.4.1 Graph Navigation The tabs on the top and right-hand side can be used to select what sensor data will be viewed. The software stores the last 5000 data points in memory for display on this graphic interface. Since there is one point per 1.3 seconds, this display can show up to 108 minutes of data. 4.1.4.2 Zoom Press and hold the right mouse button while drawing a box around the data to zoom in. Click UnZoom or AutoScale Shown to zoom out. 4.1.4.3 Scale Adjustment The scales may be adjusted by editing the values in the scale labels. When this is done, the Data Graph switches to “User Scale Axis,” meaning it will no longer automatically resize itself. 1. Edit the scale values by clicking in the appropriate box and entering the desired scale. 2. Click Track Time in the lower left of the window to continue to see new data points as they appear. 3. Check the boxes in the second column to superimpose linear or 2nd order polynomial lines on the data. The lines always match the entire data set not just the data shown, i.e. if the graph is zoomed in to show a small part of the data, the imposed line will not necessarily match the shown data since it is fitted to all the data. 4.1.4.4 Shown Data Statistics The following values are calculated from only the data shown in the graph. A particular region can be viewed to learn its properties. Standard deviation (Std.Dev.) - gives the square root of the variance in data. Slope - indicates if the data is trending upward (positive) or downward (negative). Average - the average of the measured values. The average can be copied to the clipboard. Select or zoom to the desired data, right click in the average box, copy, switch to database and paste. This feature is useful if you are collecting data live and entering it into a database program. Fig 21 Shown Data Statistics Swagelok CR-288 Concentration Monitor User’s Manual 4.1.4.5 Update Info The Update Info button updates the sensor serial number and comment information that appears immediately beneath the Update Info button. Update Info can be used if a sensor comment has been edited after data collection has started and it is necessary to show the change on the Data Graph screen. 4.1.4.6 Pause Data Collection Checking this box will stop the data graph from gathering further data from the sensor. While the box is checked, the sensor will continue to gather data and output to the analog outputs, digital outputs and DDU, but the software will stop gathering data. 4.1.4.7 Clear All Graphs To clear the Data Graph of its collected data, click Clear All Graphs at the bottom center of the Data Graph tab. This removes all of the collected data from all connected sensors from the graphic display only. The Clear All Graphs button does not affect data logging that is in progress, only the graphic buffer. The timestamp of the data log program is preserved, so new displayed data will not begin at time zero but rather continue from the time of the last data point before the clear. Note: Update Info will not change the sensor information in data files started prior to pressing the Update Info button. This information has already been written to the data file and will not be changed retroactively. 15 16 Swagelok CR-288 Concentration Monitor User’s Manual 4.1.4.8 Find Temperature Compensation Coefficient Temperature changes have an effect on index of refraction and therefore on the reported concentration from the sensor. The Find Temperature Compensation Coefficient function automates a method to determine the temperature compensation coefficient. Fig. 22 Temperature Compensation Coefficient Screen Using the Temperature Compensation Coefficient Function 1. Let the sensor run for a period of time representative of typical process temperatures while holding the concentration of the fluid constant. If the temperature is constant for most of the process but changes during a small amount of time, only collect data around that event. The software stores only about 1.5 hours of data in memory. 2. Click Find Temp Comp on the Data Graph tab. 3. A popup box will appear which will supply a temperature compensation coefficient, typically a number such as -0.00008 or -8e-5. 4. Record this value, or right click and copy. Swagelok CR-288 Concentration Monitor User’s Manual 5. Click the Sensor Calibration tab. 6. Select the appropriate port for the sensor in question and click Load Memory. 7. Click on the Fluid Temperature Compensation Coeff field on the Sensor Info tab, type the recorded value or right click and paste, and click OK. 8. Click Save Memory to update the sensor memory. Fig. 23 Entering the Temperature Compensation Coefficient 17 18 Swagelok CR-288 Concentration Monitor User’s Manual 4.1.5 Data Logging This function allows the user to store data in a separate file from 288-connect on the computer hard drive that can then be manipulated. The main data acquisition method can be accessed by using the Data Logging tab. 1. Click on the Data Logging tab to display the Data Logging setup information. 2. Put the file location and name into the Where box. An extension of *.csv will be added to the file name automatically. Note: Do not use the same file location for multiple sessions of 288-connect that are open concurrently. 3. In the What box, select the ports from which you wish to log data and the data types. Basic Data will log only Fluid Temperature and Concentration. Note: It is not necessary to include the date in the file name as a date string will be part of the file name automatically. All Data will log all six data types: Concentration, IoR@20, fluid temperature, sensor temperature, Pixel Position (raw algorithm output), and index of refraction (IoR). 4. Click Start Now to begin logging. As the program logs, it will maintain a count of the number of logged points on the left-hand side of the screen; this confirms that the data is being logged. Note: When any database program opens a data file, it makes the file read-only to all other programs. The data log automatically rolls over to a new file with a different timestamp and the same name originally specified every 10 000 data points. This prevents a data file from becoming too large, and makes manipulation of the data in a spreadsheet easier. Before opening a data file in a database program, click Stop Logging. Enter a new file name in the Where box and click Start Now. Data logging will continue in the new file. Open the original file in the database program. Fig. 24 Data Logging Screen Swagelok CR-288 Concentration Monitor User’s Manual 4.2 Advanced Functions 4.2.1 Using the Digital Outputs The DDU provides two 5 V (dc) digital output channels, on pins 19 and 20 of the terminal block. These channels can be used to activate alarms on an external device if the concentration drops below a specified constant. There will be no software indication of an alarm. The digital outputs can be set for each sensor, and each sensor can control both channels. Note: If two sensors have an alarm set for the same output channel, both alarms are active on that channel. For example: ● ● The sensor on Port 1 has been set to activate the alarm on pin 19 when the concentration percentage drops below 5 %. The sensor on Port 2 has been set to activate the alarm on pin 19 when the concentration percentage goes above 10 %. If the alarm on pin 19 is activated, it is known that either the sensor on Port 1 is below 5 % or the sensor on Port 2 is above 10 %, but not which, since the sensor on Port 1 and the sensor on Port 2 share pin 19. Fig. 25 Digital Output Setting Selection 19 20 Swagelok CR-288 Concentration Monitor User’s Manual The software can be used to set alarms for both pins 19 and 20 for each sensor. Setting Alarms 1. Click on the Sensor Calibration tab. 2. Select the correct port number for the desired sensor and click Load Memory. 3. Click the Digital Alarms tab. 4. Alarms can be set for the following items: ● ● ● Alarm outside concentration range: This setting will activate an alarm if the reported concentration goes outside of the range specified in the Lowest Concentration and Highest Concentration fields. Alarm on sensor problem: This setting will activate an alarm if the sensor has a problem. A common cause of this is the sensor being exposed to air. This error will also cause the DDU processor (DSP) to display “Sensor In Air?” on the LCD screen. Number cycles to delay alarm: This delays the alarm for the number of consecutive cycles entered. It can be useful in compensating for expected process transients. Note: A cycle = 1.3 seconds and corresponds to the frequency a data point is logged. 5. Click Save Memory to update the sensor memory. Fig. 26 Digital Output Setting Selection Swagelok CR-288 Concentration Monitor User’s Manual 21 4.2.2 Chemical Concentration Offset Chemical concentration offset is a function used to offset the concentration reading from the calculated concentration. It can be used to compensate for variances due to chemical process changes or chemical lot-to-lot or supplier variations. When this function is used, the software will follow a linear relationship between index of refraction (IoR@20) and concentration for the chemical being monitored based on the entered offset. If the relationship entered in chemical calibration is not linear and still needs to be used, follow the Re-Zero procedure instead. Note: The chemical calibration table entered and saved to sensor memory is not overwritten in memory by this function. Using Chemical Concentration Offset 1. Click on the Sensor Calibration tab. 2. Select the port number for the desired sensor and click Load Memory. 3. Click on the Chemical Calibration tab. 4. Enter the actual concentration of the chemical in the present fluid stream in the Titrated Concentration Now box to the left. 5. Click Update. A new value will appear in the box on the right. This value represents the amount that will be subtracted from the concentration before displaying it or outputting it to the analog outputs or software. 6. Click Save Memory to update the sensor memory and make the chemical concentration offset permanent. 7. Observe the Data Graph to verify that the concentration is now the same as the value entered. Fig. 27 Titration Adjust Screen 22 Swagelok CR-288 Concentration Monitor User’s Manual 4.2.3 Rolling Averages Rolling averages are used to increase the amount of averaging that the DSP performs on the data. This increases the response time of the DDU. Rolling averages can be applied to the following data to be observed on the DataGraph tab: ● Concentration ● Temperature ● IoR@20 ● PixelPos Rolling averages cannot be applied to the IoR. Using Rolling Averages 1. Click on the Sensor Calibration tab. 2. Select the correct port number for the desired sensor and click Load Memory. (The program will automatically show the Edit Info tab.) Note: Under stable conditions, the IoR can be compared to the IoR@20 to observe the delay added to the other signals by the averaging, as well as the resulting smoothing effect of the averaging. 4. Click on the Rolling Averages field. 5. Enter a number 0<=n<=100. This number specifies the number of points to maintain in the rolling average. A point requires approximately 1.3 seconds, therefore 46 points add approximately one minute to the response time. 6. Click Save Memory to update the sensor memory and make the change permanent. Fig. 28 Rolling Averages Swagelok CR-288 Concentration Monitor User’s Manual 23 5.0 Maintenance 5.1 Re-Zero The Re-Zero function is used to compensate for differences between sensors and operating environments (ambient temperatures, ambient light, etc.) and to compensate for slow drift in the signal experienced over time. Re-Zero should be done on a sensor every six months at a minimum to correct for any drift or when changing sensors. 1. Click on the Sensor Calibration tab. 2. Select the correct port number for the desired sensor and click Load Memory. 3. Ensure that the sensor is exposed to DIW (deionized water) at a stable temperature ( 2˚C). 4. Click on the Data Graph tab, then the IoR@20 tab, to ensure that the slope of the IoR@20 value remains 2e-5 or lower over a two minute period of time. If the slope is greater than 2e-5, check for any temperature or concentration variations in the system. Stabilize any variations. Note: Follow the Chemical Concentration Offset procedure if it is not possible to run DIW through the sensor. 5. Click on the Factory Calibration tab. 6. Click ZeroNow. A new number will appear in the box. 7. Click Save Memory. 8. Return to the Data Graph tab. The IoR@20 should now be 1.33300 +/- 0.00001. Note: If the Chemical Concentration Offset function has been used prior to using the Re-Zero function, the chemical concenration offset value should be reset to zero. Fig. 29 Re-Zero Screen 24 5.2 Swagelok CR-288 Concentration Monitor User’s Manual Window Cleaning Some fluids may develop a film that adheres to the sensor’s optical window over time. This may cause poor sensor performance. The sensor may be disassembled for optical window cleaning if the Re-Zero procedure does not correct the issue. WARNING Before servicing any installed sensor you must: ● depressurize the system ● flush system. Residual material may be left in the sensor and the system. Hole plugs Socket head cap screws Washers Sensor 1. Disconnect the sensor cable and remove the sensor from the system. Gasket 2. Remove the hole plugs, socket head cap screws, and washers. Separate the sensor from the body. Body 3. Carefully clean the optical window with an appropriate solvent and clean cloth. 4. Place the mounting plate against the bottom of the body. Install the gasket back into the top of the body. Mounting plate Fig. 30 Disassembled Sensor 4. Assemble the sensor to the body and insert the washers and socket head cap screws. 5. Torque the socket head cap screws to 20 to 25 in.∙ozf (0.14 to 0.17 N∙m) using a cross pattern. 6. Torque the cap screws a second time, to 45 to 48 in.∙ozf (0.31 to 0.34 N∙m), using a cross pattern. 7. Insert the hole plugs. 8. Reinstall the sensor into the system and reconnect the sensor cable. Optical window 9. Pressurize the system and inspect for leaks. 10. Follow the Re-Zero procedure. Fig. 31 Underview of Sensor Swagelok CR-288 Concentration Monitor User’s Manual 6.0 Monitor Operation: Stand-Alone DDU Remote Monitoring of Chemical Concentration The DDU features analog output channels that may be used to remotely monitor chemical concentration without a computer workstation. The analog output signals can be acquired by a local data acquisition system. 6.1 Note: Initial setup and calibration of the sensor requires the installation and use of the system software. Initial Set-Up 1. Install 288-connect on a computer workstation. Refer to Software Installation. 2. Connect the serial port located on the top of the DDU to the workstation using a serial cable of sufficient length. 3. Enter the Lowest and Highest Concentration and the Lowest and Highest Temperature values. Refer to Editing a Sensor. 4. Click Save Memory to update the sensor memory and make the change permanent. 5. Close the program and remove the DDU connection to the computer workstation. 6.2 Using the Analog Outputs to Collect Data 1. Remove power from the DDU. 1 24 V+ Supply 2 Power GND 3 Source 4 GND 5 Source 6 GND 7 Source 8 GND 9 Source 10 GND 11 Source 12 GND 13 Source 14 GND 15 Source 16 GND 17 Source 18 GND Digital Alarm 1 19 NC Digital Alarm 2 20 NC Sensor 1 Concentration 2. Remove the terminal block from the DDU. Sensor 1 Temperature 3. Connect wire leads to appropriate terminals. Sensor 2 Concentration Sensor 2 Temperature Sensor 3 Concentration Sensor 3 Temperature 56 12 9 10 13 14 17 18 Sensor 4 Concentration Sensor 4 Temperature 34 78 11 12 15 16 19 20 Fig. 32 DDU Terminal Block and Pin Assignments 25 26 Swagelok CR-288 Concentration Monitor User’s Manual 4. Plug the terminal block back into the DDU. 5. Instruct the local data acquisition system to acquire 4 mA to 20 mA current signals, once properly wired. Table 1 describes the output signals. 6. Use the following equation in order to translate current signals into concentration and temperature. Concentration(%) = (mA – 4) / 16 * (C20ma – C4ma) + C4ma Temperature(˚C) = (mA – 4) / 16 * (T20ma – T4ma) + T4ma where: C4ma = AO Range: Lowest Concentration (%) = 4 mA C20ma = AO Range: Highest Concentration (%) = 20 mA T4ma = AO Range: Lowest Temperature (degC) = 4 mA T20ma = AO Range: Highest Temperature )degC) = 20 mA Description Factory Default Concentration corresponding to 4 mA –1.00 % Concentration corresponding to 20 mA 30.00 % Temperature corresponding to 4 mA 10 degC (50 degF) Temperature corresponding to 20 mA 65 degC (149 degF) Table 1 Signal Description If the sensor has never been used or changed, the values will be at the factory defaults defined in Table 1. Swagelok CR-288 Concentration Monitor User’s Manual 27 7.0 Troubleshooting Symptom LCD displays “no sensor present” LCD displays “Sensor In Air” when chemical is flowing Excessive Noise (signal drifts more than 0.04 % in stable chemical) Probable Cause Remedy Loose cable / Bad cable / Sensor not connected Detach and reattach both ends. Replace or swap cable. Bubble trapped in flow cell Turn the sensor upside down (so that cable points downward) to release the bubbles. Mounting in this position may prevent future occurrences. Dirt or other optical window fouling has obscured signal Inspect the TIR curve on the Diagnostics tab for a non-linear curve in a 'mountain' pattern. Clean window with a DIW flush and Re-Zero. Cable issue / Sensor malfunction Inspect the TIR curve on the Diagnostics tab. If it’s non-linear or not appearing, swap cables. If there is still a problem, sensor should be replaced. Optical window fouling Clean window with a DIW flush and Re-Zero. LED brightness issues Check RawData tab within the Diagnostics tab for the Brightness (should be ~=1.000) and Light (should be stable value between 50/512 and 200/512). If either value is outside range, clean window with a DIW flush and Re-Zero. Bad calibration Verify chemical calibration is representative of the current chemical. If necessary, recalibrate the sensor per Constructing a Chemical Calibration Table. Large, Rapid Concentration or Index of Refraction Changes Ambient light changes Protect sensors from significant external changes in light. Re-Zero the sensor when clean for any permanent changes in light conditions. Small, Rapid Concentration or Index of Refraction Changes Changing sensor location to different port Follow Re-Zero procedure or maintain original ports location(s). Serial cable disconnected Ensure that the serial cable is properly connected to the computer and to the DDU. Power not connected Unplug the DDU for five seconds, then reconnect power. Software Restart 288-connect. USB to serial converter error Reload converter driver. Restart 288-connect and DDU. Software can’t get “Opened, Talking” status 28 Swagelok CR-288 Concentration Monitor User’s Manual Symptom Probable Cause Remedy Loose cable Ensure proper cable connections. Insufficient administrator rights on computer Restart 288-connect. Use a different serial port on computer or use serial to USB converter. Software error Unplug the DDU for 5 seconds then reconnect. Restart 288-connect. Improper temperature compensation Change the temperature compensation coefficient according to Data Graphing. Variable heating and cooling temperature rates Expose sensor to similar heating and cooling rates. Adjust Temperature Compensation Coefficient as needed. Rapid temperature change Dampen heating and cooling rates above 5˚C / min. Concentrations are incorrect by a small constant offset Sensor needs to be re-zeroed Run DIW through the sensor. Re-Zero sensor according to Re-Zero. Concentrations scale incorrectly (fine at low concentrations but increasingly incorrect at higher ones) Chemical calibration is incorrect Select the correct chemical according to Calibration of the Sensor. For custom chemicals, rebuild the chemical calibration table. Power LED does not come on when device appears properly powered Voltage across the power terminals is not 24 V (dc) Check voltage. Follow Basic Installation Procedure for Powering the DDU. Red LED comes on Error signal from sensor Contact your authorized Swagelok representative. Old sensor information displayed on Data Graph tab Sensor and DDU not synchronized Click Update Info on Data Graph tab. “No E-box found” displayed when click on Auto Open Red error box on screen Concentration reading changes incorrectly when temperature changes For technical support or further assistance, please contact your authorized Swagelok representative. Swagelok CR-288 Concentration Monitor User’s Manual 29 8.0 Glossary 288-connect — Software providing Windows-based user interface. AO, Analog Output — A 4 to 20 mA output signal tuned to the sensor concentration and temperature readings. Concentration (%) — Ratio of fluid component A to component B. Digital Display Unit (DDU) — Control box that receives sensor inputs, processes the information, and displays it on a LCD screen. First Derivative — Algorithm used to calculate pixel position from TIR data. Fluid Temperature Compensation Coefficient (TCC) — Ratio of index of refraction to degrees C. Index of Refraction (IoR) — A measure of the speed of light in a vacuum divided by the speed of light in a system fluid at a specific temperature. Index of Refraction at 20˚C (IoR@20) — A measurement of a system fluid’s index of refraction after it has been temperature compensated to a standard temperature of 20˚C. Line Quality — Measure of the clarity of the optical path in the sensor. Photodiode Array — An optical device used to detect and measure light. Pixel — A subcomponent of a photodiode array. Pixels are arranged in a linear matrix to determine precise location of light. Raw Data — Plot of LED light intensity relative to pixel position. Rolling Average — Continuous averaging algorithm for data smoothing. Total Internal Reflectance (TIR) — A sensor’s reflected light as measured by the photo diode array. Titration — A laboratory technique by which the concentration of an unknown chemical can be determined. Thermistor — A resistive circuit component whose resistance decreases as the temperature increases. 30 Swagelok CR-288 Concentration Monitor User’s Manual 9.0 Spare Part Information Description Sensor cable Digital display unit (DDU) 288-connect software CD Power supply USB converter with driver User’s manual Ordering Number CM-C10 CM-DT-111 CMU-288-S CMU-DT-PS MS-ADPT-USB-RS232 MS-13-210 DDU kit (DDU, CD, power supply, CMU-DT-111-PKG USB, manual) Swagelok CR-288 Concentration Monitor User’s Manual 31 The Swagelok Limited Lifetime Warranty Swagelok and its authorized distributors herby warrant to the purchaser of their Products that the nonelectrical components shall be free from defects in material and workmanship for the life of the Products. All electrical components installed in or on the Product are warranted to be free from defects in material and workmanship for twelve months from the date of purchase. The purchaser's remedies shall be limited to replacement and installation of any parts that fail through a defect in material and workmanship. All customer-specified components carry the applicable manufacturer's warranty. ALL OTHER REPRESENTATIONS, EXPRESS OR IMPLIED, WARRANTY, OR LIABILITY RELATING TO THE CONDITION OR USE OF THE PRODUCT ARE SPECIFICALLY DISAVOWED, AND IN NO EVENT SHALL SWAGELOK AND ITS AUTHORIZED DISTRIBUTORS BE LIABLE TO PURCHASER, OR ANY THIRD PARTY, FOR ANY DIRECT OR INDIRECT CONSEQUENTIAL OR INCIDENTAL DAMAGES. Swagelok — TM Swagelok Company CR-288, 288-connect — TM Jetalon Solutions, Inc. Windows — Microsoft Corp. © 2006 Swagelok Company June 2006, R0 MS-13-210