1
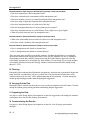
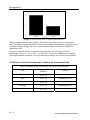
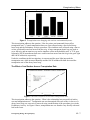
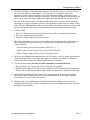
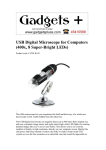
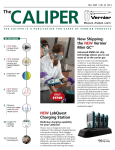
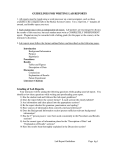
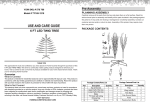
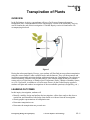
Investigation Transpiration of Plants 13 OVERVIEW In the Preliminary Activity, your students will use a Gas Pressure Sensor to determine transpiration rate. A student handout for the Open Inquiry version of the Preliminary Activity can be found at the end of this investigation. A Guided Inquiry version is found on the CD accompanying this book. Figure 1 During the subsequent Inquiry Process, your students will first find out more about transpiration using the course textbook, other available books, and the Internet. They will then generate and investigate researchable questions dealing with transpiration rate. Depending on your objectives, sensor availability, and their own personal interest, your students might decide to use another sensor such as a Light Sensor, a Stainless Steel Temperature Probe, a Relative Humidity Sensor, or a CO2 Gas Sensor, in addition to a Gas Pressure Sensor. (In the Guided Inquiry approach, students will plan and conduct investigations of the researchable question(s) assigned by you.) LEARNING OUTCOMES In this inquiry investigation, students will Identify variables, design and perform the investigation, collect data, analyze data, draw a conclusion, and formulate a knowledge claim based on evidence from the investigation. Obtain graphic representations of transpiration rate. Determine transpiration rate. Determine the transpiration rate per unit area. Investigating Biology through Inquiry © Vernier Software & Technology 13 - 1 Investigation 13 THE INQUIRY PROCESS Suggested Time to Complete the Investigation See page xiii in the Doing Inquiry Investigations section for more information on carrying out each phase of an inquiry experiment. Inquiry Phase Open Inquiry Guided Inquiry I Preliminary Activity 40 minutes 40 minutes II Generating Researchable Questions (Omitted in Guided Inquiry Approach) 10 minutes 0 minutes III Planning 10 minutes 10 minutes IV Carrying Out the Plan 40 minutes 40 minutes V Organizing the Data 15 minutes 15 minutes VI Communicating the Results 10 minutes 10 minutes VII Conclusion 5 minutes 5 minutes MATERIALS Make the following materials available for student use. Items in bold are needed for the Preliminary Activity. data-collection interface data-collection program Vernier Gas Pressure Sensor utility clamps ring stand plant cuttings thick-wall plastic tubing 2-way valve plastic tubing clamps fine-tip permanent marker razor blade or scalpel metric ruler plastic syringe ProScope or balance others as requested by students I Preliminary Activity This inquiry begins with an activity to reinforce prior knowledge of the use of Vernier datacollection technology and to introduce a method for collecting transpiration data. 13 - 2 Investigating Biology through Inquiry Transpiration of Plants Sample Results Figure 2 Pressure decreases as transpiration occurs Answers to the Questions 1. Identify the plant type you used in the Preliminary Activity. Answers will vary. These sample data were collected using a Rhododendron twig. 2. Calculate the transpiration rate/surface area. To do this, divide the transpiration rate by the surface area of your plant. This rate can be expressed as kPa/s/cm2. Answers will vary. 0.0231 kPa/s ÷ 224 cm2 = 1.03 10-4 kPa/s/cm2 3. List three factors that might affect transpiration rate. Answers will vary. Some factors that affect transpiration rate are temperature, light intensity, air currents, humidity, surface area, CO2 concentration, stage of plant development, stomatal size, stomatal density, leaf thickness, and the nature of the leaf’s surface. 4. List at least one researchable question concerning transpiration rate. Answers will vary. See the Researchable Questions list below for some possible answers. II Generating Researchable Questions Note: Researchable questions are assigned by the instructor in the Guided Inquiry approach. See page xiii in the Doing Inquiry Investigations section for a list of suggestions for generating researchable questions. Some possible researchable questions for this investigation are listed below: Recommended for Open Inquiry or Guided Inquiry (sample results provided) What effect does darkness have on transpiration rate? How do various environmental factors affect transpiration rate? How does light intensity affect transpiration rate? How do air currents affect transpiration rate? How does relative humidity affect transpiration rate? Investigating Biology through Inquiry 13 - 3 Investigation 13 Recommended for Open Inquiry or Guided Inquiry (sample results not provided) How does temperature affect transpiration rate? How does carbon dioxide concentration affect transpiration rate? How does number of leaves on a multi-leafed plant affect transpiration rate? How does stage of plant development affect transpiration rate? How does transpiration rate vary with time of the day? How do the transpiration rates of various plant species compare? How does transpiration rate vary with distance from a light source (grow light)? What effect does saltwater have on transpiration rate? Recommended for Advanced Students (sample results provided) What is the relationship between total leaf surface area and transpiration rate? How does relative humidity affect transpiration rate? Recommended for Advanced Students (sample results not provided) How is transpiration rate related to stomatal size? How is transpiration rate related to stomatal density? There are many more possible researchable questions. Students should choose a researchable question that addresses the learning outcomes of your specific standards. Be sure to emphasize experimental control and variables. (Instructors using the Guided Inquiry approach select the researchable questions to be investigated by their students. We encourage you to assign multiple researchable questions because this strategy enhances student interaction and learning during phases IV–VII.) III Planning During this phase students should formulate a hypothesis, determine the experimental design and setup, and write a method they will use to collect data. The plan should list laboratory safety concerns and specify how they will be addressed during the investigation. Circulate among the student groups asking questions and making helpful suggestions. IV Carrying Out the Plan During this phase, students use their plan to carry out the investigation and collect data. Circulate among the student groups asking questions and making helpful suggestions. V Organizing the Data See page xv in the Doing Inquiry Investigations section for suggestions concerning how students can organize their data for their inquiry presentations. VI Communicating the Results See page xv in the Doing Inquiry Investigations section for a list of inquiry-presentation strategies. 13 - 4 Investigating Biology through Inquiry Transpiration of Plants VII Conclusion Using your notes recorded during the Communicating the Results phase, summarize the group results for the experiment and tell how they will fit into the upcoming instruction. VIII Assessment See page xv in the Doing Inquiry Investigations section for ideas on assessment strategies. SAMPLE RESULTS Student results will vary depending on experimental design. The Effect of Darkness on Transpiration Rate Figure 3 Transpiration in sunshine and darkness Table 1: Transpiration Rates in Sunshine and in Darkness Condition Mean Illumination (lux) Slope (kPa/s) Transpiration Rate (kPa/s/cm2) Sunshine 3550 -0.0389 9.78 10-5 Darkness 2 -0.0170 4.26 10-5 Investigating Biology through Inquiry 13 - 5 Investigation 13 Figure 4 Transpiration rates in sunshine and darkness This investigation addresses the question, “What effect does darkness have on transpiration rate?” In-sunlight transpiration data were first collected using a rhododendron twig situated near a window in bright sunlight. The room was then darkened for the collection of in-darkness transpiration data. Under the conditions in this investigation, the transpiration rate of the twig decreased significantly, from 9.78 10-5 to 4.26 10-5 kPa/s/cm2, when room conditions were changed from bright sunshine to darkness. The twig continued to transpire at a reduced rate in darkness. The Effects of Various Environmental Conditions on Transpiration Rate Table 2: Transpiration Rates as Affected by Various Environmental Factors 13 - 6 Test Transpiration Rate (kPa/s/cm2) Change Control 4.68 10-5 — Wind 6.68 10-5 Increased by 42.7% Humidity 2.64 10-5 Decrease by 43.6% Grow light 5.52 10-5 Increased by 17.9% 100 W bulb 4.16 10-5 Decrease by 11.1% Investigating Biology through Inquiry Transpiration of Plants Figure 5 Transpiration rate changing with various environmental factors This investigation addresses the question, “How do various environmental factors affect transpiration rate?” Control transpiration data were first collected using a four-leafed cherry laurel twig and the Preliminary Activity procedure. The wind data were collected using a fan set on low speed and located one meter from the twig. A large transparent plastic bag was used to cover the twig, and an atomizer was used to introduce a mist in the humidity trial. A 75 W grow light and a 100 W incandescent bulb were each located one meter from the twig in the grow light and 100 W bulb trials, respectively. Under the conditions in this investigation, air currents and the grow light increased the transpiration rate, while increased humidity and the 100 W incandescent bulb decreased the transpiration rate of the cherry laurel twig. The Effect of Leaf Surface Area on Transpiration Rate Figure 6 Increased surface area increases transpiration rate This investigation addresses the question, “What is the relationship between total leaf surface area and transpiration rate?” Transpiration rate was determined after each of the six leaves of a cherry laurel twig was successively removed using a modification of the procedure given in the Preliminary Activity. As Figure 6 shows, transpiration rate was found to vary directly with total leaf surface area. Investigating Biology through Inquiry 13 - 7 Investigation 13 The Effect of Relative Humidity on Transpiration Rate Figure 7 Increased humidity decreases transpiration rate This investigation addresses the question, “How does humidity affect transpiration rate?” A multi-leafed rhododendron twig was enclosed in a large transparent plastic bag supported by the ring stand and utility clamps of the Figure 1 setup. Squirts of mist from an atomizer were used to increase the internal relative humidity prior to each successive run As Figure 7 shows, transpiration rate decreased as relative humidity increased. Numerous factors influence the complex relationship between transpiration rate and relative humidity. However, under the conditions of this investigation, a temperature of 24°C and a light intensity of 1200 lux, the transpiration rate vs. relative humidity graph apparently results in a good natural exponent curve fit. TIPS 1. You can use the plastic tubing that ships with the Gas Pressure Sensor for this investigation, but you will need to remove the Luer-lock connector (white connector) from one end by pulling it out or cutting off the end. 2. For good results, plant acclimation periods of uniform length are necessary. The procedure, as it is written, uses the data collection program to time the 300 second acclimation period. Alternatively, you could have your students time the acclimation period with another instrument and begin data collection when 300 seconds have passed. 3. You should leave water out overnight in a beaker or cup to allow any excess dissolved air to escape. This will ensure that no air bubbles form in the tube at the cut end of the stem. If air bubbles form, it may be necessary to restart your investigation. If bubbles do form, remove the plant and tubing from the two utility clamps and allow the plant to hang towards the ground with the other end of the tubing pointing up. Carefully tap on the sides of the tubing to loosen any bubbles—they will float to the water’s surface at the other end. Once all bubbles are removed, check the plant’s seal at the tube. Secure your plant in the tubing and restart the data collection. 13 - 8 Investigating Biology through Inquiry Transpiration of Plants 4. The thick-wall plastic tubing that comes with the Gas Pressure Sensor is well suited for this lab. The inner diameter of the tubing is 3 mm and may be too small for some plant specimens. Science supply companies carry thick-wall plastic tubing, with a larger inner diameter, that will work well on larger plant stems. They also sell tubing connectors that will allow you to connect the larger tubing to the tubing provided with the Gas Pressure Sensor. 5. Because of the need to remove and reinsert plant stems prior to successive runs during this investigation, woody stem plants work best. Some plants that can be used are: azalea, Cherry laurel, Photinia, Rhododendron, and Vaccinium. Older stems that are brown in color tear and peel less than green stems as they are inserted into and removed from the plastic tubing. 6. For best results: A new 45° angle stem cut must be made prior to each run of a multiple run procedure. The stem cut angle must be consistent. All plastic tubing connections must be air tight. 7. The Vernier Barometer can also be used to perform this investigation. If you already have a Barometer and wish to do this activity, you will need to order the following parts from Vernier Software: Pressure Sensor Accessories Kit (order code PS-ACC) Plastic 2-Way Pressure Sensor Valve (order code PS-2WAY) Plastic Tubing Clamps (order code PTC: package of 100) 8. There are two methods for determining leaf area. If you have a ruler, a digital camera such as a ProScope HR with the 1–10X lens, and Logger Pro software, use Method 1. Otherwise, follow the Method 2 directions, which requires the use of a balance. 9. Tips for the determining the effect of relative humidity on transpiration rate: The top half of a dry cleaners bag works well in this investigation. Results can be enhanced with the use of a Light Sensor and a Stainless Steel Temperature Probe to aid in maintaining constant light intensity and temperature during data collection. 10. More information about the sensor used in this Investigation, as well as tips for optimal performance, can be found in the sensor's user manual available for download from the Vernier web site, www.vernier.com/sensors. 11. The plans that your students submit for approval should list laboratory safety concerns, including chemical safety concerns, and specify how they will address these safety concerns during their investigations. Investigating Biology through Inquiry 13 - 9