1
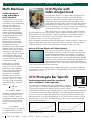
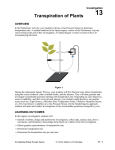
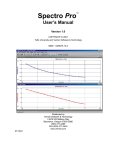
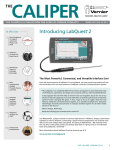
Fall 2009 | Vol 26 NO.2
Caliper
The
the caliper is a publication for users of vernier products
Now Shipping:
the New Vernier
Mini GC IN THIS ISSUE
2
New Video
Analysis Book
for Physics
3
New Activities
Using Vernier
sensors and
MINDSTORMS®
NXT®
5
Enzymes in the
Laboratory
6
New Vernier
Mini GC and
Free Labs
TM
Advanced MEMS GC chip
technology allows you to use
room air as the carrier gas
only
$1749
9
10
11
Measure
electricity usage
with the New
Watts Up Pro
Logger Pro
Updates
and Tips
Professional
Development
The new Vernier Gas Chromatograph,
or Mini GC, is an instrument for
separating, analyzing, and identifying
substances contained in a volatile
liquid or gaseous sample. It has all of
the key components of a traditional gas
chromatograph, including an injection
port, temperature and pressure controls,
a thin capillary column (Restek MXT®-1
stainless steel capillary) through which
different substances pass at different
rates depending on various chemical
and physical properties, and a sensor
for detecting the arrival of compounds.
It also has the added benefit of a new
patented MEMS chip sensor that allows
for room air to be used as a carrier gas.
Its compact size makes it an ideal
solution for students to learn the
principles of gas chromatography.
continued on page 6
New LabQuest
Charging Station
Multi-bay charging capability
for your LabQuest
Want a way to charge and store your
LabQuests? The LabQuest Charging Station
is the perfect solution. Each charging
station has four charging slots. LEDs on
the charging station indicate the charging
status. The compact design uses desk space
efficiently. Because the charger holds four
LabQuests, it is easy and affordable to
accommodate small and large lab setups.
99 L Q - C R G
$
order code
VERNIER SOFTWARE & TECHNOLOGY • PHYSICS
Math Machines
A different way of
using technology in
math education
Math Machines is a non-profit
organization that promotes the
use of technology in mathematics
teaching. The originators of
the project are Fred Thomas
(physics) and Robert Chaney
(math), faculty members at
Sinclair Community College in
Dayton, Ohio. “Math Machines”
are simple devices that convert
standard mathematical
expressions into immediate,
physical actions. Originating
in 1998 with grants from NSF’s
Advanced Technological
Education program, the first Math
Machines used TI-83/84 family
calculators with LabPro or CBL 2
interfaces to control vehicles,
colored lights, pointers, and other
physical devices. The project is
now focusing its development
work on computer controls using
Vernier’s SensorDAQ.
Perhaps the most versatile
Math Machine is basically a
hobby servo motor that can be
purchased for $10 to $20 from
many hobby stores. Using free
software and free building
instructions from the Math
Machines web site, the servo
motor can aim a laser pointer, a
webcam, a mirror, or wooden
rod, and provide an immediate,
dynamic response to equations
such as
0 = -60 – 4*t
or
x = -2 + 0.6*t – 0.04*t2
In addition to time, the functions
can use real-time data from up
to three of Vernier’s sensors as
independent variables. Functions
can be in analytic form like the
ones above or in recursive form
such as
Physics
Video
analysis
with
&
ENGINEERING
NEW Physics with
Video Analysis book
By Priscilla Laws, Robert Teese, Maxine Willis, and Patrick Cooney
By
Priscilla W. Laws
Robert B. Teese
Maxine C. Willis
Patrick J. Cooney
ework And lAbs
lAssrooms, Hom
Activities for c
s tools
o v i d e o A n A ly s i
using logger Pr
48 P VA
$
order code
Physics with Video Analysis contains 32 new video analysis
activities for introductory physics at either the high school or
college level. Topics include kinematics, dynamics, circuits,
sound, thermodynamics, electrostatics, and more. The activities
are centered on a collection of ready-to-go videos created for
this book. Collecting good videos for analysis can be challenging,
and the provided videos are a delight to work with.
Like other Vernier books, Physics with Video Analysis includes
printed student versions of the activities, ready to duplicate. Alternatively, you can use
the included word-processing files to adapt the activities to your particular students.
Complete solutions and instructor notes are included. The activities can be used as
homework projects, or as in-class group projects.
The book includes a CD with professionally made videos, student activities, solutions, and
Logger Pro experiment files. Physics with Video Analysis is a product of the NSF-funded
LivePhoto Physics Project. For more information, see http://livephoto.rit.edu/
Activity #19 from Physics with Video Analysis
One of the activities in Physics with Video Analysis is “Slinky
Wave Speeds.” Several cool videos show both a transverse and
a longitudinal wave traveling down the Slinky. The student is
asked to consider the motion of just a single coil on the Slinky,
and then to measure the two wave speeds. Experiments like this
are hard to set up, and are even more difficult to get quantitative
measurements. The slow motion videos make it very clear just
how the wave travels through the medium—that is, the Slinky. Video analysis is the perfect
tool for this project and many more activities.
You can download four samples videos, student activity guide, and Logger Pro files from
www.vernier.com/cmat/pva.html. The book includes these, and also has an answer key
and instructor’s notes.
New Photogate Bar Tape Kit
Perform experiments much like you would
with a traditional “ticker tape timer”
For many years, we have carried a photogate accessory called Bar
order code
$
Tape. Bar Tape is a 3 m flexible, plastic tape that contains alternating
TA P E - V P G
opaque and transparent bands. The tape can be attached to objects
and pulled through the photogate. The tape allows you to perform experiments much like
you would with a traditional “ticker tape timer.” We’ve recently updated this product,
and it now contains an adapter that neatly holds the tape in position on the photogate.
17
The graphs below show data collected with a toy car. The car had two speeds. From the
velocity graph, you can see an initial acceleration, then a nearly constant speed, and
then a second acceleration.
x = x + 0.6*dt
For more information or to sign up
for a Math Machines’ workshop,
go to www.mathmachines.net
2
Position data for a toy car
T h e C alip e r • F all 2 0 0 9 • w w w . v e r n i e r . c o m
Velocity data for a toy car
VERNIER SOFTWARE & TECHNOLOGY • PHYSICS
Video Analysis with
High-Speed Cameras
STEM 2
®
®
®
MINDST ORMS NXT
WITH VERNIE R AND LEGO
Collect motion data from
fast-moving objects
&
ENGINEERING
New STEM 2 with
Vernier® and LEGO®
MINDSTORMS® NXT
Activities cover core topics
in physical science
Long before LEGO introduced their
MINDSTORMS NXT robotics kit, we started
STEM2
working with them on hands-on science and
engineering projects using our sensors. Out of this collaboration
came our Vernier NXT Sensor Adapter and our first book of labs
and projects, STEM with Vernier® and LEGO® MINDSTORMS® NXT.
We have now published our second book of projects and labs using
Vernier sensors. We think these two books offer great ways to
motivate upper middle school and high school students to pursue
science and engineering careers.
35
$
STEM 2 with Vernier® and LEGO® MINDSTORMS® NXT has activities
using a Force Sensor, Magnetic Field Sensor, Voltage Probe, and Gas
Pressure Sensor. It covers topics in physical science and engineering,
including mechanics, pressure, electricity, and magnetism. Students
are challenged to build and program robots for testing batteries, finding
land mines, and controlling a Cartesian diver. Twelve classic labs done
with these same sensors and the NXT are also included.
Video analysis of a golf swing
Casio recently developed a set of high-speed
cameras (www.casio.com/products/Cameras/
High_Speed_EXILIM/). These cameras are actually
still digital cameras, but they have the ability to
capture high-speed video. The capture rates vary
from 210 frames per second (fps) to 1200 fps. The
price range is from $300 to $1000 per camera.
These cameras open exciting opportunities to
explore science that is difficult to see at normal
speed. Here are a couple of examples: Teachers want
to collect motion data from fast-moving objects,
such as the speed of a baseball as it leaves the
pitcher’s hand, or the speed of a golf ball after being
struck by a club. It would be natural to assume that a
Motion Detector could help answers these questions,
but these objects move too quickly for the Motion
Detector; however, video analysis of these fastmoving objects offers a great solution. We measured
the speed of a golf club and the speed of the golf
ball after impact using a Casio EX-FH20. The figure
above shows a frame from the video analysis, and
the graph shows velocities of the club head and ball.
We’ve posted this analysis on our web site.
You can see the video and data analysis at
www.vernier.com/innovate/114
order code
Magnet tester from STEM 2
String tester experiment from STEM 2
Our original STEM book covers topics in
environmental science and engineering,
including soil moisture, water quality, acidity,
and UV radiation, using a pH Sensor, UVB
Sensor, Temperature Probe, Conductivity
Probe and Soil Moisture Sensor. It has 14 labs
and 4 projects, including building an acidity
tester, an aquarium monitor, and a plant
watering system.
WIT H VER
NIER ®
STEM
AND LEG ®
O MIN DST
ORM
S ® NXT
35 S T E M
$
order code
Both books include all construction and programming instructions.
Each also includes a CD with editable student handouts in Word
format and MINDSTORMS NXT sample programs, movie clips, and
LEGO Digital Designer files with detailed instructions for building and
operating the robotics projects.
The Vernier NXT Sensor Adapter
The Vernier NXT Sensor Adapter allows
LEGO MINDSTORMS NXT robots to use over
30 sensors for sensor-based control systems.
order code
$
39 B TA - N X T
more online
Video analysis of a golf swing
Download videos, student activity guide, and NXT files
at www.vernier.com/stem2
T h e C alip e r • F all 2 0 0 9 • w w w . v e r n i e r . c o m
3
VERNIER SOFTWARE & TECHNOLOGY •
Worm Bin Composting
Studying Enzymes in the Laboratory
Our newest environmental project at Vernier is
composting with a worm bin. Our worm bin is a
large, locally made, unfinished cedar chest with
about 60 cubic feet of capacity. The bin is located
in a shady spot on the side of our building, and
contains a colony of red wiggler worms. We
collect food scraps and coffee grounds, along with
coffee filters, in a compost pail in our kitchen.
Volunteers, called the “worm wranglers,” empty
the pail into the worm bin several times a day.
We also add paper towels and grass clippings to
our composting worm bin. The worms turn this
portion of our garbage into nutrient-rich compost
that we can use on plants around our building.
Enzymes are molecules that regulate
the chemical reactions that occur
in all living organisms. Almost
all enzymes are globular proteins
that act as catalysts, substances
that speed up chemical reactions.
Enzymes catalyze reactions by
reducing the activation energy for a
specific reaction to occur and yet are
neither destroyed nor altered during
this process. Understanding how
enzymes work in biological systems
is a critical and difficult concept for
students to comprehend.
Keeping a colony of red wiggler worms happily
composting is not as easy as you might think.
If the colony of worms gets too hot or too dry,
the worms can die. For this reason, we monitor
temperature and carbon dioxide production from
our worm bin using a LabQuest, a Stainless Steel
Temperature Probe, and a CO2 Gas Sensor. The
graph below shows data taken from our worm bin
over a period of 50 hours. A 6 V, 12 Ah motorcycle
battery served as the power supply for the
LabQuest. We monitored the temperature inside
the compost heap and CO2 levels in the air in the
bin during this period. You can clearly see in the
graph that as temperature rises and falls, so does
the level of CO2 in the bin.
John Melville, our Biology Staff
Scientist, developed an advanced
laboratory exercise using the Vernier
SpectroVis spectrometer and the
enzyme tyrosinase. This enzyme
is involved in skin coloring in
mammals, immunity in insects, and
the browning of fruits, tubers, and
fungi that have been cut or damaged.
If you have any questions about how to adapt
your LabQuest to record continuously for
more than eight hours, contact John Melville
at [email protected]
Daily fluctuations in worm bin temperature (red)
and carbon dioxide levels (blue)
Vernier Software & Technology is a company that
is committed to environmental sustainability. We
are located in a LEED Gold certified building, we
recycle much of our waste, and many employees
ride their bikes or take public transportation to
work. We even have 128 solar panels on our roof.
You can find out all about our solar panels at
www.vernier.com/solar/
4
Tyrosinase catalyzes the amino
acid tyrosine into the compound
DL-3, 4-dihydroxyphenylalanine
or DL-DOPA for short. Tyrosinase
then catalyzes DL-DOPA into a
compound that spontaneously
converts into dopachrome.
As shown in the first graph,
dopachrome is a compound
with a peak absorbance at
468.5 nm, and is very easy to
detect and quantify using a
Vernier SpectroVis spectrometer.
Tyrosinase is an enzyme that lends
itself to the student laboratory. The
crystal structure of this enzyme from
sweet potato has been published
(see Klabunde et al., 1998). Enough
enzyme for an entire class period
can be isolated from a single potato,
and the enzymatic conversion of
DL-DOPA to dopachrome can be
measured in as little as 2 minutes. In
addition, many different compounds
act as inhibitors and alternative
substrates for this enzyme. For
example, the conversion of tyrosine
to DL-DOPA is the rate-limiting
step in this series of reactions. This
is clearly shown in the sample data
provided in the second graph above,
where DL-DOPA is converted to
T h e C alip e r • F all 2 0 0 9 • w w w . v e r n i e r . c o m
Full wavelength scans showing the
conversion of DL-DOPA to dopachrome
over a 2 minute period.
Graph demonstrating that tyrosinase converts
DL-DOPA (red) to dopachrome at a much faster
than if tyrosine (blue) is used as the substrate
dopachrome at a much faster
rate than when tyrosine is used as
the substrate.
In the first part of this advanced
laboratory exercise, students
prepare extracts of the enzyme
tyrosinase from potatoes. They
then compare the reaction rates of
two different substrates—tyrosine
and DL-DOPA. Students then
investigate the role of increasing
substrate concentration on
enzyme activity. The second
part of the lab is a guided inquiry
exercise that involves quantitative
analysis and the role of inhibitors,
pH, or temperature on tyrosinase.
A full description of this lab
exercise with sample data and
graphs can be found at
www.vernier.com/innovate/116
If you have any question about
this exercise or any of our
Advanced Biology with Vernier
exercises, feel free to contact
John at [email protected]
V E R N I E R S O F T W A R E & T E C H N O L O G Y • b i o l o gy
&
che m istry
Vernier Teams
with Bio-Rad for
Biotechnology Education
Studying Biomechanics
with Vernier
Vernier is very happy to announce a new partnership with Bio-Rad
Laboratories, Inc. We have heard from many of you that Bio-Rad
is your first choice for biotechnology curricula and equipment.
Bio-Rad combines high-quality supplies, equipment, and curricula
with outstanding customer service and technical support—things
we believe are important to teachers. Vernier’s photodocumentation
and gel analysis capabilities are natural complements to the Bio-Rad
products you are already using. In this new partnership, Bio-Rad and
Vernier will work together to enhance classroom experiences with joint
experiments and curricula. Beginning in the summer of 2009, the two
companies began co-presenting workshops for educators. Teachers
are utilizing Bio-Rad’s tested lab activities for bacterial transformation
and DNA electrophoresis along with Vernier’s Blue and White Digital
Bioimaging Systems and Logger Pro Software for analysis. Stay tuned
for more products from this exciting new collaboration.
Easily study the biomechanics of
the arm or leg using models
Join Bio-Rad and Vernier for a joint workshop at the NABT conference
in Denver in November 2009. Visit www.vernier.com/workshops or
e-mail Bio-Rad at [email protected]
If you have ever wanted to introduce your students
to the study of human biomechanics, we have found
a great product for you. While attending the Annual
Meeting of the Human Anatomy and Physiology
Society (HAPS), we came across two excellent
interactive models that use Vernier sensors and our
LabQuest to study human biomechanics.
NEW White Light
Transilluminator
White Light Transilluminator
The company, Denoyer-Geppert, in collaboration with
Daniel Lemon and Joe Griswold from the City College
of New York, developed fully articulated models of the
human arm and leg and a complete set of laboratory
exercises. Each model comes with a complete
curriculum that incorporates a Vernier Dual-Range
Force Sensor and a LabQuest to investigate the forces
that are applied to the biceps tendon or Achilles tendon
under varying loads and conditions. Our staff scientist,
John Melville, has been working with each model, and
has also found a way to measure joint angle using our
Low-g Accelerometer. A picture of students using the
human arm model to measure joint forces and angles
with our Logger Pro software can be seen above.
The complete curriculum and exercises can be found at
www.slworkshop.com/biomechanics.html. You can
purchase the models from Denoyer at the following
link http://www.denoyer.com. Go to “view products”
and choose “human anatomy models”, then select
“biomechanics” to see the models.
Don’t forget that you will need a LabQuest and a DualRange Force Sensor. If you want to measure joint angle,
you will also need to purchase a Low-g Accelerometer.
If you have any questions about these models, or
any of our Human Physiology with Vernier exercises,
contact John at [email protected].
119 W H T- T R A N S
$
order code
View gels stained with
non-fluorescent, visible stains
Our new White Light Transilluminator provides a high-quality
transilluminator at an affordable price. An array of white LEDs provides
extremely even illumination, while the adjustable light intensity helps
you to optimize the image. A built-in ruler allows for easy measurement
of migration distances. While our popular BlueView Transilluminator
can be used to view gels stained with SYBR Safe and other fluorescent
stains, the White Light Transilluminator allows you to view gels stained
with non-fluorescent, visible stains. This includes Bio-Rad’s Fast Blast™
DNA stain, used in both their Forensic DNA Fingerprinting Kit and
Analysis of Precut Lambda DNA Kit. Methylene blue and many other
non-fluorescent visible stains are viewed easily on this newest Vernier
biotechnology offering.
You can purchase the White Light
Transilluminator separately for simple
viewing, or purchase the entire White
Digital Bioimaging System. The White Digital
Bioimaging System allows you to view your
gels, capture the image digitally on your
computer, and analyze the data using
Logger Pro software (sold separately).
Setting up the White Digital
Bioimaging System
White Digital Bioimaging System
(Includes: White Light Transilluminator, Imaging Hood, ProScope HR
digital USB camera with 1-10X lens, and a ProScope Stand)
599 W H T- D B S
$
order code
T h e C alip e r • F all 2 0 0 9 • w w w . v e r n i e r . c o m
5
Introducing the NEW Vernier Mini GC
It’s affordable: no more
long student lines
at just one lab GC
At $1749, it is many thousands of
dollars less than a standard GC.
In fact, it is priced low enough
that instructors can finally
have a GC at each student lab
station, rather than have many
students share one GC unit.
Uses room air as a carrier
gas: no tanks of carrier
gases at each lab station
Using an efficient, softwarecontrolled internal pump system,
you can use room air as a carrier
gas. You also have the option of
connecting other carrier gases to
the Mini GC.
Connect to a
or LabQuest v
Vernier’s Mini GC
both Windows an
computers via a r
connection. You c
directly to our po
handheld for real
acquisition. Stude
collection, as wel
temperature-pre
directly from our
Free New GC labs from Gas Chromatography Investigations w
Each lab comes with extensive instructor information that details preparation of reagents, instructor
Lab 1: Using a Gas
Chromatograph: Identifying
Unknown Compounds
• Measure and analyze the retention
time of five ketones and a known
mixture of the ketones as they
pass through a Vernier Mini GC.
• Measure and analyze the
retention time of an unknown
mixture of ketones.
Lab 2: Verification of Esterification
• Conduct an esterification reaction of
ethanol and acetic acid, to produce ethyl
acetate and water.
Lab 3: Quantifying
Substances in a Mixtu
• Measure and analyze the GC retention times
of the reactants and products involved in
synthesizing ethyl acetate.
• Measure and analyze the GC retention
times of the reaction mixture to confirm the
production of ethyl acetate.
• Identify the ketones present in
an unknown mixture based on
retention times.
• Measure and analyze the GC
standard mixtures.
• Analyze the data to determin
of ethyl acetate and butyl ac
unknown mixture.
A copy of this lab manual is included with each Mini G
6
T h e C alip e r • F all 2 0 0 9 • w w w . v e r n i e r . c o m
computer
via USB
C connects to
nd Macintosh
robust USB
can also connect
opular LabQuest
l-time data
ents set up datall as the column
essure profiles
r software.
Use Vernier’s
award-winning
software for column
control, collection,
and peak integration
With either Vernier
Logger Pro for computers
or Vernier’s LabQuest App,
peak integration analysis
and retention-time
determination are built right
into the software.
Patented GC chip
technology detects
important organic families
Based on technology developed
by Seacoast Science, the advanced
MEMS GC sensor chip detects
many important families of
compounds, including alcohols,
aldehydes, ketones, aromatic
hydrocarbons, carboxylic acids,
chlorinated hydrocarbons, esters,
ethers, and nitriles. 1749 G C - M I N I
$
order code
Vernier Mini GC
Powered by Seacoast Science
Price includes two 1.0 μL syringes,
AC Adapter, USB cable, User’s Manual,
Lab Manual with 5 student experiments,
and handy compact carrying/storage case
with the Mini GC lab book
tips, sample data, and sample graphs. Here is a summary of each lab:
ure
• Prepare a set of
standard mixtures
of two esters, ethyl
acetate and butyl
acetate, starting with
a mixture whose
composition of the
esters is unknown.
C retention times of the
ne the concentrations
cetate in the original
Lab 4: Fractional Distillation
Lab 5: Investigating Gas
Chromatography
• Measure and analyze the
retention time of ethyl acetate
and butyl acetate as they pass
through a Vernier Mini GC.
• Measure and analyze the
chromatogram of a mixture of nine
compounds as they pass through a
Vernier Mini GC.
• Conduct the fractional distillation
of a mixture of ethyl acetate and
butyl acetate.
• Vary the temperature-pressure
profile of the Mini GC and observe
how the chromatogram is affected
by changes in the profile.
• Measure and analyze the retention time
of the fractions.
• Calculate the percent composition of each substance in
the mixture.
• Determine the best temperaturepressure profile to obtain the best
possible chromatographic separation
of the mixture.
G C , o r d o w n l o a d f ree l a b s a t w w w . v e r n i e r . c o m / g c
T h e C alip e r • F all 2 0 0 9 • w w w . v e r n i e r . c o m
7
V E R N I E R S O F T W A R E & T E C H N O L O G Y • l a b q uest
LabQuest
Updates
LabQuest Tips
• Use the Draw Prediction
command in the Analyze menu
to predict what a graph will look
like. Many science standards
require this step.
• Save time and print directly to
a USB printer—no need to go
through a computer.
• The LabQuest has lots of storage
space for files. Use it! Take data,
save a file. Open the file later to
do further analysis, or open the
file in Logger Pro.
• Update your LabQuest to the
latest software. Each version
brings more features, and is a
free update.
• Change the graph match range by
setting the y-axis scale in Graph
Options before choosing Motion
Match from the Analyze menu.
• Put your own lab instructions
on your LabQuest. See www.
vernier.com/labquest/library.
html for more information.
• Use the new peak integration
feature of LabQuest with your
exisiting gas chromatorgraph.
Connect your GC to LabQuest
with the Vernier Instrumentation
Amplifier (order code: INA-BTA).
8
• Support for the new Vernier Mini GC gas chromatograph
• Support for the Watts Up Pro electrical power meter
• New GPS signal strength applet for use with the Vernier GPS sensor
• Support of function generator and Power Amplifier when using Logger Pro 3.8
This update is free, and is recommended for all LabQuest users. For download
information, see www.vernier.com/labquest/updates
800.0
Run 1
Signal
369.9 mV
GC Peak
2-hexanone 4.82
Temperature (°C)
• Use the Strike Through Data
command in the Graph menu
to temporarily ignore some of
your data. Struck data will not
be used in any analysis, including
curve fits.
LabQuest 1.3 is now available. This new version of LabQuest software adds a number
of new features:
Power (W)
• Most of the time LabQuest is
ready to go when you connect
sensors, but if you have a
commonly used configuration
that is not quite the automatic
setup, you can save your
LabQuest session as a file. Then,
when you need to return to that
configuration, just open the file.
LabQuest 1.3 Update
Signal (mV)
• Try the hardware keys to
operate LabQuest. Almost all
functions can be done without
a stylus. You might prefer one
way over the other.
up d ates
0.0
0.0
Time (min)
Time
L
%
Power
119.3 W
-30
0.0
Time (s)
150000
Temperature
-18.6° C
5679
Hz
77
400
0.0
Time (s)
150000
Time
125,000 s
08:52 AM
08:52 AM
Use the new peak integration
feature to determine areas
and retention times with the
new Mini GC
%
-10
0
4.820 min
7.3
Audio Function Generator
File Table
1000
Hz
100
R
Run 1
Monitor power use of
appliances with Watts Up Pro
12:40 pm
The audio function generator
has additional wave forms
NEW Go! Tweet
®
Coming Soon! Free software makes it easy to share
sensor data to the internet from anywhere
Go!Tweet is a free application that allows students and teachers to publish data from
Vernier sensors to the internet for easy access from anywhere. Connect a Vernier Go!
device to your computer’s USB port, open the Go!Tweet program, and your data will
be on the web in minutes. Students can check the temperature or pH of a classroom
aquarium by monitoring the twitter feed of the sensor’s output. Need to know when
to water your plant? Set up a Go!Link, Vernier Soil Moisture Sensor, and Go!Tweet to
send automatic tweets when the soil needs water.
Go!Tweet is free and coming soon. Get more information or sign up for software
updates at www.vernier.com/tweet
Follow us on Twitter
You can see what the temperature is inside the Vernier
office by following our twitter feed at
http://twitter.com/GoTweetVST_HQ
25 years ago
The
Caliper
T h e C alip e r • F all 2 0 0 9 • w w w . v e r n i e r . c o m
We introduced our Temperature Plotter program
for Apple II computers, along with 2-Probe and
4-Probe Temperature Systems that connected to
the game port. We also discussed compatibility
with the new Apple IIc.
V E R N I E R S O F T W A R E & T E C H N O L O G Y • science
Watts Up with the Freezer?
Measure real-time electricity usage
with the Watts Up Pro
Temperature and power recorded
for a home freezer. The temperature
falls while the compressor runs. Spikes
are from the self-defrost cycle.
We decided to do some home
testing of a standard basement
freezer with the new Watts Up
Pro power meter. How much
energy is used, and how cold
does the freezer get when the
compressor is running? To find
out, we used a LabQuest and a
Watts Up Pro to log the data over
a 48-hour period. The graph tells
an interesting story and raises
several questions:
• Why is the pattern so regular?
• Why does every other spike
in the temperature data go so
much higher? What happens
to the power use when the
temperature spikes?
d epart m ent
In the Steps of Ireland’s
Greatest Scientists
While you probably know that Waterford County
Ireland is home to Waterford Crystal, you may not
know that it was home to Ireland’s two greatest
scientists, Robert Boyle and Ernest T.S. Walton.
Students at Christian Brothers Boys’ Secondary School,
in Dungarvan, Ireland, recently connected with these
science greats by visiting their places of birth. To
make the trip even more memorable, school principal,
John Murphy, had them bring along some Vernier
technology. Here is a Google Maps representation of
their journey showing the path they traveled. The
data were collected using a Vernier GPS sensor and a
LabQuest. The color of the path represents the altitude
changes as they moved towards the coast, where red
represents the highest altitudes and violet the lowest.
For complete details on the trip, visit our web site
at www.vernier.com/innovate/119
Watts Up Pro calculates a wide variety of data, including maximum
watts, frequency, and cumulative costs. Logger Pro or LabQuest
App collects data on the following types of data simultaneously:
Real Power, Potential, Current, and Apparent Power. More at
www.vernier.com/wattsup
The Watts Up Pro
Connects to a USB port on your computer
or LabQuest. Logger Pro 3.8 or LabQuest
App 1.3 or newer is required.
145 W U - P R O
$
order code
Traveling from Lismore castle to Abbeyside, Dungarvan, Ireland
more online
Watch an annotated screencast describing the full experiment
at www.vernier.com/innovate/118
Where have your scientific
explorations taken you and
your LabQuest?
Video Training
We have over 65 new training videos on our web site.
Whether you are new to data collection, helping someone
who is, or just need a three-minute refresher before trying
out a new sensor, there is something for everyone on the
new video section of our web site. Look for new videos from
featured activities this fall in the new Video Training section
of our web site. Go to www.vernier.com/videos
Antarctica? The Florida Keys?
Eastern Europe? Ireland?
Send us a picture and data
you have collected to share
with science teachers around
the world. If we publish your
photo, you will receive a $100
Vernier gift certificate.
Send an e-mail to
[email protected]
T h e C alip e r • F all 2 0 0 9 • w w w . v e r n i e r . c o m
9
V E R N I E R S O F T W A R E & T E C H N O L O G Y • l o gger
Logger Pro Tips
•U
se Autoarrange (Page menu) to
clean up the page. If you don’t
like the result, use Edit/Undo.
•U
se a double-y graph to
display data of incommensurate
units on the same graph. See
Graph Options.
• Create a semi-log or log-log
graph using Graph Options.
• Show or hide curve-fit
uncertainties. Double click on
the fit information box to adjust.
• Use Strike Through Data Cells
(Edit menu) to temporarily
ignore some data points.
• Use the space bar to start or stop
data collection, as long as space
has no other meaning.
• Use Undo Collect (Edit menu) to
undo the last data collection. Or,
set Logger Pro to automatically
store runs, if you prefer. (See
Preferences in the File menu.)
• Enable or disable curve fitting
• Set default folder location; for
example, keep your experiment
files on a server location where
they can be easily modified.
• Show larger text or bolder graph
lines on screen.
• Hide curve fit parameters if
desired. Perform a curve fit,
double click on the floating box,
and deselect Show on Graph. The
box will be hidden, leaving only
the fitted curve.
pro
up d ates
Logger Pro
Updates
Logger Pro 3.8
Logger Pro 3.8 is now available. This new release of Logger Pro adds support for
the Watts Up Pro electrical power meter and for the new Vernier Mini GC Gas
Chromatograph. It will also support the upcoming Windows 7 and Macintosh Snow
Leopard operating systems.
This new version 3.8 allows control of the Vernier Power Amplifier (order code PAMP)
when connected through a LabQuest. And, you can now access the Function Generator
of LabQuest via Logger Pro. Both the Power Amplifier and the Function Generator
can be controlled during data collection, which opens up interesting experiment
possibilities. For the Function Generator, a LabQuest is required, but the Power
Amplifier has some function with a LabPro, as well as full functionality with LabQuest.
We recommend that all LabPro and LabQuest users update to this new version of
Logger Pro for compatibility with the latest computers, and to benefit from other
under-the-hood fixes and improvements. This is a free update from any version of
Logger Pro 3. For download information, see www.vernier.com/lpupdates
Logger Pro and Excel work well together
Did you know that it is easy to move data from Logger Pro to Excel or other
spreadsheets? Sometimes the specialized calculations available in a spreadsheet are just
the ticket to complete the analysis of an experiment. There are several ways to move
Logger Pro data into a spreadsheet.
The easiest (and often best) way is to use the clipboard. Select the columns in the data
table that you want to move and choose Copy from the Edit menu. Then switch to Excel,
click the upper-left cell of the region you want to receive the data, and choose paste.
For most purposes, this is all you need to do. You may want to set the number of decimal
places displayed in Excel, because this process copies the full internal precision of the
values from Logger Pro to Excel.
The other method makes use of the comma-separated value (CSV) file format, and
is perhaps more effective if you have very large amounts of data to transfer. Choose
Export As InspireData (CSV), and give the file a name. Then, in your spreadsheet, choose
Import (usually found in the File menu) and follow the prompts to import a CSV file.
Excel in particular will guide you through the process, but the default choices are all
you will need. Finally, don’t forget that you can use this same clipboard technique to
copy graphs into a word processor for report preparation. Select the graph, choose copy
from the Edit menu, and the switch to your word processor. Paste. You may want to set
the graph smaller than is appropriate in Logger Pro so that the text and numbers will be
proportionally larger for printing.
Science Humor
Question #1: A bear in Alaska and a
bear in Yellowstone National Park
both fall into the water. Which one
dissolves faster?
Answer: The one in Alaska, because
it is polar.
- Submitted by Gretchen Stahmer DeMoss
Publications Manager
Vernier Software & Technology
10
Question #2: What do you get when you
cross an elephant with a grape?
Answer: Elephant grape sine theta
If you have ideas for good science jokes,
please send them to Dave Vernier
([email protected]). If we use
your joke in the Caliper, you will win
a “valuable” prize.
T h e C alip e r • F all 2 0 0 9 • w w w . v e r n i e r . c o m
Question #3: What do you get when
you cross an elephant with a
mountain climber?
Answer: You cannot cross an elephant
with a mountain climber. A mountain
climber is a scalar.
- Questions 2 and 3 submitted by
Eric B. Hochberg
Jet Propulsion Laboratory, Pasadena, CA
V E R N I E R S O F T W A R E & T E C H N O L O G Y • pr o f essi o na l
d eve l o p m ent
2009 Fall Hands-On Workshops
-
Tulsa, OK
Oklahoma City, OK
Wichita, KS
Topeka, KS
Fort Worth, TX
Kansas City, MO
Dallas, TX
Austin, TX
San Antonio, TX
Corpus Christi, TX
Houston, TX
Houston, TX
Lincoln, NE
Omaha, NE
Des Moines, IA
Minneapolis, MN
10/1/09
10/3/09
10/3/09
10/5/09
10/5/09
10/6/09
10/7/09
10/7/09
10/8/09
10/10/09
10/14/09
10/15/09
10/17/09
10/24/09
10/24/09
10/26/09
10/26/09
10/27/09
10/28/09
10/29/09
-
Indianapolis, IN
Dayton, OH
Madison, WI
Columbus, OH
Milwaukee, WI
Chicago, IL
Chicago, IL
Cincinnati, OH
Lexington, KY
Charleston, WV
Grand Rapids, MI
Detroit, MI
Cleveland, OH
Pittsburgh, PA
San Jose, CA
Erie, PA
San Francisco, CA
Sacramento, CA
Buffalo, NY
Rochester, NY
NOVEMBER ‘09
9/9/09
9/10/09
9/12/09
9/14/09
9/14/09
9/15/09
9/15/09
9/16/09
9/17/09
9/19/09
9/21/09
9/22/09
9/22/09
9/23/09
9/24/09
9/26/09
OCTOBER ‘09
SEPTEMBER ‘09
In these free, four-hour workshops you will have the chance to try the Vernier LabQuest both with a
computer and as a stand-alone device. Tips for using Logger Pro software will also be presented.
11/7/09
11/9/09
11/10/09
11/12/09
11/14/09
-
Portland, ME
Portsmouth, NH
Boston, MA
Worcester, MA
Providence, RI
Follow us on Twitter for info about
workshops, conferences, and more!
www.twitter.com/VernierST
more information
on all Vernier workshops at
www.vernier.com/workshop
NEW Vernier Awards
2010 Vernier/NSTA
Technology Award
Application deadline is November 30th
The Vernier Technology Award is your opportunity to
be honored for an innovative use of data-collection
technology with your students.
David Vernier, Northwest Division, Software Award Recipient 2009
Seven awards are offered annually: three high school
(grades 9-12), two middle school (grades 6-8), one
elementary (grades K-5), and one college.
The award consists of $1,000 in cash, $1,000 in
Vernier data-collection technology, and up to
$1,000 for expenses to attend the 2010 NSTA national
conference in Philadelphia.
more online
Apply online at
www.vernier.com/grants/nsta.html
Vernier is proud to be recognized as one of the
Top 100 Green Companies in Oregon, as well as one
of the Top 100 Companies to Work for in Oregon.
In addition, Vernier accepted an award from the
Portland Business Journal for being one of the 100
Fastest Growing Private Companies in Oregon.
Logger Pro, LabQuest, LabPro, Vernier and
caliper design, Go!, Logger Lite, Vernier
EasyTemp, Vernier EasyLink, and
Vernier EasyData are our registered
trademarks in the United States.
Oregon business award
2005 Philanthropy Award
For outstanding contribution in
support of educational excellence
International award for
Logger Pro software
Vernier is proud to be recognized for its philanthropic commitment, steady growth,
and as one of the Best 100 Companies to Work For in Oregon—for 10 years in a row.
Vernier Software & Technology,
vernier.com, DataMate, and
Graphical Analysis are our
trademarks or trade dress.
All other marks not owned by us
that appear herein are the property
of their respective owners.
T h e C alip e r • F all 2 0 0 9 • w w w . v e r n i e r . c o m
11
PRSRT STD
U.S. POSTAGE
PAID
Salem, OR
Permit No. 526
toll free 888-837-6437
www.vernier.com
13979 SW Millikan Way
Beaverton, OR 97005-2886
ADDRESS SERVICE REQUESTED
Go green!
Would you rather receive this newsletter
in your inbox instead of your mailbox?
Win a Free LabQuest
Prefer to get an e-mail version of this newsletter or our
catalog? Go to our web site and sign up for our digital
mailings, up-to-date product announcements, innovative
lab ideas using Vernier technology, video training updates,
and more. When you sign up, we will enter your name into
a drawing to win a FREE LabQuest.
www.vernier.com/green
green code
biotechnology
• Vernier Teams with Bio-Rad
• NEW White Light Transilluminator
p.
5
for more
information
Please pass this newsletter on or recycle it again.
White Digital Bioimaging System being used with Logger Pro Software.