1
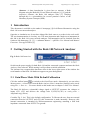
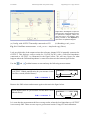
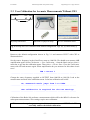
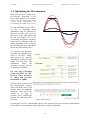
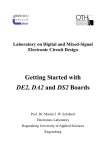
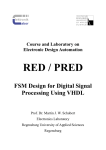
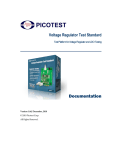
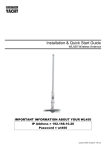
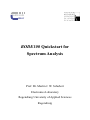
lektronik
abor
BODE100 Quickstart for
Spectrum Analysis
Prof. Dr. Martin J. W. Schubert
Electronics Laboratory
Regensburg University of Applied Sciences
Regensburg
M. Schubert
BODE100 Quickstart for Spectrum Analyis
Regensburg Univ. of Appl. Sciences
Abstract. A short introduction is given how to measure a Bode
diagram using the Bode100 Vector Network Analyzer [1], [2] and the
respective software, the Bode 100 analyzer Suite [3]. Working
through this is a precondition for several practical courses of the
laboratory System Concepts (PSK).
1 Introduction
This document is available at the author’s homepage [4] for different laboratories using the
Bode 100 vector network analyzer.
Opposite to simulation we do not have things like ideal sources or probes in the real world.
The test instrumentation is circuitry, too. The most important and complex test instrument in
this lab is the Bode 100 vector network analyzer. Documentation can be obtained from the
Omicron-Lab homepage [1], [2] → submenu Manual → pdf-files User Manual and Manual
Extension: Unwrapped Phase [2].
2 Getting Started with the Bode 100 Network Analyzer
Fig. 2: Bode 100 front view
Switch on the power supply for both Bode 100 and the connected computer and start the Bode
Analyzer Suite software. While starting it will perform an initial calibration.
The software has recognized the hardware when in the lower right corner of the window the
serial number of the Bode 100 hardware appears on green background.
2.1 Gain/Phase Mode With Default Calibration
Click the toolbar button
to switch to the Gain/Phase mode. Alternatively you can select
Measurement → Gain/Phase from the Bode Analyzer Suite’s menu bar. Settings can be saved
using File → Save As… . For more details on this mode can see chapter 3 of the User Manual.
The Bode 100 delivers a sinusoidal voltage signal at OUTPUT, measures the voltages at
inputs CH1, CH2 and delivers the voltage ratio V(CH2)/V(CH1) as result_vector =
Amplitude⋅exp(j⋅Phase).
Consider Fig. 2.1(a). This is the default configuration. To liberate the user from an external
connection between OUTPUT and CH1 this connection is made internally. However, this
internal connection is intended for 50Ω-measurement engineering assuming a 50Ω load
impedance connected from OUTPUT to ground.
-2-
M. Schubert
BODE100 Quickstart for Spectrum Analyis
Regensburg Univ. of Appl. Sciences
Right-click in the diagram to open the
shortcut menu. Use the shortcut menu
to optimize the diagram, select the
grid and zoom in the diagram. After
having zoomed in, click Optimize to
get back to an optimized diagram.
(a) Config. with OUTPUT internally connected to CH1
(b) Resulting result_vector
Fig. 2.1: Gain/Phase measurement: result_vector = Amplitude⋅exp(j⋅Phase)
Look on which side of the output resistor the reference channel CH1 is internally connected to
OUTPUT. This delivers correct results for V(CH2)/V(CH1) with a 50Ω load impedance
connected to OUTPUT. As illustrated in the figure below. We will now figure out what
happens when the 50Ω load impedance is removed as shown in the bottom figure below.
Use the
and
toolbar buttons to start and stop the following measurements:
A BNC 50Ω termination resistor is used as external load
to OUTPUT. Which amplification do you measure in the
Gain/Phase mode (dB and factor)?
0dB = Factor 1
OUTPUT
CH1
CH2
50Ω
Remove the 50Ω resistor and measure again as shown in the figure below.
Which amplification do you measure for this short circuit
(dB and factor)?
OUTPUT
CH1 CH2
6dB = Factor 2
It is seen that the measurement delivers wrong results, when the load impedance at OUTPUT
is not exactly 50Ω. There are two ways to get accurate results: Using CH1 and calibration.
-3-
M. Schubert
BODE100 Quickstart for Spectrum Analyis
Regensburg Univ. of Appl. Sciences
2.2 Using Reference CH1 for Accurate Measurements
Right-click in the diagram to open the
shortcut menu. Use the shortcut menu
to optimize the diagram, select the
grid and zoom in the diagram. After
having zoomed in, click Optimize to
get back to an optimized diagram.
(a) Config. with OUTPUT not internally connected to CH1 (b) Vector=V(CH2)/V(CH1)
Fig. 2.2: Gain/Phase measurement: Vector=V(CH2)/V(CH1) = Amplitude⋅exp(j⋅Phase).
Images taken from Bode 100 User Manual [2].
Click the Device Configuration
toolbar button or select Configuration → Device
Configuration… from the Bode Analyzer Suite’s menu bar or to get into the configuration
menu. Click on the switch circled red in Fig. 2.2 to get the illustrated setting of the switch.
The connection between OUTPUT and reference input CH1 has now to be made externally.
Note to which side of the output resistor the reference channel CH1 is connected now. The
measurement will always be correct independently of the load resistor. Use the setup of Fig.
2.2 with a source frequency 1KHz to try the two situations below:
Which amplification do you measure for this short circuit
(dB and factor)?
OUTPUT
CH1 CH2
OUTPUT
CH1
0dB = Factor 1
Which amplification do you measure now (dB and
factor)?
CH2
0dB = Factor 1
50Ω
This kind of measurement is always correct but a more uncomfortable due to the required
additional cable connected to the reference channel CH1.
-4-
M. Schubert
BODE100 Quickstart for Spectrum Analyis
Regensburg Univ. of Appl. Sciences
2.3 User Calibration for Accurate Measurements Without CH1
OUTPUT
CH1 CH2
(a) Setup schematics
(b) Photo of physical setup
(c) User calibration menu
Fig. 2.3: Setup for User Calibration with default configuration. Figs. (b), (c) taken from [2]
Return to the default configuration shown in Fig. 2.1 and connect OUPUT with CH2 as
illustrated above.
Set the source frequency in the Gain/Phase menu to 1000 Hz. We should now measure 6dB
amplification again. Select Calibration → User Calibration… from the Bode Analyzer Suite’s
menu bar to get into the calibration menu. Then select → Throu: Start. Close the Calibration
menu with OK and measure again. What amplification do you measure for this short circuit
now?
0dB = Factor 1
............................................................
Change the source frequency supplied to OUTPUT from 1000 Hz to 1001 Hz. Look at the
measurement and look at the calibration menu. Is the last calibration still valid?
No, measured result jumps from 0 to 84dB.
............................................................
New calibration is required for the new settings
............................................................
Calibration of the Bode 100 performs a measurement which will be the 0dB-/0°-reference for
subsequent measurements. New settings require new calibration.
When several setup changes are required it is easiest to connect OUTPUT and CH1
externally and use the default calibration.
-5-
M. Schubert
BODE100 Quickstart for Spectrum Analyis
Regensburg Univ. of Appl. Sciences
2.4 Optimizing the Measurement
Both CH1 and CH2 contain a 24bit ΔΣ-ADC, delivering fs,out=50
Ksps (Kilo-samples per second).
Experts only: The Main clock rate is
fs,in=12,8 MHz. Consequently, the
oversampling rate is OSR=fs,in/fs,out=256.
To take advantage of the ADC’s
24 bit (!) resolution input
amplitudes must be adjusted as
large as possible (blue curve in
the figure on the right hand side)
but not overloaded (red curve).
Overloaded amplitudes introduce
large errors by clipping while too
small amplitudes loose accuracy
by not using the most significant
bits of the ADC (black curve).
To optimize the measurement the user can adjust the
source’s OUTPUT amplitude using Level, and the
attenuation switches for the
inputs CH1 and CH2. The
attenuators
affect
the
measured accuracy but not
its displayed amplitude.
For this lab: Externally
connect OUTPUT an CH1.
Prefer a source frequency
of 1 KHz and a receiver
bandwidth of 100Hz.
On the bottom right side of
the measurement window
next to the Bode 100’s serial
number there are amplitude
indicators. Their green bar
should be as long as
possible, but it should not
become red indicating ADC
overload.
Figures taken from [2]
Lowering the receiver’s bandwidth improves the results on the cost of longer measurement
times which can be estimated to be larger than or equal 1/bandwidth.
-6-
M. Schubert
BODE100 Quickstart for Spectrum Analyis
Regensburg Univ. of Appl. Sciences
2.5 Frequency Sweep Mode
Click toolbar button
to switch to the Frequency Sweep mode. Alternatively, you can select
Measurement → Frequency Sweep from the Bode Analyzer Suite’s menu bar.
The frequency sweep mode
is documented in chapter 5
of the User Manual. A
frequency sweep is an
assembly of several gainphase measurements. The
result can be presented as
Bode-plot as shown on the
right hand side.
Anything we said about
configuration and calibration for the gain/phase
mode holds true for the
frequency sweep mode
also.
Source level and receiver
attenuations have to be set
such, that the maximum
amplitude is just below
overload. Observe the input
channel overload indicators
on the lower right hand side
of the window carefully.
Perform test measurements
with
large
bandwidth
before doing final, accurate
measurement with low
bandwidth.
Figure taken from [2]
Check configuration. Setup according to Fig. 2.2, external connection: OUTPUT – CH1.
Select the following Sweep Mode settings: (Savable using File → Save As… .)
Start Frequency: 100 Hz, Stop Frequency: 1 MHz, Sweep Mode: Log., Number of Points:
201, Receiver Bandwidth: 100 Hz. Optimize OUTPUT Level and Attenuators. (E.g. OUTPUT
Level: 0dB, Attenuator CH1 and CH2: 20dB.)
Shorten OUTPUT with CH1 and CH2. You should measure 0dB over all frequencies.
Buttons
,
and
are available to start a continuously repeated sweep, a single sweep
and to stop the measurement, respectively. Measure the short circuit of the cable: Get 0dB?
-7-
M. Schubert
BODE100 Quickstart for Spectrum Analyis
Regensburg Univ. of Appl. Sciences
3 Calibration: Removing Coupling-Capacitor Effects
This sub-chapter illustrates how calibration can remove side effects from measuring the
device under test (DUT). We configure Bode 100 as illustrated in Fig. 2.2 with CH1 as
external reference and connect it to OUTPUT. For a frequency sweep from 1Hz...1KHz of the
OpAmp circuit shown in Fig. 3-1(a) we expect a line very close to 0dB, but we get the
measurement illustrated in Fig. 3-1(b).
OP1
0V
Ck1
15μF
Ck2
15μF
R1
Rk1
10KΩ
10KΩ
Bode 100
OUTPUT
CH1 CH2
Fig. 3-1: (a) Setup
(b) Uncalibrated measurement
To fix the problem we measure the circuit illustrated in Fig. 3-2(a) and get a measured result
very similar to the measurement in Fig. 3-1(b).
Ck2
Ck1
15μF
15μF
R1
10KΩ
0V
Bode 100
OUTPUT
CH1 CH2
Fig. 3-2: (a) Setup
(b) Uncalibrated measurement
Perform a User Calibration with
the setup of Fig. 3-2. After this
calibration the setup 3-2 delivers a
0db-/0°-measurement. With this
calibration we measure the setup
of Fig. 3-1(a) again and get the
result shown in Fig. 3-3.
Fig. 3-3: Measured result for the OpAmp
circuit after calibration
-8-
M. Schubert
BODE100 Quickstart for Spectrum Analyis
Regensburg Univ. of Appl. Sciences
4 References
[1]
[2]
[3]
[4]
Available http://www.omicron-lab.com/
Bode 100 User Manual, available http://www.omicron-lab.com/manuals/pdf.html
Bode 100 Network Analyzer Suite, available http://www.omicron-lab.com/downloads.html
Homepage of M. Schubert, Regensburg University of Applied Sciences. Available: http://homepages.fhregensburg.de/~scm39115/ → Offered Education → Courses and Labs → Common Stuff
-9-