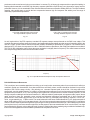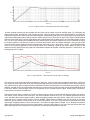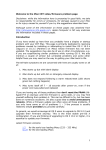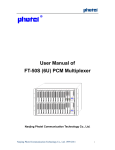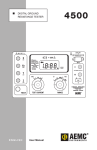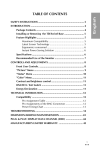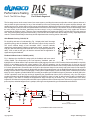
1
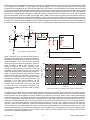
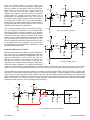
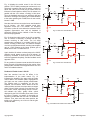
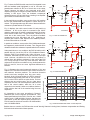
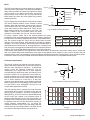
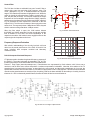
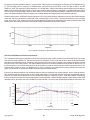
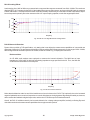
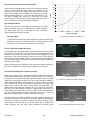
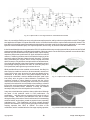
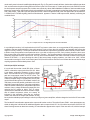
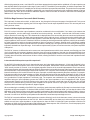
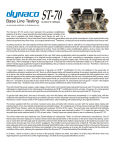
Performance Testing
Part 2: The PAS Line Stage
PAS
by George Ronnenkamp
Pacific Audio Regenesis
The line stage serves as the control center for a stereo system, providing the means to adjust the volume, balance and tone. It
also provides the gain necessary for any of the selected input sources to adequately drive the power amplifier although, with
modern input sources, it often ends up serving as an active attenuator. While the circuitry employed in the “amplifier” portion of the
PAS line stage is not at all unusual, the implementation of the tone controls certainly is. So unusual, in fact, that knowledge of how
the tone control circuit functions, particularly the bass control, is key to understanding many of the myths and criticisms
surrounding the PAS as a whole. There are some important differences between the PAS 2/3 and the PAS 3X in this regard as
well. Thus, before getting into performance testing, we'll first have an in depth look at the line stage circuitry, especially the tone
controls. Those less technically inclined may wish to skip ahead to the summary portion of this article.
Gain Related Circuitry - PAS 2/3, 3X
For simplicity and ease of understanding, Fig. 1 displays the basic line stage
amplifier topology with the feedback, filter and tone control circuitry removed.
The circuit consists simply of two cascaded 12AX7, common cathode,
capacitively coupled stages. Nothing unusual here except, perhaps, the open
loop gain, which is rather high at about 60 dB. The OL loop output impedance, of
about 62K, as well as the gain, will both be reduced with the application of
significant negative feedback.
100K
470K
.02
0.22
18K
Vol.
1.2M
1K
12AX7
Feedback & Bass Control - PAS 2/3 (not 3X)
12AX7
4.7K
Fig. 2 displays the simplified line stage with the feedback and bass control
Fig. 1 Basic Line Stage Topology
circuitry added. The components in the "low frequency" feedback path are
highlighted in red. Note that the 33pF capacitor that normally appears across the 47K FB resistor has been deleted for simplicity
since it is not relavant to the tone control analysis. The .0075uF capacitors can be considered out of circuit at very low
frequencies. The 750K bass pot is represented by two fixed resistors that simulate the control knob positioned at center.Although
it is a linear potentiometer, the resistors are not equal in value because the pot is not exactly at physical center for flat response
(as described in the assembly manual). Notice that one side of the potentiometer is in the feedback path while the other side is
actually in series with the output of the amplifier. Looking at the feedback path, we see the 390K portion of the bass pot in series
with 47K which, together, provide 22dB of NFB, resulting an amplifier gain of 38dB. As frequency increases, at about 100Hz, the
.0075uF capacitors come into play and begin bypassing the potentiometer. Above 1KHz, effectively, only the 47K resistor
remains dominant in the feedback path reducing the gain to 20dB. So, there is a "step" in gain vs frequency at the "unloaded" line
stage output. If one were to consider the simplified line stage concept only as shown if Fig. 2, it would seem to be utterly
impractical. Of what use is a preamplifier with 360K output impedance and non linear response? However, the output circuit is not
quite complete, and what happens next is, perhaps, the single most important thing to understand about the PAS2/3.
100K
0.22
470K
.02
390K
Vol.
38dB
.0075
.0075
18K
360K
20dB
1.2M
12AX7
Bass Pot.
12AX7
1K
47K
Output
Unloaded
Gain
0dB
20Hz
100Hz
20KHz
1KHz
Frequency
Bass Response Output Unloaded
4.7K
copyright 2015
Fig. 2 Feedback & Bass Control PAS 2/3
Pacific Audio Regenesis
Unlike most other preamplifiers, in order for the PAS 2/3 to deliver flat low end response it must be properly loaded.
Fig. 3 displays the "complete" LF signal path to the power amplifier. The low frequency signal path, as well as the load
components, are highlighted in red. Although the treble control is not shown, its implementation (covered later) does not impact
the signal path. Note the additional 62K and 510K resistors and 470K power amp load (typical of Dynaco tube PA's). With the bass
control set to the flat position, the 360K series component of the bass pot, and the parallel combination of the 62k, 510K and 470K
PA load, form a voltage divider resulting an an18dB low frequency signal attenuation. Recall that, previously, the unloaded LF
gain was about 38dB. Now, the "loaded" gain is 38db -18dB = 20dB. That low end step has been removed and the response is
flat, over the whole audio range, at the specified 20dB gain. And so, the proper load for a PAS 2/3 is the parallel equivalent of 62K,
510K and 470K which works out to be about 50K. Remember that number, 50K! But what about the output impedance? Isn't it still
too high? Well, in fact, the output impedance of the PAS 2/3 is frequency dependant. At low frequencies, the output impedance is
the parallel combination of the 62K and 510K load resistors, in parallel again with the impedance seen looking back into the line
100K
0.22
470K
.02
.0075
.0075
18K
390K
Vol.
1.2M
360K
12AX7
Bass Pot.
12AX7
1K
62K
510K
470K
47K
Power Amplifier
4.7K
Fig. 3 PAS Line Stage Loaded
20dB
Gain
0dB
20Hz
20KHz
1KHz
Frequency Response Loaded
100K
Output Impedance
stage. Looking back, we see that the 360K portion of
the bass pot is predominant, the output impedance of
the amplifier itself being quite low due to the significant
negative feedback. Thus, at the low end of the audio
band, the output impedance becomes 62K, 510K, and
360K in parallel, or about 48K. However, as the
frequency increases, the .0075uF capacitors come
into play and begin bypassing the bass pot. The output
impedance of the amplifier becomes more dominant
rather than the bass pot and internal load resistors. At
20KHz, the output impedance of the amplifier is almost
totally dominant and, with high NFB, becomes less
than 1K. Fig. 4 displays the actual "measured" output
impedance vs frequency of the test subject PAS 2. It is
interesting to note that Dynaco specifies the OP
impedance as 1K. While that may be true of the
amplifier stage, it is obviously not true of the line stage
as whole, and thus, is somewhat misleading. The
terminating impedance specification (500K or higher)
is more telling.
10K
1K
20
100
1K
10K
Frequency
Fig. 4 PAS 2 Measured Line Stage Output Impedance VS Frequency
Considering the line stage thus far, it would appear that flat low end response would only be achieved with a power amplifier
impedance of about 470K. That seems like a pretty significant restriction, but was it? Remember the era in which the PAS was
designed, when the input impedance of power amplifiers was typically in that range. With the 62K resistor predominantly
determining the "load," even if the power amplifier input impedance was 250K, the deviation from a flat low end response would
less than -1.0dB at 20Hz. At this point, Dynaco recommends removing the 510K resistor, which will restore flat response. So, in
actual fact, the PAS could easily drive most power amplifiers of the period. It was the introduction of solid state power amplifiers,
with their much lower input impedance, that began posing problems for the PAS. Then, criticism about poor low frequency
response, and high output impedance, began to flourish and perpetuate, eventually being applied universally even when the
PAS was driving the very tube amplifiers for which it was designed. Understanding the load requirement is the key here. With
simple resistor changes, the PAS 2/3 can be matched to power amplifiers with input impedances as low as 50K. Bypassing the
tone controls, a popular modification, allows the PAS to drive virtually any power amplifier. We'll be looking at this, and other
modifications, in detail in a separate article.
copyright 2015
2
Pacific Audio Regenesis
Since we're already looking at the bass control, we'll
continue on with how the boost/cut operates. Although the
PAS tone controls are considered to be of the "active" type,
albeit unusual, I look upon the bass control as more of a
hybrid. One side, the active part, operates within the
feedback loop, while the other side serves as a passive
voltage divider. Fig. 5 displays the bass control in the full
boost position. The full potentiometer value, 750K, is now in
the feedback loop, greatly reducing the NFB, and results in
an amplifier gain of 40dB. Also, all of the series resistance
has been removed, and the load is now connected directly to
the amplifier stage via the 0.22uF capacitor. Thus, there is a
20dB bass boost relative to the flat position.
100K
0.22
470K
.02
.0075
.0075
18K
Vol.
Load
1K
12AX7
Fig. 6 displays the bass control set to the full cut position.
The 47K resistor is predominant in the feedback path,
increasing the NFB to maximum, resulting in an amplifier
gain of 20dB. But now, the total resistance of the bass pot is
in series with the load, forming a maximum loss voltage
divider. Thus, the output, at the load, is reduced about -23dB
from the flat response setting "if the load is 50K." For any
boost/cut setting in between the min and max limits, the gain
will be determined by the combination of the portion of the
pot. that appears in the feedback path vs. the portion of that
appears in series with the load.
750K
Bass Pot.
12AX7
1.2M
47K
4.7K
Fig. 5 PAS 2/3 Bass Full Boost
100K
0.22
470K
.02
.0075
.0075
18K
Vol.
1.2M
Feedback & Bass Control - PAS 3X
12AX7
750K
Bass Pot.
Load
1K
12AX7
47K
Now lets examine how the 3X differs in its implementation of
the bass control. Fig. 7 shows the simplified line stage and
bass control with the feedback path highlighted in red. The
unusual potentiometer is obvious, but also note the
additional 1uF capacitor. The capacitor has nothing to do
4.7K
with the bass control function, rather, it prevents DC,
Fig. 6 PAS 2/3 Bass Full Cut
originating at the cathode of the first stage, from appearing
at the output. More on that later. The "special" potentiometer
consists of a 750K resistive track plus additional "conductive" tracks on either side, and "dual" wipers. When set to the center
position, as shown, the wipers straddle the resistive element , shorting it out, effectively removing the bass pot from the circuit.
In the feedback path, the 47K resistor is predominant, resulting in an amplifier gain of 20dB. Unlike the PAS 2/3, no portion of the
pot remains in series with the output and, thus, there is no low frequency gain step. The output impedance of the amplifier is also
much lower due to the significant negative feedback, and now, the 1uF capacitor (outside the FB loop), along with the total
effective load impedance, determines the low frequency cutoff. With a PA load of 20K, for example, the response would be down
about -1dB at 20Hz. So, the PAS 3X could drive power amplifiers of much lower impedance. Dynaco specified a terminating
impedance of 100K or higher, which is, perhaps, a bit conservative..
100K
0.22
470K
.02
.0075
.0075
18K
Vol.
1.2M
12AX7
750K
Bass Pot.
12AX7
1K
1.0
62K
510K
100K or higher
47K
Power Amplifier
4.7K
Fig. 7 Feedback & Bass Control PAS 3X
copyright 2015
3
Pacific Audio Regenesis
100K
PAS 2/3
Output Impedance
Fig. 8 displays the actual measured output
impedance of the test subject PAS 3X. For reference,
the dashed line shows the impedance of the PAS 2/3.
At 20Hz the output impedance is about 5K, almost 10
times less than the PAS 2/3, and drops quickly to less
than 1K as frequency increases. The rise in low
frequency impedance is predominantly due to the
reactance of the 1uF capacitor relative to the load
impedance.
10K
PAS 3X
1K
Note: The 62K and 510K load resistors are not really
needed with the bass pot. centered, and effectively
out of circuit. However, they do play a role in the offcenter response, particularly in bass cut conditions.
20
100
10K
1K
Frequency
Fig. 8 PAS 3X Measured Line Stage Output Impedance VS Frequency
Fig. 9 illustrates the PAS 3X bass control at full, and partial,
boost with the feedback path highlighted in red. At full boost,
both wipers reside on the conductive track of the
potentiometer and the full 750K resistance is added to the
47K feedback resistor. The resulting gain is about 40dB,
providing a 20dB boost over the 20dB flat position gain. Like
the PAS 2/3, at full boost, there is no series resistance, so the
output impedance remains low.
100K
0.22
470K
.02
.0075
.0075
18K
Bass
In the partial boost condition, one wiper remains on the
conductive track, while the other "shorts out" a portion of the
resistive track. The reduced portion of the potentiometer
remaining in the feedback path increases the NFB, reducing
the gain, thus lowering the boost. Unlike the PAS 2/3, there is
still no series resistance, so the output impedance remains
low.
Vol.
1K
12AX7
Fig. 10 shows the bass control under cut conditions. In full
cut, the 47K resistor is predominant in the feedback path,
resulting in an amplifier gain of 20dB. However, all of the
750K resistive element is now in series with the load creating
a voltage divider, and thus, maximum bass cut. The
magnitude of the cut is, like the PAS 2/3, load dependant,
and the internal load resistors (62K/510K) are back in play.
Given the same PA load (470K), the PAS 3x will exhibit the
same bass cut as the PAS 2/3, or about -23dB.
4.7K
When partial cut is employed, however, unlike the PAS 2/3,
the amount of NFB does not change. One wiper continues to
reside on the conductive track, keeping the 47K resistor as
the determining gain factor. The other wiper "shorts out" part
of the resistive track, resulting in a lesser voltage division,
and thus, less bass cut.
Vol.
1.0
750K
Full Boost
12AX7
1.2M
Load
47K
Partial Boost
Fig. 9 PAS 3X Bass Boost
100K
0.22
470K
.02
18K
1.2M
12AX7
.0075
Bass
750K
Full Cut
12AX7
1K
47K
.0075
1.0
Load
And so, in the PAS 3X, for incremental boost conditions, only
Partial Cut
4.7K
the NFB is altered, while for cut conditions, only the amount
of resistance in series with the load is altered. In the PAS 2/3,
Fig. 10 PAS 3X Bass Cut
it is a combination of both. At the point of maximum boost/cut
the PAS 2/3 and 3X are, essentially, equivalent, however,
there are significant differences in the response in between. For the purpose of comparison to the test subject PAS 2, I enlisted
my "daily driver" PAS 3X. In terms of disclosure, the 3X has been restored, not modified, and retains the original circuit
configuration and component values. Basically, a "new" PAS 3X. The line stage components in the stock, test subject PAS 2, are
original, and measured within specifications. The Telefunken tubes from the PAS 2 were installed in the PAS 3X for this, and all
subsequent comparative performance testing.
copyright 2015
4
Pacific Audio Regenesis
+ Max PAS 2/3X
+20
+1/2 PAS 3X
Bass Boost/Cut dB
Fig. 11 illustrates the measured bass response at the
1/2 and maximum boost/ cut positions with a 470K PA
load. Note that the +/- MAX curves are the "averaged"
response for the PAS 2 and 3X, which were nearly
identical. The +/-1/2 response curves represent the
bass control set half way between center and min/max
rotation. Note the significant difference in the amount of
boost and cut at the 1/2 rotation setting. While the PAS 2
approximates half of the maximum available boost or
cut, the PAS 3X is already near the limits. Virtually all of
the response happens within the first half of the
rotational travel. As well, the special 3X bass
potentiometer has less overall travel to begin with than
the conventional PAS 2 potentiometer. Thus, the PAS
3X bass control will be much more sensitive to adjust. It
is also interesting to note that the PAS 2/3 manuals
included tone control response plots which are
conspicuously absent in the 3X manual.
+10
+1/2 PAS 2/3
0
-10
-1/2 PAS 2/3
-1/2 PAS 3X
-20
- Max PAS 2/3X
20
1K
100
Frequency
Fig. 11 PAS 2/3X Measured Bass Control Response
PAS Treble Control
Now we'll look at the treble controls. Fig. 12 displays the simplified
line stage with both treble and bass controls absent. The 33pF FB
capacitor has been omitted for simplicity. The "high frequency"
feedback path, highlighted in red, is common to the PAS 2/3 and
3X. The capacitors can be considered short circuit and the 47K and
4.7K resistors determine the amplifier gain of 20dB.
100K
.0075
0.22
470K
.02
18K
.0075
Vol.
Feedback & Treble Control PAS 2/3 (not 3X)
1.2M
Fig. 13 illustrates the simplified line stage with the treble control
included. The feedback circuitry, highlighted in red, may appear
somewhat confusing at first. Two fixed resistors represent the
potentiometer set to the center position, and note that the values
are far from being equal. That's because, unlike the bass pot, the
treble pot is not linear, rather, it has a reverse log characteristic.
Notice that the potentiometer is, essentially, in parallel with the 47K
and 4.7K resistors. Furthermore, it represents virtually the same
"ratio" as the 47K and 4.7K resistors. Thus, the effective feedback
ratio remains the same, and the gain is still 20dB.
The 1K* resistor limits the maximum boost/cut with the
control set to the extremes. Without it, at high
frequencies, the amplifier would be running with either no
feedback, or 100% feedback, at the min/max limits. That
will become apparent shortly.
47K
1K
12AX7
4.7K
12AX7
Fig. 12 PAS 2/3/3X High Frequency Feedback Path
100K
.02
*Note: Given the location of the 1K resistor, the most
precise examination of the treble control circuitry would
involve numerous wye-delta transformations. That's a
whole lot of ugly calculations. Fortunately, we can still
achieve a very good understanding of how the treble
control operates with the more simple approach
employed in the following analysis.
.0075
0.22
470K
18K
.0075
Vol.
1.2M
12AX7
.002
47K
12AX7
1K
364K
Treble Pot.
1K
36K
During the following analysis, under boost and cut
conditions, we will continue to consider the capacitors as
short circuit. Even though they will exhibit some influence
as the control extremes are approached, it will not be
great, and the analysis will be significantly easier to
understand by ignoring them.
copyright 2015
4.7K
.02
Fig. 13 Feedback & Treble Control PAS 2/3
5
Pacific Audio Regenesis
Fig. 14 displays the treble control in the full boost
position. The full 400K potentiometer resistance is now
effectively in parallel with the 47K resistor, resulting in
about 42K. (We won't include the 1K resistor since its
influence is small relative to 400K).The 1K resistor is in
parallel with the 4.7K resistor, resulting in 824 ohms.
Thus, the feedback network is now effectively 42K and
824 ohms, resulting in an amplifier gain of 34dB. Relative
to the center position gain of 20dB, there is now a treble
boost of +14dB.
100K
.0075
0.22
470K
.02
.0075
18K
Vol.
12AX7
1.2M
.002
47K
1K
12AX7
400K
Note that, had a direct connection been used instead of
the 1K resistor, the .02uF capacitor would have
appeared across the 4.7K resistor. As frequency
increases, a point will come where the reactance of the
capacitor approaches zero, and all feedback is
effectively removed as the cathode of the first stage
becomes fully bypassed.
Treble Pot.
1K
4.7K
.02
Fig. 14 PAS 2/3 Full Treble Boost
Fig. 15 shows the treble control in the full cut position.
The 1K resistor is effectively in parallel with the 47K
resistor resulting in 980 ohms. The full 400K
potentiometer resistance is in parallel with the 4.7K
resistor, resulting in about 4.6K. The effective feedback
circuit is now 980 ohms and 4.6K, resulting in an amplifier
gain of 1.7dB. Relative to the center position gain of
20dB, there is now a -18.3dB treble cut.
100K
.0075
0.22
470K
.02
.0075
18K
Vol.
12AX7
1.2M
.002
47K
1K
12AX7
Again, had the 1K resistor not been present, the .002uF
capacitor would appear across the 47K resistor. As
frequency increased, at some point, the 47K resistor
would be bypassed completely, and the feedback would
approach 100%.
400K
Treble Pot.
1K
4.7K
For any position in between center and the full boost/cut
limits, the gain will be determined by the portion of the
potentiometer resistance that appears across the 47K
and 4.7K feedback resistors.
.02
Fig. 15 PAS 2/3 Full Treble Cut
Feedback & Treble Control - PAS 3X
Now lets examine how the 3X differs in its
implementation of the treble control. Fig. 16
illustrates the simplified line stage with the treble
control added. The feedback path is highlighted in
red. Again, we see a rather special potentiometer.
The resistive track is, essentially, cut into two,
separate, non-connected halves. When set to the
center position, as shown, the wiper does not contact
either of them! Highly unusual, to say the least. The
two resistor values, representing the two "halves,"
still maintain the same, greatly offset, values
displayed by the PAS 2/3 treble pot at center. Since
the wiper is floating, no portion of the treble pot
appears in parallel with the 47K and 4.7K feedback
resistors. Thus, when set to the center position, the
treble pot is, effectively, out of circuit and the gain
remains at 20dB.
100K
.0075
0.22
470K
.02
18K
.0075
Vol.
1.2M
12AX7
.002
47K
12AX7
1K
364K
Treble Pot.
1K
36K
4.7K
.02
Fig. 16 Feedback & Treble Control PAS 3X
copyright 2015
6
Pacific Audio Regenesis
Fig. 17 shows the PAS 3X treble control at full, and partial, boost
with the feedback path highlighted in red. At full boost, the
potentiometer element is still out of circuit due to the center
"break." However, the wiper is now connected to the .02uF
capacitor placing the 1K resistor in parallel with the 4.7K resistor,
resulting in 824 ohms. Thus, the feedback components
effectively become 47K and 824 ohms, resulting in an amplifier
gain of 35dB, for a treble boost of +15dB.
100K
0.22
470K
.02
18K
.0075
Vol.
12AX7
1.2M
1K
12AX7
364K
Treble
Pot
1K
Full Boost
4.7K
Fig. 18 displays the treble control under full and partial cut
conditions. At full cut, the wiper is connected to the .002uF
capacitor, placing the 1K resistor in parallel with the 47K resistor,
which results in 980 ohms. The pot element remains out of
circuit due to the center break. Thus, the effective feedback
components are now 980 ohms and 4.7K, producing an
amplifier gain of about 1.6dB. Relative to the 20dB flat position,
there is now a treble cut of -18.4dB.
Partial Boost
Fig. 17 PAS 3X Treble Boost
In partial cut conditions, some portion of the 364K potentiometer
track appears in series with the 1K resistor. Thus, the gain will be
related to the effective resistance in parallel with the 47K resistor.
36K
.02
36K
.02
100K
.0075
0.22
470K
.02
18K
.0075
Vol.
Under partial boost, or cut, conditions, the PAS 3X treble pot is in
parallel with only one of the (47K or 4.7K) feedback resistors,
while the PAS 2/3 pot impacts both. Under full boost, or cut,
conditions, unlike the PAS 2/3, the 3X pot "element" is an open
circuit. However, the difference at the min/max positions is
minimal since the 400K pot resistance, in the case of the PAS
2/3, is large enough to have only small influence. While the
response at full boost/cut conditions is very similar between the
PAS 2/3 and 3X, there are some significant differences in
between.
1.2M
12AX7
.002
47K
12AX7
1K
364K
Treble
Pot
1K
Full Cut
36K
4.7K
.002
Partial Cut
.02
364K
Fig. 19 illustrates the actual measured response of the test
subject PAS 2 and PAS 3X with the treble control set at the 1/2
and maximum boost/cut positions. The maximum boost/cut
results have been averaged since they were nearly
identical. At the 1/2 boost position, the PAS 2 response
has increased significantly, while the 3X, not very much.
+10
At 1/2 cut the PAS 2 and 3X are quite similar, but less
effective than one might expect. And so, under boost
conditions, the PAS 2 is most responsive within the first
half of the control rotation, while the 3X is most
0
responsive in the last half. Under cut conditions, both are
similar with the last half of the rotation being the most
responsive.
Treble Boost/Cut dB
.002
47K
In the partial boost condition, some portion of the 36K resistive
track of the potentiometer also appears in series with the 1K
resistor. The gain depends upon the value of that total effective
resistance in parallel with the 4.7K resistor.
It's interesting to note some anomalies in Dynaco's
published tone control response specifications. Their
stated specifications for the PAS 2,3 and 3X, are +/-20dB
at 20Hz, and +/-14dB at 20KHz. However, that does not
quite match up with the response plots provided in the
PAS 2/3 manual, which look more like +20/-23dB at 20Hz
and +14/-20dB at 20KHz.
.0075
Fig. 18 PAS 3X Treble Cut
+ Max PAS 2/3X
+1/2 PAS 2
+1/2 PAS 3X
-1/2 PAS 2
-1/2 PAS 3X
-10
- Max PAS 2/3X
-20
1K
Frequency
10K
20K
Fig. 19 PAS 2/3X Measured Treble Control Response
Besides the tone controls, the PAS has other sound "altering" features including blend, loudness compensation and filtering.
We'll take a look at how each of these operate.
copyright 2015
7
Pacific Audio Regenesis
Blend
47K
Input Left
The PAS incorporates some unique features in regards to
stereo and mono configuration. A six-position Stereo/Mono
rotary switch provides the means to progressively blend
(mix) a portion of one channel to the other, plus several
ways to select mono sources. We will only examine the
blend feature here since the mono options are just basic
switching functions.
560K PAS 2/3
750K
Bal.
68K PAS 3X
250K
Vol.
Blend Switch
270K PAS 2/3
33K PAS 3X
A+B
Fig. 20 displays the relevant blend circuitry which includes
47K
47K source isolation resistors, and a selection of blend
Input Right
resistors. Note that the selector switch actually has two
more positions which are not shown since they relate to
750K
mono select functions rather than blend. There are four
Bal.
Fig. 20 Blend Function PAS 2/3/3X
250K
blend settings ranging from full stereo to full mono. The
Vol.
switch is shown in the first position where the blend
resistors are, essentially, out of circuit. This is the normal,
full stereo, position. When set to the second position the series
combination of the resistors bridges the two inputs resulting in a portion of
A+B
Blend SW.
the signal from one channel appearing at the other. In the third position,
PAS 2/3
0%
5%
10% 100%
only one resistor bridges the inputs and the blend effect becomes
stronger. In the fourth position, both channels are tied directly together,
0%
20% 40% 100%
PAS 3X
resulting in a full mono condition. Note that the blend resistors differ in
value between the PAS 2/3 and 3X, and significantly so, resulting in the
Fig. 21 Blend vs Switch Position PAS 2/3/3X
PAS 3X having more aggressive blend between the full stereo and mono
positions. Fig. 21 shows the effective blend from one channel to the other
in the various switch positions. The original intent of the blend feature, as described in the owners manual, was to "reduce the
hole in the middle effect which characterizes some types of stereophonic source material". Later, however, Dynaco also had
something else in mind. That "something" was the introduction of their Derived Center Channel System, which we will not get into
in this article. However, the blend resistor values were altered in the PAS 3X to be more compatible with that system.
Loudness Compensation
The human ear does not respond the entire frequency
range at the same loudness level. As volume changes, so
does the ears response to frequency. At decreased
volume levels the listening experience may be
characterized by a significant loss of bass response
accompanied by a slight loss of treble. A "loudness" circuit
provides a measure of "compensation" for this effect by,
typically, boosting the low end of the audio band as an
inverse function of the volume control setting. Since the
loss of treble response is much less, it is also less
common to see high frequency compensation employed
within loudness circuits. Interestingly, Dynaco did include
it in their PAM-1 mono preamplifier, but only low end
compensation appeared in the PAS.
Tap
Loudness
Switch
Volume
Pot
0.1
4.7K
Fig. 22 Loudness Compensation PAS 2/3/3X
20
Loudness Comp. dB
The PAS employs what is, perhaps, the most commonly
used method which involves a tapped volume pot (tap
typically @ 10% resistance). The circuit configuration is
displayed in Fig. 22. An RC network, in parallel with the tap
on the volume pot, creates a low frequency boost in
response when the switch is set to the open position. As
the wiper is moved farther away from the tap point (louder)
the parallel circuit has less and less effect, resulting in
volume sensitive compensation. Fig. 23 shows the
measured response of the PAS 2 test subject with the
volume set to the 1/2 and 3/4 positions. The PAS 3X was
not measured, but employs exactly the same circuit.
1/2 Vol.
15
10
5
3/4 Vol.
20
1K
100
Frequency
Fig. 23 Measured Loudness Compensation PAS 2
copyright 2015
8
Pacific Audio Regenesis
Scratch Filter
The PAS also includes a switchable low pass "scratch" filter to
reduce ticks, pops, hiss and other high frequency noise. The
circuit, displayed in Fig. 24, is located between the amplifier
stages. The related components are highlighted in red. When the
switch is closed, the capacitors have a path to ground, and a 2pole, low pass filter is formed. The first pole consists of the output
impedance of the first amplifier stage and the 1500pF capacitor,
and the second consists of the 18K resistor and .004uF capacitor.
Fig. 25 illustrates the filter response as measured on the test
subject PAS 2. The 3X was not measured, but employs the exact
same circuit. The response is down -3dB at about 6.5KHz, beyond
which it continues rolling off at about -16dB per octave.
100K
.02
.004
1500pF
1.2M
3.3M
4.7K
Filter
Switch
Fig. 24 Scratch Filter PAS 2/3/3X
0
-10
-20
1K
PAS 2/3 Computer Simulated Response
12AX7
1K
12AX7
Filter Response dB
With a basic understanding of the circuitry involved, we'll now
delve into the actual performance of the PAS 2/3 and 3X line
stage, including both computer modeled and laboratory
measured results.
18K
Vol.
When the filter switch is open, the 3.3M resistor isolates
the1500pF and .004uF capacitors from the ground path, and the
filter is disabled. In this case, the series combination of the
capacitors around the 18K resistor have a negligible effect on the
response given the impedances involved.
Frequency Response Evaluation
0.22
470K
10K
20K
Frequency
Fig. 25 Measured PAS 2 Filter Response
LT Spice was used to simulate the gain and frequency response of
the PAS 2/3. The model schematic is presented in Fig. 26. The
triode employed in the model was the NH12AX7 downloaded from
Duncan's Amp Pages (www.duncanamps.com). Potentiometers are represented by fixed resistors, with Volume set to
maximum, and all others set to reflect mid position. Loudness compensation is disabled. Note that, since neither of the TC
potentiometers is at actual physical center, as described in the user manual, and the treble potentiometer is a log type, the
representative resistors in the model reflect my calculation of what would result in a flat response. This also assumes the ideal
case where the potentiometers are exactly to spec, that being 750K for the bass and 400K for the treble pot. In reality, there is a
tolerance of +/-20% on the actual potentiometers, the affect of which will also be covered further on.
Fig. 26 PAS 2/3 Line Stage LT Spice Model
copyright 2015
9
Pacific Audio Regenesis
A frequency response simulation was run, covering 20Hz - 20KHz, with the resulting gain vs frequency plot is displayed in Fig.
27. The line stage gain is a maximum of 18.9dB at 20Hz, and a minimum of 18.2 dB at 117Hz. The gain at 1KHz is 18.7dB.
Relative to 1KHz, the response could be stated as: +0.2/-0.5dB 20Hz - 20KHz. Note that the specified gain of the line stage is
20dB, so where did the extra dB go? Well, in fact, the gain of the line stage "amplifier" is just slightly over 20dB relative to the input
level at the grid of the first stage. Taken as whole, however, the 47K source isolation resistors, located on the blend selector
switch, along with the balance and volume pots, form a voltage divider which slightly reduces the actual overall gain.
Of note in this plot is the -0.5dB dip in response at about 117Hz. Remember all those capacitors we ignored to make the analysis
of the tone control circuits easier to understand? Well, as those begin to come "online," various pole interactions occur resulting
in that dip around 117Hz. However, the small simulated aberration is quite minor compared to the response deviation that could
actually occur due to the way the tone control center positions are determined, as per the manual.
Gain dB
20.0
19.0
18.0
17.0
100Hz
10KHz
1KHz
Frequency
Fig. 27 PAS 2/3 Line Stage LT Spice Model Gain vs Frequency
PAS 2/3 (not 3X) Measured Frequency Response
The test subject PAS 2 was measured at 31 points over a frequency range of 20Hz -20KHz, into a 470K load resistor. The output
was set to the rated 2VRMS level. The test consisted of two response runs, the first with the tone control knobs positioned as
described in the assembly manual. That being, setting the pots to the fully counter-clockwise , then installing the knobs such that
they point to the 7:00 o'clock position. The controls were then set to the front panel indicated center position for the test run. For
the second test run, the controls were optimized for best response using an oscilloscope and 50Hz/1KHz square waves. The
response plots, relative to 1KHz, are displayed in Fig. 28. For reference, the modeled result is also plotted on the response
graph. The measured 1KHz gain was 18.9dB, nearly identical to the modeled result.
It can be seen that the modeled, and measured response with the "optimized" tone control settings, were in close agreement.
The measured optimum response was +0.06/-0.42dB, 20Hz-20KHz. The plot with the pots set as per the assembly manual,
however, has some obvious deviations from the intended flat response, measuring +0.65/-1.75dB, 20Hz-20KHz. Contributing
factors include that fact that the bass and treble pots in the test amplifier measured 680K and 445K, rather than the ideal 750K
and 400K values, plus there was some deviation from the intended 7:00 o'clock knob positioning described in the manual. The
Relative Gain dB
1.0
0.5
Model
0
- 0.5
,
Optimized
- 1.0
- 1.5
Per Manual
- 2.0
100
1K
10K
Frequency
Fig. 28 PAS 2 Line Stage Measured Frequency Response
copyright 2015
10
Pacific Audio Regenesis
potentiometer shafts are splined, which means knob positioning is restricted to the increments allowed by the number of
splines. In the case of the test amplifier, an "exact" position of 7:00 o'clock would not have been possible without slightly
rotating the entire potentiometer in the chassis. While that could have been done, the intent was to test the amplifier as it most
likely would have been assembled, following the directions in the manual. In relative comparison, the response depicted by
the optimized plot was obtained with the knob center positions being determined by instrumentation. This resulted in a knob
position of just past 6:00 o'clock when set fully counter-clockwise. Note that, while this position was optimum for this particular
amplifier, it may not be for others. When restoring a PAS 2 or 3, I typically use the square wave method to determine the best
center position for the tone controls for that particular amplifier, however that will not be an option for most. Also note that the
amount of pot rotation involved between the optimized, and per manual positions, is quite small, so relatively small
movements can quite easily result in +/- 1db (or more) deviation from a flat response. If you regularly use the tone controls, this
may be of no consequence. However, if you desire the response to be absolutely as flat as possible, it may be an issue since,
without a signal generator and oscilloscope, there is no way to really be sure. The popular tone control bypass modification is,
of course, one solution.
PAS 2/3 Loading Effects
We have already discussed the requirement of proper loading if flat low end response is to be maintained. For interest, the
response of the test subject PAS 2 was measured with some less than optimum PA loads. The results, shown in Fig. 29,
display the response at 31 points from 20Hz - 20KHz, relative to 1KHz, with the tone controls optimized. The optimum 470K
load result is also displayed for reference. Note that 250K is the point at which Dynaco recommends removing the 510K
resistor located at the output jack. Although not shown on this graph, doing so will return the response to a state very similar to
the 470K plot. Also note that the PAS 2/3 is capable of properly driving 100K loads by suitably altering the values of the internal
62K and 510K load resistors.
1.0
No Load
0.5
Relative Gain dB
0
470K
- 0.5
250K
- 1.0
- 1.5
- 2.0
100K
- 2.5
- 2.5
100
1K
10K
Frequency
Fig. 29 PAS 2 Line Stage Measured Loading Effects
PAS 2/3 Harmonic Distortion
The PAS was often advertised as the "distortionless" preamplifier and, indeed, it pushed the limits of commercial measurement
equipment of the period. Thus, Dynaco did not publish a THD specification. Given the significant amount of negative feedback i t
employed, that's not too surprising. The total harmonic distortion of the test subject PAS 2 was measured over the range of 20Hz
- 20KHz. Readings were taken at the rated output level of 2VRMS, as well as 1VRMS. Fig. 30 displays the test results. Note that
the results depict the PAS 2 with the tone controls knobs installed as described in the assembly manual. THD testing was also
performed with the tone controls set for optimum flat response using the square wave method and the results were nearly
identical, within the bounds of test error.
Disclosure Note:
The HP 8903 audio analyzer empl oyed to measure the harmonic distortion has an input impedance of 100K. Thus,
the 62K internal load resistor in the PAS was changed to 100K, and the 510K removed, to maintain correct loading at
the output.
copyright 2015
11
Pacific Audio Regenesis
0.04
2V RMS
% THD
0.03
0.02
1V RMS
0.01
0
100
10K
1K
Frequency
Fig. 30 PAS 2 Measured Harmonic Distortion
With most power amplifiers requiring much less than 2VRMS drive for full output, it can be seen that the PAS 2/3 would be well
under 0.03% THD in any typical application. This is excellent performance for any vintage tube preamp.
PAS 2/3 Intermodulation Distortion 60Hz/7KHz
0.10
0.09
0.08
0.07
% IMD
Dynaco specifies the IM distortion of the PAS2/3 as being less than
0.05% at sufficient level to drive any amplifier. The IM distortion of the
PAS 2 test subject was measured at numerous output levels starting
from 0.5VRMS and increasing to the point where the IMD reached
0.1%. The results are displayed in Fig. 31. The IMD at 2VRMS was
.046% into a 470K load. This would certainly be more than enough to
drive any power amp of the period. The 0.1% distortion level was
reached at 6.0VRMS out. Note that the test results reflect the PAS 2
with the tone control knobs installed as per the instructions in the
assembly manual. The IMD test was also repeated with the tone
controls adjusted for optimum flatness using the square method, and
the results were virtually identical.
0.06
0.05
0.04
0.03
0.02
0.01
PAS 2/3 Signal to Noise
0
The SN of the test subject PAS 2 was measured and found to be
82.6dB relative to 2VRMS output and 76.9dB relative to 1VRMS.
Switching in a 400Hz high pass filter, to eliminate the hum component,
improved these figures by about 3.5dB.
0.5V
1.0V
2.0V
5.0V
10V
Output Voltage RMS
Fig. 31 PAS 2 Measured IM Distortion
Disclosure Note:
The SN measurement was performed using an HP 8903 Audio
Analyzer which has an input impedance of 100K. The 62K load resistor
was remplaced with 100K and the 510K load resistor was removed to
maintain proper loading at the output of the PAS.
PAS 2/3 10KHz Square Wave Response
From Assembly Manual
Fig. 32 displays the measured 10KHz square wave response of the PAS 2
test amplifier compared to the response shown in the assembly manual.
The results are very similar. The tone control knobs were installed as per the
instructions in the manual, then set to center for the test. A 470K load was
connected to the output. Note that readjusting the tone controls for optimum
flat response did not alter shape of the 10KHz waveform, only slightly
affected the amplitude.
Dynaco did not specify the amplitude of the square wave output displayed in
the manual. The PAS 2 measured result was taken at 3V P-P output.
PAS 2 Measured
Fig. 32 PAS 2 10KHz Square Wave Response
copyright 2015
12
Pacific Audio Regenesis
PAS 3X Computer Simulated Response
LT Spice was used to simulate the gain and frequency response of the PAS 3X. The model schematic, presented in Fig. 33,
reflects the circuitry with the tone controls set to center which, in the case of the 3X, means they are bypassed.
Fig. 33 PAS 3X Line Stage LT Spice Model
A frequency response simulation was run, covering 20Hz - 20KHz, with the resulting gain vs frequency plot is displayed in Fig.
34. The gain is virtually flat at 18.26dB over most of the audio range, dropping slightly at the extremes. Relative to 1KHz, the
response could be stated as +0/-0.23dB 20Hz - 20KHz. As with the PAS 2/3, the gain is slightly less than the specified 20dB due
to the 47K source isolation resistors associated with the blend switch. The gain relative to the grid of the first stage is 20.49dB.
Gain dB
20.0
19.0
18.0
17.0
1KHz
100Hz
10KHz
Frequency
Fig.34 PAS 3X Line Stage LT Spice Model Gain vs Frequency
PAS 3X Measured Frequency Response
The measured frequency response was +0/-0.36dB over a frequency range of 20Hz -20KHz, at 2VRMS out, into a 470K load.
Fig. 35 displays the results plotted at 31 points over the test frequency range. For reference, the modeled result is also plotted on
the response graph. The measured vs modeled results track very closely with some divergence beginning at about 5KHz, and
reaching a maximum of -0.12 dB at 20KHz. Still extremely close overall. The gain at 1KHz was 17.96dB relative to the input jack,
and 20.56dB relative to the grid of the first stage.
Response dB
1.0
0.5
0
Model
- 0.5
Measured
- 1.0
100
1K
10K
Frequency
Fig. 35 PAS 3X Line Stage Measured Response
copyright 2015
13
Pacific Audio Regenesis
PAS 3X Loading Effects
Loads ranging from 100K to 20K were connected to the output and the response measured from 20Hz - 20KHz. The results are
displayed in Fig. 36. Compared to the PAS 2/3 the loading effects are much less severe, and even with a 20K load, the response
is within 1dB at 20Hz. The response above about 120Hz is essentially unaffected by the selected test loads. Note that the drop in
low end response is primarily due to the reactance of the 1uF output coupling capacitor, not the line stage amplifier itself.
Response dB
0.5
0
100K
50K
- 0.5
20K
- 1.0
,
- 1.5
100
1K
10K
Frequency
Fig. 36 PAS 3X Line Stage Measured Loading Effects
PAS 3X Harmonic Distortion
Dynaco did not publish a THD specification, only stating that it was below the measurement capabilities of commercial test
equipment of the period. The total harmonic distortion of the test subject PAS 3X was measured over the range of 20Hz - 20KHz,
with readings taken at the rated output level of 2VRMS, as well as 1VRMS. Fig. 37 displays the test results.
Disclosure Note:
An HP 8903 audio analyzer was employed to measure the harmonic distortion. The 8903 has an input
impedance of 100K which is within the terminating impedance range specified for the 3X. Thus, the 62K and
510K internal load resistors were left in place.
0.04
% THD
0.03
2V RMS
0.02
0.01
0
1V RMS
100
1K
10K
Frequency
Fig. 37 PAS 3X Harmonic Distortion
Notice that the distortion at the low end of the band does not rise as it does on the PAS 2. This is primarily due to the increased
negative feedback that occurs at low frequencies as a result of the bass pot. being bypassed. Bypassing the treble pot, however,
does not affect the feedback at higher frequencies, and the rise in THD at the top end of the band remains.
Overall, the PAS 3X exhibits extremely low harmonic distortion for a vintage tube preamplifier, basically confirming Dynaco's
claim that it was below the measurement capabilities of test equipment of the period.
copyright 2015
14
Pacific Audio Regenesis
0.10
PAS 3X Intermodulation Distortion 60Hz/7KHz
0.09
0.08
0.07
% IMD
Dynaco specified the IM distortion of the PAS 3X as being less than
0.05% at 2 volts (sufficient output to drive any amplifier). The IM
distortion of the PAS 3X test subject was measured at numerous
output levels starting from 0.5VRMS and increased to the point
where the IMD reached 0.1%. The results are displayed in Fig. 38.
The IMD at 2VRMS was .040% into a 470K load. This would
certainly be more than enough to drive any power amp of the period.
The 0.1% distortion level was reached at 6.5RMS out.
0.06
0.05
0.04
0.03
PAS 3X Signal to Noise
0.02
The SN of the test PAS 2 was measured and found to be 81.2dB
relative to 2VRMS output and 77.3dB relative to 1VRMS. Switching
in a 400Hz high pass filter, to eliminate the hum component,
improved these figures by about 3.5dB
0.01
0
0.5V
1.0V
2.0V
5.0V
10V
Output Voltage RMS
Disclosure Note:
Fig. 38 PAS 3X Measured IM Distortion
The HP 8903 audio analyzer used to measure the SN has a 100K input
impedance. Since this is within the minimum recommended drive limits
for the PAS 3X, the internal load resistors were left in place.
PAS 3X 10KHz Square Wave Response
Fig. 39 displays the measured 10KHz square wave response of the PAS 3X
test amplifier compared to the response shown in the assembly manual. The
results are very similar. The tone control knobs were installed as per the
instructions in the manual, and set to center for the test. A 470K load was
connected to the output. Unlike the PAS 2, no attempt was made to adjust the
tone controls for "optimum" flat response, since they are effectively bypassed
at the the center position.
From Assembly Manual
Dynaco did not specify the amplitude of the square wave output displayed in
the manual. The PAS 3X test subject was measured at 3V P-P output.
PAS 2/3/3X HF Stability with Capacitive Loading
Square wave testing, thus far, was performed with the PAS terminated into a
470K resistive load directly at the output connector. However, in actual use,
the PAS will be connected to a power amplifier through a length of coaxial
cable which, along with the PA itself, will incur some capacitive loading. A
470pF capacitor was added to the output of the PAS 2 test subject in parallel
with the 470K load. This is representative of a particular 3 ft. length of low
quality cable I had at hand, which exhibits rather high capacitance. The
10KHz square wave response, displayed in Fig. 40, still looks reasonable,
with just a bit of well damped overshoot. A better quality interconnect, of
similar length, with a capacitance of around 100pF, will show little difference
from the unloaded response. Various capacitive loads up to .01uF were
applied with no tendency for instability or oscillation at any time.
To further explore the margin of stability, the 33pF feedback capacitor was
removed from the PAS 2 test amplifier, and various capacitive loads applied.
There was no tendency to outright oscillation at any time, however square
wave response was affected, as you would expect. Fig. 41 displays the
10KHz response with the 470pF load capacitance connected. More
copyright 2015
15
PAS 3X Measured
Fig. 39 PAS 3X 10KHz Square Wave Response
Fig. 40
PAS 2 with 470pFadditional load at output
Pacific Audio Regenesis
prominent overshoot and some ringing are now evident. In contrast, Fig. 42 shows the response with no capacitive loading. In
keeping with the extended, more linear, high frequency response (without the 33pF FB cap) a very impressive "square" wave is
presented. However, it is not sustainable in the real world where at least some capacitive loading will exist. The 33pF feedback
capacitor value would seem to provide the best compromise between high end response and stability over the range of
reasonably expected load capacitance.
PAS 2 with 470pFcapacitive load at output
and 33pF feedback capacitor removed
PAS 2 with no capacitive load at output
and 33pF feedback capacitor removed
Fig. 41
Fig. 42
As well, again with no 33pF FB capacitor, extended HF response sweeps were performed on the PAS 2 test subject. This
revealed an expected response peak, the frequency and amplitude being dependant upon the amount of capacitive load. In the
case of a 470pF, a peak of about +5dB occurred near 120KHz, followed by a rapid drop-off in response. The modeled result,
displayed in Fig. 43, shows the response from 1KHz - 500KHz for both no capacitance, and 470pF load capacitance conditions.
The PAS 3X also exhibited a peak of about the same amplitude, but slightly lower in frequency. The actual measured results
were not precisely plotted, but did correlate well with the model.
25.0
470pF Load
20.0
15.0
dB
No Capacitance
10.0
5.0
0.0
-5.0
10KHz
100KHz
Frequency
Fig. 43 LT Spice Model PAS 2/3 Response 33pF FB Capacitor Removed
PAS 2/3/3X Subsonic Resonance
This is a subject I am somewhat apprehensive to bring up as it may invoke unnecessary alarm for a scenario that is unlikely to
manifest in typical use. Nevertheless, it's a phenomenon that, technically, exists, and thus should be disclosed in any serious
analysis of the PAS line stage circuitry. I am referring to a resonant response peak in the 0.5Hz - 5Hz range that could,
theoretically, result in audible distortion. It is difficult to characterize the response at such low frequencies using traditional test
equipment and procedures, so it is not surprising that this particular PAS phenomenon remains relatively unknown. It was
through computer modeling that I first became aware of it. While the relatively modest peak, as it appears at the "output" seems
rather innocuous, there are, potentially, some overload and distortion implications associated with it. We'll examine this
phenomenon in more detail using the PAS 2/3 circuit as a test case. Fig. 44 displays the frequency response, from 0.1Hz 1KHz, as generated by my LT Spice model. The model schematic is the same at that indicated in Fig. 26. A response peak of
about +4dB, relative to 1KHz, occurs at approximately 1.2Hz. As far as an actual measured result on the test PAS 2, I was able to
confirm a similar response peak in that general region using a function generator and oscilloscope. I did not attempt to produce a
precise plot since my most accurate test equipment, for that purpose, does not extend below 10Hz. In and of itself, one might
tend to dismiss this as just a curious design anomaly, however, looking a little closer at what's going on within the feedback loop,
it becomes more apparent that it has at least the potential to be not quite so innocuous.
copyright 2015
16
Pacific Audio Regenesis
20.0
10.0
dB
0.0
-10.0
-20.0
0.1Hz
10Hz
1Hz
100Hz
1KHz
Frequency
Fig. 44 LT Spice PAS 2/3 1.2Hz Subsonic Resonant Peak at Output
Another modeled response plot was created, this time looking at the output of the first amplifier stage. Fig. 45 displays the
response at the plate, and after the .02uF coupling capacitor, where the peak is seen in more dramatic fashion. The peak gain
at the plate is about 35dB, which exceeds the open loop gain at that point by 5 dB. After the coupling capacitor, the peak gain is
actually about10dB greater than would be expected. What's going on here? First off, that "step" in the response heading below
100Hz, but before the peak, is actually expected due to the implementation of the bass control, as discussed way back on page
one. The rise in gain, heading down towards the peak, exists because the negative feedback can only be sustained as long as
the coupling capacitors can pass the frequency of interest. Below about 10Hz, the negative feedback is losing its grip as the
reactance of the coupling capacitors quickly increases and, approaching 1Hz, is all but gone. As well, some wild phase shifts
occur as the frequency approaches, and continues below, 1Hz, promoting a peak in gain before falling off again as the
capacitors lose the ability to pass any signal at all. Note that the response at the plate, continuing below1Hz, flattens since the
first stage input is DC coupled.
40
35
Plate
30
25
dB 20
15
After .02uF
10
5
0
-5
0.1Hz
10Hz
1Hz
100Hz
1KHz
Frequency
Fig. 45 LT Spice PAS 2/3 1.2Hz Resonant Peak at Output of 1st Stage
The concern here is the potential for the second stage, in particular, to be over driven should subsonic excursions, of sufficient
level, especially in the region of the peak, be present at the input. Being DC coupled, with essentially no NFB, the first stage not
only exhibits its full OL gain, but also produces an additional 5dB at the resonant peak. Even after passing through the coupling
capacitor, the peak level is still 10dB greater than that which would have been presented to the second stage had NFB still been
in full effect. With the second stage driven into compression by the elevated subsonic signal, audible higher frequencies,
superimposed, will also become distorted.
To demonstrate this effect, I modified my PAS 2/3 computer model to include a second subsonic signal generator, and another
47K resistor, to form a simple mixer at the input. The model schematic is shown in Fig. 46. The subsonic generator was set to
1.2Hz, that being the maximum peak frequency, while the audible generator was set to 500Hz. Initially, the level of the 1.2Hz
signal was set to 0, and the 500Hz signal to a level 0.38VRMS, which produced 2VRMS at the output. Enough to fully drive
almost any power amplifier, but not so high as to overload the preamp. Then, the 1.2Hz level was increased until the 500Hz
signal began to appear distorted. This occurred as the 1.2Hz input level approached 0.7VRMS. Fig. 47 displays the modeled
output, where the 500Hz signal can be seen superimposed upon the notably higher 1.2Hz level. Note the section where the
500Hz signal appears to be compressed. During this time it is actually being clipped on the top side.
copyright 2015
17
Pacific Audio Regenesis
Fig. 46 LT Spice PAS 2/3 Two Signal Subsonic Overload Distortion Model
Next, the test subject PAS 2 was set up using the same test frequencies, and input levels, employed in the model. The signals
were applied to the Spare L/R inputs and mixed via the A+B blend function with the output measured at the left channel. The
input to the right channel was disconnected at the blend switch so that the model circuit was properly duplicated (i.e. not loaded
by the RC volume and balance pots). The output scope trace, shown in Fig. 48, looks much like the modeled result.
It should noted that this scenario represents the PAS 2/3 condition with the tone controls centered. Other versions of the PAS will
present somewhat differently, as will altering the position of the tone controls. For the PAS 3X, the peak will occur at about 0.8Hz,
while the very first release of the PAS 2 (with its .02uF output coupling
capacitors) will present a peak near 5Hz. Again, with the tone controls
centered. Advancing the bass control increases the frequency of the
peak while reducing the bass lowers the peak frequency. The worst
case, presented by the "original" PAS 2, results in a peak near 20Hz
with the bass pot. fully advanced, and around 8Hz at half bass boost.
One might speculate this is the reason Dynaco increased the value of
second stage coupling capacitor from .02uF to .22uF fairly early on in
PAS 2 production, although we may never know for sure.
While possible effects can be modeled, and measured, how likely is it
that conducive conditions would ever be encountered in actual use?
In the PAS 2/3 test case, where the line stage was already driven,
undistorted, to the point where most power amplifiers would be
severely be overloaded, it took an additional subsonic "peak" input
level nearly twice as great to induce distortion. Furthermore, the
conditions required to induce distortion occurred with the volume
control set to maximum, something that would rarely occur with any
regularity in the real world. At more realistic volume settings, subsonic
input levels would be attenuated significantly, further reducing the
likelihood of overload induced distortion. In reality, the subsonic
anomaly is likely more of a curiosity rather than a concern.
In any case, should there be a problem, what could be done? Although
the intent of this particular article is PAS performance, not
modification, I will pass along a suggestion that comes by way of
Dave Gillespie, with whom I was fortunate to be able to consult
during the writing of this series. Dave is well known for his outstanding
technical articles, and projects, posted on popular forums (especially
Audiokarma.org). This modification can largely mitigate potential
problems and consists of simply reducing the value of the first stage
coupling capacitor from .02uF to .0033uF. The effect of the
modification, which I modeled after the first stage coupling capacitor,
copyright 2015
18
Fig. 47 LT Spice PAS 2/3 500Hz Overload Distortion
Fig. 48 PAS 2 Measured 500Hz Overload Distortion
Pacific Audio Regenesis
can be easily seen in the stock/modified plots displayed in Fig. 49. The peak is actually still there, but has been shifted up to about
3Hz, and reduced to the point of being difficult to discern in the PAS 2/3 scenario. It is more easily seen in the PAS 3X since the
low end response step is not present. But, in either case, effectively, about 10dB of additional "headroom" has been added at the
input to the second stage, significantly reducing the possibility of overload. In repeating the mixed signal lab. test on my modified
PAS 2 test subject, now at 3Hz (the new peak) and 500Hz, it was found that the level of the 3Hz signal had to be increased to
2.1VRMS (from 0.7VRMS originally) before similar distortion appeared. That's a 9.5dB improvement, basically confirming the
modeled results.
25
20
Stock (.02uF)
15
10
5
dB
0
-5
Modified (.0033uF)
-10
-15
-20
0.1Hz
10Hz
1Hz
100Hz
1KHz
Frequency
Fig. 49 LT Spice PAS 2/3 1st Stage Response Stock and Modified
In concluding this section, I will emphasize that it is NOT my intent to raise alarm, or to suggest that all PAS preamps must be
modified to prevent possible distortion due to this anomaly. Only to inform about its existence, and possible side effects that
might occur if only "in theory". The simple modification described here is provided as a possible solution should you have reason
to believe it may be a problem in some particular case, or you wish to improve your PAS, if only in theory. However, this is more
likely a case of the old "a solution in search of a problem" scenario. Also, be aware that the source itself may have issues if it is
presenting significant subsonic output levels. The only actual recommendation I will make is directed at owners of the original
release of the PAS 2. If, upon checking the value of the second stage coupling capacitor, you find it to be .02uF, I would
recommend increasing it to .22uF, as is found in later PAS 2,3 and 3X versions. Be sure not to increase the value of the first stage
coupling capacitor which has always been .02uF.
PAS 2/3 (not 3X) DC at Output
It is quite well known that a small DC offset, of about
100mV, exists at the output jacks of the PAS 2/3. What
is not always understood, however, is how it comes
about. The bold red lines in Fig. 50 highlight the signal
path and components related to the DC offset. The
origin is the 1.45VDC bias voltage seen at the cathode 1.45VDC
94mVDC
of the first amplifier stage. From that point, the DC path
can be followed through the 47K feedback resistor, the
750K bass pot and the parallel combination of the 62K
and 510K output load resistors. The series combination
of the FB resistor and bass pot, and parallel output load
resistors, forms a voltage divider at the output jack, thus
reducing the DC voltage to 94mV. This, of course,
represents the idealized case where the bias voltage,
Fig. 50 Path for DC at Output
and all related component values, are exactly as
indicated in the schematic. Note that any changes
made to the values of the output load resistors, as may
be required to maintain proper loading for various (non Dynaco) power amplifiers, will also change the level of the DC seen at the
output.
The fact that DC was allowed to appear at the output at all is rather curious. The earlier Dynaco PAM 1 mono preamp was very
similar in design but it did include an additional capacitor at the output to block DC. Yet, up until the introduction of the PAS 3X,
where blocking became an absolute necessity, DC was allowed to appear at the output. In the case of the 3X, with the bass pot
copyright 2015
19
Pacific Audio Regenesis
effectively bypassed at center, over 800mVDC would have appeared at the output had the additional 1uF output capacitor not
been included. With DC input levels in this range, Dynaco's own ST-70 and Mk IV power amplifiers, in which the inputs were "DC
coupled" could be subject to LF instability due to the way in which the input pentode was biased. Those who have incorporated
the popular tone control bypass modification should take note. Instructions on performing this modification appear in various
places online and, often, do not include the additional capacitor. Refer to the PAS 3X manual for instructions on installing the
additional 1uF output coupling capacitor.
PAS Line Stage Common Concerns & Quick Summary
This is primarily for those who couldn't, or didn't want to, slug through all of the previous pages of technical stuff. For the most
part, concerns and criticisms regarding the PAS line stage revolve around output impedance issues. This summary will focus
mainly on those issues.
Does the PAS Have High Output Impedance?
PAS 2/3 is unique in that the output impedance cannot be considered in the normal fashion. If one were to just measure the
output impedance, over the audio range, it would be found to be quite high, about 50K, at the low end of the band, but then
drops to less than 1K at the high end. This characteristic is displayed due to the unusual way the tone controls are implemented,
particularly the bass control. The bass control potentiometer is split, within the circuit, such that one portion resides within the
feedback loop, reducing the NFB, while the other appears in series with the output of the line stage. This results in a rather high
output impedance "at the low end" of the band. However, the bass pot is also bypassed with capacitors, which is the route taken
by higher frequencies, and thus the output impedance drops as frequency increases. Although such a significantly variable
output impedance over frequency would seem to be a problem, it actually isn't, as long as the PAS 2/3 is driving a relatively high
impedance load within an expected range. Such loads were presented by Dynaco, as well as most other, tube power amplifiers
of the period .
The PAS 3X, however, is different due to its custom tone control potentiometers which, when centered, are effectively out of the
circuit. In particular, the bass pot is bypassed, and thus, there is no series resistance to the load, plus increased NFB at the low
end of the band. And so, the 3X exhibits much lower overall output impedance that is also much more consistent over frequency.
Typically, about 5K at 20Hz, and less than 1K above 100Hz, meaning the PAS 3X can drive much lower load impedances than
the PAS 2/3.
Is it true that the PAS requires a specific output load?
For the PAS 2/3 in particular, this is true in the technical sense, but is also widely misunderstood. A fairly specific load is, in fact,
required in order for the response, below 1KHz, to be as flat as possible, with the bass control set to the mid position. What the
"load" actually consists of, however, is not immediately apparent. Because of the unusual implementation of the bass control,
which places a portion of the bass pot within the FB loop, and a portion in series with the output of the line stage, the output must
be terminated into a load of about 50K to obtain a flat response. The "complete" load is actually the parallel combination of two
internal load resistors, 62K on the PCB and 510K on the output jack, and the load presented by the power amplifier. For example:
if the power amplifier has an input impedance of 500K, then the total load would be the parallel combination of 62K, 510K and
500K which turns out to be 49.8K. It is apparent that the internal 62K resistor is the dominant factor in determining the overall
load, provided the PA input impedance is sufficiently high. The response was considered to be acceptably flat with power
amplifiers having an input impedance greater than 250K. As the input impedance of the PA approaches 250K, Dynaco
recommended "snipping out" the 510K resistor on the output jack, to bring the overall load closer to 50K again. So, the PAS
would have no problems driving most tube power amplifiers of the period. Concerns only began to emerge when solid state
amplifiers, with much lower input impedances, began to appear.
When considering the suitability of the PAS 2/3 for use with any particular power amplifier, the first step is to determine the input
impedance of the power amplifier. If it is above 250K, the PAS is suitable as is. If less than 250K, you can alter the values of the
62K and/or 510K internal resistors such that the parallel combination of the internal resistor load, and the PA load, is close to
50K. Theoretically, the lowest power amplifier load impedance you could drive would be about 50K, with both internal resistors
removed from the circuit. With PA input impedances less than that, loss of bass response begins to occur.
The PAS 3X is somewhat different. With its special tone controls, effectively out of circuit when set to center, it does not have the
same 50K overall load requirement as the PAS 2/3. With increased NFB, and no bass pot in series with the output, the 3X
exhibits a much lower output impedance, at low frequencies, than the PAS 2/3. Although Dynaco specified a minimum PA
impedance of 100K, the 3X can drive loads of 50K with little loss of bass response. Still, in stock form, it could not properly drive
"all" power amplifiers that appeared as SS took hold of the market.
copyright 2015
20
Pacific Audio Regenesis
It has been claimed that the PAS is not well suited for use with SS power amplifiers. Is this true?
If you have read the previous paragraphs concerning output impedance and load matching, you will understand how solid state
power amplifiers, with input impedances much lower than typical tube amplifiers, could present a challenge to the PAS.
Connecting the PAS to a SS power amplifier, without regard to impedance, typically results in some loss of bass response. The
severity of the loss depends directly on the input impedance of the particular power amplifier. The PAS line stage "amplifier"
itself actually does have the potential to drive virtually any power amplifier by virtue of the large amount of NFB employed, and
resulting low output impedance. It is the unusual implementation of the bass control that negates that potential low output
impedance from being seen at the output jacks. If the tone controls could be dispensed with, the PAS immediately becomes
compatible with many more SS power amplifiers. The popular tone control bypass modification, in its most basic
implementation, improves the drive capability considerably, but can be taken further by simply removing the 62K and 510K
internal load resistors. They are no longer required with the bass pot bypassed and only serve to unnecessarily burden the line
stage.The PAS 3X automatically bypasses the tone controls at the center position, however, the 62K and 510K load resistors
remain in place for proper operation off center. The resistors could also be removed, but the bass controls may not respond as
intended, should you decide to use them.
Before condemning the PAS for its inability to drive low impedance loads, in stock form, it should be remembered that it was
never intended to do so. It is a vintage piece that worked well with tube power amplifiers of the period.
Does the PAS require extremely short interconnects to the power amplifier?
No. This silly assertion appears on online forums from time to time. I have even seen claims warning that interconnects should be
no longer than two feet! The pretext is that, because of the high output impedance, high frequencies will be attenuated due the
capacitance of the cables. The fact is, for the PAS 2/3, the output impedance is only high at the low end of the audio band. At
higher frequencies the output impedance drops dramatically, to the point where interconnect cable capacitance is not a
significant issue, especially in the lengths typically employed. I have performed response tests, using 8 ft. cables of mediocre
quality, that showed negligible attenuation at 20KHz. The PAS 3X presents even less of a concern since it exhibits a lower output
impedance over an even broader frequency range.
DC is present at the output jacks. Is this a concern?
A small DC offset does appear at the output jacks of the PAS 2/3 (not 3X). It originates at the cathode of the first amplifier stage,
and appears at the output by way of the 47K feedback resistor and bass pot. This path, in combination with the 62K and 510K
internal load resistors, forms a voltage divider resulting in about 100mVDC appearing at the output jacks. This is somewhat
curious since most of Dynaco's own tube power amps of the period were also DC coupled at the inputs, however did not seem to
present any problems. It should be noted, however, that implementing the tone control bypass modification, which bypasses the
bass pot, may result in over 800mVDC appearing at the output. This level of DC, applied to the inputs of the ST-70 and MK IV in
particular, may result in LF instability. Although not always mentioned in online instructions for performing the tone control
bypass, an additional 1uF output coupling capacitor should also be installed, as was applied in the PAS 3X, to prevent such a
high level of DC from appearing at the output.
This concludes the line stage analysis. In the final installment of this series we'll have a close look at the power supply section of
the PAS preamplifier. As with the phono and line stages, over the years there has been no shortage of opinion and controversy
over its implementation and operation.
copyright 2015
21
Pacific Audio Regenesis