1
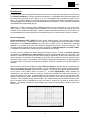
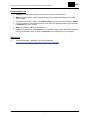
SCHOOL OF ENGINEERING AND APPLIED SCIENCE
DEPARTMENT OF ELECTRICAL AND COMPUTER ENGINEERING
ECE 2110: CIRCUIT THEORY LABORATORY
Experiment #7:
Introduction to Soldering Principles and Biomedical Engineering
EQUIPMENT
Lab Equipment
(1) Digital Oscilloscope
(1) BioAmplifier Kit
(1) Breadboard
(1) Test Leads
(1) BNC Cables
(1) Soldering Iron
(1) Printed Circuit Board
(3) Disposable Electrodes
(1) Electrode Gel
(1) Muli-Strand Wire
Equipment Description
Agilent DSO1024A Digital Oscilloscope
UFI Model 2122 BioAmplifier
Prototype Breadboard
BNC to Mini-Grabber Lead Set
BNC to BNC Cable
Weller WD1002 95W Soldering Station
PCB Printed in Room 304
BIOPAC Disposable Monitoring Electrodes
BIOPAC Signa Gel Electrode Gel
Stranded Wire for Soldering
Table 1 – Equipment List
COMPONENTS
Type
Resistor
LED
Value
--- Ω
Red
Symbol Name
RLIMIT
LED1
Multisim Part
Basic/Resistor
Diodes/LED/LED_red
Description
--Red LED
Table 2 – Component List
OBJECTIVES
•
•
•
•
•
•
Learn how an ECG works
Learn how to use an ECG amplifier
Learn how to set up a 3-lead ECG
Use the digital oscilloscope to observe an ECG waveform
Construct a simple LED circuit to monitor your heart rate
Learn how to solder and de-solder components onto a PCB
Copyright © 2014 GWU SEAS ECE Department
ECE 2110: Circuit Theory
1
SEAS
Experiment #7: Introduction to Soldering Principles and Biomedical Engineering
INTRODUCTION
In this lab, you will be recording ECG signals from your heart. In order to do this safely, you will be using
an isolated bioamplifier to prevent possible electrical shock. A bioamplifier takes electrical signals from
the human body, generally on the order of µV or mV, and amplifies them to produce a signal in the V
range. One prominent aspect of biomedical engineering is designing and building bioamplifiers because
almost all signals from the body must be amplified before they are usable. This is a common component
of any BME based senior design project.
Additionally, you will be learning proper soldering technique and its importance for your future senior
design project. Being comfortable using the soldering iron for small or large-scale projects will prove
important in any electronics-related field. While the simple experiments performed in lab are done only
on the breadboard, permanent projects can be soldered in place on a perf board or printed circuit board.
Electrocardiography
Electrocardiography (ECG or EKG from Greek: kardia, meaning heart) is the recording of the electrical
activity of the heart [1]. Traditionally this is in the form of a transthoracic (across the thorax or chest)
interpretation of the electrical activity of the heart over a period of time, as detected by electrodes
attached to the surface of the skin and recorded or displayed by a device external to the body. The
recording produced by this noninvasive procedure is termed an electrocardiogram (also ECG or EKG).
It is possible to record ECGs invasively using an implantable loop recorder.
An ECG is used to measure the heart’s electrical conduction system. It picks up electrical impulses
generated by the polarization and depolarization of cardiac tissue and translates into a waveform. The
waveform is then used to measure the rate and regularity of heartbeats, as well as the size and position
of the chambers, the presence of any damage to the heart, and the effects of drugs or devices used to
regulate the heart, such as a pacemaker. Most ECGs are performed for diagnostic or research purposes
on human hearts, but may also be performed on animals, usually for diagnosis of heart abnormalities or
research.
The ECG device detects and amplifies the tiny electrical changes on the skin that are caused when the
heart muscle depolarizes during each heartbeat. At rest, each heart muscle cell has a negative charge,
called the membrane potential, across its cell membrane. Decreasing this negative charge toward zero,
via the influx of the positive cations, Na+ and Ca++, is called depolarization, which activates the
mechanisms in the cell that cause it to contract. During each heartbeat, a healthy heart will have an
orderly progression of a wave of depolarization that is triggered by the cells in the sinoatrial node,
spreads out through the atrium, passes through the atrioventricular node, and then spreads all over the
ventricles. This is detected as tiny rises and falls in the voltage between two electrodes placed on either
side of the heart, which is displayed as a wavy line either on a screen or on paper as shown below in
Figure 1. This display indicates the overall rhythm of the heart and weaknesses in different parts of the
heart muscle.
Figure 1 – Sample ECG Readout
Copyright © 2014 GWU SEAS ECE Department
ECE 2110: Circuit Theory
2
SEAS
Experiment #7: Introduction to Soldering Principles and Biomedical Engineering
QRS Complex
The QRS complex is a name for the combination of three of the graphical deflections seen on a typical
electrocardiogram (ECG). It is usually the central and most visually obvious part of the tracing. It
corresponds to the depolarization of the right and left ventricles of the human heart. In adults, it normally
lasts 0.06-0.10s; in children and during physical activity, it may be shorter.
Typically, an ECG has five deflections, arbitrarily named "P" to "T" waves. The Q, R, and S waves
occur in rapid succession, do not all appear in all leads, and reflect a single event, and thus are usually
considered together. A Q wave is any downward deflection after the P wave. An R wave follows as an
upward deflection, and the S wave is any downward deflection after the R wave. The T wave follows the
S wave, and in some cases an additional U wave follows the T wave. Figure 2 below shows a single
PQRST pulse for a normal ECG. Figure 3 shows possible configurations for connecting the ECG leads
to the body.
Figure 2 – Enlargement of One “PQRST” Wave
Figure 3 – Possible Three-lead ECG Configurations (Earth is Ground)
Copyright © 2014 GWU SEAS ECE Department
ECE 2110: Circuit Theory
3
SEAS
Experiment #7: Introduction to Soldering Principles and Biomedical Engineering
PRELAB
Figure P.1 shows the basic illustration of the circuit you will be building in lab. This figure does not show
the bioamplifier, and instead shows your heart as the voltage source for the circuit. This will be replaced
with the bioamplifier when you actually construct the circuit. The purpose of the circuit is for the LED to
light up when it receives a positive voltage from your heart. For the prelab, you will use the circuit in
Figure P.2.
LED
LED
Vs
R LIMIT
5 Vpk
1kHz
0°
R LIMIT
Figure P.2 – LED Circuit Schematic
Figure P.1 – Bioamplifier Circuit Schematic
1. Simulate the circuit in Figure P.2 in Multisim.
a. Use the AC_Voltage component as your voltage source (5Vpk, 1kHz, no offset).
b. Use the LED_red component under Diodes/LED as the red LED.
c. Double-click the red wire and rename the nets to Vs and Rlimit, respectively.
2. Calculate RLIMIT so that it only allows 20mA to flow through the circuit assuming the voltage drop
across the LED is 1.75V.
3. Run the simulation by pressing the green run button. What happens to the LED?
4. Run a Transient Analysis that shows both the source voltage Vs and the voltage across RLIMIT
VRLIMIT showing exactly five cycles of Vs.
Questions:
•
•
•
What happened to the LED when you ran the simulation in Step 3?
What do you notice about the output voltage in your Transient Analysis?
Describe the behavior of the LED in terms of open-circuit or short-circuit for the positive and
negative portions of the signal.
Turn In:
•
•
•
Your Multisim circuit schematic
Your simulation output
Answer to the questions above, refer to your simulation data to justify your answers
Copyright © 2014 GWU SEAS ECE Department
ECE 2110: Circuit Theory
4
SEAS
Experiment #7: Introduction to Soldering Principles and Biomedical Engineering
LAB
Part I – Setting Up the ECG Bioamplifier
Figure 1.1 – Possible Three-lead ECG Configurations (Earth is Ground)
1.
2.
3.
4.
5.
6.
7.
8.
9.
10.
11.
12.
13.
14.
15.
Read the user manual and familiarize yourself with the controls and method of operation.
Connect the amplifier to an AC outlet and flip the “ON” switch.
Turn the “Balance” dial until the front panel meter needle is centered.
Set the “amplification” to max on both dials.
Set the “high” frequency roll-off to 50Hz and the “low” frequency roll-off to 0.1Hz.
Connect the lead box to the 6-pin socket in the back of the amplifier.
Connect the three leads to the lead by matching their respective colors.
Pick a configuration from Figure 1.1 and place electrodes at the designated locations on the
subject’s body using the gel.
Connect the leads to their respective electrodes based on their respective colors (positive,
negative, ground).
Turn on the digital oscilloscope.
Connect a BNC to BNC cable from the AC socket located in the back of the amplifier to the
digital oscilloscope.
Adjust the Volts/div and sec/div until you see a signal that resembles the sample ECG readout
from Figure 1. You may need to reduce the amplification if the signal is clipping.
Show the signal to the GTA before moving on.
Record the peak voltage Vpk of the ECG waveform.
Save the waveform as a PNG image on a USB flash drive.
Copyright © 2014 GWU SEAS ECE Department
ECE 2110: Circuit Theory
5
SEAS
Experiment #7: Introduction to Soldering Principles and Biomedical Engineering
Part II – Building the LED Circuit
LED
R LIMIT
Figure 2.1 – LED Circuit Schematic
1. Assuming a 1.4V drop across the LED and the peak voltage recorded from Part I, calculate the
value of RLIMIT required to obtain 20mA through the circuit. This will be different from the RLIMIT
used in the prelab.
2. Build the circuit in Figure 2.1 on a breadboard using the value you calculated for RLIMIT.
Note: The longer pin of the diode is the positive end (anode).
3. Disconnect the BNC to BNC cable from the back of the bioamplifier and replace it with a BNC to
mini-grabber test lead.
4. Connect the mini-grabber ends to the positive and negative terminals of your circuit, denoted by
the heart symbol in Figure 2.1.
Note: The LED should now blink at the same rate as your heart.
5. Show this to the GTA before moving on.
6. Disconnect the mini-grabber ends.
Part III – Designing and Soldering a PCB
1. The GTA will give a brief introduction on Ultiboard, the companion application to Multisim for
designing a PCB layout from your circuit schematic.
2. The GTA and lab staff will also give a short lecture on proper soldering techniques for soldering
components onto the provided PCB.
3. Transfer your circuit onto the PCB and solder the components in place.
4. Reconnect the mini-grabbers to verify that the circuit works.
5. Show this to the GTA before continuing.
Part IV – Soldering Multi-Strand Wire
1. The GTA will discuss the importance of soldering in your senior design project and explain the
technique of tinning.
2. Peel apart the multi-strand wire to form a fork and strip both strands.
3. Tin each strand and show your work to the GTA.
4. Have a lab partner hold onto both ends of the multi-strand wire and solder the two tinned ends
together.
5. Have the GTA approve your work.
6. De-solder the wire.
Copyright © 2014 GWU SEAS ECE Department
ECE 2110: Circuit Theory
6
SEAS
Experiment #7: Introduction to Soldering Principles and Biomedical Engineering
POST-LAB ANALYSIS
1. Calculate your heart rate in beats-per-minute (bpm) from the ECG waveform.
2. What is the peak voltage of the raw signal voltage prior to amplification based on your peak
output voltage?
3. Compared to the P and T waves, is the QRS complex a high or low frequency signal? Explain.
4. If you only wanted to view the QRS complex, how would you adjust the frequency roll-off values
to attenuate the P and T waves?
5. What is the purpose of RLIMIT in the LED circuit?
6. Follow the procedure for using Ultiboard in the Ultiboard Tutorial on the lab website to design a
PCB for your Multisim circuit. Include a screenshot of your PCB layout in your lab report.
REFERENCES
[1]
“Electrocardiography,” Wikipedia: The Free Encyclopedia,
https://secure.wikimedia.org/wikipedia/en/wiki/Electrocardiography
Copyright © 2014 GWU SEAS ECE Department
ECE 2110: Circuit Theory
7