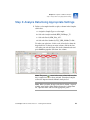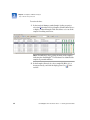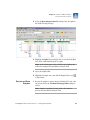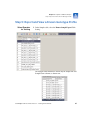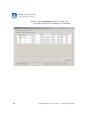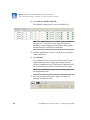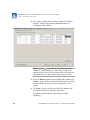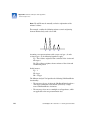
1
Getting Started Guide
GeneMapper® ID-X Software
Version 1.1 (Mixture Analysis Tool)
Note: To improve the clarity of graphics in
this PDF file, use the zoom tool to increase
magnification to 150% or greater.
Getting Started Guide
Getting Started
GeneMapper® ID-X
Software
Understanding
the Software
Version 1.1 (Mixture Analysis Tool)
Prepare for
Mixture Analysis
Segregate
Samples
Analyze 2Contributor
Mixtures with Two
Unknowns
Analyze 2Contributor
Mixtures with One
Known
Contributor
Analyze Merged
Results
© Copyright 2008, Applied Biosystems, Inc. All rights reserved.
For Research, Forensic, or Paternity Use Only. Not for use in diagnostic procedures.
Information in this document is subject to change without notice. Applied Biosystems assumes no responsibility for any errors that
may appear in this document.
GeneMapper® ID-X Software has undergone a verification process defined by Applied Biosystems. However, human identification
laboratories analyzing forensic casework, paternity, and databasing samples that choose to use GeneMapper® ID-X Software for
data analysis should perform their own appropriate validation studies..
APPLIED BIOSYSTEMS DISCLAIMS ALL WARRANTIES WITH RESPECT TO THIS DOCUMENT, EXPRESSED OR
IMPLIED, INCLUDING BUT NOT LIMITED TO THOSE OF MERCHANTABILITY OR FITNESS FOR A PARTICULAR
PURPOSE. IN NO EVENT SHALL APPLIED BIOSYSTEMS BE LIABLE, WHETHER IN CONTRACT, TORT, WARRANTY,
OR UNDER ANY STATUTE OR ON ANY OTHER BASIS FOR SPECIAL, INCIDENTAL, INDIRECT, PUNITIVE,
MULTIPLE OR CONSEQUENTIAL DAMAGES IN CONNECTION WITH OR ARISING FROM THIS DOCUMENT,
INCLUDING BUT NOT LIMITED TO THE USE THEREOF.
Notice to Purchaser:License Disclaimer.
Purchase of this software product alone does not imply any license under any process, instrument or other apparatus,
system, composition, reagent or kit rights under patent claims owned or otherwise controlled by Applera Corporation,
either expressly, or by estoppel.
TRADEMARKS:
Applied Biosystems, AB (Design), AmpFlSTR, COfiler, GeneMapper, Identifiler, and SGM Plus are registered trademarks of
Applied Biosystems, Inc. or its subsidiaries in the US and/or certain other countries.
This product includes software developed by the Apache Software Foundation.
This product includes software developed by the ExoLab Project.
JNIRegistry is copyrighted © by ICE Engineering, Inc.
Microsoft, Excel and Windows are registered trademarks of Microsoft Corporation.
All other trademarks are the sole property of their respective owners.
4396773 Rev. A
9/2008
Contents
Preface . . . . . . . . . . . . . . . . . . . . . . . . . . . . . . . . . . . . vii
How to Use This Guide . . . . . . . . . . . . . . . . . . . . . . . . . . . . . . . . . .vii
How to Obtain More Information . . . . . . . . . . . . . . . . . . . . . . . . . . . ix
How to Obtain Support . . . . . . . . . . . . . . . . . . . . . . . . . . . . . . . . . . xi
Chapter 1
Getting Started . . . . . . . . . . . . . . . . . . . . . . . . . . . . . . . 1
What’s New in the GeneMapper® ID-X Software: The Mixture
Analysis Tool . . . . . . . . . . . . . . . . . . . . . . . . . . . . . . . . . . . . . . . . . . 2
GeneMapper® ID-X Software Mixture Analysis Workflows . . . . . . . 4
Using this Guide for Mixture Analysis . . . . . . . . . . . . . . . . . . . . . . . 6
Overview . . . . . . . . . . . . . . . . . . . . . . . . . . . . . . . . . . . . . . . . . . 6
For More Information. . . . . . . . . . . . . . . . . . . . . . . . . . . . . . . . . 8
Glossary of Terms . . . . . . . . . . . . . . . . . . . . . . . . . . . . . . . . . . . . . . 9
Chapter 2
Understanding the Software . . . . . . . . . . . . . . . . . . . 19
Overview . . . . . . . . . . . . . . . . . . . . . . . . . . . . . . . . . . . . . . . . . . . . 20
About the Software . . . . . . . . . . . . . . . . . . . . . . . . . . . . . . . . . 20
In This Chapter . . . . . . . . . . . . . . . . . . . . . . . . . . . . . . . . . . . . 20
Mixture Analysis Methods . . . . . . . . . . . . . . . . . . . . . . . . . . . . . . . 20
Sample Segregation and Statistical Calculations . . . . . . . . . . . . . 21
Population Databases . . . . . . . . . . . . . . . . . . . . . . . . . . . . . . . . . . 22
Example Data . . . . . . . . . . . . . . . . . . . . . . . . . . . . . . . . . . . . . . . . 22
Overview . . . . . . . . . . . . . . . . . . . . . . . . . . . . . . . . . . . . . . . . . 22
How to Access the Example Data Files . . . . . . . . . . . . . . . . . 23
GeneMapper® ID-X Software Version 1.1 Getting Started Guide
iii
Chapter 3
Prepare for Mixture Analysis. . . . . . . . . . . . . . . . . . . . 25
Overview . . . . . . . . . . . . . . . . . . . . . . . . . . . . . . . . . . . . . . . . . . . . 26
Mixture Analysis Preparation . . . . . . . . . . . . . . . . . . . . . . . . . 26
In This Chapter . . . . . . . . . . . . . . . . . . . . . . . . . . . . . . . . . . . . 26
Step 1: Create a GeneMapper® ID-X Software Project. . . . . . . . . 27
Open and Create a New GeneMapper®
ID-X Project. . . . . . . . . . . . . . . . . . . . . . . . . . . . . . . . . . . . . . . 27
Add Samples to the Project . . . . . . . . . . . . . . . . . . . . . . . . . . 27
Step 2: Import an Analysis Method. . . . . . . . . . . . . . . . . . . . . . . . 28
Step 3: Analyze Data Using Appropriate Settings. . . . . . . . . . . . . 29
Step 4: Review Analysis Results . . . . . . . . . . . . . . . . . . . . . . . . . . 31
Review Analysis Summaries . . . . . . . . . . . . . . . . . . . . . . . . . . 31
Review and Save Samples . . . . . . . . . . . . . . . . . . . . . . . . . . . 33
Step 5: Export and View a Known Genotype Profile. . . . . . . . . . . 35
Select Samples for Viewing . . . . . . . . . . . . . . . . . . . . . . . . . . 35
Export the Table . . . . . . . . . . . . . . . . . . . . . . . . . . . . . . . . . . . 38
Chapter 4
Segregate Samples . . . . . . . . . . . . . . . . . . . . . . . . . . . 41
Overview . . . . . . . . . . . . . . . . . . . . . . . . . . . . . . . . . . . . . . . . . . . . 42
About Sample Segregation. . . . . . . . . . . . . . . . . . . . . . . . . . . 42
In This Chapter . . . . . . . . . . . . . . . . . . . . . . . . . . . . . . . . . . . . 42
Step 1: Launch the Mixture Analysis Tool . . . . . . . . . . . . . . . . . . 43
Step 2: Import a Population Database . . . . . . . . . . . . . . . . . . . . . 43
Step 3: Create a New Mixture Analysis Method . . . . . . . . . . . . . 45
Create a Mixture Analysis Method using the Mixture Analysis
Manager . . . . . . . . . . . . . . . . . . . . . . . . . . . . . . . . . . . . . . . . . 45
Apply a Mixture Analysis Method to Samples . . . . . . . . . . . . 49
Create an MA Method using the Column Drop-Down Method
(Alternate Method) . . . . . . . . . . . . . . . . . . . . . . . . . . . . . . . . . 50
Step 4: Segregate the Samples . . . . . . . . . . . . . . . . . . . . . . . . . . 51
iv
GeneMapper® ID-X Software Version 1.1 Getting Started Guide
Chapter 5
Analyze 2-Contributor Mixtures with
Two Unknowns . . . . . . . . . . . . . . . . . . . . . . . . . . . . . . 55
Overview . . . . . . . . . . . . . . . . . . . . . . . . . . . . . . . . . . . . . . . . . . . . 56
About Analysis of 2-Contributor Samples Where Both
Contributors are Unknown . . . . . . . . . . . . . . . . . . . . . . . . . . . 56
In This Chapter . . . . . . . . . . . . . . . . . . . . . . . . . . . . . . . . . . . . 56
Step 1: Extract Individual Genotypes . . . . . . . . . . . . . . . . . . . . . . 57
Step 2: Review the Results of the Extraction . . . . . . . . . . . . . . . . 58
About Mixture Analysis Results Viewer Tables . . . . . . . . . . . . 58
Review Extraction Results. . . . . . . . . . . . . . . . . . . . . . . . . . . . 60
Step 3: Determine Genotype Combinations to Include in Statistical
Calculations . . . . . . . . . . . . . . . . . . . . . . . . . . . . . . . . . . . . . . . . . . 63
Review First Sample . . . . . . . . . . . . . . . . . . . . . . . . . . . . . . . . 63
Review Second Sample . . . . . . . . . . . . . . . . . . . . . . . . . . . . . 65
Select Genotypes for Second Sample . . . . . . . . . . . . . . . . . . 68
Review Remaining Samples . . . . . . . . . . . . . . . . . . . . . . . . . . 70
Step 4: Calculate Random Match Probabilities and Combined
Probability of Inclusion/Exclusion . . . . . . . . . . . . . . . . . . . . . . . . . 71
Step 5: Review the Results of Random Match Probability and
Combined Probability of Inclusion/Exclusion Calculations . . . . . 72
Step 6: Calculate and Review Likelihood Ratio Results . . . . . . . . 74
Calculate the Likelihood Ratio Based on Contributors to the
Mixture . . . . . . . . . . . . . . . . . . . . . . . . . . . . . . . . . . . . . . . . . . 74
Calculate the Likelihood Ratio Based on the Major Contributor
Only . . . . . . . . . . . . . . . . . . . . . . . . . . . . . . . . . . . . . . . . . . . . . 81
Chapter 6
Analyze 2-Contributor Mixtures with One Known
Contributor . . . . . . . . . . . . . . . . . . . . . . . . . . . . . . . . . 85
Overview . . . . . . . . . . . . . . . . . . . . . . . . . . . . . . . . . . . . . . . . . . . . 86
About Analysis of 2-Contributor Samples Where
1 contributor is Known . . . . . . . . . . . . . . . . . . . . . . . . . . . . . . 86
In This Chapter . . . . . . . . . . . . . . . . . . . . . . . . . . . . . . . . . . . . 86
Step 1: Assign Known Genotypes . . . . . . . . . . . . . . . . . . . . . . . . 86
Select Known Contributors . . . . . . . . . . . . . . . . . . . . . . . . . . . 86
Review Extraction Results. . . . . . . . . . . . . . . . . . . . . . . . . . . . 89
GeneMapper® ID-X Software Version 1.1 Getting Started Guide
v
Step 2: Calculate the Random Match Probability for 2-Contributor
Mixtures Extracted with a Known Contributor . . . . . . . . . . . . . . . 92
Step 3: Calculate the Likelihood Ratio for
2-Contributor Mixtures Extracted with a Known Contributor . . . 94
Chapter 7
Analyze Merged Results . . . . . . . . . . . . . . . . . . . . . . . 97
Overview . . . . . . . . . . . . . . . . . . . . . . . . . . . . . . . . . . . . . . . . . . . . 98
Combine Different Amplification Results. . . . . . . . . . . . . . . . . . . . 99
Step 1: Create a New Project and Add Samples . . . . . . . . . . . . . 99
Step 2: Import an Analysis Method. . . . . . . . . . . . . . . . . . . . . . . 100
Step 3: Analyze Samples . . . . . . . . . . . . . . . . . . . . . . . . . . . . . . 100
Step 4: Prepare for Mixture Analysis. . . . . . . . . . . . . . . . . . . . . . 103
Step 5: Segregate Samples and Review Profiles . . . . . . . . . . . . 104
Step 6: View Merged Results . . . . . . . . . . . . . . . . . . . . . . . . . . . 105
Step 7: Calculate and Analyze the Results . . . . . . . . . . . . . . . . . 106
Appendix A
Statistical Analysis and Algorithms . . . . . . . . . . . . . 111
Overview . . . . . . . . . . . . . . . . . . . . . . . . . . . . . . . . . . . . . . . . . . . 112
Statistical Approaches . . . . . . . . . . . . . . . . . . . . . . . . . . . . . . . . 113
Random Match Probability . . . . . . . . . . . . . . . . . . . . . . . . . . 113
Combined Probability of Inclusion/ Exclusion . . . . . . . . . . . 114
Likelihood Ratio . . . . . . . . . . . . . . . . . . . . . . . . . . . . . . . . . . 115
Bibliography. . . . . . . . . . . . . . . . . . . . . . . . . . . . . . . . 119
Index. . . . . . . . . . . . . . . . . . . . . . . . . . . . . . . . . . . . . . 121
vi
GeneMapper® ID-X Software Version 1.1 Getting Started Guide
Preface
How to Use This Guide
Purpose of This
Guide
The GeneMapper® ID-X Software Version 1.1 Getting Started Guide
explains how to perform mixture analysis using the
GeneMapper® ID-X Software Version 1.1. This guide functions as:
• An introduction to the mixture analysis features of
GeneMapper® ID-X Software Version 1.1.
• A tutorial, using example experimental data provided with the
GeneMapper® ID-X Software Version 1.1.
• A guide for your own experiments.
Audience
Assumptions
This guide is written for forensic analysts who perform AmpFlSTR®
kit data analysis using the GeneMapper® ID-X Software and who
routinely perform analysis of mixture data.
This guide assumes that you have:
• Installed GeneMapper® ID-X Software Version 1.1 as described
in the GeneMapper® ID-X Software Version 1.0/1.1 Installation
Guide.
• Used AmpFlSTR® amplification kit data for human
identification (HID) applications.
• Developed a working knowledge of the Microsoft® Windows®
XP operating system.
Text Conventions
This guide uses the following conventions:
• Bold text indicates user action. For example:
Type 0, then press Enter for each of the remaining fields.
• Italic text indicates new or important words and is also used for
emphasis. For example:
Before analyzing, always prepare fresh matrix.
GeneMapper® ID-X Software Version 1.1 Getting Started Guide
vii
Preface
How to Use This Guide
• A right arrow symbol () separates successive commands you
select from a drop-down or shortcut menu. For example:
Select FileOpenSpot Set.
Right-click the sample row, then select View Filter
View All Runs.
User Attention
Words
Two user attention words appear in Applied Biosystems user
documentation. Each word implies a particular level of observation
or action as described below:
Note: – Provides information that may be of interest or help but is
not critical to the use of the product.
IMPORTANT! – Provides information that is necessary for proper
instrument or software operation, accurate chemistry kit use, or safe
use of a chemical.
Examples of the user attention words appear below:
Note: Each registered user has his or her own set of preferences.
When you set these options, if affects only the user currently logged
in.
IMPORTANT! To verify your client connection to the database, you
need a valid user ID and password.
viii
GeneMapper® ID-X Software Version 1.1 Getting Started Guide
Preface
How to Obtain More Information
How to Obtain More Information
Related
Documentation
The following related documents are shipped with the system:
• GeneMapper® ID-X Software Version 1.1 Quick Reference
Guide – Provides a quick look at the new GeneMapper® ID-X
Software Mixture Analysis tool features and their use.
• GeneMapper® ID-X Software Version 1.0/1.1 Installation
Guide – Replaces the version 1.0 Installation Guide and
provides instructions for installing the GeneMapper® ID-X
Software v1.0 or v1.1 as a full installation, a client-only
installation, or a co-installation.
• GeneMapper® ID-X Software Version 1.0 Getting Started
Guide – Provides a workflow and tutorial that guides the user
through the new ID-X features.
• GeneMapper® ID-X Software Version 1.0 Administrator’s
Guide – Provides procedures for creating user accounts, user
groups, and security groups; configuring the audit trail and
E-signature tools; and maintaining version 1.0 of the
GeneMapper® ID-X Software.
• GeneMapper® ID-X Software Version 1.0 Quick Reference
Guide – Provides abbreviated procedures for analyzing,
viewing, and interpreting data using GeneMapper® ID-X
Software.
• GeneMapper® ID-X Software Version 1.0 Reference Guide –
Describes peak detection, sizing, and genotyping algorithms,
and the GeneMapper® ID-X Software quality value system.
• GeneMapper® ID-X Software Help – Contains contextsensitive help for all screens and procedures and background
information needed to use the software.
GeneMapper® ID-X Software Version 1.1 Getting Started Guide
ix
Preface
How to Obtain More Information
Portable document format (PDF) versions of this guide and the other
documents listed above are also available on the GeneMapper® ID-X
Software Version 1.1 Documentation CD.
Note: To open the user documentation included on the
GeneMapper® ID-X Software Version 1.1 Documentation CD, use
the Adobe® Acrobat® Reader® software available from
www.adobe.com.
Note: For additional documentation, see “How to Obtain Support”
on page xi.
Obtaining
Information from
the Help System
The GeneMapper® ID-X Software has a Help system that describes
how to use each feature of the user interface. Access the Help system
by doing one of the following:
• Click
in the toolbar of the Project window
• Select HelpContents and Index
• Press F1
You can use the Help system to find topics of interest by:
• Reviewing the table of contents
• Searching for a specific topic
• Searching an alphabetized index
You can also access PDF versions of all documents in the
GeneMapper® ID-X Software document set from the Help system.
Send Us Your
Comments
Applied Biosystems welcomes your comments and suggestions for
improving its user documents. You can e-mail your comments to:
[email protected]
IMPORTANT! The e-mail address above is only for submitting
comments and suggestions relating to documentation. To order
documents, download PDF files, or for help with a technical
question, go to http://www.appliedbiosystems.com, then click the
link for Support. (See “How to Obtain Support” on page xi).
x
GeneMapper® ID-X Software Version 1.1 Getting Started Guide
Preface
How to Obtain Support
How to Obtain Support
For HID support, you can send an e-mail to
[email protected] or call 888-821-4443
option 1.
For HID support outside North America, contact your local support
office.
For the latest services and support information for all locations, go to
http://www.appliedbiosystems.com, then click the link for
Support.
At the Support page, you can:
• Access worldwide telephone and fax numbers to contact
Applied Biosystems Technical Support and Sales facilities
• Search through frequently asked questions (FAQs)
• Submit a question directly to Technical Support
• Order Applied Biosystems user documents, MSDSs,
certificates of analysis, and other related documents
• Download PDF documents
• Obtain information about customer training
• Download software updates and patches
GeneMapper® ID-X Software Version 1.1 Getting Started Guide
xi
Preface
How to Obtain Support
xii
GeneMapper® ID-X Software Version 1.1 Getting Started Guide
Chapter 1
Getting Started
Chapter 1
Getting Started
This chapter covers:
■ What’s New in the GeneMapper® ID-X Software: The Mixture
Analysis Tool . . . . . . . . . . . . . . . . . . . . . . . . . . . . . . . . . . . . . . 2
■ GeneMapper® ID-X Software Mixture Analysis Workflows . . 4
Chapter 2
Understanding the
Software
■ GeneMapper® ID-X Software Mixture Analysis Workflows . . 4
■ Using this Guide for Mixture Analysis. . . . . . . . . . . . . . . . . . . 6
Chapter 3
Prepare for Mixture
Analysis
Chapter 4
Segregate Samples
Chapter 5
Analyze 2-Contributor
Mixtures with Two
Unknowns
Chapter 6
Analyze 2-Contributor
Mixtures with One Known
Contributor
Chapter 7
Analyze Merged Results
GeneMapper® ID-X Software Version 1.1 Getting Started Guide
1
Chapter 1 Getting Started
What’s New in the GeneMapper® ID-X Software: The Mixture Analysis Tool
What’s New in the GeneMapper® ID-X Software:
The Mixture Analysis Tool
GeneMapper® ID-X Software is an automated genotyping software
solution for all human identification (HID) data analysis needs,
including forensic casework, databasing, and paternity testing.
GeneMapper® ID-X Software v1.1 contains a new Mixture Analysis
Tool designed to:
• Help the forensic analyst interpret DNA mixtures.
• Evaluate autosomal DNA mixtures and 1-contributor (singlesource) samples (Y-STR data cannot be evaluated using the
tool).
• Save the mixture analysis results to the GeneMapper® ID-X
Software project.
Note: The Mixture Analysis Tool supplements, but does not
replace, mixture interpretation by an experienced analyst.
The Mixture Analysis Tool is accessible from the Tools menu in a
GeneMapper® ID-X Software project. For all samples in a project,
the tool performs the following functions:
• Identifies samples that are eligible for Mixture Analysis.
Samples are assessed according to sample type, analysis status
and allele label status.
Note: Only analyzed samples with green or yellow sizing
quality (SQ) flags and no off ladder (OL)-only allele labels are
eligible for mixture analysis. Unanalyzed samples, controls,
allelic ladders and samples that fail sizing or have no allele
labels are not eligble.
• Categorizes and segregates eligible samples by the minimum
number of contributors contained in each sample (1, 2, or 3 or
more contributors).
2
GeneMapper® ID-X Software Version 1.1 Getting Started Guide
Chapter 1 Getting Started
What’s New in the GeneMapper® ID-X Software: The Mixture Analysis Tool
• Extracts and separates contributor profiles into individual major
and minor genotype combinations for all markers present. (2
contributors only).
• Filters known profiles from selected sample profiles (2
contributors only).
• Calculates statistics using population databases stored in the
Mixture Analysis Manager.
• Displays a ranked set of possible genotype combinations to
facilitate interpretation.
Refer to Chapter 2, Understanding the Software, for an overview of
the software functions and to learn how to access the example data
files for use with the Mixture Analysis Tool tutorial.
For more detailed information, refer to Appendix A, “Statistical
Analysis and Algorithms,” and to the GeneMapper® ID-X Software
Help.
GeneMapper® ID-X Software Version 1.1 Getting Started Guide
3
Chapter 1 Getting Started
GeneMapper® ID-X Software Mixture Analysis Workflows
GeneMapper® ID-X Software Mixture Analysis
Workflows
The GeneMapper® ID-X Software flowchart summarizes the steps
for performing a typical data analysis workflow using the
GeneMapper® ID-X Software. To the left are the steps the user
performs when analyzing samples and interpreting results. To the
right are the software operations that occur automatically during
analysis. The Mixture Analysis flowchart that follows summarizes
the steps for performing mixture analysis using the
GeneMapper® ID-X Software.
GeneMapper® ID-X Software Workflow
Set up the software (one time):
1. Create an analysis method.
2. Set Project Options.
During analysis, the software
performs:
Analysis
requirements check
Create a project:
1. Add samples.
2. Apply analysis settings.
3. Start analysis.
Peak detection and
sizing
Review analysis workflow summaries:
• (Optional) Analysis Requirements Summary.
• (Optional) Allelic Ladder Analysis Summary.
• Analysis Summary.
Allelic ladder quality
assessment
Review and edit required samples. ‡
(Optional) ‡Perform secondary analysis §:
• Use the profile comparison tool.
• Export known genotypes for use in mixture
analysis.
• Use the Mixture Analysis tool (next pg).
(Optional) Report results:
1. Generate a custom report.
2. Export reports and tables.
3. Print.
‡
§
Genotyping
Sample quality
assessment
Analysis summary
generation
Based on your lab protocol.
Cannot be used for samples containing alleles with off-ladder (OL) only labels.
4
GeneMapper® ID-X Software Version 1.1 Getting Started Guide
Chapter 1 Getting Started
GeneMapper® ID-X Software Mixture Analysis Workflows
GeneMapper® ID-X Mixture Analysis Workflow
Prepare for mixture analysis:
1. (Optional) Open the GeneMapper ID-X project containing samples for mixture
analysis.
2. Select Mixture Analysis from the Tools menu.
3. (Optional) Create mixture analysis methods.
4. (Optional) Import population databases to use for statistical calculations.
5. Select samples and mixture analysis methods.
Software segregates .eligible samples
1 contributor
2 contributors
Select analysis
options for
statistical
calculations
(per marker).
View previously
saved mixture
analysis results.
≥ 3 contributors
Begin new analysis:
1. (Optional) Import known genotypes.
2. Extract contributors.
Software identifies the most likely genotype
combinations for each contributor profile
Review analysis results (per sample):
1.
2.
3.
4.
Review genotype combinations and (optional) known matches.
Display plots and view peak data.
Select genotype combinations for statistical calculations.
Select Sample Review Complete.
Software identifies samples with the
same sample name and automatically
merges marker data (when possible)
(Optional) Merge sample analysis results (≥1 panel):
1. Select one panel per marker.
2. Review merged marker data for statistical calculations.
Calculate statistics:
Select population database(s).
Select reference(s) and hypotheses.
1 and 2 contributors
Review RMP statistics.
2 and ≥ 3 contributors
Review CPI/CPE statistics.
1 and 2 contributors
Review LR statistics.
(Optional) Export results, then print.
GeneMapper® ID-X Software Version 1.1 Getting Started Guide
5
Chapter 1 Getting Started
Using this Guide for Mixture Analysis
Using this Guide for Mixture Analysis
Overview
This guide is designed to familiarize you with the key features and
functions of the GeneMapper® ID-X Mixture Analysis Tool and to
take you through an example mixture analysis workflow. The
workflow is presented in a tutorial format starting in Chapter 3,
“Prepare for Mixture Analysis.”
The tutorial uses the example data provided with the Mixture
Analysis Tool. Refer to Chapter 2, “Understanding the Software,” for
information on how to access the example data. Once you complete
the tutorial, you will understand how the Mixture Analysis Tool
works, and you will be able to create your own settings and evaluate
your own mixture and single-source data.
IMPORTANT! How you use the Mixture Analysis Tool in your
laboratory and the settings you create depend on the mixture analysis
and interpretation guidelines established by your internal validation
process.
.
Chapter
Description
Chapter 2, Understanding the
Software
•
•
•
•
Mixture analysis methods.
Sample segregation and statistical calculations.
Population databases.
Example data
Chapter 3, Prepare for Mixture
Analysis
1. Create a GeneMapper® ID-X Software project, add
samples, and select table settings.
2. Import an analysis method.
3. Analyze data using appropriate analysis settings.
4. Review the analysis results (Analysis Requirements
Summary, Analysis Summary).
5. Export and view a known genotype for later use.
6
GeneMapper® ID-X Software Version 1.1 Getting Started Guide
Chapter 1 Getting Started
Using this Guide for Mixture Analysis
Chapter
Chapter 4, Segregate Samples
Description
1. Launch the Mixture Analysis Tool.
2. Import a population database.
3. Create a new mixture analysis method.
4. Segregate the samples into one of the three classification
groups.
Chapter 5, Analyze 2-Contributor
Mixtures with Two Unknowns
1. Extract individual genotypes of the two possible
contributors to a two-person mixture where both
contributors are unknown.
2. Use the GeneMapper® ID-X Mixture Analysis Quality Value
system to review the results of the extraction .
3. Determine which genotype combinations to include in the
statistical calculations.
4. Calculate Random Match Probabilities (RMP) for each
individual contributor.
5. Calculate Combined Probability of Inclusion/Exclusion
(CPI/CPE) for the mixed sample.
6. Review the results of the RMP and CPI/CPE calculations.
7. Calculate and review Likelihood Ratio (LR) results.
Chapter 6, Analyze 2-Contributor
Mixtures with One Known
Contributor
1. Assign known genotypes.
2. Extract individual genotypes of the two possible
contributors to a two-person mixture where 1 contributor
is known.
3. Determine which genotype combinations to include in the
statistical calculations.
4. Calculate Random Match Probabilities (RMP) for each
individual contributor.
5. Calculate and review Likelihood Ratio (LR) results.
Chapter 7, Analyze Merged Results
1. Create a project containing the same sample analyzed
with both the AmpFlSTR® Profiler Plus® and COfiler® kits.
2. Add samples to the project.
3. Analyze the samples.
4. Prepare for mixture analysis.
5. Segregate and review individual profiles.
6. Merge the data to create a composite profile using the 13
genetic markers detectable from both kits.
7. Calculate statistics and review results from replicate
amplifications of the same sample.
GeneMapper® ID-X Software Version 1.1 Getting Started Guide
7
Chapter 1 Getting Started
Using this Guide for Mixture Analysis
IMPORTANT! Some steps performed in this Getting Started Guide
are meant only to demonstrate the use of certain features in the
GeneMapper® ID-X Software v1.1 and may not be a part of your
routine analysis workflow. Refer to your own lab procedures when
using the GeneMapper® ID-X Software for forensic analysis.
For More
Information
This guide contains basic procedures. It does not describe all the
features and parameters in the GeneMapper® ID-X Software v1.1.
For detailed information on topics presented in this guide, see the
GeneMapper® ID-X Software Help.
Note: Before using any of the procedures in this guide, you must
have successfully installed and registered the GeneMapper® ID-X
Software v1.1. For additional information, see the
GeneMapper® ID-X Software v1.0/1.1 Installation Guide.
Proceed to Chapter 2, “Understanding the Software,” for an overview
of the software functions and to learn how to access the example data
files for use with the Mixture Analysis Tool tutorial.
8
GeneMapper® ID-X Software Version 1.1 Getting Started Guide
Chapter 1 Getting Started
Glossary of Terms
Glossary of Terms
Term
ADBI (Above Detection, Below
Interpretation)
Definition
A column in the Mixture Analysis Results Viewer - Genotype
Combinations table.
Also, a quality flag that indicates whether any allele peak height
within a marker genotype combination falls above the minimum
peak amplitude threshold set in the GeneMapper® ID-X
Software, and above or below the Mixture Interpretation
Threshold (MIT) set in the mixture analysis method.
Allele Frequency
The relative occurrence of a particular allele in a given
population.
In the Mixture Analysis tool, the allele frequencies associated
with an individual population database stored in the Mixture
Analysis Manager are used to calculate the genotype
frequencies for a particular DNA profile.
Note: Each marker within a population is associated with a
sample size (n) used to determine the minimum allele
frequency (calculated as 5/2n). The minimum allele frequency is
automatically assigned to any allele in each marker when an
allele frequency is either not observed or below the calculated
minimum allele frequency (designated by *).
C1 (Major)
The DNA profile within a 2-contributor mixture sample
representing the greater proportion of DNA corresponding to
greater peak heights at each marker within the sample mixture.
In general, for mixtures of 1:3 or higher ratios, the allele peak
heights from the major contributor are clearly higher than the
allele peak heights from the minor contributor. In situations
where mixtures approaching 1:1 are analyzed, the major and
minor contributors may become indistinguishable.
C2 (Minor)
In a 2-contributor mixture sample, the DNA profile representing
the minority proportion of DNA corresponding to lower peak
heights at each marker within the sample mixture.
In general, for mixtures of 1:3 or higher ratios, the allele peak
heights from the minor contributor are clearly lower than the
allele peak heights from the major contributor, and in some
cases, alleles or markers may drop out. In situations where
mixtures approaching 1:1 are analyzed, the major and minor
contributors may become indistinguishable.
GeneMapper® ID-X Software Version 1.1 Getting Started Guide
9
Chapter 1 Getting Started
Glossary of Terms
Term
Combined Frequency
Definition
The sum of all possible genotype frequencies at a given marker
when multiple possible genotypes exist.
In the Mixture Analysis Results Viewer - RMP Statistics Details
table, the column showing the combined genotype frequency
for a given marker.
Contributor
An individual whose DNA profile is present in a mixture sample.
For 2-person mixture samples in the Mixture Analysis tool,
contributor 1 (major contributor) = C1 (Major), and contributor 2
(minor contributor) = C2 (Minor).
CPE (Combined Probability of
Exclusion)
The probability that a random person would be excluded as a
possible contributor to the observed DNA mixture.
Note: A CPE may be calculated in instances involving 2 or
more contributors to a mixture. This calculation is not available
for single-source samples.
CPI (Combined Probability of
Inclusion)
The probability that a random person would be included as a
possible contributor to the observed DNA mixture.
Note: A CPI may be calculated in instances involving 2 or
more contributors to a mixture. This calculation is not available
for single-source samples.
Extraction
The process of separating a 2-person mixture sample into
individual contributor profiles and identifying the most likely
genotype combinations for each contributor profile.
F Allele
An allele designation used to indicate the potential for allelic
dropout. In the Mixture Analysis tool, an F allele is included in a
genotype combination if detected peaks are sufficiently low
that a potential heterozygous partner to one of the detected
peaks could exist below the Mixture Interpretation Threshold
(MIT) within the constraints of the Peak Height Ratio (PHR)
settings.
Filtering
The process of identifying eligible samples in the
GeneMapper® ID-X Software project to prevent ineligible
samples from being imported into the Mixture Analysis tool.
Genotype Combination
A pair of genotypes that could represent the two individual
contributors to a 2-person mixture sample.
Genotype Frequency
A column in the Mixture Analysis Results Viewer - RMP
Statistics Details table.
Also, the relative occurrence of a particular genotype in a given
population.
10
GeneMapper® ID-X Software Version 1.1 Getting Started Guide
Chapter 1 Getting Started
Glossary of Terms
Term
Definition
Genotype Profile
Allele designations for all markers of a single-source sample or
an individual contributor to a mixture sample.
Heterozygote
Individual with two different alleles at a particular marker
(locus).
Homozygote
Individual with one allele at a particular marker (locus).
Hypothesis
See Likelihood Ratio.
Inconclusive
A designation given to a marker for which the genotype cannot
be determined with certainty.
In the Mixture Analysis tool, inconclusive markers are not
included in statistical analysis.
IQ (Inclusion Quality)
A column in the Mixture Analysis Results Viewer - Genotype
Combinations tables.
Also, a composite quality flag that indicates the Peak Height
Ratio (PHR) Status and the Residual Status for genotype
combinations.
Known Filtering
The process whereby a known genotype is used to reduce
(filter) the list of genotype combinations extracted from a 2person mixture sample to display only those combinations that
also match the known genotype profile.
In the Mixture Analysis tool, the genotype combinations of the
contributor with the best match to the known contributor are
displayed in the Genotype Combinations tables of the Mixture
Analysis Results Viewer. Where a known genotype is used
during the extraction process, only the Selected Genotype
Combinations associated with the unknown contributor to the
mixture sample are included in statistical analysis.
Known Genotype Profile
Genotype of a reference sample used for comparison to a
mixture sample where a known genotype is inferred (for
example, an intimate body swab sample).
In the Mixture Analysis tool, the known genotype profile is
matched to one of the contributor profiles extracted from a
2-person mixture sample, and is used to filter the genotype
combinations tables to display only those combinations that
contain the known contributor.
GeneMapper® ID-X Software Version 1.1 Getting Started Guide
11
Chapter 1 Getting Started
Glossary of Terms
Term
Known Match
Definition
An exact match of the known genotype to one of the
contributors extracted from a 2-person mixture sample.
In the Mixture Analysis tool, statistical analysis can only be
performed on the unknown contributor when there is a
complete (100%) match of the known genotype to a single
contributor, either C1 (Major) or C2 (Minor), as displayed in the
Selected Genotype Combinations table of the Mixture Analysis
Results Viewer.
Known Matching
The process whereby a known genotype profile is compared to
both of the contributor profiles extracted from a 2-person
mixture sample to determine which contributor displays the
best match to the known.
LR (Likelihood Ratio)
A ratio of the probabilities of two hypotheses that offer different
explanations for the existence of the DNA profile evidence (e.g.
possible contributors to the mixture sample).
Note: In the Mixture Analysis tool, LR statistical calculations
are only performed on 1-contributor and 2-contributor
samples.
Major Contributor
See C1 (Major)
Marker Inclusion Frequency
In the Mixture Analysis Results Viewer - CPI/CPE Statistics
Details table, the column showing the probability that a random
person would be included as a possible contributor to the
observed DNA mixture at a given marker.
Minimum Allele Frequency
Value used in statistical analysis of DNA profiles representing
either alleles not present in the population database or alleles
that have an observed allele frequency below the calculated
minimum allele frequency.
Calculated using the following formula:
Minimum allele frequency = 5/2n
where n = number of samples for each marker in the ethnic
population.
Minor Contributor
See C2 (Minor).
Missing Markers
Markers that are present in the mixture sample, but are not
represented in the Selected Genotype Combinations table or
the known genotype profile.
MIT (Mixture Interpretation
Threshold)
A user-defined setting in the mixture analysis method.
12
Also, the minimum peak height threshold used for mixture
analysis.
GeneMapper® ID-X Software Version 1.1 Getting Started Guide
Chapter 1 Getting Started
Glossary of Terms
Term
Definition
Mixture
Sample containing DNA from two or more contributors.
Mixture Analysis
The process of identifying the minimum number of possible
contributors to a mixture sample from data produced using a
single AmpFlSTR® panel, extracting the potential genotypes of
the contributors (2-person mixtures only), and performing
statistical analysis.
Mixture Analysis (Merged Results)
The process of identifying the minimum number of possible
contributors to a mixture sample from data produced using one
or more AmpFlSTR® panels, extracting the potential genotypes
of the contributors (2-person mixtures only), and performing
statistical analysis on a composite profile generated from
replicate results from the same sample or from results
generated from the same sample using different AmpFlSTR®
kits.
Mixture Analysis Method
A collection of user-defined settings that determine the sample
segregation and extraction thresholds used by the Mixture
Analysis tool to analyze potential mixture samples transferred
from a GeneMapper® ID-X Software project.
Mixture Analysis Parameters
The heterozygote Peak Height Ratio (PHR) settings and
Mixture Interpretation Threshold (MIT) as defined in the mixture
analysis method, and used to perform sample segregation and
extraction on selected mixture samples within the Mixture
Analysis tool.
Mixture Analysis Project
The mixture analysis results for a group of samples transferred
into the Mixture Analysis tool from a GeneMapper® ID-X
Software project.
Mixture Analysis Tool
Part of the GeneMapper® ID-X Software containing specific
functionality to assist in the analysis, interpretation and
statistical analysis of DNA mixtures.
Mx (Mixture Proportion)
A measure of the relative proportion of the minor contributor in
a 2-person mixture sample, as described by Gill, et al., 1998
(see Bibliography).
GeneMapper® ID-X Software Version 1.1 Getting Started Guide
13
Chapter 1 Getting Started
Glossary of Terms
Term
PHR Status
Definition
A column in the Mixture Analysis Results Viewer - Genotype
Combinations tables.
Also, a mixture analysis quality flag that indicates whether the
calculated Peak Height Ratio (PHR) for a given genotype
combination falls above or below the Peak Height Ratio (PHR)
thresholds set per peak height range in the mixture analysis
method.
Note: The PHR thresholds defined in a mixture analysis
method and applied to samples in the Mixture Analysis tool
differ from the minimum peak height ratio threshold defined in
an analysis method and applied to samples in a
GeneMapper® ID-X Software project.
Population Database
A collection of the alleles and allele frequencies obtained from
a random group of unrelated individuals from one or more
ethnic groups.
In the Mixture Analysis tool, these allele frequencies are used
to calculate genotype frequencies for a DNA profile.
Note: Each marker within a population is associated with a
sample size (n) used to determine the minimum allele
frequency (calculated as 5/2n). The minimum allele frequency is
automatically assigned to any allele in each marker when an
allele frequency is either not observed or below the calculated
minimum allele frequency (designated by *).
Profile (Sample)
The genotype (allele designations) of a sample.
In the Mixture Analysis tool, you can import known profiles into
a mixture analysis project to compare against each of the
contributor profiles extracted from a 2-person mixture sample
as part of mixture interpretation.
Profile Frequency
An entry in the Mixture Analysis Results Viewer - RMP
Statistics Summary section.
The estimated frequency of occurrence of a particular profile
based on values from a given population database.
Reference Profile
In the Profile Comparison tool, the profile against which
another profile is compared to determine the % Match. The
software performs pairwise comparisons to determine the
direction of comparison that yields the higher % Match, then
reports only the direction of comparison with the higher
% Match.
In the Mixture Analysis tool, one or two reference profiles
(known genotypes) can be assigned to a mixture sample when
calculating Likelihood Ratio (LR) statistics.
14
GeneMapper® ID-X Software Version 1.1 Getting Started Guide
Chapter 1 Getting Started
Glossary of Terms
Term
Definition
Residual
A measure of how close the observed contributor proportions
for a particular genotype combination are to the expected
contributor proportions for a particular 2-person mixture
sample, as described by Gill, et al., 1998 (see Bibliography).
Residual Status
A column in the Mixture Analysis Results Viewer - Genotype
Combinations tables.
It indicates whether the calculated residual value for a
genotype combination falls above or below the residual
threshold of 0.04 supplied with the Mixture Analysis tool.
Residual Threshold
As defined in the Mixture Analysis tool, the value (0.04) above
which genotype combinations are not automatically
considered as possible contributors to the mixture sample.
Note: The residual threshold, set internally within the Mixture
Analysis tool based on extensive testing of DNA mixtures,
cannot be adjusted by the user.
RMP (Random Match Probability)
The probability that an individual chosen at random from the
population has a DNA profile that matches the profile being
compared.
In the Mixture Analysis tool, RMP statistical calculations are
only performed on 1-contributor and 2-contributor samples.
Sample Segregation
The process by which samples transferred into the Mixture
Analysis tool from a GeneMapper® ID-X Software project are
identified as containing a minimum of 1, 2, or 3 or more
contributors and separated into the appropriate mixture
analysis workflow for each contributor category.
Sample Selection
The process by which potential mixture samples transferred
into the Mixture Analysis tool from a GeneMapper® ID-X
Software project are selected and mixture analysis methods
applied in order to proceed with sample segregation.
Selected Genotype Combinations
Table
Table containing genotype combinations that are included in
statistical analysis. Genotype combinations are assigned to
this table automatically if they are assigned a passing ( )
Inclusion Quality (IQ) during extraction of contributors.
GeneMapper® ID-X Software Version 1.1 Getting Started Guide
15
Chapter 1 Getting Started
Glossary of Terms
Term
Single-Source Sample
Definition
In the Mixture Analysis tool, samples originating from only 1
contributor. Defined as samples that contain:
• No markers that fail the peak height ratio (PHR) thresholds
specified in the mixture analysis method
and
• Only one marker with three called alleles
Random Match Probability and Likelihood Ratio calculations
can be performed on single-source samples following sample
segregation.
Statistical Analysis
The process of calculating statistics (Random Match
Probability, Combined Probability of Inclusion, Combined
Probability of Exclusion, Likelihood Ratio) for a DNA profile.
Note: The Mixture Analysis tool excludes the Amelogenin
(AMEL) marker from all statistical analyses.
Statistical Analysis Options
(1 Contributor)
Column in the Mixture Analysis Results Viewer: Minimum
Number of Contributors = 11 Contributor Results tab.
Displays the genotype frequency calculation options available
for use in Random Match Probability (RMP) statistical analysis
of 1-contributor samples.
Note: The Mixture Analysis tool excludes the Amelogenin
(AMEL) marker from all statistical analyses (RMP, CPI/CPE, LR).
The following marker-specific genotype frequency calculation
options are available, based on allele number:
• One allele: Use Alleles (Default), Use 2p, Inconclusive
• Two alleles: Use Alleles (Default), Inconclusive
• Three alleles: Min Genotype Freq (Default), Inconclusive
Where:
• Use Alleles = Calculate the genotype frequency from the
allele frequencies (use heterozygous equation [2pq] or
homozygous equation [p2 + p(1-p)θ])
• Use 2p = Calculate the genotype frequency from the allele
frequency assuming possible allelic drop-out (use
conservative frequency equation [2p])
• Inconclusive = Do not calculate a genotype frequency for
the marker (consider marker as uninformative)
• Min Genotype Freq = Calculate the genotype frequency
from the minimum genotype frequency for a tri-allelic
marker (use 3/n, where n = number of samples for each
marker in the ethnic population as specified in the selected
population database)
16
GeneMapper® ID-X Software Version 1.1 Getting Started Guide
Chapter 1 Getting Started
Glossary of Terms
Term
Theta
Definition
A correction factor applied to the homozygous genotype
frequency calculation that compensates for possible
population substructure that may lead to an underestimate of
the genotype frequency for the marker.
In the Mixture Analysis tool, a user-defined setting (Population
Database Selection dialog box) for each ethnic group within a
population database, designated by the symbol θ.
Unselected Genotype
Combinations Table
Contains genotype combinations that will not be included in
statistical analysis. Genotype combinations are assigned to
this table automatically if they were not assigned a passing
( ) Inclusion Quality (IQ) during extraction of contributors.
GeneMapper® ID-X Software Version 1.1 Getting Started Guide
17
Chapter 1 Getting Started
Glossary of Terms
18
GeneMapper® ID-X Software Version 1.1 Getting Started Guide
Chapter 2
Understanding the Software
This chapter covers:
Chapter 1
Getting Started
■ Overview. . . . . . . . . . . . . . . . . . . . . . . . . . . . . . . . . . . . . . . . . 20
■ Sample Segregation and Statistical Calculations . . . . . . . . . . 21
■ Population Databases . . . . . . . . . . . . . . . . . . . . . . . . . . . . . . . 22
Chapter 2
■ Example Data . . . . . . . . . . . . . . . . . . . . . . . . . . . . . . . . . . . . . 22
Understanding the
Software
Chapter 3
Prepare for Mixture
Analysis
Chapter 4
Segregate Samples
Chapter 5
Analyze 2-Contributor
Mixtures with Two
Unknowns
Chapter 6
Analyze 2-Contributor
Mixtures with One Known
Contributor
Chapter 7
Analyze Merged Results
GeneMapper® ID-X Software Version 1.1 Getting Started Guide
19
Chapter 2 Understanding the Software
Overview
Overview
About the
Software
In This Chapter
The software performs a number of functions that require setup by
the user. This chapter describes these functions.
In this chapter, you will learn how the software:
•
•
•
•
Uses mixture analysis methods.
Segregates samples and calculates statistics.
Uses population databases for statistical calculations.
Uses example data to demonstrate the functionality and features
of the Mixture Analysis Tool.
Mixture Analysis Methods
A mixture analysis method contains Peak Height Ratio and Mixture
Interpretation Threshold information. The software uses this
information to:
• Segregate samples according to their contributor categories (1,
2, or 3 or more contributors)
• Determine the most likely genotypes of the individual
contributors to a 2-person mixture during the extraction process.
You will learn how to create a mixture analysis method in Chapter 4,
Segregate Samples.
Note: Applied Biosystems recommends creating a set of mixture
analysis methods that corresponds to the interpretation criteria
developed by your laboratory based on internal validation studies.
Different mixture analysis parameters may be appropriate for data
generated using different AmpFlSTR® kits, instrument platforms, or
for particular sample types.
20
GeneMapper® ID-X Software Version 1.1 Getting Started Guide
Chapter 2 Understanding the Software
Sample Segregation and Statistical Calculations
Sample Segregation and Statistical Calculations
The software segregates samples on the basis of the minimum
number of contributors according to the following rules:
• 1 Contributor (single-source) - Samples that:
– Do not contain markers that fail the peak height ratio
thresholds specified in the mixture analysis method
and
– Contain a maximum of 1 marker with three called alleles
are categorized as originating from a single source.
• 2 Contributors - Samples that contain:
– 1 or more 2 peak markers failing peak height ratio thresholds
– 3 or more alleles at 2 or more markers with the maximum
number of alleles not exceeding 4
are categorized as originating from a minimum of
2 contributors.
• 3 or more Contributors - Samples that contain 1 or more
markers with more than 4 alleles are categorized as originating
from a minimum of 3 contributors.
The following table details the statistical options available for each of
the three categories of samples:
Random Match Probability
(RMP)
1 Contributor
(Single-source)
2 Contributors
X
X
Combined Probability of
Inclusion/Exclusion
(CPI/CPE)
Likelihood Ratio (LR)
X
X
3 or More
Contributors
X
X
For additional information, refer to Appendix A, “Statistical
Analysis and Algorithms,” and to the GeneMapper® ID-X Software
Help.
GeneMapper® ID-X Software Version 1.1 Getting Started Guide
21
Chapter 2 Understanding the Software
Population Databases
Population Databases
For the software to perform statistical calculations, it requires
population databases that contain the appropriate allele frequency
information. Three ready-to-use population databases are provided
by Applied Biosystems to use with the Mixture Analysis Tool. You
can import these databases and/or create and import custom
databases based on your own allele frequency data.
Refer to Chapter 4, Segregate Samples, for information on how to
import a ready-to-use population database.
To create a custom population database, refer to the GeneMapper®
ID-X Software Help.
Example Data
Overview
Example data (.fsa files) are installed with the GeneMapper® ID-X
Software v1.1 for use with the mixture analysis tutorial.
• SGM Plus® Kit example data are used to demonstrate features
of the Mixture Analysis Tool in Chapter 3 through Chapter 6.
• COfiler® and Profiler Plus® Kit example data are used to
demonstrate additional functionality of the Mixture Analysis
Tool in Chapter 7.
22
GeneMapper® ID-X Software Version 1.1 Getting Started Guide
Chapter 2 Understanding the Software
Example Data
How to Access
the Example Data
Files
To perform the exercises described in this guide, locate the example
data files provided, as shown below.
Install
Configuration
Client install
Full install
File Location
Mixture Analysis Sample Files (.fsa)
<drive>:\AppliedBiosystems\
GeneMapperID-X\Client\Example Data\
Mixture Analysis Samples
<drive>:\AppliedBiosystems\
GeneMapperID-X\Example Data\
Mixture Analysis Samples
Note: The drive varies depending on the installation of the
GeneMapper® ID-X Software. See the GeneMapper® ID-X Software
Version 1.0/1.1 Installation Guide for more information on
installation options.
GeneMapper® ID-X Software Version 1.1 Getting Started Guide
23
Chapter 2 Understanding the Software
Example Data
24
GeneMapper® ID-X Software Version 1.1 Getting Started Guide
Chapter 3
Prepare for Mixture Analysis
This chapter covers:
Chapter 1
Getting Started
■ Overview. . . . . . . . . . . . . . . . . . . . . . . . . . . . . . . . . . . . . . . . . 26
■ Step 1: Create a GeneMapper® ID-X Software Project . . . . . 27
■ Step 2: Import an Analysis Method . . . . . . . . . . . . . . . . . . . . 28
Chapter 2
■ Step 3: Analyze Data Using Appropriate Settings . . . . . . . . . 29
Understanding the
Software
■ Step 4: Review Analysis Results . . . . . . . . . . . . . . . . . . . . . . 31
■ Step 5: Export and View a Known Genotype Profile . . . . . . . 35
Chapter 3
Prepare for Mixture
Analysis
Chapter 4
Segregate Samples
Chapter 5
Analyze 2-Contributor
Mixtures with Two
Unknowns
Chapter 6
Analyze 2-Contributor
Mixtures with One Known
Contributor
Chapter 7
Analyze Merged Results
GeneMapper® ID-X Software Version 1.1 Getting Started Guide
25
Chapter 3 Prepare for Mixture Analysis
Overview
Overview
This chapter provides a tutorial that proceeds through the steps to
prepare samples for mixture analysis within a project . You will
create a GeneMapper® ID-X Software project as described in the
mixture analysis workflow, and perform data analysis and allele
editing before selecting and launching the Mixture Analysis Tool
from the Tools menu (Chapter 4). You will also export a known
genotype profile during this process.
Mixture Analysis
Preparation
To prepare the data for mixture analysis, analyze and edit the data in
a GeneMapper® ID-X Software project, then process the data using
the Mixture Analysis Tool.
IMPORTANT! The settings used for this Getting Started Guide are
for demonstration purposes only and require customization and
optimization for data generated in your laboratory.
Note: Before using the procedures in this chapter you must
successfully install and register GeneMapper® ID-X Software v1.1.
For additional information, see the GeneMapper® ID-X Software
v1.0/1.1 Installation Guide.
In This Chapter
In this chapter, you will learn how to:
• Create a GeneMapper® ID-X Software project, add samples,
and select table settings.
• Import an analysis method.
• Analyze data using appropriate analysis settings.
• Review the analysis results (Analysis Requirements Summary,
Analysis Summary).
• Export and view a known genotype profile. This profile will be
used later in the analysis of mixed samples in which
1 contributor is known (for example, from an intimate body
swab).
26
GeneMapper® ID-X Software Version 1.1 Getting Started Guide
Chapter 3 Prepare for Mixture Analysis
Step 1: Create a GeneMapper® ID-X Software Project
Step 1: Create a GeneMapper® ID-X Software
Project
Open and Create
a New
GeneMapper®
ID-X Project
If a project is already open in the Project window, go to FileNew
Project or click
(New Project) to open a blank Project window.
Note: If you have a previous project open you may be prompted to
save changes. Click Yes to save the changes.
Add Samples to
the Project
1. In the Project window, Select Edit Add Samples to Project
(Ctrl-K).
2. Navigate to <drive>:\AppliedBiosystems\GeneMapper ID-X\
Example Data\Mixture Analysis and select MA_SGM.
3. Click Add to List in the lower left-hand side of the window to
add the sample files to the project, then click Add to close the
dialog box.
From the Table Setting drop down list, select 31XX Data
Analysis.
GeneMapper® ID-X Software Version 1.1 Getting Started Guide
27
Chapter 3 Prepare for Mixture Analysis
Step 2: Import an Analysis Method
Step 2: Import an Analysis Method
Analysis methods define the peak detection, sizing, genotyping, and
quality assessment parameters applied during analysis of sample
data. In this step, you will import the analysis method configured
specifically for use with the GeneMapper® ID-X Software example
data provided and with the procedures outlined in this guide.
IMPORTANT! The values used in this guide may not be suitable for
analyzing data generated in your laboratory. You must optimize and
validate these values as part of an internal validation study.
In the GeneMapper ID-X Project window:
1. Select ToolsGeneMapper® ID-X Manager.
2. In the Analysis Methods tab, select Import.
3. Navigate to <drive>:\AppliedBiosystems\GeneMapper ID-X\
Example Data\Mixture Analysis\GSG Analysis Method and
select HID_Full Range_75.
4. Click OK in the Choose Security Group dialog box to confirm
the GeneMapper ID-X Security Group, then click Done.
28
GeneMapper® ID-X Software Version 1.1 Getting Started Guide
Chapter 3 Prepare for Mixture Analysis
Step 3: Analyze Data Using Appropriate Settings
Step 3: Analyze Data Using Appropriate Settings
1. Define each sample from left to right, as shown in the Samples
table below:
a. Assign the Sample Type to each sample.
b. Select the Analysis method (HID_Full Range_75).
c. Select the Panel (SGM_Plus_v1X).
d. Select the Size Standard ((CE_F_HID_GS500 (75-450)).
To make your selections, click in each cell and select from the
drop-down list. To change an entire column, click in the first
cell, make your selection, then click in the column header and
press Ctrl-D to populate (fill down) the column.
Note: The green (
) arrow in the status column indicates that
these samples have never been analyzed. Unanalyzed samples
will not be imported into the Mixture Analysis tool.
Note: When you make changes to the Panel column, a separate
window opens with a folder displayed instead of a drop-down
list. Open the folder and select the appropriate panel.
GeneMapper® ID-X Software Version 1.1 Getting Started Guide
29
Chapter 3 Prepare for Mixture Analysis
Step 3: Analyze Data Using Appropriate Settings
2. Click the Analyze icon on the toolbar.
The Save Project dialog box is displayed.
3. Fill in the Save Project dialog box as shown below and click
OK.
The Analysis Summary dialog box appears after analysis is
completed.
.
30
GeneMapper® ID-X Software Version 1.1 Getting Started Guide
Chapter 3 Prepare for Mixture Analysis
Step 4: Review Analysis Results
Step 4: Review Analysis Results
Review Analysis
Summaries
The Analysis Summary dialog box appears as shown below.
Note: If you did not set up the Samples tab in the GeneMapper
ID-X Project window correctly, the Analysis Requirements
Summary may display first. Review the reason(s) why the
analysis requirements are not met and correct them to proceed
with the analysis. For additional information, refer to the
GeneMapper® ID-X Software Help.
GeneMapper® ID-X Software Version 1.1 Getting Started Guide
31
Chapter 3 Prepare for Mixture Analysis
Step 4: Review Analysis Results
To review the data:
1. In the Analysis Summary under Sample Quality per project,
select the 10 from the Total # of Samples column (shown above)
to display a filtered Samples Table that allows access to all the
samples for editing and review.
Note: The MIX PQV flag is yellow for many of the samples
indicating that GeneMapper® ID-X Software has identified the
samples as potential mixtures.
2. In the Samples (filtered) tab, select sample H4_H28_0_1 as
shown previously, and click the display plots icon
in the
tool bar.
32
GeneMapper® ID-X Software Version 1.1 Getting Started Guide
Chapter 3 Prepare for Mixture Analysis
Step 4: Review Analysis Results
3. Select the Data Interpretation Plot Setting. Note the spike in
the D3S1358 analysis range.
4. Highlight the Spike label and right-click to view the Peak Raw
Data, then confirm that the peak is a spike.
Note: Peaks with magenta artifact labels such as Spike peaks
will not be interpreted by the Mixture Analysis Tool.
5. Close the Samples Plot.
6. Highlight all sample rows and click the Display Plots icon
in the tool bar.
Review and Save
Samples
1. Review all samples to ensure that no off ladder (OL) only calls
are present. Select the Traditional Genotype Plot Setting for
review.
Note: Samples containing OL-only allele calls cannot be
processed by the Mixture Analysis Tool.
GeneMapper® ID-X Software Version 1.1 Getting Started Guide
33
Chapter 3 Prepare for Mixture Analysis
Step 4: Review Analysis Results
Sample AA18 contains a true D3S1358 peak that is labeled as
an OL allele.
2. Select, then right click on the peak label to assign a custom
allele label to the peak. Label the peak as <11 as shown in the
following figure. Enter a reason for change when prompted.
3. Repeat the labeling of the off-ladder D3S1358 allele for sample
H4_H28_AA18_1_1_2.
4. When the review is complete, exit the Samples Plot.
34
GeneMapper® ID-X Software Version 1.1 Getting Started Guide
Chapter 3 Prepare for Mixture Analysis
Step 5: Export and View a Known Genotype Profile
Step 5: Export and View a Known Genotype Profile
Select Samples
for Viewing
1. In the Samples table, select the Known Sample Export Table
Setting.
The Samples table should now contain only the Sample File and
Sample Name columns, as shown next.
GeneMapper® ID-X Software Version 1.1 Getting Started Guide
35
Chapter 3 Prepare for Mixture Analysis
Step 5: Export and View a Known Genotype Profile
2. Select the Genotypes tab, which should now display only the
Sample File, Sample Name, Marker, Allele 1 and Allele 2
columns, as shown.
IMPORTANT! Be sure that no off-ladder (OL)-only allele labels
are present. OL alleles are not incorporated into known
filtering. Allele labels containing OL are acceptable if OL is
followed by another character (for example, OL < 6).
3. Select the Samples tab, select single-source sample
H4_H28_0_1, then click the display plots icon
in the
toolbar to display the Samples Plot.
36
GeneMapper® ID-X Software Version 1.1 Getting Started Guide
Chapter 3 Prepare for Mixture Analysis
Step 5: Export and View a Known Genotype Profile
4. Select the Data Interpretation Plot Setting to display the
Genotypes table together with the electropherogram.
5. Select File Export Table (Ctrl-E).
GeneMapper® ID-X Software Version 1.1 Getting Started Guide
37
Chapter 3 Prepare for Mixture Analysis
Step 5: Export and View a Known Genotype Profile
Export the Table
1. Select FileExport Table (Ctrl-E).
2. Select Export File As Tab-delimited text (.txt) file.
Note: You can export samples from the GeneMapper® ID-X
Software as tab-delimited text files (*.txt) or as comma-separated
values files (*.csv).
3. Name the file Known_H28.txt.
4. Choose Export destination <drive>:\AppliedBiosystems\
GeneMapperID-X\Mixture Analysis, then click Export.
Note: During the routine workflow, you may prefer to export
known genotypes to the run folder containing the sample file
associated with the known profile.
5. Navigate to <drive>:\AppliedBiosystems\GeneMapperID-X\
Mixture Analysis and open the exported file using Excel to
view the exported data shown below.
38
GeneMapper® ID-X Software Version 1.1 Getting Started Guide
Chapter 3 Prepare for Mixture Analysis
Step 5: Export and View a Known Genotype Profile
6. Return to the GeneMapper ID-X Project window, select the
Samples tab, and in the Samples table select-single source
sample H4_H28_1_0, then display the Samples Plot using the
display plots icon
in the toolbar.
7. Repeat “Select Samples for Viewing” step 4 on page 37 through
“Export the Table” step 5 to export this known sample as
Known_H4.txt.
The exported known samples will be used later during mixture
extraction and Likelihood Ratio calculations.
8. Close the Samples Plot.
GeneMapper® ID-X Software Version 1.1 Getting Started Guide
39
Chapter 3 Prepare for Mixture Analysis
Step 5: Export and View a Known Genotype Profile
40
GeneMapper® ID-X Software Version 1.1 Getting Started Guide
Chapter 4
t
Segregate Samples
This chapter covers:
Chapter 1
Getting Started
■ Overview. . . . . . . . . . . . . . . . . . . . . . . . . . . . . . . . . . . . . . . . . 42
■ Step 1: Launch the Mixture Analysis Tool . . . . . . . . . . . . . . . 43
■ Step 2: Import a Population Database. . . . . . . . . . . . . . . . . . . 43
Chapter 2
■ Step 3: Create a New Mixture Analysis Method . . . . . . . . . . 45
Understanding the
Software
■ Step 4: Segregate the Samples . . . . . . . . . . . . . . . . . . . . . . . . 51
Chapter 3
Prepare for Mixture
Analysis
Chapter 4
Segregate Samples
Chapter 5
Analyze 2-Contributor
Mixtures with Two
Unknowns
Chapter 6
Analyze 2-Contributor
Mixtures with One Known
Contributor
Chapter 7
Analyze Merged Results
GeneMapper® ID-X Software Version 1.1 Getting Started Guide
41
Chapter 4 Segregate Samples
Overview
Overview
This chapter describes how to select and launch the Mixture Analysis
tool from the Tools menu, select a population database, select and
segregate samples, and define mixture analysis methods. You will
create a new mixture analysis method during this process.
About Sample
Segregation
Once you complete the preliminary preparation for Mixture Analysis
described in Chapter 3, “Prepare for Mixture Analysis,” you can
perform sample segregation. You will create a new mixture analysis
method in which you will define the peak-height ratio settings that
are applied to different peak height ranges and the Mixture
Interpretation Threshold. You can then proceed with sample
segregation using the mixture analysis method you have defined.
Note: Applied Biosystems recommends creating a set of mixture
analysis methods that correspond to the interpretation criteria
developed by your laboratory based on internal validation studies.
Different mixture analysis parameters may be appropriate for data
generated using different AmpFlSTR® kits, instrument platforms, or
for particular sample types.
In This Chapter
In this chapter, you will learn to:
•
•
•
•
42
Launch the Mixture Analysis Tool.
Import a population database.
Create a new mixture analysis method.
Segregate the samples into one of the three classification
groups: 1 contributor (single source), 2 contributors, or 3 or
more contributors.
GeneMapper® ID-X Software Version 1.1 Getting Started Guide
Chapter 4 Segregate Samples
Step 1: Launch the Mixture Analysis Tool
Step 1: Launch the Mixture Analysis Tool
1. Unless already open, launch the GeneMapper® ID-X Software
Version 1.1 (v1.1):
Navigate to <drive>:\AppliedBiosystems\GeneMapper ID-X\
Example Data\Mixture Analysis and select MA_SGM.
2. Select Tools Mixture Analysis Manager from the toolbar to
open the Mixture Analysis Manager.
Step 2: Import a Population Database
1. In the Mixture Analysis Manager, select the Population
Databases tab and click Import.
2. Navigate, if necessary, to <drive>:\AppliedBiosystems\
GeneMapperID-X\Mixture Analysis\Population Databases and
select ABIdentifilerPopulationDatabase.csv, then click
Import.
GeneMapper® ID-X Software Version 1.1 Getting Started Guide
43
Chapter 4 Segregate Samples
Step 2: Import a Population Database
3. Select Open to view the AB Identifiler Population Database.
This database is provided as a default with the GeneMapper®
ID-X Software v1.1.
The Open Population Database dialog box allows you to view
the number of samples comprising each database, the allele
frequency data, and the minimum allele frequency used for each
database.
44
GeneMapper® ID-X Software Version 1.1 Getting Started Guide
Chapter 4 Segregate Samples
Step 3: Create a New Mixture Analysis Method
Step 3: Create a New Mixture Analysis Method
Create a Mixture
Analysis Method
using the Mixture
Analysis Manager
1. In the Mixture Analysis Manager, select the Mixture Analysis
Methods tab, then click New to open the New Mixture Analysis
Method dialog box.
2. Review the existing parameters:
• Mixture Analysis Method Name
Note: The following symbols are not allowed in mixture
analysis method file names: \\ / : * ? < > \ | ".
• (Optional) Method Description
• Heterozygote PHR Settings
• Mixture Interpretation Threshold
IMPORTANT! The default entries in the Heterozygote Peak
Height Ratio (PHR) Settings table below are for demonstration
purposes only. Use an internal validation study to determine the
appropriate settings to use for your interpretation, then use the
following procedure to create new settings for your analysis. To
change existing PHR settings, refer to Editing Heterozygote
Peak Height Ratio Settings in the GeneMapper® ID-X Software
Help.
GeneMapper® ID-X Software Version 1.1 Getting Started Guide
45
Chapter 4 Segregate Samples
Step 3: Create a New Mixture Analysis Method
3. In the Mixture Analysis Method Name: field of the New
Mixture Analysis Method dialog box shown above, enter the
name MA Test Method.
4. In the Mixture Interpretation Threshold - Minimum Peak
Height (RFU) field, enter 150.
5. In the Heterozygote Peak Height Ratio (PHR) Settings area of
the dialog box, highlight all four rows as shown, then click
Delete to remove all of the default settings.
6. Click New to launch the Heterozygote PHR Settings dialog box,
then enter the following:
a. In the Minimum Peak Height (RFU) field, enter 150.
b. In the Maximum Peak Height (RFU) field, enter 300.
c. In the PHR Threshold (between 0 and 1) field, enter 0.54.
as shown in the next dialog box.
46
GeneMapper® ID-X Software Version 1.1 Getting Started Guide
Chapter 4 Segregate Samples
Step 3: Create a New Mixture Analysis Method
7. Click OK to save your changes and return to the New Mixture
Analysis Method dialog box.
8. Click New to create a second PHR threshold and perform the
following:
a. Verify the Minimum Peak Height value is 301.
Note: The default value for a new Minimum Peak Height
entry in the Heterozygote PHR settings table = the
Maximum Peak Height value for the previous row in the
table + 1.
b. In the Maximum Peak Height (RFU) field, enter 1000.
c. In the PHR Threshold (between 0 and 1) field, enter 0.60.
9. Click OK to save your changes and return to the New Mixture
Analysis Method dialog box.
10. Click New to create a third PHR threshold and perform the
following:
a. Verify the Minimum Peak Height value is 1001.
Note: The default value for a new Minimum Peak Height
entry in the Heterozygote PHR settings table = the
Maximum Peak Height value for the previous row in the
table + 1.
b. In the Maximum Peak Height (RFU) field, enter 10000.
GeneMapper® ID-X Software Version 1.1 Getting Started Guide
47
Chapter 4 Segregate Samples
Step 3: Create a New Mixture Analysis Method
c. In the PHR Threshold (between 0 and 1) field, enter 0.70.
11. Click OK to save your changes and return to the New Mixture
Analysis Method dialog box.
The final mixture analysis test method displays the following
settings.
48
GeneMapper® ID-X Software Version 1.1 Getting Started Guide
Chapter 4 Segregate Samples
Step 3: Create a New Mixture Analysis Method
Apply a Mixture
Analysis Method
to Samples
1. Select Tools Mixture Analysis from the toolbar or press
Ctrl+ U.
The Mixture Analysis - Sample Selection dialog box appears.
Note: Note that all 10 samples loaded successfully.
GeneMapper® ID-X Software Version 1.1 Getting Started Guide
49
Chapter 4 Segregate Samples
Step 3: Create a New Mixture Analysis Method
2. Click Select All to select all of the samples (check marks appear
in each checkbox).
3. In the Mixture Analysis Method column, click the first sample,
click New, then select MA Test Method from the drop-down
menu.
4. Click on the Mixture Analysis Method column header and press
Ctrl-D to apply the MA Test Method mixture analysis method
to all samples.
Create an MA
Method using the
Column DropDown Method
(Alternate
Method)
50
You can also create new mixture analysis methods by selecting New
from the Mixture Analysis Method column drop-down menu, then
following the directions in “Create a Mixture Analysis Method using
the Mixture Analysis Manager” on page 45.
GeneMapper® ID-X Software Version 1.1 Getting Started Guide
Chapter 4 Segregate Samples
Step 4: Segregate the Samples
Step 4: Segregate the Samples
After you’ve applied the MA Test Method mixture analysis method
to all samples, the Mixture Analysis - Sample Selection dialog box
should appear as shown below.
1. Click Next>, then click each of the contributor tabs to review
the results of the sample segregation process as follows.
GeneMapper® ID-X Software Version 1.1 Getting Started Guide
51
Chapter 4 Segregate Samples
Step 4: Segregate the Samples
2. Review the 2 Contributors tab results: 5 samples were
segregated as mixtures with a minimum of 2 contributors.
52
GeneMapper® ID-X Software Version 1.1 Getting Started Guide
Chapter 4 Segregate Samples
Step 4: Segregate the Samples
3. Review the 1 Contributor tab: 4 samples were determined to
originate from a single contributor.
GeneMapper® ID-X Software Version 1.1 Getting Started Guide
53
Chapter 4 Segregate Samples
Step 4: Segregate the Samples
4. Review the 3 or More Contributors tab: 1 sample was
identified by the software as containing 3 or more contributors.
IMPORTANT! Saved sample segregation results are overwritten
when you reanalyze a sample.
5. Go back to the 2 Contributors tab and continue to Chapter 5 to
extract 2-contributor mixtures.
Refer to the GeneMapper® ID-X Software Help for additional
information on segregating samples.
54
GeneMapper® ID-X Software Version 1.1 Getting Started Guide
Chapter 5
Analyze 2-Contributor
Mixtures with Two Unknowns
This chapter covers:
Chapter 1
Getting Started
■ Overview. . . . . . . . . . . . . . . . . . . . . . . . . . . . . . . . . . . . . . . . . 56
■ Step 1: Extract Individual Genotypes . . . . . . . . . . . . . . . . . . . 57
■ Step 2: Review the Results of the Extraction . . . . . . . . . . . . . 58
Chapter 2
Understanding the
Software
■ Step 3: Determine Genotype Combinations to Include in
Statistical Calculations . . . . . . . . . . . . . . . . . . . . . . . . . . . . . . 63
■ Step 4: Calculate Random Match Probabilities and Combined
Probability of Inclusion/Exclusion . . . . . . . . . . . . . . . . . . . . . 71
Chapter 3
Prepare for Mixture
Analysis
■ Step 5: Review the Results of Random Match Probability and
Combined Probability of Inclusion/Exclusion Calculations. . 72
■ Step 6: Calculate and Review Likelihood Ratio Results . . . . 74
Chapter 4
Segregate Samples
Chapter 5
Analyze 2-Contributor
Mixtures with Two
Unknowns
Chapter 6
Analyze 2-Contributor
Mixtures with One Known
Contributor
Chapter 7
Analyze Merged Results
GeneMapper® ID-X Software Version 1.1 Getting Started Guide
55
Chapter 5 Analyze 2-Contributor Mixtures with Two Unknowns
Overview
Overview
About Analysis of
2-Contributor
Samples Where
Both Contributors
are Unknown
When analyzing 2-contributor mixtures where both contributors are
unknown, the software extracts the possible genotype combinations
for each contributor and assesses each combination according to the
peak height ratio thresholds set in the Mixture Analysis Method and
the residual threshold specified by the software.
The software:
• Generates all possible genotype combinations at each marker.
• Calculates the residual values and peak height ratios for all
combinations.
• Computes an average minor contributor mixture proportion
(Mx) from 3-peak and 4-peak data across a profile, which
serves as the basis for comparison of all genotype combinations
generated.
• Automatically selects combinations that meet the criteria for
inclusion in the statistical calculations.
You can review the results of the extraction and select genotype
combinations for statistical analysis.
For a discussion of mixture analysis methods, refer to Gill et al.,
1998 (see Bibliography). For additional information on
2-contributor samples, refer to the GeneMapper® ID-X Software
Help.
In This Chapter
In this chapter, you will learn to:
• Extract individual genotypes from possible contributors of a
two-person mixture where both contributors are unknown.
• Use the GeneMapper® ID-X Mixture Analysis Quality Value
system to review the results of the extraction.
• Determine which genotype combinations to include in the
statistical calculations.
• Calculate Random Match Probabilities (RMP) for each
individual contributor to the mixture.
• Calculate the Combined Probability of Inclusion/Exclusion
(CPI/CPE) for the mixed sample.
56
GeneMapper® ID-X Software Version 1.1 Getting Started Guide
Chapter 5 Analyze 2-Contributor Mixtures with Two Unknowns
Step 1: Extract Individual Genotypes
• Review the results of the RMP and CPI/CPE calculations.
• Calculate and review Likelihood Ratios (LR) results.
Step 1: Extract Individual Genotypes
1. Select the 2 Contributors tab in the Mixture Analysis Sample
Segregation dialog box. Five samples are displayed as shown
below.
The dialog box buttons specific to the 2-contributor mixture
workflow are:
• Export Table - Exports the table of samples characterized
as minimum 2-contributor mixtures
• Next > - Performs new extraction. Performs extraction of
the mixture to identify the individual genotypes of the
2 contributors present in the mixture
• <Back - Returns to the previous dialog box
GeneMapper® ID-X Software Version 1.1 Getting Started Guide
57
Chapter 5 Analyze 2-Contributor Mixtures with Two Unknowns
Step 2: Review the Results of the Extraction
• Finish - Returns to the GeneMapper ID-X Samples table
2. Click Next > to display the Mixture Analysis Results Viewer.
Step 2: Review the Results of the Extraction
About Mixture
Analysis Results
Viewer Tables
The Mixture Analysis Results Viewer contains two data tables to aid
in the review of the extraction results.
Information Found in Tables
The data appearing automatically in each table are determined by the
GeneMapper® ID-X Mixture Analysis Quality Value System . The
system assists with review and interpretation of the data produced
through the genotype extraction process.
The system assesses each possible genotype combination to
determine whether the following thresholds are met:
• The peak-height ratio (PHR) thresholds set in the Mixture
Analysis Method. The peak-height ratio settings were
described in Chapter 3, “Prepare for Mixture Analysis,” when
the mixture analysis method was created.
and
• The residual threshold specified by the software. The
residual is a measure of how close the minor contributor
proportion for a particular genotype combination is to the
expected minor contributor proportion for a particular profile.
The combination of the above measures determines the inclusion
quality (IQ) value assigned to the genotype combination.
The PQV results of these quality assessment tools are displayed
using the same color coded flags
as employed by the
® ID-X Software during data analysis.
GeneMapper
The color of the flag depends on software-specified thresholds or
user-defined thresholds set in the mixture analysis method. Genotype
combinations with a passing green ( ) IQ are automatically
assigned to the Selected Genotype Combinations table for inclusion
in statistical calculations.
58
GeneMapper® ID-X Software Version 1.1 Getting Started Guide
Chapter 5 Analyze 2-Contributor Mixtures with Two Unknowns
Step 2: Review the Results of the Extraction
The Mixture Analysis Results Viewer is shown in the following
figure.
Selected Genotype Combinations Table
The Selected Genotype Combinations table shows the list of possible
genotype combinations, deducible from the mixture, that passed the
criteria for selection (IQ status ) and were therefore automatically
assigned to this table for inclusion in the statistical calculations.
To exclude genotype combinations from the statistical calculations,
highlight the genotype combination(s) and click the Unselect button
to the right of the table.
GeneMapper® ID-X Software Version 1.1 Getting Started Guide
59
Chapter 5 Analyze 2-Contributor Mixtures with Two Unknowns
Step 2: Review the Results of the Extraction
Unselected Genotype Combinations Table
The Unselected Genotype Combinations table shows the list of
possible genotype combinations, deducible from the mixture, which
failed to pass the criteria for automatic inclusion in the Selected
Genotype Combinations table.
To include these genotype combinations in statistical calculations,
highlight the required genotype combination and click the Select
button to the right of the table. This action moves the combinations
from the Unselected Genotypes Combinations table to the Selected
Genotypes Combinations table.
Review Extraction
Results
60
To review the results of the extraction:
1. Select sample H4_H28_1_3 from the drop down menu.
GeneMapper® ID-X Software Version 1.1 Getting Started Guide
Chapter 5 Analyze 2-Contributor Mixtures with Two Unknowns
Step 2: Review the Results of the Extraction
2. Review the data automatically assigned to the Selected
Genotype Combinations table for sample H4_H28_1_3.
Note: All selected genotype combinations show a green (
)
IQ flag.
Additional columns display the following:
• The Mixture Proportion (Mx) value for each genotype
combination. Where calculation of the Mx value is not
possible, N/A is displayed.
• The residual value for each genotype combination.
• The peak height ratio for the C1(Major) contributor
(PHR1) and for the C2 (Minor) contributor (PHR2). Where
calculation of the peak height ratio is not possible (for a
homozygous genotype) N/A is displayed.
• The Residual Status, which displays a green ( ) IQ value
if the calculated residual is below the residual threshold.
• The PHR Status, which displays a green ( ) IQ value if
all calculated peak height ratios exceed the thresholds set
in the Mixture Analysis Method.
Note: The ADBI (Above Detection Below Interpretation)
column in the table displays a yellow ( ) flag when any allele
peak height within a marker genotype combination falls above
the minimum peak amplitude threshold set in the
GeneMapper® ID-X Software, and below the Mixture
Interpretation Threshold (MIT) set in the mixture analysis
method.
GeneMapper® ID-X Software Version 1.1 Getting Started Guide
61
Chapter 5 Analyze 2-Contributor Mixtures with Two Unknowns
Step 2: Review the Results of the Extraction
3. Select the Missing Markers... button. The following message is
displayed:
This message indicates that at least one genotype combination
was selected for each of the markers detected for the sample.
4. Click OK.
For instances where a detected marker does not have any
combinations in the Selected Genotype Combinations table, a
dialog box similar to the one below is displayed. Click Close.
62
GeneMapper® ID-X Software Version 1.1 Getting Started Guide
Chapter 5 Analyze 2-Contributor Mixtures with Two Unknowns
Step 3: Determine Genotype Combinations to Include in Statistical Calculations
5. Review the data contained in the Unselected Genotype
Combinations table. All possible genotype combinations show
either a yellow
or a red
IQ flag. These combinations
were not automatically selected by the software because they
failed to meet one or more criteria.
Note: You can also filter both tables according to IQ status by
clicking a Filter on IQ icon
.
Step 3: Determine Genotype Combinations to
Include in Statistical Calculations
Review First
Sample
1. Select sample H4_H28_1_3 from the drop down menu..
2. Click the Samples Plot… button, then OK in the popup dialog
box that explains the editing functions to view the
electropherogram for mixture sample H4_H28_1_3. The editing
functions are disabled for the Mixture Analysis Tool Sample
Plot, however, other functions such as the Plot Setting Editor,
tables, and viewing functions are enabled.
3. Select the following icon on the Samples Plot to display the
Mixture Analysis Selected Genotype Combinations table below
the Sample Plot.
4. Select 2 in the Panes drop-down list to simultaneously view the
electropherogram information and the table.
GeneMapper® ID-X Software Version 1.1 Getting Started Guide
63
Chapter 5 Analyze 2-Contributor Mixtures with Two Unknowns
Step 3: Determine Genotype Combinations to Include in Statistical Calculations
5. Select Filter by Marker: D3S1358 to the right of the Selected
Genotype Combinations table to filter the results as shown.
Note: You can also highlight the genotype combinations
corresponding to a particular marker without filtering the table
by clicking on the marker header bar for that marker.
6. Review the selected genotype combinations for the D3S1358
marker to assess whether the software successfully evaluated the
2-contributor mixture. Use the marker filter or marker header
bar selection to review the data for other markers.
7. Select the icon indicated below to display the Mixture Analysis
Unselected Genotype Combinations table and view the
combinations that the software did not automatically select.
64
GeneMapper® ID-X Software Version 1.1 Getting Started Guide
Chapter 5 Analyze 2-Contributor Mixtures with Two Unknowns
Step 3: Determine Genotype Combinations to Include in Statistical Calculations
For each marker, verify whether you agree with the
combinations that were NOT selected. Use the Select button to
manually add genotype combinations to the Selected Genotype
Combinations table.
8. Click the X icon in the upper right-hand corner to exit the
Samples Plot and return to the Mixture Analysis Results Viewer.
9. Check the Sample Review Complete box to indicate that this
sample is ready for statistical analysis. The Sample Workflow
Completion dialog box is displayed.
10. Click No.
Note: You will calculate statistics in “Step 4: Calculate
Random Match Probabilities and Combined Probability of
Inclusion/Exclusion.”
Review Second
Sample
1. Select Next Sample >> to review sample H4_H28_1_5.
2. Click the Samples Plot button, then click OK in the popup
dialog box that explains the editing functions.
3. Review the Selected Genotype Combinations table.
GeneMapper® ID-X Software Version 1.1 Getting Started Guide
65
Chapter 5 Analyze 2-Contributor Mixtures with Two Unknowns
Step 3: Determine Genotype Combinations to Include in Statistical Calculations
4. Select Filter by Marker: D3S1358.
The following combinations are selected for D3S1358.
Note: The combination in row 1 contains a minor contributor
genotype of 17, F1. In this case, the software analyzes the
possibility of allele dropout below the Mixture Interpretation
threshold in order to include the combination.
5. From the Samples Plot, select row 1 in the Selected Genotype
Combinations table.
6. Click Unselect.
The combination in row 1 moves to the Unselected Genotype
Combinations table and no longer appears in the Selected
Genotype Combinations table. This removed combination will
not be included in the statistical calculations for this sample.
Note: This combination is being removed for the purposes of
this demonstration only.
7. Select the icon indicated below to display the Unselected
Genotype Combinations table.
66
GeneMapper® ID-X Software Version 1.1 Getting Started Guide
Chapter 5 Analyze 2-Contributor Mixtures with Two Unknowns
Step 3: Determine Genotype Combinations to Include in Statistical Calculations
Select Filter by Marker: D3S1358 to display the results, as
shown below.
Note: The combination that you removed from the Selected
Genotype Combinations table now appears in row 1 of the
Unselected Genotype Combinations table.
8. Exit the Samples Plot by clicking the X in the upper right
corner, then select Filter by Marker: All in the Mixture
Analysis Results Viewer.
GeneMapper® ID-X Software Version 1.1 Getting Started Guide
67
Chapter 5 Analyze 2-Contributor Mixtures with Two Unknowns
Step 3: Determine Genotype Combinations to Include in Statistical Calculations
Select Genotypes
for Second
Sample
Assume that the D3S1358 marker cannot be interpreted with
confidence for the minor contributor for sample H4_H28_1_5.
1. Omit the marker from the statistical calculations by checking
the Inconclusive (Minor) box relating to any one of the
D3S1358 possible genotype combinations in the Selected
Genotype Combinations table.
Note: When you assign one possible genotype combination as
inconclusive for any marker, the software automatically checks
the Inconclusive box for all other possible genotype
combinations at that marker in both the Unselected and Selected
Genotype Combinations tables.
68
GeneMapper® ID-X Software Version 1.1 Getting Started Guide
Chapter 5 Analyze 2-Contributor Mixtures with Two Unknowns
Step 3: Determine Genotype Combinations to Include in Statistical Calculations
2. In the Mixture Analysis Results Viewer, click the Notes…
button. The Sample Notes dialog box is displayed.
The dialog box shows that the software recorded the removal of
pattern [17_F1:15_16] from the Selected Genotype
Combinations table for marker D3S1358 and that D3S1358 is
marked inconclusive for the minor contributor.
3. Click Done to exit the dialog box.
GeneMapper® ID-X Software Version 1.1 Getting Started Guide
69
Chapter 5 Analyze 2-Contributor Mixtures with Two Unknowns
Step 3: Determine Genotype Combinations to Include in Statistical Calculations
4. Check the Sample Review Complete checkbox to signify that
review of the sample and selection of genotypes are finished
and the sample is ready for statistical analysis. The Sample
Workflow Completion dialog box is displayed.
5. Click No.
Note: You will calculate statistics in “Step 4: Calculate
Random Match Probabilities and Combined Probability of
Inclusion/Exclusion.”
Review
Remaining
Samples
1. Click the Next Sample>> button to move to the next sample in
the list. Review the data contained in both tables using the
sample plot viewer.
2. Repeat for all remaining 2-contributor samples and remember
to check Sample Review Complete following evaluation of
each sample.
Note: You may observe during analysis of your own data that
some samples do not produce any results following extraction.
This is expected with samples containing a very low-level minor
contribution where there are only 2-peak markers and no 3-peak
or 4-peak markers.
70
GeneMapper® ID-X Software Version 1.1 Getting Started Guide
Chapter 5 Analyze 2-Contributor Mixtures with Two Unknowns
Step 4: Calculate Random Match Probabilities and Combined Probability of Inclusion/Exclusion
Step 4: Calculate Random Match Probabilities and
Combined Probability of Inclusion/Exclusion
1. In the Mixture Analysis Results Viewer, select Sample Name:
H4_H28_1_5 and click Calculate Statistics to display the
Population Database Selection dialog box.
Note: For samples containing 2 contributors, the software
performs the following statistical calculations: Random Match
Probability (RMP) for each of the extracted contributor
genotypes, Combined Probability of Inclusion/Exclusion
(CPI/CPE), and Likelihood Ratio. Refer to Appendix A,
“Statistical Analysis and Algorithms,” and the GeneMapper®
ID-X Software Help for additional information.
GeneMapper® ID-X Software Version 1.1 Getting Started Guide
71
Chapter 5 Analyze 2-Contributor Mixtures with Two Unknowns
Step 5: Review the Results of Random Match Probability and Combined Probability of Inclusion/Exclusion
Calculations
2. In the Population Database Selection dialog box, select the
African-American population from the Applied Biosystems
Identifiler User Manual, click the Apply to all samples radio
buton, then click OK to view the results of the RMP and
CPI/CPE statistical calculations for each sample.
The RMP Statistics C1 (Major) tab opens by default. Data for
the second contributor is found under the RMP Statistics C2
(Minor) tab.
Continue to Step 5 to review the results.
Step 5: Review the Results of Random Match
Probability and Combined Probability of
Inclusion/Exclusion Calculations
1. Review the RMP data for the major contributor to sample
H4_H28_1_5. Only one possible genotype per marker was
selected for the major contributor.
2. Review the RMP data for the minor contributor for sample
H4_H28_1_5.
• For markers vWA, D2S1338, D18S51, D19S433 and
TH01, marker dropout is represented by the F, F
combination. For these markers, the software incorporates
a value of 1.0 into the statistical calculation as shown in the
example below.
72
GeneMapper® ID-X Software Version 1.1 Getting Started Guide
Chapter 5 Analyze 2-Contributor Mixtures with Two Unknowns
Step 5: Review the Results of Random Match Probability and Combined Probability of Inclusion/Exclusion
Calculations
• For markers D3S1358, D21S11 and FGA, the software
attributes a single allele to the minor contributor. For those
markers, the software calculates a genotype frequency of
2p based on the detected allele frequency, and this is
incorporated into the statistical calculation.
3. Click the CPI/CPE Statistics tab to review the results of the
calculations.
4. Review the CPI/CPE results for sample H4_H28_1_5. In some
instances, the software calculates that the possibility of allele
dropout at a particular marker or markers is viable. For such
markers, the software assigns the marker inclusion frequency a
value of 1.0 based on the possibility that alleles may be present
below the mixture interpretation threshold. Because the
software includes all these potential alleles in the calculations,
the marker is uninformative.
GeneMapper® ID-X Software Version 1.1 Getting Started Guide
73
Chapter 5 Analyze 2-Contributor Mixtures with Two Unknowns
Step 6: Calculate and Review Likelihood Ratio Results
Step 6: Calculate and Review Likelihood Ratio
Results
Note: If you are unfamiliar with Likelihood Ratio calculations,
review Appendix A, “Statistical Analysis and Algorithms,” before
proceeding with this step.
To calculate the Likelihood Ratio, you must set up your alternate
hypotheses by selecting the reference sample which, under the
prosecution's hypothesis (Hp), cannot be excluded as the contributor
of the evidence profile.
Click the LR Statistics tab. In this tab, you can:
• Define the hypotheses for calculating the Likelihood Ratio
based on the extracted mixture results (selected genotype
combinations) of both contributors to the mixture.
• Calculate a Likelihood Ratio based on a major contributor only.
This approach can be used only when the minor contributor is
uninterpretable and when the major component can be
interpreted unambiguously.
Note: Refer to Appendix A, “Statistical Analysis and
Algorithms,” and the GeneMapper® ID-X Software Help for
detailed statistics information.
Calculate the
Likelihood Ratio
Based on
Contributors to
the Mixture
74
The Use (C1) Major Only check box is deselected by default.
When this box is unselected, the software calculates Likelihood
Ratios based on alternate hypotheses using both contributors to the
mixture. The hypotheses available are based on whether one or two
references are incorporated into the prosecution's hypothesis.
GeneMapper® ID-X Software Version 1.1 Getting Started Guide
Chapter 5 Analyze 2-Contributor Mixtures with Two Unknowns
Step 6: Calculate and Review Likelihood Ratio Results
To calculate the Likelihood Ratio:
1. Select a single reference by choosing Import... from the
Reference 1 drop-down menu and navigating to the
Known_H28.txt file you saved earlier in Chapter 3, “Step 5:
Export and View a Known Genotype Profile” on page 35.
Note: When you select the reference, it does not display the
exported file name. Instead, it displays the original sample name
taken from the sample file.
IMPORTANT! If you import a new known genotype containing
the same name as one that currently exists in the Mixture
Analysis tool and there are marker conflicts (same name,
different alleles), no markers from the new known genotype
profile are imported (the existing known genotype profile
remains unchanged). If there are no marker conflicts (same
name, same alleles), then all markers from the new known
genotype profile that do not occur in the existing known
genotype profile are added to that profile.
2. In the Known Genotypes dialog box, click OK.
When you select a single reference, one hypothesis is displayed.
3. Check the box to the left of the hypothesis to display the
Likelihood Ratio Statistics Summary, as shown next.
GeneMapper® ID-X Software Version 1.1 Getting Started Guide
75
Chapter 5 Analyze 2-Contributor Mixtures with Two Unknowns
Step 6: Calculate and Review Likelihood Ratio Results
The software calculates the Likelihood Ratio based on the
following alternate hypotheses:
• Hp = H4_H28_1_5 originates from a mixture of H28 and
one unknown, unrelated person
• Hd = H4_H28_1_5 originates from a mixture of two
unknown, unrelated people
The observed profile is 9.1056E13 or 91 trillion times more
likely to occur if it originated from reference H28 and one
unknown unrelated person than from a mixture of two unknown
unrelated people.
You can also calculate a Likelihood Ratio based on the
hypothesis that both contributors to the mixture are known.
76
GeneMapper® ID-X Software Version 1.1 Getting Started Guide
Chapter 5 Analyze 2-Contributor Mixtures with Two Unknowns
Step 6: Calculate and Review Likelihood Ratio Results
4. Select a second reference: In the Reference 2: drop-down field
click Import…, navigate to the location where you saved the
Known_H4 .txt file, as shown in Chapter 3 “Step 5: Export and
View a Known Genotype Profile” on page 35, then select
Import.
5. In the Known Genotypes dialog box, click OK.
When you select two references, multiple hypotheses are
displayed.
6. Check the boxes to the left of the hypotheses to display the
Likelihood Ratio Statistics Summary, as shown next.
GeneMapper® ID-X Software Version 1.1 Getting Started Guide
77
Chapter 5 Analyze 2-Contributor Mixtures with Two Unknowns
Step 6: Calculate and Review Likelihood Ratio Results
The software calculates the Likelihood Ratio based on the
following alternate hypotheses.
Hypothesis 1
• Hp = H4_H28_1_5 originates from a mixture of H28 and
H4
• Hd = H4_H28_1_5 originates from a mixture of H28 and
one unknown unrelated person.
The observed profile is 4.7134E4 or 47000 times more
likely to occur if it originated from a mixture of H28 and
H24 than from a mixture of H28 and one unknown
unrelated person.
Hypothesis 2
• Hp = H4_H28_1_5 originates from a mixture of H28 and
H24
• Hd = H4_H28_1_5 originates from a mixture of H4 and
one unknown unrelated person
The observed profile is 9.1056E13 or
91 trillion times more likely to occur if it originated from a
mixture of H28 and H24 than from a mixture of H4 and
one unknown unrelated person.
Hypothesis 3
• Hp = H4_H28_1_5 originates from a mixture of H28 and
H24
• Hd = H4_H28_1_5 originates from a mixture of two
unknown unrelated people
The observed profile is 4.2918E18 or 4.3 quintillion times
more likely to occur if it originated from mixture of H28
and H24 than from a mixture of two unknown unrelated
people.
78
GeneMapper® ID-X Software Version 1.1 Getting Started Guide
Chapter 5 Analyze 2-Contributor Mixtures with Two Unknowns
Step 6: Calculate and Review Likelihood Ratio Results
Hypothesis 4
• Hp = H4_H28_1_5 originates from a mixture of H4 and
one unknown unrelated person
• Hd = H4_H28_1_5 originates from a mixture of two
unknown unrelated people
The observed profile is 4.7134E4 or 47000 times more
likely to occur if it originated from reference H4 and one
unknown unrelated person than from a mixture of two
unknown unrelated people.
Hypothesis 5
• Hp = H4_H28_1_5 originates from a mixture of H28 and
one unknown unrelated person
• Hd = H4_H28_1_5 originates from a mixture of two
unknown unrelated people
The observed profile is 9.1056E13 or 91 trillion times
times more likely to occur if it originated from reference
H28 and one unknown unrelated person than from a
mixture of two unknown unrelated people.
For all hypotheses, the software validates the inclusion of the
reference profile in the mixture profile. If you select a reference
that cannot be included in the mixture based on comparison of
the contributor genotypes, the software displays a message that
the validation of inclusion of the reference profile in the mixture
failed, as shown next.
GeneMapper® ID-X Software Version 1.1 Getting Started Guide
79
Chapter 5 Analyze 2-Contributor Mixtures with Two Unknowns
Step 6: Calculate and Review Likelihood Ratio Results
1. Click <Back to return to the Mixture Analysis Sample
Segregation dialog box.
2. If desired, click Yes to save the changes to the current sample.
IMPORTANT! Saved extraction results are overwritten when
you reanalyze a sample.
80
GeneMapper® ID-X Software Version 1.1 Getting Started Guide
Chapter 5 Analyze 2-Contributor Mixtures with Two Unknowns
Step 6: Calculate and Review Likelihood Ratio Results
Calculate the
Likelihood Ratio
Based on the
Major Contributor
Only
1. To calculate the Likelihood Ratio for a major contributor only,
check the Use (C1) Major Only box as shown next.
2. In the Reference 1: drop-down field click Import…, navigate to
the location where you saved the Known_H28.txt file shown in
Chapter 3 “Step 5: Export and View a Known Genotype
Profile” on page 35, then select Import.
3. In the Known Genotypes dialog box, click OK.
One hypothesis is displayed.
4. Check the box to the left of the hypothesis to display the
Likelihood Ratio Statistics Summary, as shown next.
GeneMapper® ID-X Software Version 1.1 Getting Started Guide
81
Chapter 5 Analyze 2-Contributor Mixtures with Two Unknowns
Step 6: Calculate and Review Likelihood Ratio Results
The software calculates the Likelihood Ratio based on the following
alternate hypotheses:
• Hp = Reference H28 is the source of the major contributor DNA
• Hd = An unknown contributor is the source of the major
contributor DNA
In this example the observed profile is 9.1056E13 or 91 trillion times
more likely to occur if it originated from reference H28 than from an
unknown unrelated African-American individual.
Note: The Likelihood Ratio Summary displays only a brief
description of the LR calculations. To view detailed LR calculations,
select Export..., then LR Statistics. Save the exported report as a
comma-separated values file (*.csv). The exported report contains
the details for each population calculated using the likelihood ratio.
82
GeneMapper® ID-X Software Version 1.1 Getting Started Guide
Chapter 5 Analyze 2-Contributor Mixtures with Two Unknowns
Step 6: Calculate and Review Likelihood Ratio Results
Refer to the GeneMapper® ID-X Software Help for additional
information on segregating samples and extracting individuals from
2-contributor mixtures.
GeneMapper® ID-X Software Version 1.1 Getting Started Guide
83
Chapter 5 Analyze 2-Contributor Mixtures with Two Unknowns
Step 6: Calculate and Review Likelihood Ratio Results
84
GeneMapper® ID-X Software Version 1.1 Getting Started Guide
Chapter 6
Analyze 2-Contributor
Mixtures with One Known
Contributor
This chapter covers:
Chapter 1
Getting Started
■ Overview. . . . . . . . . . . . . . . . . . . . . . . . . . . . . . . . . . . . . . . . . 86
■ Step 1: Assign Known Genotypes . . . . . . . . . . . . . . . . . . . . . 86
■ Step 2: Calculate the Random Match Probability for 2-
Chapter 2
Understanding the
Software
Contributor Mixtures Extracted with a Known Contributor. . 92
■ Step 3: Calculate the Likelihood Ratio for 2-Contributor
Mixtures Extracted with a Known Contributor . . . . . . . . . . . 94
Chapter 3
Prepare for Mixture
Analysis
Chapter 4
Segregate Samples
Chapter 5
Analyze 2-Contributor
Mixtures with Two
Unknowns
Chapter 6
Analyze 2-Contributor
Mixtures with One
Known Contributor
Chapter 7
Analyze Merged Results
GeneMapper® ID-X Software Version 1.1 Getting Started Guide
85
Chapter 6 Analyze 2-Contributor Mixtures with One Known Contributor
Overview
Overview
About Analysis of
2-Contributor
Samples Where
1 contributor is
Known
In This Chapter
In this chapter, you will repeat the workflow described in Chapter 5,
“Analyze 2-Contributor Mixtures with Two Unknowns,” but this time
a known reference will be used to further refine the selected
genotype combinations.
You can use this method when one known contributor to an evidence
sample can be reasonably assumed to be present. For example, from
an intimate vaginal sample, it is reasonable to assume that the DNA
taken from the female is present on the swab. In such cases, the
known contributor is "subtracted" from the selected genotype
combinations following extraction, leaving the possible profiles for
the unknown contributor.
In this chapter, you will learn to:
• Assign known genotypes.
• Extract individual genotypes of two possible contributors of a
two-person mixture where 1 contributor is known.
• Determine which genotype combinations to include in the
statistical calculations.
• Calculate Random Match Probability (RMP) for the unknown
contributor.
• Calculate and review Likelihood Ratio results.
Step 1: Assign Known Genotypes
Select Known
Contributors
1. Select the 2 Contributors tab in the Mixture Analysis - Sample
Segregation dialog box. After conducting the review processes
in Chapter 5 “Step 2: Review the Results of the Extraction” on
page 58, the Review Status column should indicate that all
samples were reviewed.
2. Click in the Known column adjacent to sample H4_H28_1_1
and select H4_H28_1_0 from the drop-down list. This sample
was previously imported in Chapter 5 “Step 6: Calculate and
Review Likelihood Ratio Results” on page 74.
86
GeneMapper® ID-X Software Version 1.1 Getting Started Guide
Chapter 6 Analyze 2-Contributor Mixtures with One Known Contributor
Step 1: Assign Known Genotypes
or
To import another known sample click Import…, then from the
drop-down list navigate to the location of a different known
genotype profile and click Import.
The following message is displayed indicating that the review
status will change if you select a known contributor.
Note: This message is displayed only if you previously
reviewed a sample and checked Sample Review Complete
where no known contributor was used, but then went back and
selected a known contributor to include during extraction.
3. Click Yes.
GeneMapper® ID-X Software Version 1.1 Getting Started Guide
87
Chapter 6 Analyze 2-Contributor Mixtures with One Known Contributor
Step 1: Assign Known Genotypes
4. The sample is displayed in the Known column of the Mixture
Analysis - Sample Segregation by Minimum Number of
Contributors table as shown.
Note: A green (
) arrow appears in the Extraction Status
column for sample H4_H28_1_1 indicating a change to the
mixture analysis criteria. Previous results will be lost unless you
click No before proceeding with known genotype selection.
5. Select the Known column header to highlight the column, press
Ctrl-D to apply (fill-down) the known to all samples, then click
Yes when the Review status message is displayed for each
sample.
6. Click Next > to proceed with extraction of the mixtures with
consideration of the selected known contributor.
The Mixture Analysis Results Viewer displays sample
H4_H28_1_1.
88
GeneMapper® ID-X Software Version 1.1 Getting Started Guide
Chapter 6 Analyze 2-Contributor Mixtures with One Known Contributor
Step 1: Assign Known Genotypes
Review Extraction
Results
1. Review the Selected Genotype Combinations table. The bright
green highlighting indicates that the known genotype profile
exactly matches (across all markers) the extracted genotype
combinations of 1 contributor to the mixture. The bright yellow
highlighting indicates the extracted genotype combinations of
the unknown contributor to the mixture. The software uses the
known genotypes to further filter the table, and only displays
combinations that have passing IQ status and contain the known
genotype.
2. In the previous example, review sample H4_H28_1_1 and
select Filter by Marker: D3S1358.
GeneMapper® ID-X Software Version 1.1 Getting Started Guide
89
Chapter 6 Analyze 2-Contributor Mixtures with One Known Contributor
Step 1: Assign Known Genotypes
The C1 (Major) contributor in the Selected Genotype
Combinations table is a 16, 17 (as noted below) and matches the
known whereas the C2 (Minor) contributor is a 15, 16.
Note: In the Unselected Genotype Combinations table there are
three genotype pairs that pass all PQV metrics (Residual Status,
PHR Status and IQ) and yet are not included in the Selected
Genotype Combinations table (shown below). Patterns 2 and 3
do not contain a genotype that matches the known contributor
and, therefore, do not meet the criteria for known filtering.
Pattern 1 is the inverse (Major 15, 16 and Minor 16, 17) of the
selected pattern (Major 16, 17 and Minor 15, 16). In
approximate 1:1 mixtures where both patterns have high
Inclusion Quality, the known selection always displays the
match to the C1 (Major) contributor.
Note: In instances where markers are missing from the Selected
Genotype Combinations table and the entire genotype cannot be
attributed solely to 1 contributor, the highlighting is light yellow
and light green. In such cases, click the Missing Markers…
button, then review the Unselected Genotype Combinations
table to display the missing markers.
90
GeneMapper® ID-X Software Version 1.1 Getting Started Guide
Chapter 6 Analyze 2-Contributor Mixtures with One Known Contributor
Step 1: Assign Known Genotypes
3. In this example, review sample H4_H28_1_3.
The known contributor matches the C2 (Minor) contributor
completely.
4. Select Filter by Marker: vWA.
The five genotype combinations are listed in the Selected
Genotype Combinations table. In all cases the C1(Major)
contributor is a type 15, 18 whereas four different possible
genotypes are listed for the C2 (Minor) contributor: 15, 18; 15,
F1; 18, F1; F1, F1; and F1, F2. The known 15, 18 contributor is
not excluded from any of these possibilities.
GeneMapper® ID-X Software Version 1.1 Getting Started Guide
91
Chapter 6 Analyze 2-Contributor Mixtures with One Known Contributor
Step 2: Calculate the Random Match Probability for 2-Contributor Mixtures Extracted with a Known Contributor
5. Check the Sample Review Complete box to indicate that this
sample is ready for statistical analysis. The Sample Workflow
Completion dialog box is displayed.
6. Click No.
Note: You will calculate statistics in “Step 2: Calculate the
Random Match Probability for 2-Contributor Mixtures
Extracted with a Known Contributor.”
7. Select Next Sample >> to review the next sample extracted
with the known.
Step 2: Calculate the Random Match Probability
for 2-Contributor Mixtures Extracted with a Known
Contributor
1. Click Calculate Statistics.
2. In the Population Database dialog box, select the AfricanAmerican population for the Applied Biosystems Identifiler
User Manual database, apply it to the current sample, then click
OK.
92
GeneMapper® ID-X Software Version 1.1 Getting Started Guide
Chapter 6 Analyze 2-Contributor Mixtures with One Known Contributor
Step 2: Calculate the Random Match Probability for 2-Contributor Mixtures Extracted with a Known Contributor
3. Verify and note that the RMP statistic is only calculated for the
unknown C1 (Major) contributor.
4. Select the CPI/CPE Statistics tab to display the Combined
Probability of Inclusion/Exclusion. This statistic incorporates
the entire complement of alleles present and does not change
when you use a known contributor in the extraction process.
GeneMapper® ID-X Software Version 1.1 Getting Started Guide
93
Chapter 6 Analyze 2-Contributor Mixtures with One Known Contributor
Step 3: Calculate the Likelihood Ratio for 2-Contributor Mixtures Extracted with a Known Contributor
Step 3: Calculate the Likelihood Ratio for
2-Contributor Mixtures Extracted with a Known
Contributor
1. Select the LR Statistics tab.
Note that the known reference that you used in the extraction is
already selected as Reference 1.
2. Select the known H4_H28_0_1 as Reference 2.
Only one hypothesis is available.
• Hp = H4_H28_1_3 originates from a mixture of H4 and
H28
94
GeneMapper® ID-X Software Version 1.1 Getting Started Guide
Chapter 6 Analyze 2-Contributor Mixtures with One Known Contributor
Step 3: Calculate the Likelihood Ratio for 2-Contributor Mixtures Extracted with a Known Contributor
• Hd = H4_H28_1_3 originates from a mixture of H4 and
one unknown unrelated person
• The observed profile is 91 trillion times more likely to
occur if it originated from a mixture of H4 and H28 than
from a mixture of H4 and one unknown unrelated person.
3. Click Finish, then Yes to exit the Mixture Analysis tool and
return to the GeneMapper ID-X Project window.
Refer to the GeneMapper® ID-X Software Help for additional
information on segregating samples, extracting individuals from
2-contributor mixtures, and known matches.
GeneMapper® ID-X Software Version 1.1 Getting Started Guide
95
Chapter 6 Analyze 2-Contributor Mixtures with One Known Contributor
Step 3: Calculate the Likelihood Ratio for 2-Contributor Mixtures Extracted with a Known Contributor
96
GeneMapper® ID-X Software Version 1.1 Getting Started Guide
Chapter 7
Analyze Merged Results
This chapter covers:
Chapter 1
Getting Started
■ Overview. . . . . . . . . . . . . . . . . . . . . . . . . . . . . . . . . . . . . . . . . 98
■ Combine Different Amplification Results . . . . . . . . . . . . . . . 99
■ Step 1: Create a New Project and Add Samples . . . . . . . . . . . 99
Chapter 2
■ Step 2: Import an Analysis Method . . . . . . . . . . . . . . . . . . . 100
Understanding the
Software
■ Step 3: Analyze Samples . . . . . . . . . . . . . . . . . . . . . . . . . . . 100
■ Step 4: Prepare for Mixture Analysis . . . . . . . . . . . . . . . . . . 103
■ Step 5: Segregate Samples and Review Profiles . . . . . . . . . 104
Chapter 3
Prepare for Mixture
Analysis
■ Step 6: View Merged Results . . . . . . . . . . . . . . . . . . . . . . . . 105
■ Step 7: Calculate and Analyze the Results . . . . . . . . . . . . . . 106
Chapter 4
Segregate Samples
Chapter 5
Analyze 2-Contributor
Mixtures with Two
Unknowns
Chapter 6
Analyze 2-Contributor
Mixtures with One Known
Contributor
Chapter
Chapter 77
Analyze Merged Results
GeneMapper® ID-X Software Version 1.1 Getting Started Guide
97
Chapter 7 Analyze Merged Results
Overview
Overview
This chapter provides guidelines for analyzing merged results. You
will learn how to:
• Create a project containing the same sample analyzed with both
the AmpFlSTR® Profiler Plus® and COfiler® kits.
• Add samples to the project.
• Import an analysis method.
• Analyze the samples.
• Prepare for mixture analysis.
• Segregate and review individual profiles.
• Merge the data to create a composite profile containing the 13
genetic markers detectable from both kits.
• Calculate statistics and review results from replicate
amplifications of the same sample.
For additional information on replicate amplifications, see the
GeneMapper® ID-X Software Help.
98
GeneMapper® ID-X Software Version 1.1 Getting Started Guide
Chapter 7 Analyze Merged Results
Combine Different Amplification Results
Combine Different Amplification Results
To combine results from different amplifications of the same sample
you must create a new project containing the sample files for each
amplification of the same sample.
IMPORTANT! Different amplifications of the same sample MUST
have the same sample name in order to use the merge function.
The following procedures are based on the sample data provided. See
“Using this Guide for Mixture Analysis” on page 6 for additional
information.
Step 1: Create a New Project and Add Samples
1. If a project is currently opened, select File New Project to
open a blank project.
2. If prompted to save changes to an existing project, save any
necessary changes or click No.
3. In the Project window select Edit Add Samples to Project
(Ctrl-K).
4. Navigate to <drive>:\Example Data\Mixture Analysis Samples,
select the MA_PP folder, then click Add to List in the lower
left-hand side of the window to add the sample files to the
project.
5. Add the sample files in the MA_CO folder using the same
process, then click Add when you are finished adding samples
to the project list.
6. From the Table Setting drop-down list in the Project window,
select 31XX Data Analysis.
GeneMapper® ID-X Software Version 1.1 Getting Started Guide
99
Chapter 7 Analyze Merged Results
Step 2: Import an Analysis Method
Step 2: Import an Analysis Method
Analysis methods define the peak detection, sizing, genotyping, and
quality assessment parameters applied during analysis of sample
data. In this step, you will import the analysis method configured
specifically for use with the GeneMapper® ID-X Software example
data provided, using the procedures outlined in this guide.
IMPORTANT! The values used in this guide may not be suitable for
analyzing data generated in your laboratory. You must optimize and
validate these values as part of an internal validation study.
In the GeneMapper ID-X Project window:
1. Select ToolsGeneMapper® ID-X Manager.
2. In the Analysis Methods tab, select Import.
3. Navigate to <drive>:\AppliedBiosystems\GeneMapper ID-X\
Example Data\Mixture Analysis\GSG Analysis Method and
select HID_Full Range_75.
4. Click OK in the Choose Security Group dialog box to confirm
the GeneMapper ID-X Security Group, then click Done.
Step 3: Analyze Samples
1. Define each sample from left to right, as shown in the Samples
table below:
a. Assign the Sample Type to each sample.
b. Select the Analysis method (HID_Full Range_75).
c. Select the Panel (Profiler_Plus_v1X or COfiler_v1X).
d. Select the Size Standard ((CE_F_HID_GS500 (75-450)).
100
GeneMapper® ID-X Software Version 1.1 Getting Started Guide
Chapter 7 Analyze Merged Results
Step 3: Analyze Samples
To make your selections, click in each cell and select from the
drop-down list. To change an entire column, click in the first
cell, make your selection, then click in the column header and
press Ctrl-D to populate (fill-down) the column.
Note: When making changes to the Panel column, a separate
window opens instead of a drop-down list. Open the folder and
select the appropriate panel.
2. Click the Analyze icon on the toolbar.
3. The Save Project dialog box is displayed. Fill in the Save Project
dialog box as shown below, then click OK.
GeneMapper® ID-X Software Version 1.1 Getting Started Guide
101
Chapter 7 Analyze Merged Results
Step 3: Analyze Samples
The Analysis Summary dialog box is displayed.
4. In the Analysis Summary under Sample Quality per project,
select the 6 samples from the Total # of Samples column to
display a filtered samples table that enables edit and review of
all the samples.
5. Highlight all sample rows in the table, then click the Display
Plots icon
in the tool bar to review the data and verify that
there are no off-ladder (OL)-only allele labels.
6. Close the Samples Plot.
102
GeneMapper® ID-X Software Version 1.1 Getting Started Guide
Chapter 7 Analyze Merged Results
Step 4: Prepare for Mixture Analysis
Step 4: Prepare for Mixture Analysis
1. In the samples table select Tools Mixture Analysis.
2. 1n the Mixture Analysis Method column select MA Test
Method for all samples and click Select All.
3. Click Next> to proceed with sample segregation as shown in the
following section.
GeneMapper® ID-X Software Version 1.1 Getting Started Guide
103
Chapter 7 Analyze Merged Results
Step 5: Segregate Samples and Review Profiles
Step 5: Segregate Samples and Review Profiles
The two samples segregate as minimum 2 Contributor mixtures.
1. In the 2 Contributors tab, click Next> to proceed with extraction
of contributors.
2. Review the results for sample H4_H28_1_3 analyzed with
AmpFlSTR® Profiler Plus® and COfiler® kits, then check
Sample Review Complete.
Note: You will NOT be able to access merged results for
samples where the Sample Review Complete box is unchecked.
The Sample Workflow Completion dialog box is displayed.
104
GeneMapper® ID-X Software Version 1.1 Getting Started Guide
Chapter 7 Analyze Merged Results
Step 6: View Merged Results
3. Click No.
Note: You will calculate statistics later.
4. Select Next Sample >> to review the next sample, repeat
procedure steps 3 and 4 above, then proceed to the next section
to view the results.
Step 6: View Merged Results
Upon completion of the review of each individual profile, click
Next> to proceed to the Mixture Analysis Merged Results Viewer
and view the mixture analysis results.
The software automatically merges individual results when identical
results are obtained for markers that are common to both
amplifications, and for instances where only one kit contains a result
for a particular marker, as shown in the following figure. This data
can be exported to facilitate review.
GeneMapper® ID-X Software Version 1.1 Getting Started Guide
105
Chapter 7 Analyze Merged Results
Step 7: Calculate and Analyze the Results
When you are finished, calculate statistics as shown in the following
section.
Step 7: Calculate and Analyze the Results
1. Click Calculate Statistics…
2. In the Population Database Selection dialog box, select the
African-American population for the Applied Biosystems
Identifiler User Manual database, apply it to the current sample,
then click OK.
3. Review and analyze the statistics for the composite profile.
106
GeneMapper® ID-X Software Version 1.1 Getting Started Guide
Chapter 7 Analyze Merged Results
Step 7: Calculate and Analyze the Results
4. Click <Back to return to the Mixture Analysis Results Viewer
displaying the COfiler® kit results.
5. Deselect Sample Review Complete.
6. Highlight the result for D3S1358 in Row 1 of the Selected
Genotype Combinations table, then click Unselect to move the
genotype combination to the Unselected Genotype
Combinations table as shown below.
7. Mark Sample Review Complete and select Next >.
8. Click No in the Sample Workflow Completion dialog box, then
select Next >.
GeneMapper® ID-X Software Version 1.1 Getting Started Guide
107
Chapter 7 Analyze Merged Results
Step 7: Calculate and Analyze the Results
9. View the Mixture Analysis Merged Results Viewer as shown
next.
The Merged Results Viewer now displays the discordant results
obtained for D3S1358 using the COfiler® and Profiler Plus®
kits.
10. Select the Profiler Plus® results by highlighting the rows in the
bottom table and clicking Add Marker.
The Profiler Plus® results move into the Selected Genotype
Combinations - Merged table as shown next.
108
GeneMapper® ID-X Software Version 1.1 Getting Started Guide
Chapter 7 Analyze Merged Results
Step 7: Calculate and Analyze the Results
11. Calculate Statistics or click Finish to return to the GeneMapper
ID-X Project window.
Refer to the GeneMapper® ID-X Software Help for additional
information on analyzing merged results
GeneMapper® ID-X Software Version 1.1 Getting Started Guide
109
Chapter 7 Analyze Merged Results
Step 7: Calculate and Analyze the Results
110
GeneMapper® ID-X Software Version 1.1 Getting Started Guide
Appendix A
Statistical Analysis and
Algorithms
This appendix covers:
■ Overview . . . . . . . . . . . . . . . . . . . . . . . . . . . . . . . . . . . . . . . . 112
■ Statistical Approaches . . . . . . . . . . . . . . . . . . . . . . . . . . . . . . 113
GeneMapper® ID-X Software v1.1 Getting Started Guide
111
Appendix A Statistical Analysis and Algorithms
Overview
Overview
This appendix provides supplemental information on:
• Random Match Probability
• Combined Probability of Inclusion/Exclusion
• Likelihood Ratio
Refer to the GeneMapper® ID-X Software Help for more detailed
information regarding the statistical calculations performed in the
software.
112
GeneMapper® ID-X Software v1.1 Getting Started Guide
Appendix A Statistical Analysis and Algorithms
Statistical Approaches
Statistical Approaches
The software incorporates three different statistical calculations into
the Mixture Analysis Tool: Random Match Probability, Combined
Probability of Inclusion/Exclusion, and Likelihood Ratio. All rely on
allele frequency data obtained from user-selectable population
databases that reside within the software. Analysts can make use of
the default population databases supplied with GeneMapper® ID-X
Software v1.1, or they can import their own population database
information to create new selections.
Random Match
Probability
The software calculates Random Match Probabilities for those
samples categorized as single source and for the individual
contributors resulting from two-person mixture extraction. The
software computes a minimum allele frequency of 5/2n, where n =
sample number, and uses this minimum allele frequency when the
actual allele frequency does not exist in the population database or
when the allele frequency is less than the minimum allele frequency.
Homozygous Genotype Frequencies
Homozygous genotype frequencies are calculated as
(p1 * p1) + p1* (1.0 - p1) * θ
where:
p1= allele 1 frequency
θ = theta correction factor (can be set by the user on a per
population basis)
Heterozygous Genotype Frequencies
Heterozygous genotype frequencies are calculated as
2.0 * (p1 * p2)
where:
p1 = allele 1 frequency
p2 = allele 2 frequency
In instances of possible allele dropout, the genotype frequency is
calculated as 2p.
GeneMapper® ID-X Software v1.1 Getting Started Guide
113
Appendix A Statistical Analysis and Algorithms
Statistical Approaches
In instances of marker dropout (partial profile) or if the marker is
deemed inconclusive, the software renders the marker uninformative
and substitutes a value of 1.0 for the genotype frequency.
In instances where multiple genotypes are included as possible
contributors, the software sums the genotype frequencies at a given
marker, resulting in a combined genotype frequency for the marker.
It multiplies the combined genotype frequencies to calculate the
Random Match Probability for each contributor to the mixture.
Combined
Probability of
Inclusion/
Exclusion
The software can calculate Combined Probability of
Inclusion/Exclusion in instances involving two or more contributors
to a mixture.
Probability of Inclusion
The software computes the probability of inclusion for each marker
as:
Probability of Inclusion = (f1 + f2+ f3 + … + fN)2
where:
f1 = frequency allele 1
f2 = frequency allele 2
f3 = frequency allele 3
N= last allele in marker data
Combined Probability of Inclusion
The software computes the combined probability of inclusion as:
Combined Probability of Inclusion = II (Marker Probability of
Inclusion(i))
where:
II = product
i = marker index
114
GeneMapper® ID-X Software v1.1 Getting Started Guide
Appendix A Statistical Analysis and Algorithms
Statistical Approaches
For example:
Probability of Inclusion for Marker "D3" = 0.01
Probability of Inclusion for Marker "D5" = 0.025
Combined Probability of Inclusion = [(0.01) * (0.025)] =
0.00025
If the ethnic group = U.S. Hispanic, then:
Combined Probability of Inclusion = 0.00025 for U.S. Hispanic
Stated otherwise, 1 / 0.00025 = 4000 = 1 in 4 thousand U.S.
Hispanics
Combined Probability of Exclusion
Combined Probability of Exclusion = 1.0 - Probability of Inclusion
Using the above example:
Combined Probability of Inclusion = 0.00025 for U.S. Hispanic
Combined Probability of Exclusion = 1.0 - 0.00025 = 0.99975
which is expressed as a percentage of the population excluded =
0.99975 * 100 = 99.98%
Likelihood Ratio
Based on available information, the software allows the user to
specify a set of hypotheses to calculate Likelihood Ratios for twoperson mixtures using the formula:
LR = Pr E|Hp/Pr E|Hd
where:
LR = Likelihood Ratio
Pr = probability
E = evidence
| = given
Hp = Prosecution hypothesis (the explanation put forward by the
prosecution for the constituents of the mixture)
Hd = Defense hypothesis (the explanation put forward by the
defense for the constituents of the mixture)
GeneMapper® ID-X Software v1.1 Getting Started Guide
115
Appendix A Statistical Analysis and Algorithms
Statistical Approaches
Note: Hp and Hd must be mutually exclusive explanations of the
mixture evidence.
For example, consider the following mixture scenario originating
from an intimate body swab at locus M1:
a
b
c
d
Assuming a two-person mixture with a suspect of type c, d and a
victim of type a, b, the following hypotheses apply:
Hp = The evidence originates from a mixture of the victim and
the suspect
Hd= The evidence originates from a mixture of the victim and
an unknown person
In this instance:
Hp = 1
Hd= 2pcpd
LR = 1/2pcpd
The Mixture Analysis Tool provides the following Likelihood Ratio
functionality:
• The user may elect to calculate the Likelihood Ratio based on a
clear major contributor to the mixture (effectively a single
source Likelihood Ratio calculation).
• The user may select one or a multiple set of hypotheses, which
are applicable to the two-person mixture data.
116
GeneMapper® ID-X Software v1.1 Getting Started Guide
Appendix A Statistical Analysis and Algorithms
Statistical Approaches
• The Likelihood Ratios are calculated based on the extracted
data results; that is, only those genotype combinations included
in the Selected Genotypes Combinations table will be used in
the Likelihood Ratio calculation.
GeneMapper® ID-X Software v1.1 Getting Started Guide
117
Appendix A Statistical Analysis and Algorithms
Statistical Approaches
118
GeneMapper® ID-X Software v1.1 Getting Started Guide
Bibliography
Gill, P. et al., "Interpreting simple STR mixtures using allele peak
areas," Forensic Sci. Int., 1998, 91(1), 41-53.
GeneMapper® ID-X Software v1.1 Getting Started Guide
119
Bibliography
120
GeneMapper® ID-X Software v1.1 Getting Started Guide
Index
Symbols
15
A
ADBI, definition 9
adding samples to projects 27, 99
allele frequency, definition 9
amplification results, combining different
results 99
analysis method, importing 28, 100
analysis samples
reviewing 33
saving 33
segregating 51
analysis summaries, reviewing 31
analyzing data 29
analyzing merged results 101, 106
Applied Biosystems
contacting xi
customer feedback on documentation x
Information Development department x
Technical Support xi
assigning genotypes 86
assumptions for using this guide vii
available statistical options 4
B
bold text, when to use vii
C
C1 (Major), definition 9
C2 (Minor), definition 9
calculating merged results 106
calculating statistics
approaches 113
Combined Probability of Exclusion 72
Combined Probability of Inclusion 72
Combined Probability of Inclusion and
Exclusion 71
Likelihood Ratio 72, 74, 94
population databases 71
Random Match Probability 71, 92
client installation 23
COfiler® Kit
example data 22
sample files 22
combined frequency, definition 10
Combined Probability of Exclusion
calculating 71
reviewing calculation results 72
statistical approach 114, 115
Combined Probability of Inclusion
calculating 71
reviewing calculation results 72
statistical approach 114
combining amplification results 99
conventions
bold text vii
for describing menu commands viii
IMPORTANTS! viii
in this guide vii
italic text vii
Notes viii
user attention words viii
CPE, definition 10
CPI, definition 10
GeneMapper® ID-X Software Version 1.0 Getting Started Guide
121
Index
customer feedback, on Applied Biosystems
documents x
D
data analysis 29
disclaimer, license ii
documentation, related ix
E
example data
COfiler® Kit 22
how to locate 20
how to use 22, 23
Identifiler® Kit 22
Profiler Plus® Kit 22
SGM Plus® Kit 22
example files, locating 23
exporting genotypes 35
exporting known genotypes 35
extracting genotypes 57
extraction results, reviewing 58, 89
extraction, definition 10
F
frequency
allele, definition 9
combined, definition 10
genotype, definition 10
marker inclusion, definition 12
minimum allele, definition 12
full installation 23
G
genotype combination, definition 10
genotype combinations
definition 10
selected 15, 59
table 15, 17, 59, 60
unselected 17, 60
122
genotype frequency, definition 10
genotype profile, definition 11
genotypes
assigning 86
determining for calculation 63
exporting knowns 35
extracting 57
frequency, definition 10
selecting 68
viewing knowns 35
Getting Started Guide
chapter overviews 6
locating example files 23
using example data 22
using this guide 6
glossary of terms 9
H
Help system
accessing x
heterozygote, definition 11
homozygote, definition 11
I
importing population databases 43
inconclusive marker, definition 11
Information Development department,
contacting x
installation
client 23
full 23
installation configurations
client 23
full 23
IQ, definition 11
italic text, when to use vii
GeneMapper® ID-X Software Version 1.0 Getting Started Guide
Index
K
known contributors
selecting 86
known genotypes
exporting 35
viewing 35
L
license disclaimer ii
Likelihood Ratio
calculating 74, 94
calculating known contributor 94
calculating two-contributor mixtures 94
definition 12
major contributor 74, 81
minor contributor 74
reviewing calculation results 74
statistical approach 115
LR, definition 12
M
major contributor, definition 12
major contributor, Likelihood Ratio 74, 81
markers
inclusion frequency, definition 12
inconclusive 11
missing 12
menu commands, conventions for
describing viii
merged results
analyzing 106
calculating 106
mixture analysis 105
sample analysis 101
viewing 105
minimum allele frequency, definition 12
minor contributor, definition 12
minor contributor, Likelihood Ratio 74
MIT, definition 12
mixture analysis
analyzing merged results 106
calculating statistics 106
launching Mixture Analysis Tool 43
merged results, definition 13
method, definition 13
parameters, definition 13
preparing for 26, 103
project, definition 13
quality value system 58
selecting Mixture Analysis Tool 43
viewing merged results 105
Mixture Analysis Results Viewer 105
understanding table data 58
working with 58
Mixture Analysis Tool
definition 13
launching 43
selecting 43
mixture analysis, definition 13
Mixture Interpretation Threshold,
definition 12
MSDSs, obtaining xi
N
new mixture analysis method
using the column drop-down method 45
new project
adding samples 27, 99
creating 27, 99
opening 27
O
online Help. See Help system
opening a new project 27
P
peak height ratio status, definition 14
PHR status, definition 14
GeneMapper® ID-X Software Version 1.0 Getting Started Guide
123
Index
population databases
calculating statistics 71, 106
definition 14
importing 43
Profiler Plus® Kit
example data 22
sample files 22
project, creating 27, 99
Q
quality value system, mixture analysis 58
R
Random Match Probability
calculating 71, 92
calculating 2-contributor mixtures 92
calculating known contributor 92
heterozygous genotype frequencies 113
homozygous genotype frequencies 113
reviewing 71
reviewing calculation results 72
statistical approach 113
residual status, definition 15
residual threshold, definition 15
RMP, definition 15
rules of sample segregation 4
S
sample analysis
unknown contributors 56
sample analysis, merged samples 101
sample files
COfiler® Kit 22
how to use 22
Profiler Plus® Kit 22
SGM Plus® Kit 22
sample segregation
1 contributor 53
2 contributors 52, 104
3 or more contributors 54
124
definition 15
rules 4
segregating analysis samples 51
Selected Genotype Combinations table 15, 59
reviewing extraction results 89
selecting genotypes 68
SGM Plus® Kit
example data 22
sample files 22
software
calculating statistics 20
features 2
locating example data 20
mixture analysis workflow 5
segregating samples 20
using example data 20
using mixture analysis methods 20
using population datases 20
what’s new 2
statistical analysis
2-contributor mixtures 56, 86
known contributors 86
unknown contributors 56
statistical approaches
Combined Probability of Inclusion and
Exclusion 114
Likelihood Ratio 115
Random Match Probability 113
statistical calculations
1 contributor 53
2 contributors 21, 52, 104
3 or more contributors 54
statistical options
1 contributor 21
2 contributors 21
3 or more contributors 21
T
Technical Support, contacting xi
text conventions vii
training, information on xi
GeneMapper® ID-X Software Version 1.0 Getting Started Guide
Index
U
unknown contributors, sample analysis 56
Unselected Genotype Combinations table 17,
60
user attention words, described viii
V
viewing
known genotypes 35
merged results 105
GeneMapper® ID-X Software Version 1.0 Getting Started Guide
125
Index
126
GeneMapper® ID-X Software Version 1.0 Getting Started Guide
Worldwide Sales and Support
Applied Biosystems vast distribution and
service network, composed of highly trained
support and applications personnel,
reaches 150 countries on six continents.
For sales office locations and technical support,
please call our local office or refer to our
Web site at www.appliedbiosystems.com.
Applera is committed to providing the
world’s leading technology and information
for life scientists. Applera Corporation
consists of the Applied Biosystems and
Celera Genomics businesses.
Headquarters
850 Lincoln Centre Drive
Foster City, CA 94404 USA
Phone: +1 650.638.5800
Toll Free (In North America): +1 800.345.5224
Fax: +1 650.638.5884
9/2008
www.appliedbiosystems.com
Part Number 4396773 Rev. A