1
chemlab Documentation
Release 0.4
Gabriele Lanaro
August 10, 2015
Contents
1
Current Status
2
User Manual
2.1 What’s new . . . . . . . . . . . .
2.2 Installation and Quickstart . . . .
2.3 Atoms, Molecules and Systems .
2.4 Input and Output Routines . . . .
2.5 Graphics and Visualization . . . .
2.6 Database Support . . . . . . . . .
2.7 Molecular Viewer . . . . . . . .
2.8 IPython integration . . . . . . . .
2.9 Using GROMACS with chemlab
.
.
.
.
.
.
.
.
.
.
.
.
.
.
.
.
.
.
.
.
.
.
.
.
.
.
.
.
.
.
.
.
.
.
.
.
.
.
.
.
.
.
.
.
.
.
.
.
.
.
.
.
.
.
.
.
.
.
.
.
.
.
.
.
.
.
.
.
.
.
.
.
.
.
.
.
.
.
.
.
.
.
.
.
.
.
.
.
.
.
.
.
.
.
.
.
.
.
.
.
.
.
.
.
.
.
.
.
.
.
.
.
.
.
.
.
.
.
.
.
.
.
.
.
.
.
.
.
.
.
.
.
.
.
.
.
.
.
.
.
.
.
.
.
.
.
.
.
.
.
.
.
.
.
.
.
.
.
.
.
.
.
.
.
.
.
.
.
.
.
.
.
.
.
.
.
.
.
.
.
.
.
.
.
.
.
.
.
.
.
.
.
.
.
.
.
.
.
.
.
.
.
.
.
.
.
.
.
.
.
.
.
.
.
.
.
.
.
.
.
.
.
.
.
.
.
.
.
.
.
.
.
.
.
.
.
.
.
.
.
.
.
.
.
.
.
.
.
.
.
.
.
.
.
.
.
.
.
.
.
.
.
.
.
.
.
.
.
.
.
.
.
.
.
.
.
.
.
.
.
.
.
.
.
.
.
.
.
.
.
.
.
.
.
.
.
.
.
.
.
.
.
.
.
.
.
.
.
.
.
.
.
.
.
.
.
.
.
.
.
.
.
.
.
5
5
7
7
16
18
34
36
43
43
Reference Documentation
3.1 chemlab.core . . . .
3.2 chemlab.io . . . . .
3.3 chemlab.graphics . .
3.4 chemlab.db . . . . .
3.5 chemlab.utils . . . .
3.6 chemlab.mviewer.api
3.7 chemlab.qc . . . . .
3.8 chemlab.notebook .
.
.
.
.
.
.
.
.
.
.
.
.
.
.
.
.
.
.
.
.
.
.
.
.
.
.
.
.
.
.
.
.
.
.
.
.
.
.
.
.
.
.
.
.
.
.
.
.
.
.
.
.
.
.
.
.
.
.
.
.
.
.
.
.
.
.
.
.
.
.
.
.
.
.
.
.
.
.
.
.
.
.
.
.
.
.
.
.
.
.
.
.
.
.
.
.
.
.
.
.
.
.
.
.
.
.
.
.
.
.
.
.
.
.
.
.
.
.
.
.
.
.
.
.
.
.
.
.
.
.
.
.
.
.
.
.
.
.
.
.
.
.
.
.
.
.
.
.
.
.
.
.
.
.
.
.
.
.
.
.
.
.
.
.
.
.
.
.
.
.
.
.
.
.
.
.
.
.
.
.
.
.
.
.
.
.
.
.
.
.
.
.
.
.
.
.
.
.
.
.
.
.
.
.
.
.
.
.
.
.
.
.
.
.
.
.
.
.
.
.
.
.
.
.
.
.
.
.
.
.
.
.
.
.
.
.
.
.
.
.
.
.
.
.
.
.
.
.
.
.
.
.
.
.
.
.
.
.
.
.
.
.
.
.
.
.
.
.
.
.
.
.
.
.
.
.
.
.
.
.
.
.
.
.
.
.
.
.
49
49
58
62
101
104
104
109
109
3
4
License
Python Module Index
3
.
.
.
.
.
.
.
.
.
.
.
.
.
.
.
.
.
.
.
.
.
.
.
.
.
.
.
.
.
.
.
.
.
.
.
.
.
.
.
.
.
.
.
.
.
.
.
.
.
.
.
.
.
.
.
.
111
113
i
ii
chemlab Documentation, Release 0.4
Author Gabriele Lanaro
Contributors Yotam Y. Avital, Adam Jackson
Webpage https://chemlab.github.com/chemlab
Project Page https://github.com/chemlab/chemlab
Mailing List python-chemlab.googlegroups.com
Downloads https://chemlab.github.com/chemlab
Chemlab is a library that can help the user with chemistry-relevant calculations using the flexibility and power of the
python programming language. It aims to be well-designed and pythonic, taking inspiration from projects such as
numpy and scipy.
Chemlab’s long term goal is to be:
• General Chemistry is a huge field, chemlab wants to provide a general ground from where to build domainspecific tools and apps.
• Array oriented Most operations and data structures are based on numpy arrays. This let you write compact and
efficient code.
• Graphic chemlab integrates a 3D molecular viewer that is easily extendable and lets you write your own visualization tools.
• Interoperable chemlab wants to be interoperable with other chemistry programs by reading and writing different file formats and using flexible data structures.
• Fast Even if python is known to be slow every effort should be made to make chemlab ‘fast enough’, by using
effectively numpy arrays and efficient data structures. When everything else fails we can still write the hard bits
in C with the help of cython.
Contents
1
chemlab Documentation, Release 0.4
2
Contents
CHAPTER 1
Current Status
Computational and theoretical chemistry is a huge field, and providing a program that encompasses all aspects of it is
an impossible task. The spirit of chemlab is to provide a common ground from where you can build specific programs.
For this reason it includes a fully programmable molecular viewer.
Chemlab includes a lot of utilities to programmatically download and generate geometries. The molecular viewer is
very fast (it can easily animate ~100000 spheres) and the design is simple and flexible. For more information about
the newest features check out the release notes in the What’s new document.
Chemlab is developer-friendly, it provides good documentation and has an easy structure to get in. Feel free to send
me anything that you may do with chemlab, like supporting a new file format, a new graphic renderer, a nice example,
even if you don’t think it’s perfect. Send an email to the mailing list or file an issue on the github page to discuss any
idea that comes to your mind. Get involved!
3
chemlab Documentation, Release 0.4
4
Chapter 1. Current Status
CHAPTER 2
User Manual
2.1 What’s new
2.1.1 Version 0.4
chemlab.mviewer:
• Added a full-fledged molecular viewer. But it will be gone in favor of the notebook based chemview.
chemlab.io:
• Added cclib integration
chemlab.notebook:
• New module with functions for the IPython notebook. Requires chemview.
chemlab.qc:
• Example module for quantum chemistry calculation. Please file an issue on GitHub if you want to maintain
it.
2.1.2 Version 0.3
chemlab.core:
• New bond handling with the Molecule.bonds and System.bonds attributes
• Possibility to add charges
chemlab.graphics:
• Post Processing Effects:
– FXAA – Fast Approximate Antialiasing
– Gamma Correction
– Glow
– Outline
– SSAO – Screen Space Ambient Occlusion
• Renderers:
– Implemented toon shading for different shapes.
5
chemlab Documentation, Release 0.4
– CylinderImpostorRenderer – a really fast way to draw cylinders
• Offline Rendering at any resolution supported by the video card.
• Started some work on user interaction for a full molecular viewer.
chemlab.db:
• New Databases:
– RCSB for protein structures
– ToxNetDB for properties
– ChemspiderDB
2.1.3 Version 0.2
chemlab.core:
• Serialization through json with from_json and tojson for Atom, System and Molecule;
• Removing atoms and molecules from System. System.remove_atoms, System.remove_molecules;
• Experimental support for customized Atom/Molecule/System types.
• Some indexing routines: System.atom_to_molecules_indices and System.mol_to_atom_indices;
• Custom sorting of systems throught System.reorder_molecules;
• Support for bonds in molecules and experimental support for bonds in Systems throught Molecule.bonds and
System.get_bonds_array
• System.merge_systems has a better overlap handling.
• Removed boxsize attribute, now you have to always specify box_vectors.
• Implemented random_lattice_box to do random solvent boxes.
chemlab.graphics:
• New Renderers: - BallAndStickRenderer - BondRenderer - WireframeRenderer
• Implemented Camera.autozoom for autoscaling
• Reimplemented BondRenderer in cython.
chemlab.io:
• New Handlers:
– MDL molfile (.mol extension)
– Chemical Markup Language (.cml extension)
chemlab.db:
• New package to handle databases
• CirDB to retrieve molecules from chemical identifier resolver
• ChemlabDB to retrieve built-in data
• LocalDB to make personal databases
chemlab.ipython:
• Preliminary ipython notebook integration. It can display Molecule and System instances by using out-of-screen
rendering.
6
Chapter 2. User Manual
chemlab Documentation, Release 0.4
chemlab.utils:
• Implemented some (periodic/non-periodic) distance finding routines.
Table of Contents
2.2 Installation and Quickstart
The easiest way to install chemlab is to use the Anaconda python distribution from the following link.
http://continuum.io/downloads
Then you can run the following command:
conda install -c http://conda.binstar.org/gabrielelanaro chemlab
You can also install chemlab on Ubuntu 14.04 using apt. First install the dependencies:
$ sudo apt-get install python-numpy python-scipy python-opengl cython python-matplotlib python-qt4-gl
python-qt4
Then install chemlab from the setup.py included:
$ sudo python setup.py install
NOTE: For python3 support install the corresponding python3 packages available in your distribution or use pip.
Once you’re setup, you’re ready to to dig in chemlab’s features. You may start from the User Manual.
2.2.1 Development
After installing the dependencies, grab the chemlab source from git:
$ git clone --recursive https://github.com/chemlab/chemlab.git
Complile the included extensions:
$ python setup.py build_ext --inplace
Just add the chemlab directory to the PYTHONPATH in your .bashrc:
export PYTHONPATH=$PYTHONPATH:/path/to/chemlab
2.3 Atoms, Molecules and Systems
In chemlab, atoms can be represented using the chemlab.core.Atom data structure that contains some common
information about our particles like type, mass and position. Atom instances are easily created by initializing them
with data
>>> from chemlab.core import Atom
>>> ar = Atom('Ar', [0.0, 0.0, 0.0])
>>> ar.type
'Ar'
>>> ar.r
np.array([0.0, 0.0, 0.0])
2.2. Installation and Quickstart
7
chemlab Documentation, Release 0.4
Note: for the atomic coordinates you should use nanometers
A chemlab.core.Molecule is an entity composed of more atoms and most of the Molecule properties are
inherited from the constituent atoms. To initialize a Molecule you can, for example, pass a list of atom instances to its
constructor:
>>> from chemlab.core import Molecule
>>> mol = Molecule([at1, at2, at3])
2.3.1 Manipulating Molecules
Molecules are easily and efficiently manipulated through the use of numpy arrays. One of the most useful arrays
contained in Molecule is the array of coordinates Molecule.r_array. The array of coordinates is a numpy array
of shape (NA,3) where NA is the number of atoms in the molecule. According to the numpy broadcasting rules, if
you sum two arrays with shapes (NA,3) and (3,), each row of the first array gets summed with the second array.
Let’s say we have a water molecule and we want to displace it randomly in a box, this is easily accomplished by
initializing a Molecule at the origin and summing its coordinates with a random displacement:
import numpy as np
wat = Molecule([Atom("H", [0.0, 0.0, 0.0]),
Atom("H", [0.0, 1.0, 0.0]),
Atom("O", [0.0, 0.0, 1.0])], bonds=[[2, 0], [2, 1]])
# Shapes (NA, 3) and (3,)
wat.r_array += np.random.rand(3)
Using the same principles, you can also apply other kinds of transformations such as matrices. You can for example
rotate the molecule by 90 degrees around the z-axis:
from chemlab.graphics.transformations import rotation_matrix
# The transformation module returns 4x4 matrices
M = rotation_matrix(np.pi/2, np.array([0.0, 0.0, 1.0]))[:3,:3]
# slow, readable way
for i,r in enumerate(wat.r_array):
wat.r_array[i] = np.dot(M,r)
# numpy efficient way to do the same:
# wat.r_array = np.dot(wat.r_array, M.T)
The array-based API provides a massive increase in performance and a more straightforward integration with C libraries thanks to the numpy arrays. This feature comes at a cost: the data is copied between atoms and molecules, in
other words the changes in the costituents atoms are not reflected in the Molecule and vice-versa. Even if it may look
a bit unnatural, this approach limits side effects and makes the code more predictable and easy to follow.
Bonds between atoms can be set or retrieved by using the bonds attribute. It’s an array of integers of dimensions
(nbonds, 2) where the integer value corresponds to the atomic indices:
>>> from chemlab.db import ChemlabDB
>>> water = ChemlabDB().get('molecule', 'example.water')
>>> water.bonds
array([[0, 1],
[0, 2]])
8
Chapter 2. User Manual
chemlab Documentation, Release 0.4
By using the numpy.take function it’s very easy to extract properties relative to the bonds. numpy.take lets you index
an array using another array as a source of indices, for example, we can extract the bonds extrema in this way:
>>> import numpy as np
>>> np.take(water.type_array, n.bonds)
array([['O', 'H'],
['O', 'H']], dtype=object)
If the array is not flat (like r_array), you can also specify the indexing axis; the following snippet can be used to retrieve
the bond distances:
# With water.bonds[:, 0] we take an array with the indices of the
# first element of the bond. And we use numpy.take to use this array
# to index r_array. We index along the axis 0, along this axis
# the elements are 3D vectors.
>>> bond_starts = np.take(water.r_array, water.bonds[:, 0], axis=0)
>>> bond_ends = np.take(water.r_array, water.bonds[:, 1], axis=0)
>>> bond_vectors = bond_ends - bond_starts
# We sum the squares along the axis 1, this is equivalent of doint
# x**2 + y**2 + z**2 for each row of the bond_vectors array
>>> distances = np.sqrt((bond_vectors**2).sum(axis=1))
>>> print(distances)
[ 0.1
0.09999803]
Sometimes you don’t want to manually input the bonds, but want to have them automatically generated. In this case
you may use the chemlab.core.Molecule.guess_bonds() method.
2.3.2 Systems
In context such as molecular simulations it is customary to introduce a new data structure called System. A System
represents a collection of molecules, and optionally (but recommended) you can pass also periodic box information:
>>> from chemlab.core import System
# molecule = a list of Molecule instances
>>> s = System(molecules, boxsize=2.0)
A System does not directly take Atom instances as its constituents, therefore if you need to simulate a system made of
single atoms (say, a box of liquid Ar) you need to wrap the atoms into a Molecule:
>>> ar = Atom('Ar', [0.0, 0.0, 0.0])
>>> mol = Molecule([ar])
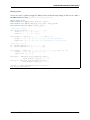
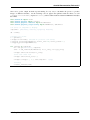
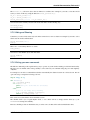
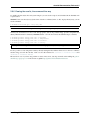
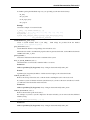
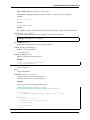
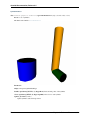
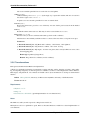
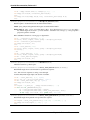
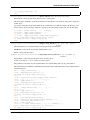
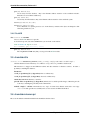
System, similarly to Molecule, can expose data by using arrays and it inherits atomic data from the constituent molecules. For instance, you can easily and efficiently access all the atomic coordinates by using
the attribute System.r_array. To understand the relation between Atom.r, Molecule.r_array and
System.r_array you can refer to the picture below:
2.3. Atoms, Molecules and Systems
9
chemlab Documentation, Release 0.4
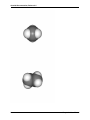
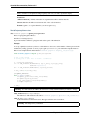
You can preallocate a System by using the classmethod System.empty (pretty much like you can preallocate numpy
arrays with np.empty or np.zeros) and then add the molecules one by one:
import numpy as np
from chemlab.core import Atom, Molecule, System
from chemlab.graphics import display_system
# Template molecule
wat = Molecule([Atom('O', [0.00, 0.00, 0.01]),
Atom('H', [0.00, 0.08,-0.05]),
Atom('H', [0.00,-0.08,-0.05])])
# Initialize a system with four water molecules.
s = System.empty(4, 12) # 4 molecules, 12 atoms
for i in range(4):
wat.move_to(np.random.rand(3)) # randomly displace the water molecule
s.add(wat) # data gets copied each time
display_system(s)
Since the data is copied, the wat molecule acts as a template so you can move it around and keep adding it to the
System.
Preallocating and adding molecules is a pretty fast way to build a System, but the fastest way (in
terms of processing time) is to build the system by passing ready-made arrays, this is done by using
chemlab.core.System.from_arrays().
Most of the chemlab.core.Molecule array attributes are still present in chemlab.core.System, including
System.bonds; bonds between molecules are currently not supported and setting them will result in an unexpected behaviour. There is also a chemlab.core.System.guess_bonds() method to automatically set the
intramolecular bonds.
Building Systems
Random Boxes
It
is
possible
to
build
boxes
where
atoms
are
placed
randomly
by
using
the
chemlab.core.random_lattice_box() function. A set of template molecules are copied and translated randomly on the points of a 3d lattice. This ensures that the spacing between molecules is consistent and to
avoid overlaps.
10
Chapter 2. User Manual
chemlab Documentation, Release 0.4
To make an example box:
from chemlab.db import ChemlabDB
from chemlab.core import random_lattice_box
# Example water molecule
water = ChemlabDB().get('molecule', 'example.water')
s = random_lattice_box([water], [1000], [4.0, 4.0, 4.0])
Crystals
chemlab provides an handy way to build crystal structures from the atomic coordinates and the space group information. If you have the crystallographic data, you can easily build a crystal:
from chemlab.core import Atom, Molecule, crystal
from chemlab.graphics import display_system
# Molecule templates
na = Molecule([Atom('Na', [0.0, 0.0, 0.0])])
cl = Molecule([Atom('Cl', [0.0, 0.0, 0.0])])
s = crystal([[0.0, 0.0, 0.0], [0.5, 0.5, 0.5]], # Fractional Positions
[na, cl], # Molecules
225, # Space Group
cellpar = [.54, .54, .54, 90, 90, 90], # unit cell parameters
repetitions = [5, 5, 5]) # unit cell repetitions in each direction
display_system(s)
See also:
chemlab.core.crystal()
Note: If you’d like to implement a .cif file reader, you’re welcome! Drop a patch on github.
Manipulating Systems
Selections
You can manipulate systems by using some simple but flexible functions.
It is really easy to generate a system by selecting a part from a bigger system, this is implemented in the functions
chemlab.core.subsystem_from_atoms() and chemlab.core.subsystem_from_molecules().
Those two functions take as the first argument the original System, and as the second argument a selection. A selection
is either a boolean array that is True when we want to select that element and False otherwise, or an integer array
containing the elements that we want to select. By using those two functions we can create a subsystem by building
those selections.
The following example shows an easy way to take the molecules that contain atoms in the region of space x > 0.5 by
employing subsystem_from_atoms():
import numpy as np
from chemlab.core import crystal, Molecule, Atom, subsystem_from_atoms
from chemlab.graphics import display_system
2.3. Atoms, Molecules and Systems
11
chemlab Documentation, Release 0.4
# Template molecule
wat = Molecule([Atom('O', [0.00, 0.00, 0.01]),
Atom('H', [0.00, 0.08,-0.05]),
Atom('H', [0.00,-0.08,-0.05])])
s = crystal([[0.0, 0.0, 0.0]], [wat], 225,
cellpar = [.54, .54, .54, 90, 90, 90], # unit cell parameters
repetitions = [5, 5, 5]) # unit cell repetitions in each direction
selection = s.r_array[:, 0] > 0.5
sub_s = subsystem_from_atoms(s, selection)
display_system(sub_s)
It is also possible to select a subsystem by selecting specific molecules; in the following example we select the first 10
water molecules by using subsystem_from_molecules():
from chemlab.core import subsystem_from_molecules
selection = np.array([0, 1, 2, 3, 4, 5, 6, 7, 8, 9])
sub_s = subsystem_from_molecules(s, selection)
Note: chemlab will provide other selection utilities in the future, if you have a specific request, file an issue on github
12
Chapter 2. User Manual
chemlab Documentation, Release 0.4
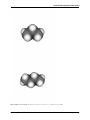
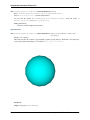
Merging systems
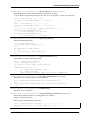
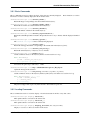
You can also create a system by merging two different systems. In the following example we will see how to make a
NaCl/H2O interface by using chemlab.core.merge_systems():
import numpy as np
from chemlab.core import Atom, Molecule, crystal
from chemlab.core import subsystem_from_atoms, merge_systems
from chemlab.graphics import display_system
# Make water crystal
wat = Molecule([Atom('O', [0.00, 0.00, 0.01]),
Atom('H', [0.00, 0.08,-0.05]),
Atom('H', [0.00,-0.08,-0.05])])
water_crystal = crystal([[0.0, 0.0, 0.0]], [wat], 225,
cellpar = [.54, .54, .54, 90, 90, 90], # unit cell parameters
repetitions = [5, 5, 5]) # unit cell repetitions in each direction
# Make nacl crystal
na = Molecule([Atom('Na', [0.0, 0.0, 0.0])])
cl = Molecule([Atom('Cl', [0.0, 0.0, 0.0])])
nacl_crystal = crystal([[0.0, 0.0, 0.0], [0.5, 0.5, 0.5]], [na, cl], 225,
cellpar = [.54, .54, .54, 90, 90, 90],
repetitions = [5, 5, 5])
water_half = subsystem_from_atoms(water_crystal,
water_crystal.r_array[:,0] > 1.2)
nacl_half = subsystem_from_atoms(nacl_crystal,
nacl_crystal.r_array[:,0] < 1.2)
interface = merge_systems(water_half, nacl_half)
display_system(interface)
2.3. Atoms, Molecules and Systems
13
chemlab Documentation, Release 0.4
At the present time, the merging will avoid overlapping by creating a bounding box around the two systems and
removing the molecules of the first system that are inside the second system bounding box. In the future there will be
more clever ways to handle this overlaps.
Removing
There are two methods used to remove specific atoms and molecules from a system.
chemlab.core.System.remove_molecules() and chemlab.core.System.remove_atoms().
Taking from the previous NaCl example, you may need to remove some excess ions to meet the electroneutrality
condition:
# n_na and n_cl are the number of Na and Cl molecules
toremove = 'Na' if n_na > n_cl else 'Cl'
nremove = abs(n_na - n_cl) # Number of indices to be removed
remove_indices = (s.type_array == toremove).nonzero()[0][:nremove]
s.remove_atoms(rem_indices)
14
Chapter 2. User Manual
chemlab Documentation, Release 0.4
Sorting and reordering
It
is
possible
to
reorder
the
molecules
in
a
System
by
using
the
method
chemlab.core.System.reorder_molecules() that takes the new order as the first argument. Reordering can be useful for example to sort the molecules against a certain key.
If you use chemlab in conjunction with GROMACS, you may use the chemlab.core.System.sort() to sort
the molecules according to their molecular formulas before exporting. The topology file expect to have a file with the
same molecule type ordererd.
2.3.3 Extending the base types
Warning: This part of chemlab is still in draft. This first, very brief implementation serves as a specification
document. As we collect more feedback and feature requests there will be an expansion and a refinement of the
extension functionalities.
Differents applications of chemistry may require additional data attached to each atom, molecule or system. For
example you may need the velocity of the system, atomic charges or number of electrons. Chemlab should be able to
provide a way to simply attach this data while retaining the selection and sorting functionalities.
The management of the atomic and molecular properties within a System is done through specific handlers. Those
handlers are called attributes and fields. In the following example we may see how it’s possible to add a new field
“v” to the Atom class, and transmit this field as a “v_array” in the Molecule and System class. In those cases they
basically take as their argument the attribute/field name, the type, and a function that return the default value for the
field/attribute:
from chemlab.core.attributes import MArrayAttr, NDArrayAttr
from chemlab.core.fields import AtomicField
class MyAtom(Atom):
fields = Atom.fields + [AtomicField("v",
default=lambda at: np.zeros(3, np.float))]
class MyMolecule(Molecule):
attributes = Molecule.attributes + [MArrayAttr("v_array", "v", np.float,
default=lambda mol: np.zeros((mol.n_atoms, 3), np
class MySystem(System):
attributes = System.attributes + [NDArrayAttr("v_array", "v_array", np.float, 3)]
Those class are ready to use. You may want to create new instances with the Atom.from_fields, Molecule.from_arrays
and System.from_arrays.
Once you’ve done your field-specific job with MyAtom/MyMolecule/MySystem you can convert back to a chemlab
default class class by using the astype methods:
at = myat.astype(Atom)
mol = mymol.astype(Molecule)
sys = mysys.astype(System)
2.3. Atoms, Molecules and Systems
15
chemlab Documentation, Release 0.4
2.4 Input and Output Routines
2.4.1 The jungle of file formats
There are a lot of file formats used and produced by chemistry applications. Each program has his way to store
geometries, trajectories, energies and properties etc. chemlab tries to encompass all of those different properties by
using a lightweight way to handle such differences.
2.4.2 Reading and writing data
The classes responsible for the I/O are subclasses of chemlab.io.handlers.IOHandler. These handlers take
a file-like object as the first argument and they work all in the same way, here is an example of GroHandler:
from chemlab.io.handlers import GromacsIO
fd = open('waterbox.gro', 'rb')
infile = GromacsIO(fd)
system = infile.read('system')
# Modify system as you wish...
fd = open('waterbox_out.gro', 'w')
outfile = GromacsIO(fd)
outfile.write('system', system)
You first create the handler instance for a certain format and then you can read a certain feature provided by the handler.
In this example we read and write the system feature.
Some file formats may have some extra data for each atom, molecule or system. For example the ”.gro”
file formats have his own way to call the atoms in a water molecule: OW, HW1, HW2.
To handle
such issues, you can write this information in the export arrays contained in the data structures, such as
Atom.export, Molecule.export, and their array-based counterparts Molecule.atom_export_array,
System.mol_export and System.atom_export_array.
Those attributes are especially important where you write in some data format, since you may have to provide those
attribute when you initialize your Atom, Molecule and System.
You can easily open a data file without even having to search his format handler by using the utility function
chemlab.io.datafile() this is the recommended way for automatically opening a file:
from chemlab.io import datafile
# For reading
sys = datafile('waterbox.gro').read('system')
t, coords = datafile('traj.xtc').read('trajectory')
# For writing
datafile("output.gro", "w").write("system", sys)
See also:
Supported File Formats chemlab.io.datafile()
2.4.3 Implementing your own IOHandler
Implementing or improving an existing IOHandler is a great way to participate in chemlab development. Fortunately,
it’s extremely easy to set one up.
16
Chapter 2. User Manual
chemlab Documentation, Release 0.4
It boils down to a few steps:
1. Subclass IOHandler;
2. Define the class attributes can_read and can_write;
3. Implement the write and read methods for the features that you added in can_read and can_write;
4. Write the documentation for each feature.
Here is an example of the xyz handler:
import numpy as np
from chemlab.io.handlers import IOHandler
from chemlab.core import Molecule
class XyzIO(IOHandler):
'''The XYZ format is described in this wikipedia article
http://en.wikipedia.org/wiki/XYZ_file_format.
**Features**
.. method:: read("molecule")
Read the coordinates in a :py:class:`~chemlab.core.Molecule` instance.
.. method:: write("molecule", mol)
Writes a :py:class:`~chemlab.core.Molecule` instance in the XYZ format.
'''
can_read = ['molecule']
can_write = ['molecule']
def read(self, feature):
self.check_feature(feature, "read")
lines = self.fd.readlines()
num = int(lines[0])
title = lines[1]
if feature == 'title':
return title
if feature == 'molecule':
type_array = []
r_array = []
for l in lines[2:]:
type, x, y, z = l.split()
r_array.append([float(x),float(y),float(z)])
type_array.append(type)
r_array = np.array(r_array)/10 # To nm
type_array = np.array(type_array)
return Molecule.from_arrays(r_array=r_array, type_array=type_array)
def write(self, feature, mol):
self.check_feature(feature, "write")
lines = []
2.4. Input and Output Routines
17
chemlab Documentation, Release 0.4
if feature == 'molecule':
lines.append(str(mol.n_atoms))
lines.append('Generated by chemlab')
for t, (x, y, z) in zip(mol.type_array, mol.r_array):
lines.append('
%s
%.6f
%.6f
%.6f' %
(t, x*10, y*10, z*10))
self.fd.write('\n'.join(lines))
A few remarks:
• It is recommended to use the method check_feature() before performing read/write. This will check
that the feature is present in the can_read/can_write list;
• If you want to squeeze out performance you should use Molecule.from_arrays()
System.from_arrays();
and
• You can read whatever data you wish, for example the EdrIO handler does not read Molecule or System at
all;
• You can definitely take inspiration from the handlers included in chemlab, Supported File Formats.
2.5 Graphics and Visualization
2.5.1 Intro
The chemlab.graphics package is one of the most interesting aspects of chemlab, that sets him apart from similar
programs.
The purpose of the package is to provide a solid library to develop 3D applications to display chemical data in an
flexible way. For example it’s extremely easy to build a molecular viewer and add a bunch of custom features to it.
The typical approach when developing a graphics application is to create a QtViewer instance and add 3D features
to it:
>>> from chemlab.graphics import QtViewer
>>> v = QtViewer()
now let’s define a molecule. We can use the chemlab.db module to get a water template.
>>>
>>>
>>>
>>>
>>>
18
from chemlab.graphics.renderers import AtomRenderer
from chemlab.db import ChemlabDB
water = ChemlabDB().get('molecule', 'example.water')
ar = v.add_renderer(AtomRenderer, water.r_array, water.type_array)
v.run()
Chapter 2. User Manual
chemlab Documentation, Release 0.4
In this way you should be able to visualize a molecule where each atom is represented as a sphere. There are also a
set of viewing controls:
• Mouse Drag (Left Click) or Left/Right/Up/Down: Rotate the molecule
• Mouse Drag (Right Click): Pan the view
• Mouse Wheel or +/-: Zoom in/out
In a similar fashion it is possible to display other features, such as boxes, cylinders, lines, etc. It is useful to notice that
with Viewer.add_renderer we are not passing an instance of the renderer, but we’re passing the renderer class
and its respective constructor arguments. The method Viewer.add_renderer returns the actual instance.
It is possible as well to overlay 2D elements to a scene in a similar fashion, this will display a string at the screen
position 300, 300:
from chemlab.graphics.uis import TextUI
tui = v.add_ui(TextUI, 300, 300, "Hello, World!")
Anyway, I encourage you to use the powerful Qt framework to provide interaction and widgets to your application.
2.5. Graphics and Visualization
19
chemlab Documentation, Release 0.4
2.5.2 Renderers
Renderers are simply classes used to draw 3D objects. They are tecnically required to provide just one method, draw
and they must take an instance of QChemlabWidget as their first argument (check out the AbstractRenderer
class). In this way they provide the maximum flexibility required to build efficient opengl routines. Renderers may be
subclass other renderers as well as use other renderers.
A very useful renderer is TriangleRenderer, used to render efficiently a list of triangles, it constitutes a basis for
writing other renderers. TriangleRenderer works like this: you pass the vertices, normals and colors of the triangles
and it will display a set of triangles in the world:
from chemlab.graphics import QtViewer
from chemlab.graphics.renderers import TriangleRenderer
from chemlab.graphics.colors import green
import numpy as np
vertices = np.array([[0.0, 0.0, 0.0], [0.0, 1.0, 0.0], [1.0, 0.0, 0.0]])
normals = np.array([[0.0, 0.0, 1.0], [0.0, 0.0, 1.0], [0.0, 0.0, 1.0]])
colors = np.array([green, green, green])
v = QtViewer()
v.add_renderer(TriangleRenderer, vertices, normals, colors)
v.run()
20
Chapter 2. User Manual
chemlab Documentation, Release 0.4
If you pass 6 vertices/normals/colors, it will display 2 triangles and so on. As a sidenote, it is very efficient and in fact
chemlab.graphics.renderers.TriangleRenderer is used as a backend for a lot of other renderers such
as SphereRenderer and CylinderRenderer. If you can reduce a shape in triangles, you can easily write a
renderer for it.
In addition to that, TriangleRenderer provides also a method to update vertices, normals and colors. We can
demonstrate that from the last example by defining an update function that rotates our triangle:
from chemlab.graphics.transformations import rotation_matrix
def update():
y_axis = np.array([0.0, 1.0, 0.0])
# We take the [:3,:3] part because rotation_matrix can be used to
# rotate homogeneous (4D) coordinates.
rot = rotation_matrix(3.14/32, y_axis)[:3, :3]
# This is the numpy-efficient way of applying rot to each coordinate
vertices[:] = np.dot(vertices, rot.T)
normals[:] = np.dot(vertices, rot.T)
tr.update_vertices(vertices)
tr.update_normals(normals)
v.widget.update()
v.schedule(update, 10)
v.run()
2.5.3 Post Processing Effects
New in version 0.3.
Post processing effects are a great way to increase the visual quality of your representations. Those effects are applied
after the scene is rendered and they can be applied one after each other to achieve a combination of effects.
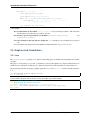
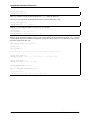
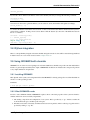
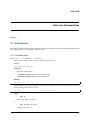
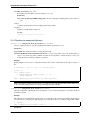
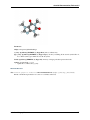
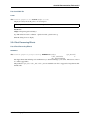
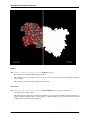
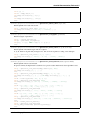
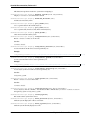
Applying a post processing effect is extremely easy. Let’s see we are viewing a big molecule with lots of pockets, such
as a protein. Grab the protein 3ZJE , load it into chemlab and display it using a simple Van der Waals representation:
from chemlab.graphics import QtViewer
from chemlab.graphics.renderers import AtomRenderer
from chemlab.io import datafile
protein = datafile("3ZJE.pdb").read("molecule")
v = QtViewer()
v.add_renderer(AtomRenderer, protein.r_array, protein.type_array)
v.run()
You’ll get a representation like this:
2.5. Graphics and Visualization
21
chemlab Documentation, Release 0.4
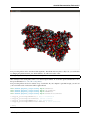
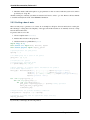
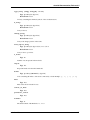
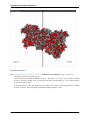
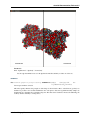
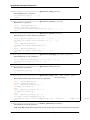
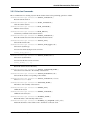
This representation doesn’t really show the molecule surface features, plus it looks dull and plasticky. We can add the
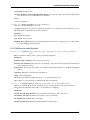
screen space ambient occlusion effect to improve its visual quality.
Screen space ambient occlusion (SSAO) is a very powerful technique used by numerous videogames to make the
illumination much more realistic, by darkening the more occluded areas of the objects, such as pockets and surface
features.
Chemlab implements this effect in the SSAOEffect class. To apply it to the scene it’s sufficient to add this simple
line:
from chemlab.graphics.postprocessing import SSAOEffect
v.add_post_processing(SSAOEffect)
v.run()
What you’ll get is this, with a much-improved visual quality:
22
Chapter 2. User Manual
chemlab Documentation, Release 0.4
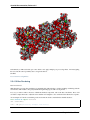
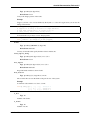
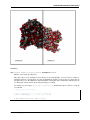
Post processing effects can be customized with arguments. The SSAO effect may have a dirty look, you can fix that
by changing the parameter kernel_size, which default to 32, with a max value of 128:
v.add_post_processing(SSAOEffect, kernel_size=128)
This will improve the visual quality at the cost of decreased performance. To see all the options available take look at
the api documentation List of Post Processing Effects.
Post processing effects can also be stacked on top of each other. If your computer is powerful enough, you can load
your scene with a stack of effects that will be applied in turn:
from
from
from
from
chemlab.graphics.postprocessing
chemlab.graphics.postprocessing
chemlab.graphics.postprocessing
chemlab.graphics.postprocessing
import
import
import
import
SSAOEffect
OutlineEffect
FXAAEffect
GammaCorrectionEffect
v.add_post_processing(SSAOEffect) # better illumination
v.add_post_processing(OutlineEffect) # black outlines
v.add_post_processing(FXAAEffect) # fast antialiasing
v.add_post_processing(GammaCorrectionEffect) # color correction
v.run()
2.5. Graphics and Visualization
23
chemlab Documentation, Release 0.4
Unfortunately on ATI cards with open source drivers can’t apply multiple post processing effects. I’m investigating
the issue, but this can be potentially due to a bug in the drivers.
See also:
List of Post Processing Effects
2.5.4 Offline Rendering
New in version 0.3.
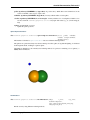
With chemlab you can produce renderings programmatically without having to display anything or tinkering with the
user interface. This feature comes pretty useful when generating reports with a lot of pictures.
Let’s say you want to make a showcase of different chemical compounds, such as the first four alkanes. First of all
we’ll take a sample molecule to adjust the looks and then we’ll adapt the code to render all of the alkanes in a sequence.
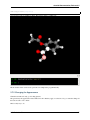
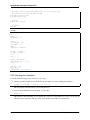
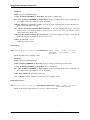
As an example we’ll tweak our rendering on the norbornene molecule contained in the chemlab database:
from chemlab.db import ChemlabDB
cdb = ChemlabDB()
norb = cdb.get("molecule", "example.norbornene")
24
Chapter 2. User Manual
chemlab Documentation, Release 0.4
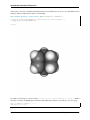
We want to do the rendering of this molecule using a space fill representation, this can be achieved by using the
AtomRenderer, which will render each atom as a sphere with its Van Der Waals radius:
from chemlab.graphics import QtViewer
from chemlab.graphics.renderers import AtomRenderer
v = QtViewer()
atom_rend = v.add_renderer(AtomRenderer, norb.r_array, norb.type_array)
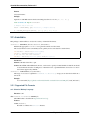
After we’ve got the renderer in place we can programmatically manipulate the camera to adjust at the right zoom level.
You can, for instance, use the chemlab.graphics.camera.Camera.autozoom() method to automatically
adjust the scene, but you are free to use any other method present in the Camera class:
v.widget.camera.autozoom(norb.r_array)
v.run()
2.5. Graphics and Visualization
25
chemlab Documentation, Release 0.4
At this point, you are free experiment with different effects and combinations. In our case we’ll add SSAO and anti
aliasing to add more depth and smoothness to the rendering:
from chemlab.graphics.postprocessing import SSAOEffect, FXAAEffect
v.add_post_processing(SSAOEffect, kernel_size=128, kernel_radius=1.0)
v.add_post_processing(FXAAEffect)
v.run()
To actually save the image you can now use the chemlab.graphics.QChemlabWidget.toimage() method
and select a resolution of 800x800 pixels. This will return a PIL image, that has a save method to store it as a png:
img = v.widget.toimage(800, 800)
img.save("norb.png")
26
Chapter 2. User Manual
chemlab Documentation, Release 0.4
Once we’ve got the sample molecule up and running it’s very easy to automatize the process to produce
images of different molecules. In the following code we prepare the QtViewer with the effects, we call
v.widget.initializeGL() in place of v.show() and for each molecule we add an AtomRenderer and adjust
the camera:
from
from
from
from
chemlab.db import CirDB
chemlab.graphics import QtViewer
chemlab.graphics.renderers import AtomRenderer
chemlab.graphics.postprocessing import FXAAEffect, SSAOEffect
# A series of compounds to display
compounds = ["methane", "ethane", "propane", "butane"]
db = CirDB()
# Prepare the viewer
v = QtViewer()
v.widget.initalizeGL() # Needed if you don't call show()
v.add_post_processing(SSAOEffect, kernel_size=128, kernel_radius=1.0)
v.add_post_processing(FXAAEffect)
for compound in compounds:
mol = db.get("molecule", compound)
rend = v.add_renderer(AtomRenderer, mol.r_array, mol.type_array)
v.widget.camera.autozoom(mol.r_array)
# Give some extra zoom
v.widget.camera.mouse_zoom(1.0)
v.widget.toimage(300, 300).save(compound + '.png')
# Cleanup
v.remove_renderer(rend)
2.5. Graphics and Visualization
27
chemlab Documentation, Release 0.4
28
Chapter 2. User Manual
chemlab Documentation, Release 0.4
This example is stored in the chemlab/examples/offline_rendering.py file.
2.5. Graphics and Visualization
29
chemlab Documentation, Release 0.4
2.5.5 Tutorial: TetrahedronRenderer
Note: This section is mainly for developers.
In this section, we’ll see how to write a renderer that will display several tetrahedrons. We will write our TetrahedronRenderer based on TriangleRenderer. To do that we first need to understand how a tetrahedron is made, and how can
we define the vertices that make the tetrahedron.
First of all, we need to have the 4 coordinates that represents a tetrahedron. Without even trying to visualize it, just
pick the values straight from Wikipedia:
import numpy as np
v1 = np.array([1.0, 0.0, -1.0/np.sqrt(2)])
v2 = np.array([-1.0, 0.0, -1.0/np.sqrt(2)])
v3 = np.array([0.0, 1.0, 1.0/np.sqrt(2)])
v4 = np.array([0.0, -1.0, 1.0/np.sqrt(2)])
We can quickly verify if this is correcty by using a PointRenderer:
from chemlab.graphics import QtViewer
from chemlab.graphics.renderers import PointRenderer
from chemlab.graphics.colors import black, green, blue, red
colors = [black, green, blue, red]
v = QtViewer()
v.add_renderer(PointRenderer, np.array([v1, v2, v3, v4]), colors)
v.run()
We’ve got 4 boring points that look like they’re at the vertices of a tetrahedron. Most importantly we learned that we
can use PointRenderer to quickly test shapes.
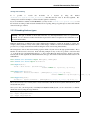
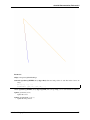
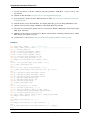
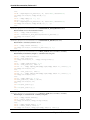
Now let’s define the four triangles (12 vertices) that represent a solid tetrahedron. It is good practice to put the triangle
vertices in a certain order to estabilish which face is pointing outside and which one is pointing inside for optimization
reasons. The convention is that if we specify 3 triangle vertices in clockwise order this means that the face points
outwards from the solid:
30
Chapter 2. User Manual
chemlab Documentation, Release 0.4
We can therefore write our vertices and colors:
vertices = np.array([
v1, v4, v3,
v3, v4, v2,
v1, v3, v2,
v2, v4, v1
])
colors = [green] * 12
All is left to do is write the normals to the surface at each vertex. This is easily done by calculating the cross product
of the vectors constituting two sides of a triangle (remember that the normals should point outward) and normalize the
result:
n1 = -np.cross(v4 - v1, v3 - v1)
n1 /= np.linalg.norm(n1)
n2 = -np.cross(v4 - v3, v2 - v3)
n2 = np.linalg.norm(n2)
n3 = -np.cross(v3 - v1, v2 - v1)
n3 /= np.linalg.norm(n3)
n4 = -np.cross(v4 - v2, v1 - v2)
n4 /= np.linalg.norm(n4)
2.5. Graphics and Visualization
31
chemlab Documentation, Release 0.4
normals = [n1,
n2,
n3,
n4,
n1,
n2,
n3,
n4,
n1,
n2,
n3,
n4]
from chemlab.graphics.renderers import TriangleRenderer
v.add_renderer(TriangleRenderer, vertices, normals, colors)
v.run()
Now that we’ve got the basic shape in place we can code the actual Renderer class to be used directly with the viewer.
We will make a renderer that, given a set of coordinates will display many tetrahedra.
We can start by defining a Renderer class, inheriting from AbstractRenderer, the main thing you should notice is that
you need an additional argument widget that will be passed when you use the method QtViewer.add_renderer:
from chemlab.graphics.renderers import AbstractRenderer
class TetrahedraRenderer(AbstractRenderer):
def __init__(self, widget, positions):
super(TetrahedraRenderer, self).__init__(widget)
...
The strategy to implement a multiple-tetrahedron renderer will be like this:
• store the triangle vertices, and normals of a single tetrahedra.
• for each position that we pass, translate the vertices of the single tetrahedra and accumulate the obtained vertices
in a big array.
• repeat the normals of a single tetrahedra for the number of tetrahedra we’re going to render.
• generate the per-vertex colors (green for simplicity)
• create a TriangleRenderer as an attribute and initialize him with the accumulated vertices, normals, and colors
• reimplement the draw method by calling the draw method of our trianglerenderer.
You can see the code in this snippet:
class TetrahedraRenderer(AbstractRenderer):
def __init__(self, widget, positions):
super(TetrahedraRenderer, self).__init__(widget)
v1
v2
v3
v4
=
=
=
=
np.array([1.0, 0.0, -1.0/np.sqrt(2)])
np.array([-1.0, 0.0, -1.0/np.sqrt(2)])
np.array([0.0, 1.0, 1.0/np.sqrt(2)])
np.array([0.0, -1.0, 1.0/np.sqrt(2)])
positions = np.array(positions)
# Vertices of a single tetrahedra
self._th_vertices = np.array([
v1, v4, v3,
v3, v4, v2,
v1, v3, v2,
v2, v4, v1
])
self._th_normals = np.array([
n1, n1, n1,
n2, n2, n2,
32
Chapter 2. User Manual
chemlab Documentation, Release 0.4
n3, n3, n3,
n4, n4, n4])
self.n_tetra = len(positions)
tot_vertices = []
for pos in positions:
tot_vertices.extend(self._th_vertices + pos)
# Refer to numpy.tile, this simply repeats the elements
# of the array in an efficient manner.
tot_normals = np.tile(self._th_normals, (self.n_tetra, 1))
tot_colors = [green] * self.n_tetra * 12
# !NOTICE! that we have to pass widget as the first argument
self.tr = TriangleRenderer(widget, tot_vertices,
tot_normals, tot_colors)
def draw(self):
self.tr.draw()
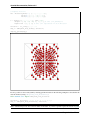
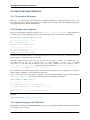
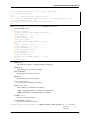
To demostrate let’s draw a grid of 125 tetrahedra:
positions = []
for x in range(5):
for y in range(5):
for z in range(5):
positions.append([float(x)*2, float(y)*2, float(z)*2])
v.add_renderer(TetrahedraRenderer, positions)
v.widget.camera.position = np.array([0.0, 0.0, 20.0])
v.run()
2.5. Graphics and Visualization
33
chemlab Documentation, Release 0.4
If you had any problem with the tutorial or you want to implement other kind of renderers don’t exitate to contact me.
The full code of this tutorial is in chemlab/examples/tetrahedra_tutorial.py.
2.6 Database Support
Typing every time your molecules and system is not fun nor efficient, for this reason chemlab provides ready-to-use
database utilities.
Databases in chemlab can store arbitrary data, that can be retrieved by using the get method. The following is an
example retrieving a molecular structure from CIR http://cactus.nci.nih.gov/chemical/structure , the chemical resolve
identifier website:
from chemlab.db.cirdb import CirDB
mol = CirDB().get("molecule", "aspirine")
Note: CirDB uses internally the CirPy wrapper https://github.com/mcs07/CIRpy , all credits go to the author.
Chemlab includes also his own database for data as well as some molecules. For example to get the vdw radii (the
data was taken from OpenBabel) you can:
34
Chapter 2. User Manual
chemlab Documentation, Release 0.4
from chemlab.db import ChemlabDB
cdb = ChemlabDB()
vdw = cdb.get("data", "vdwdict")
vdw['He']
For more information refer to the chemlab.db.ChemlabDB documentation.
See also:
chemlab.db
2.6.1 Having your own molecular database
It may happen that you have your most-frequently used collection of molecules and systems. Chemlab provides a
serialization system that let you easily dump your objects in a directory and retrieve them by using a local database.
This is achieved by the class chemlab.db.LocalDB:
from chemlab.db import LocalDB
ldb = LocalDB('/path/to/yourdb')
# Generate/retrieve some molecule
ldb.store('molecule', 'examplemol', mol)
ldb.store('system', 'examplesys', sys)
The method chemlab.db.LocalDB.store() takes a first argument that can be ither molecule or system, as a
second argument the key used to store/retrieve the entry and finally the object to store.
You can, at a later time retrieve the entries in this way:
from chemlab.db import LocalDB
ldb = LocalDB('/path/to/yourdb')
mol = ldb.get('molecule', 'examplemol')
s = ldb.get('system', 'examplesys')
The molecules files are serialized using the json format and stored in a very simple directory structure. For the previous
example, the database directory would look like this:
/path/to/yourdb/
- molecule/
- examplemol.json
- system/
- examplesys.json
The reason for such a simple structure is that in the future it will be easy to define custom-made remote database, for
example you could have a community mantained github repo with commonly used molecules and data, that can be
directly accessed by chemlab (everybody is welcome to develop such an extension). On top of that, you can copy-paste
json molecule files without having to do any migration.
See also:
chemlab.db
2.6. Database Support
35
chemlab Documentation, Release 0.4
2.7 Molecular Viewer
The Chemlab molecular viewer is novel way for interacting, editing and analyzing chemical data. The chemlab
philosophy is that the program should be really easy to extend; there are so many applications in chemistry and
physics and the user shouldn’t be limited to the built-in functionalities of the program.
2.7.1 Quick Start
You can start the chemlab molecular viewer by typing:
chemlab view
This will load the user interface consisting of the viewer, and an IPython shell.
You can start typinc commands in the IPython shell and changes will appear immediately in the viewer. Downloading
a molecule from the web is really easy with the command chemlab.mviewer.api.download_molecule():
36
Chapter 2. User Manual
chemlab Documentation, Release 0.4
download_molecule('aspirine')
You can select atoms by clicking on them. The selection effect is a white glow.
The molecular viewer can be used to perform some simple tasks programmatically.
2.7.2 Changing the Appeareance
Chemlab can make seriously good-looking pictures.
The general way the appeareance-related function work is that they apply on selections. Say, you want the change all
the Carbon atom colors to black.
This is really easy to do:
2.7. Molecular Viewer
37
chemlab Documentation, Release 0.4
select_atom_type('C')
change_color('black')
The colors available as string are the standard HTML colors, written in underscore.
You can also pass rgba tuples in the range 0-255. Please, leave the alpha value to 255:
select_atom_type('C')
change_color((0, 0, 0, 255))
Similarly you can change the radius of certain atoms or scale them:
select_all()
scale_atoms(2.0) # Scale Factor
change_radius(0.15) # Exact value in nm
Perhaps the most interesting feature are the post processing effects, the most interesting is called ‘ssao’ or Screen
Space Ambient Occlusion. It enhances the picture by giving nice shadows in the more occluded areas, take a look at
the picture generated by this code:
download_molecule('testosterone')
select_all()
scale_atoms(2.0)
# We make the colors brighter, ssao works best on light colors.
select_atom_type('C')
change_color((210, 210, 210, 0)) # That's a very light gray
select_atom_type('O')
change_color((255, 163, 163, 255))
change_background('white')
pp_id = add_post_processing('ssao')
# For max quality
# add_post_processing('ssao', kernel_size=128)
38
Chapter 2. User Manual
chemlab Documentation, Release 0.4
There is a good amount of shadows, you can also setup other effects such as anti aliasing and gamma correction:
add_post_processing('fxaa')
add_post_processing('gamma')
The function add_post_processing() returns a string id that you can use to remove the effect or to change its
options. To list all the available post processing effects, use the function list_post_processing():
list_post_processing()
# ['ssao1', 'fxaa2', 'gamma3']
change_post_processing_options('ssao1', kernel_size=128)
remove_post_processing('fxaa2')
clear_post_processing()
2.7. Molecular Viewer
39
chemlab Documentation, Release 0.4
2.7.3 Loading Data
The Chemlab molecular viewer provides quite handy function to load some data into it:
load_system("file.gro")
load_molecule("file.cml")
You can also download the molecule from a web database by its common name:
download_molecule('aspirine')
Or you can also download and open a file from a remote location using directly its URL:
load_remote_system('https://raw.github.com/chemlab/chemlab-testdata/master/naclwater.gro')
load_remote_molecule('https://raw.github.com/chemlab/chemlab-testdata/master/benzene.mol')
Loading Trajectories
Chemlab supports the loading of trajectory files (for example the xtc files from GROMACS). After you load a system
you can attach some trajectory data with load_trajectory or load_remote_trajectory:
load_system('water.gro')
load_trajectory("traj.xtc")
We can run a small test using the test files from chemlab:
load_remote_system('https://raw.github.com/chemlab/chemlab-testdata/master/water.gro')
load_remote_trajectory('https://github.com/chemlab/chemlab-testdata/raw/master/trajout.xtc')
A series of commands will appear, and you can move through the trajectory by dragging the bar or the Play/Stop
button.
You can also move programmatically using the function goto_time and goto_frame and inspect with the functions
current_time and current_frame
2.7.4 Selections
In Chemlab you select and operate on atoms and bonds.
You can use the built-in functions to select according to various types:
select_atoms([0, 1, 2])
select_atom_type('Na')
select_molecules('H2O')
select_all()
select_within([0, 1], 0.2)
You can also act on the selection in different ways:
invert_selection()
clear_selection()
Each selection routine returns a Selection object, that contains information on the selection state, so you can use
it later:
select_atoms([0, 1, 2])
Selection([0, 1, 2], tot=6)
40
Chapter 2. User Manual
chemlab Documentation, Release 0.4
The Selection() Selection objects have an API to be combined. For example if you want to select Na and Cl
atoms you can do in this way, using the function select_selection():
na_at = select_atoms('Na')
cl_at = select_atoms('Cl')
select_selection({'atoms' : na_at.add(cl_at)})
You can retrieve the currently selected atoms and bonds indices in the following way:
selected_atoms()
selected_bonds()
2.7.5 Hiding and Showing
Sometimes you want to hide certain objects from the current view to remove clutter. For example if you want to select
all the water molecules and hide them:
select_molecules('H2O')
hide()
There’s also a conveniency function to do this:
hide_water()
You can also select hidden objects and show them:
select_hidden()
show()
2.7.6 Writing your own commands
The built-in commands provide a quick and easy way to operate on your molecules and they provide basic functionality.
The true power of chemlab relies in the possibility to write and load your commands using the power and simplicity
of Python.
For example we can write a command that calculates automatically the distance between two selected atoms. We can
open a file utils.py and put the following code in it:
import numpy as np
def distance():
sel = selected_atoms()
if len(sel) != 2:
print("Only two atoms must be selected")
return
else:
# Here we use numpy fancy indexing
a, b = current_system().r_array[sel]
return np.linalg.norm(b - a)
How can we access this function from a chemlab session?
The chemlab shell is just a regular Python shell, so one solution will be to simply add the directory to your
PYTHONPATH and import it manually.
However, chemlab provides an init file that lets you write some code that will be called at initialization time.
2.7. Molecular Viewer
41
chemlab Documentation, Release 0.4
The file is stored in the path .chemlab/scripts/__init__.py. To automatically load the command
distance we have to first put the file utils.py in the directory .chemlab/scripts/ and add the following
line to the __init__ file
from .utils import distance
You can easily write and hook in a lot of extensions. Please write something useful (You will!) and attach your code
on the chemlab github page https://github.com/chemlab/chemlab/issues?labels=extension&milestone=&state=open
Select within a radius
In this section we’ll see another example on how to implement a new function in chemlab. We want to select all
the atoms within a certain distance from the currently selected atoms. We can create a file in the directory ~/.chemlab/scripts/distances.py and we will implement a function like this that will operate on the current selection:
def select_within(radius):
pass
The implementation will be as follows:
for each atom:
find the neighbours atoms
select them
In chemlab term we have to do this (the implementation is a bit inefficient, but it’s more readable):
from chemlab.mviewer.toolboxes.selection import selected_atoms
def select_within(radius):
neighbours = []
for i_central in selected_atoms():
r_central = current_system().r_array[i_central]
for r in current_system().r_array:
dist = np.linalg.norm(r - r_central)
if dist < radius:
neighbours.append(i)
select_atoms(np.unique(neighbours))
Now let’s test how this works in a chemlab session. First of all let’s add automatically the function to the file .chemlab/scripts/__init__.py:
from .myutils import select_within
Now when you start chemlab this command will be made available immediately.
Distance between two atoms
In this section we will see how to use chemlab to find the interatomic distance between two selected atoms using the
core functions.
Chemlab gives you some basic functions to change and retrieve information of what’s currently displayed in the view.
For example, to get the current System instance being displayed you can type:
42
Chapter 2. User Manual
chemlab Documentation, Release 0.4
current_system()
If you want to know which are the indexes of the atoms currently selected you can type the following command:
selected_atoms()
# array([ 0, 1])
You can also do the reverse, given the indexes you can select two atoms, the interface will update accordingly:
select_atoms([0, 1])
To calculate the distance between the selected atoms, we have to first retrieve their indexes and then use the System to
retrieve their coordinates. At that point we can use them to find the distance (it’s the norm of the difference between
the two coordinates):
selected = selected_atoms()
s = current_system()
a, b = s.r_array[selected]
import numpy as np
distance = np.linalg.norm(a - b)
2.8 IPython integration
There is some preliminary integration between chemlab and ipython notebook, that will be extended and generalized
in future releases. To see it in action, head over the example notebook
2.9 Using GROMACS with chemlab
GROMACS is one of the most used packages for molecular simulations, chemlab can provide a modern and intuitive
interface to generate input and analyze the output of GROMACS calculations. To illustrate the concepts we’ll perform
a very simple simulation of liquid water.
2.9.1 Installing GROMACS
This depends on the system you’re using but I believe that GROMACS is already packaged for most linux distributions
and also for other operating systems.
In Ubuntu:
$ sudo apt-get install gromacs
2.9.2 What GROMACS needs
In order to run a minimum simulation GROMACS requires to know some basic properties of the system we intend to
simulate. This boils down to basically 3 ingredients:
1. The starting composition and configuration of our system. This is provided by a ”.gro” file that contains the
atom and molecule types, and their position in space.
2. Information about the connectivity and interactions between our particles. This is called topology file and it is
provided by writing a ”.top” file.
2.8. IPython integration
43
chemlab Documentation, Release 0.4
3. Simulation method. This will require us to give parameters on how we want to make the system evolve. This is
provided by an ”.mdp” file.
chemlab can help us to build any system that we want and we’ll use it to write a ”.gro” file. Then we will use chemlab
to visualize and analyze the result of the GROMACS simulation.
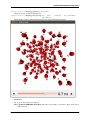
2.9.3 Crafting a box of water
There are many ways to generate a box of water, in our example we will place 512 water molecules in a cubic grid.
The advantages of doing that is the simplicity of the approach and the fact that we are naturally avoid any overlap
between adiacent molecules.
To generate such a box we will:
1. Create a template water Molecule;
2. Translate this molecule on the grid points
3. Add the molecule to a preinitialized System.
import numpy as np
from chemlab.core import Atom, Molecule, System
from chemlab.graphics import display_system
# Spacing between two grid points
spacing = 0.3
# an 8x8x8 grid, for a total of 512 points
grid_size = (8, 8, 8)
# Preallocate the system
# 512 molecules, and 512*3 atoms
s = System.empty(512, 512*3)
# Water template, it contains export informations for gromacs
# more about export later...
water_tmp = Molecule([Atom('O', [0.0, 0.0, 0.0], export={'grotype': 'OW'}),
Atom('H', [0.1, 0.0, 0.0], export={'grotype': 'HW1'}),
Atom('H', [-0.03333, 0.09428, 0.0], export={'grotype':'HW2'})],
export={'groname': 'SOL'})
for a in range(grid_size[0]):
for b in range(grid_size[1]):
for c in range(grid_size[2]):
grid_point = np.array([a,b,c]) * spacing # array operation
water_tmp.move_to(grid_point)
s.add(water_tmp)
# Adjust boxsize for periodic boundary conditions
s.box_vectors = np.eye(3) * (8 * spacing)
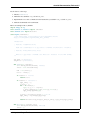
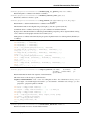
# Visualize to verify that the system was setup correctly
display_system(s)
If you run this, it will display the following window:
44
Chapter 2. User Manual
chemlab Documentation, Release 0.4
Awesome! Now we can write the ”.gro” file. Notice that when we defined our water molecule we had to pass an export
dictionary to the atoms and molecules. The export mechanism is the way used by chemlab to handle all the variety of
different file formats.
In this specific case, gromacs defines its own atom and molecule names in the ”.top” file and then matches those to the
”.gro” file to infer the bonds and interactions.
TODO Add picture of the export dictionary
How do we write the .gro file? Since we’ve already setup our export information, this is an one-liner:
from chemlab.io import datafile
datafile("start.gro", "w").write("system", s)
2.9.4 .top and .mdp files
I’ll give you directly the gromacs input files to do an NPT simulation of water, just create those files in your working
directory:
topol.top
2.9. Using GROMACS with chemlab
45
chemlab Documentation, Release 0.4
; We simply import ready-made definitions for the molecule type
; SOL and the atom types OW, HW1 and HW2
#include "ffoplsaa.itp"
#include "spce.itp"
[ system ]
Simple box of water
[ molecules ]
SOL 512
run.mdp
integrator = md
dt = 0.001
nsteps = 200000
nstxtcout = 100
rlist = 0.9
coulombtype = pme
rcoulomb = 0.9
rvdw = 0.9
dispcorr = enerpres
tcoupl = v-rescale
tc-grps = System
ref_t = 300
tau_t = 0.1
pcoupl = berendsen
compressibility = 4.5e-5
ref_p = 1.0
gen_vel = yes
gen_temp = 300
constraints = all-bonds
2.9.5 Running the simulation
To run the simulation with gromacs we have to do two steps:
1. Generate a parameter input, this will check that our input make sense before running the simulation:
grompp_d -f run.mdp -c start.gro -p topol.top
This will generate a bunch of files in your working directory.
2. Now we run the simulation, in the meantime, go grab coffee:
mdrun_d -v
This will take a while depending on your machine. If you are not a coffee drinker, don’t worry, you can stop the
simulation by pressing Ctrl-C. The good news is that chemlab can read files from partial runs!
46
Chapter 2. User Manual
chemlab Documentation, Release 0.4
2.9.6 Viewing the results, the command-line way
To quickly preview trajectories and system energies you can use the script chemlab included in the distribution in
scripts/chemlab.
GROMACS can store the trajectory (in the form of atomic coordinates) in the .xtc file. To play the trajectory you can
use the command:
$ chemlab view start.gro --traj traj.xtc
Note: the nstxtcout = 100 option in the mdp file sets the output frequency in the xtc file
You may also be interested to look at some other properties, such as the potential energy, pressure, temperature and
density. This information is written by GROMACS in the ”.edr” file. You can use the chemlab script to view that:
$
$
$
$
chemlab
chemlab
chemlab
chemlab
gromacs
gromacs
gromacs
gromacs
energy
energy
energy
energy
ener.edr
ener.edr
ener.edr
ener.edr
-e
-e
-e
-e
Pressure
Temperature
Potential
Density
Warning: The chemlab gromacs command is a work in progress, the syntax may change in the future.
It is also possible to view and get the results by directly reading the files and have direct access to the xtc coordinates
and the energy stored in the edr files. Take a look at the reference for chemlab.io.handlers.XtcIO and
chemlab.io.handlers.EdrIO.
The tutorial is over, if you have any problem or want to know more, just drop an email on the mailing list [email protected] or file an issue on github https://github.com/chemlab/chemlab/issues
2.9. Using GROMACS with chemlab
47
chemlab Documentation, Release 0.4
48
Chapter 2. User Manual
CHAPTER 3
Reference Documentation
Packages
3.1 chemlab.core
This package contains general functions and the most basic data containers such as Atom, Molecule and System. Plus
some utility functions to create and edit common Systems.
3.1.1 The Atom class
class chemlab.core.Atom(type, r, export=None)
Create an Atom instance. Atom is a generic container for particle data.
See also:
Atoms, Molecules and Systems
Parameters
type: str Atomic symbol
r: {np.ndarray [3], list [3]} Atomic coordinates in nm
export: dict, optional Additional export information.
Example
>>> Atom('H', [0.0, 0.0, 0.0])
In this example we’re attaching additional data to the Atom instance. The chemlab.io.GroIO can use this information when exporting in the gro format.
>>> Atom('H', [0.0, 0.0, 0.0], {'groname': 'HW1'})
type
Type str
The atomic symbol e.g. Ar, H, O.
r
Type np.ndarray(3) of floats
Atomic position in nm.
49
chemlab Documentation, Release 0.4
mass
Type float
Mass in atomic mass units.
charge
Type float
Charge in electron charge units.
export
Type dict
Dictionary containing additional information when importing data from various formats.
See also:
chemlab.io.gro.GroIO
fields
Type tuple
This is a class attribute. The list of attributes that constitute the Atom. This is used to iterate over the Atom
attributes at runtime.
copy()
Return a copy of the original Atom.
classmethod from_fields(**kwargs)
Create an Atom instance from a set of fields. This is a slightly faster way to initialize an Atom.
Example
>>> Atom.from_fields(type='Ar',
r_array=np.array([0.0, 0.0, 0.0]),
mass=39.948,
export={})
3.1.2 The Molecule class
class chemlab.core.Molecule(atoms, bonds=None, export=None)
Molecule is a data container for a set of N Atoms.
See also:
Atoms, Molecules and Systems
Parameters
atoms: list of Atom instances Atoms that constitute the Molecule. Beware that the data gets copied and subsequend changes in the Atom instances will not reflect in the Molecule.
export: dict, optional Export information for the Molecule
r_array
Type np.ndarray((N,3), dtype=float)
Derived from Atom
An array with the coordinates of each Atom.
50
Chapter 3. Reference Documentation
chemlab Documentation, Release 0.4
type_array {numpy.array[N] of str}
Type np.ndarray(N, dtype=str)
Derived from Atom
An array containing the chemical symbols of the constituent atoms.
m_array
Type np.ndarray(N, dtype=float)
Derived from Atom
Array of masses.
charge_array
Type np.ndarray(N, dtype=float)
Derived from Atom
Array of the charges present on the atoms.
atom_export_array
Type np.ndarray(N, dtype=object) array of dicts
Derived from Atom
Array of Atom.export dicts.
n_atoms
Type int
Number of atoms present in the molecule.
export
Type dict
Export information for the whole Molecule.
bonds
Type np.ndarray((NBONDS,2), dtype=int)
A list containing the indices of the atoms connected by a bond. Example: [[0 1] [0 2] [3 4]]
mass
Type float
Mass of the whole molecule in amu.
center_of_mass
Type float
geometric_center
Type float
formula
Type str
The brute formula of the Molecule. i.e. "H2O"
3.1. chemlab.core
51
chemlab Documentation, Release 0.4
copy()
Return a copy of the molecule instance
classmethod from_arrays(**kwargs)
Create a Molecule from a set of Atom-derived arrays. Please refer to the Molecule Atom Derived Attributes. Only r_array and type_array are absolutely required, the others are optional.
>>> Molecule.from_arrays(r_array=np.array([[0.0, 0.0, 0.0],
[1.0, 0.0, 0.0],
[0.0, 1.0, 0.0]]),
type_array=np.array(['O', 'H', 'H']))
molecule(H2O)
Initializing a molecule in this way can be much faster than the default initialization method.
guess_bonds()
Guess the molecular bonds by using covalent radii information.
move_to(r)
Translate the molecule to a new position r.
tojson()
Return a json string representing the Molecule. This is useful for serialization.
3.1.3 The System class
class chemlab.core.System(molecules, box_vectors=None)
A data structure containing information of a set of N Molecules and NA Atoms.
Parameters
molecules: list of molecules Molecules that constitute the System. The data gets copied to the System, subsequent changes to the Molecule are not reflected in the System.
box_vectors: np.ndarray((3,3), dtype=float), optional You can specify a periodic box of another shape by
giving 3 box vectors.
The System class has attributes derived both from the Molecule and the Atom class.
r_array
Type np.ndarray((NA, 3), dtype=float)
Derived from Atom
Atomic coordinates.
m_array
Type np.ndarray(NA, dtype=float)
Derived from Atom
Atomic masses.
type_array
Type np.ndarray(NA, dtype=object) array of str
Derived from Atom
Array of all the atomic symbols. It can be used to select certain atoms in a system.
charge_array
52
Chapter 3. Reference Documentation
chemlab Documentation, Release 0.4
Type np.ndarray(N, dtype=float)
Derived from Atom
Array of the charges present on the atoms.
Example
Suppose you have a box of water defined by the System s, to select all oxygen atoms you can use the
numpy selection rules:
>>> oxygens = s.type_array == 'O'
# oxygens is an array of booleans of length NA where
# each True corresponds to an oxygen atom i.e:
# [True, False, False, True, False, False]
You can use the oxygen array to access other properties:
>>> o_coordinates = s.r_array[oxygens]
>>> o_indices = np.arange(s.n_atoms)[oxygens]
bonds
Type np.ndarray((NBONDS, 2), dtype=int)
Derived from Molecule
An array of 2d indices that specify the index of the bonded atoms.
atom_export_array
Type np.ndarray(NA, dtype=object) array of dict
Derived from Atom
mol_export
Type np.ndarray(N, dtype=object) array of dict
Derived from Molecule
Export information relative to the molecule.
box_vectors
Type np.ndarray((3,3), dtype=float) or None
Those are the three vectors that define of the periodic box of the system.
Example
To define an orthorombic box of size 3, 4, 5 nm:
>>> np.array([[3.0, 0.0, 0.0], # Vector a
[0.0, 4.0, 0.0], # Vector b
[0.0, 0.0, 5.0]]) # Vector c
n_mol
Type int
Number of molecules.
n_atoms
Type int
Number of atoms.
3.1. chemlab.core
53
chemlab Documentation, Release 0.4
mol_indices
Type np.ndarray(N, dtype=int)
Gives the starting index for each molecule in the atomic arrays. For example, in a System comprised of 3
water molecules:
>>> s.mol_indices
[0, 3, 6]
>>> s.type_array[0:3]
['O', 'H', 'H']
This array is used internally to retrieve all the Molecule derived data. Do not modify unless you know
what you’re doing.
mol_n_atoms
Type np.ndarray(N, dtype=int)
Contains the number of atoms present in each molecule
add(mol)
Add the molecule mol to a System initialized through System.empty.
atom_to_molecule_indices(selection)
Given the indices over atoms, return the indices over molecules. If an atom is selected, all the containing
molecule is selected too.
Parameters
selection: np.ndarray((N,), dtype=int) | np.ndarray((NATOMS,), dtype=book) Either an index array
or a boolean selection array over the atoms
Returns
np.ndarray((N,), dtype=int) an array of molecular indices.
copy()
Return a copy of the current system.
classmethod empty(n_mol, n_atoms, box_vectors=None)
Initialize an empty System containing n_mol Molecules and n_atoms Atoms. The molecules can be added
by using the method add().
Example
How to initialize a system of 3 water molecules:
s = System.empty(3, 9)
for i in range(3):
s.add(water)
classmethod from_arrays(**kwargs)
Initialize a System from its constituent arrays. It is the fastest way to initialize a System, well suited for
reading one or more big System from data files.
Parameters
The following parameters are required:
•r_array
•type_array
•mol_indices
54
Chapter 3. Reference Documentation
chemlab Documentation, Release 0.4
To further speed up the initialization process you optionally pass the other derived arrays:
•m_array
•mol_n_atoms
•atom_export_array
•mol_export
Example
Our classic example of 3 water molecules:
r_array = np.random.random((3, 9))
type_array = ['O', 'H', 'H', 'O', 'H', 'H', 'O', 'H', 'H']
mol_indices = [0, 3, 6]
System.from_arrays(r_array=r_array, type_array=type_array,
mol_indices=mol_indices)
classmethod from_json(string)
Create a System instance from a json string.
chemlab.core.System.tojson()
Such strings are produced from the method
get_molecule(index)
Get the Molecule instance corresponding to the molecule at index.
This method is useful to use Molecule properties that are generated each time, such as Molecule.formula
and Molecule.center_of_mass
guess_bonds()
Guess the bonds between the molecules constituent of the system.
mol_to_atom_indices(indices)
Given the indices over molecules, return the indices over atoms.
Parameters
indices: np.ndarray((N,), dtype=int) Array of integers between 0 and System.n_mol
Returns
np.ndarray((N,), dtype=int) the indices of all the atoms belonging to the selected molecules.
remove_atoms(indices)
Remove the atoms positioned at indices. The molecule containing the atom is removed as well.
If you have a system of 10 water molecules (and 30 atoms), if you remove the atoms at indices 0, 1 and 29
you will remove the first and last water molecules.
Parameters
indices: np.ndarray((N,), dtype=int) Array of integers between 0 and System.n_atoms
remove_molecules(indices)
Remove the molecules positioned at indices.
For example, if you have a system comprised of 10 water molecules you can remove the first, fifth and
nineth by using:
system.remove_molecules([0, 4, 8])
Parameters
indices: np.ndarray((N,), dtype=int) Array of integers between 0 and System.n_mol
3.1. chemlab.core
55
chemlab Documentation, Release 0.4
reorder_molecules(new_order)
Reorder the molecules in the system according to new_order.
Parameters
new_order: np.ndarray((NMOL,), dtype=int) An array of integers containing the new order of the system.
sort()
Sort the molecules in the system according to their brute formula.
tojson()
Serialize a System instance using json.
See also:
chemlab.core.System.from_json()
3.1.4 Routines to manipulate Systems
chemlab.core.subsystem_from_molecules(orig, selection)
Create a system from the orig system by picking the molecules specified in selection.
Parameters
orig: System The system from where to extract the subsystem
selection: np.ndarray of int or np.ndarray(N) of bool selection can be either a list of molecular indices to
select or a boolean array whose elements are True in correspondence of the molecules to select (it is
usually the result of a numpy comparison operation).
Example
In this example we can see how to select the molecules whose center of mass that is in the region of space x >
0.1:
s = System(...) # It is a set of 10 water molecules
select = []
for i range(s.n_mol):
if s.get_molecule(i).center_of_mass[0] > 0.1:
select.append(i)
subs = subsystem_from_molecules(s, np.ndarray(select))
Note: The API for operating on molecules is not yet fully developed. In the future there will be smarter ways
to filter molecule attributes instead of looping and using System.get_molecule.
chemlab.core.subsystem_from_atoms(orig, selection)
Generate a subsystem containing the atoms specified by selection. If an atom belongs to a molecule, the whole
molecule is selected.
Example
This function can be useful when selecting a part of a system based on positions. For example, in this snippet
you can see how to select the part of the system (a set of molecules) whose x coordinates is bigger than 1.0 nm:
s = System(...)
subs = subsystem_from_atoms(s.r_array[0,:] > 1.0)
Parameters
56
Chapter 3. Reference Documentation
chemlab Documentation, Release 0.4
orig: System Original system.
selection: np.ndarray of int or np.ndarray(NA) of bool A boolean array that is True when the ith atom has
to be selected or a set of atomic indices to be included.
Returns:
A new System instance.
chemlab.core.merge_systems(sysa, sysb, bounding=0.2)
Generate a system by merging sysa and sysb.
Overlapping molecules are removed by cutting the molecules of sysa that have atoms near the atoms of sysb.
The cutoff distance is defined by the bounding parameter.
Parameters
sysa: System First system
sysb: System Second system
bounding: float or False Extra space used when cutting molecules in sysa to make space for sysb. If it is False,
no overlap handling will be performed.
3.1.5 Routines to create Systems
chemlab.core.crystal(positions, molecules, group, cellpar=[1.0, 1.0, 1.0, 90, 90, 90], repetitions=[1,
1, 1])
Build a crystal from atomic positions, space group and cell parameters.
Parameters
positions: list of coordinates A list of the atomic positions
molecules: list of Molecule The molecules corresponding to the positions, the molecule will be translated in
all the equivalent positions.
group: int | str Space group given either as its number in International Tables or as its Hermann-Mauguin
symbol.
repetitions: Repetition of the unit cell in each direction
cellpar: Unit cell parameters
This function was taken and adapted from the spacegroup module found in ASE.
The module spacegroup module was originally developed by Jesper Frills.
chemlab.core.random_lattice_box(mol_list, mol_number, size, spacing=<Mock object>)
Make a box by placing the molecules specified in mol_list on random points of an evenly spaced lattice.
Using a lattice automatically ensures that no two molecules are overlapping.
Parameters
mol_list: list of Molecule instances A list of each kind of molecules to add to the system.
mol_number: list of int The number of molecules to place for each kind.
size: np.ndarray((3,), float) The box size in nm
spacing: np.ndarray((3,), float), [0.3 0.3 0.3] The lattice spacing in nm.
3.1. chemlab.core
57
chemlab Documentation, Release 0.4
Returns
A System instance.
Example
Typical box with 1000 water molecules randomly placed in a box of size [2.0 2.0 2.0]:
from chemlab.db import ChemlabDB
# Example water molecule
water = ChemlabDB().get('molecule', 'example.water')
s = random_water_box([water], [1000], [2.0, 2.0, 2.0])
3.2 chemlab.io
This package contains utilities to read, write a variety of chemical file formats.
chemlab.io.datafile(filename, mode=’rb’, format=None)
Initialize the appropriate IOHandler for a given file extension or file format.
The datafile function can be conveniently used to quickly read or write data in a certain format:
>>> handler = datafile("molecule.pdb")
>>> mol = handler.read("molecule")
# You can also use this shortcut
>>> mol = datafile("molecule.pdb").read("molecule")
Parameters
filename: str Path of the file to open.
format: str or None When different from None, can be used to specify a format identifier for that file. It should
be used when the extension is ambiguous or when there isn’t a specified filename. See below for a list of
the formats supported by chemlab.
chemlab.io.remotefile(url, format=None)
The usage of remotefile is equivalent to chemlab.io.datafile() except you can download a file from a
remote url.
Example
mol = remotefile(“https://github.com/chemlab/chemlab-testdata/blob/master/3ZJE.pdb”).read(“molecule”)
3.2.1 Supported File Formats
cml: Chemical Markup Language
Extension .cml
class chemlab.io.handlers.CmlIO(fd)
The CML format is described in http://www.xml-cml.org/.
Features
read(“molecule”)
Read the coordinates in a Molecule instance.
58
Chapter 3. Reference Documentation
chemlab Documentation, Release 0.4
write(“molecule”, mol)
Writes a Molecule instance in the CML format.
edr: GROMACS energy file
Extension .edr
class chemlab.io.handlers.EdrIO(fd)
EDR files store per-frame information for gromacs trajectories. Examples of properties obtainable from EDR
files are:
-
temperature
pressure
density
potential energy
total energy
etc.
To know which quantities are available in a certain edr file you can access the feature ‘avail quantity’:
>>> datafile('ener.edr').read('avail quantities')
['Temperature', 'Pressure', 'Potential', ...]
To get the frame information for a certain quantity you may use the “quantity” property passing the quantity
as additional argument, this will return two arrays, the first is an array of times in ps and the second are the
corrisponding quantities:
>>> time, temp = datafile('ener.edr').read('quantity', 'Temperature')
Features
read(“quantity”, quant)
Return an array of times in ps and the corresponding quantities at that times.
read(“avail quantities”)
Return the available quantities in the file.
read(“units”)
Return a dictionary where the keys are the quantities and the value are the units in which that quantity is
expressed.
read(“frames”)
Return a dictionary where the keys are the quantities and the value are the units in which that quantity is
expressed.
gro: GROMACS coordinate files
Extension .gro
class chemlab.io.handlers.GromacsIO(fd)
Handler for .gro file format. Example at http://manual.gromacs.org/online/gro.html.
Features
read(“system”)
Read the gro file and return a System instance. It also add the following exporting informations:
groname: The molecule names indicated in the gro file. This is added
tem.mol_export.
3.2. chemlab.io
to
each
entry
of
Sys-
59
chemlab Documentation, Release 0.4
grotype: The atom names as indicated in the gro file. This is added
tem.atom_export_array.
to
each
entry
of
Sys-
write(“system”, syst)
Write the syst System instance to disk. The export arrays should have the groname and grotype entries
as specified in the read("system") method.
Example
Export informations for water SPC:
Molecule([
Atom('O', [0.0, 0.0, 0.0], export={'grotype': 'OW'}),
Atom('H', [0.1, 0.0, 0.0], export={'grotype': 'HW1'}),
Atom('H', [-0.033, 0.094, 0.0],export={'grotype':'HW2'})],
export={'groname': 'SOL'})
mol: MDL Coordinate files
Extension .mol
class chemlab.io.handlers.MolIO(fd)
Reader for MDL molfile http://en.wikipedia.org/wiki/Chemical_table_file.
Features
read(“molecule”)
Read the molecule in a Molecule instance.
pdb: Protein Data Bank format
Extension .pdb
class chemlab.io.handlers.PdbIO(fd)
Starting implementation of a PDB file parser.
Note: This handler was developed as an example. If you like to contribute by implementing it you can write an
email to the mailing list.
Features
read(“molecule”)
Read the pdb file as a huge Molecule.
read(“system”)
Read the pdb file as a System, where each residue is a molecule.
xtc: GROMACS compressed trajectory file
Extension .xtc
class chemlab.io.handlers.XtcIO(fd)
Reader for GROMACS XTC trajectories.
Features
read(“trajectory”)
Read the frames from the file and returns the trajectory as an array of times and an array of atomic positions:
60
Chapter 3. Reference Documentation
chemlab Documentation, Release 0.4
>>> times, positions = datafile('traj.xtc').read('trajectory')
[t1, t2, t3], [pos1, pos2, ...]
positions is a list of np.ndarray(n_atoms, 3).
read(“boxes”)
After reading the “trajectory” feature you can call read(“boxes”) that will return a list of box_vectors
correspoiding to each frame.
xyz: XYZ coordinate format
Extension .xyz
class chemlab.io.handlers.XyzIO(fd)
The XYZ format is described in this wikipedia article http://en.wikipedia.org/wiki/XYZ_file_format.
Features
read(“molecule”)
Read the coordinates in a Molecule instance.
write(“molecule”, mol)
Writes a Molecule instance in the XYZ format.
3.2.2 cclib integration
Those handlers are based on the cclib library. The feature names extracted match those of the one included in the cclib
documentation.
Chemlab also extract a chemlab.core.Molecule instance from the file through the feature named molecule.
List of file formats:
• gamess
• gamessuk
• gaussian
• jaguar
• molpro
• orca
You can also use the method available_properties to get the available properties dynamically.
3.2.3 The class IOHandler
class chemlab.io.handlers.IOHandler(fd)
Generic base class for file readers and writers.
The initialization function takes a file-like object fd, as an argument.
Subclasses can extend the methods __init__, read and write to implement their reading and writing routines.
Attributes
fd
can_read
3.2. chemlab.io
61
chemlab Documentation, Release 0.4
Type list of str
A list of features that the handler can read.
can_write
Type list of str
A list of features that IOHandler can write.
check_feature(feature, readwrite)
Check if the feature is supported in the handler and raise an exception otherwise.
Parameters
feature: str Identifier for a certain feature.
readwrite: “read” or “write” Check if the feature is available for reading or writing.
read(feature, *args, **kwargs)
Read and return the feature feature. It should raise an ValueError if the feature is not present in the handler
can_read attribute, use the method IOHandler.check_feature() to provide this behaviour.
Certain features may require additional arguments, and it is possible to pass those as well.
Example
Subclasses can reimplement this method to add functionality:
class XyzIO(IOHandler):
can_read = ['molecule']
def read(self, feature, *args, **kwargs):
self.check_feature(feature, "read")
if feature == 'molecule':
# Do stuff
return geom
write(feature, value, *args, **kwargs)
Same as read(). You have to pass also a value to write and you may pass any additional arguments.
Example
class XyzIO(IOHandler):
can_write = ['molecule']
def write(self, feature, value, *args, **kwargs):
self.check_feature(feature, "write")
if feature == 'molecule':
# Do stuff
return geom
3.3 chemlab.graphics
This package contains the features related to the graphic capabilities of chemlab.
3.3.1 Ready to use functions
The two following functions are a convenient way to quickly display and animate a System in chemlab.
62
Chapter 3. Reference Documentation
chemlab Documentation, Release 0.4
chemlab.graphics.display_system(sys, style=’vdw’)
Display the system sys with the default viewer.
chemlab.graphics.display_trajectory(sys,
times,
coords_list,
box_vectors=None,
style=’spheres’)
Display the the system sys and instrument the trajectory viewer with frames information.
Parameters
sys: System The system to be displayed
times: np.ndarray(NFRAMES, dtype=float) The time corresponding to each frame. This is used only for
feedback reasons.
3.3. chemlab.graphics
63
chemlab Documentation, Release 0.4
coords_list: list of np.ndarray((NFRAMES, 3), dtype=float) Atomic coordinates at each frame.
3.3.2 Builtin 3D viewers
The QtViewer class
class chemlab.graphics.QtViewer
Bases: PyQt4.QtGui.QMainWindow
View objects in space.
This class can be used to build your own visualization routines by attaching renderers and uis to it.
See also:
Graphics and Visualization
Example
In this example we can draw 3 blue dots and some overlay text:
from chemlab.graphics import QtViewer
from chemlab.graphics.renderers import PointRenderer
from chemlab.graphics.uis import TextUI
vertices = [[0.0, 0.0, 0.0], [0.0, 1.0, 0.0], [2.0, 0.0, 0.0]]
blue = (0, 255, 255, 255)
colors = [blue,] * 3
v = QtViewer()
pr = v.add_renderer(PointRenderer, vertices, colors)
tu = v.add_ui(TextUI, 100, 100, 'Hello, world!')
v.run()
add_post_processing(klass, *args, **kwargs)
Add a post processing effect to the current scene.
The usage is as following:
from chemlab.graphics import QtViewer
from chemlab.graphics.postprocessing import SSAOEffect
v = QtViewer()
effect = v.add_post_processing(SSAOEffect)
See also:
List of Post Processing Effects
Return
an instance of AbstractEffect
New in version 0.3.
add_renderer(klass, *args, **kwargs)
Add a renderer to the current scene.
Parameter
64
Chapter 3. Reference Documentation
chemlab Documentation, Release 0.4
klass: renderer class The renderer class to be added
args, kwargs: Arguments used by the renderer constructor, except for the widget argument.
See also:
AbstractRenderer
See also:
List of available renderers
Return
The istantiated renderer. You should keep the return value to be able to update the renderer at run-time.
add_ui(klass, *args, **kwargs)
Add an UI element for the current scene. The approach is the same as renderers.
Warning: The UI api is not yet finalized
has_renderer(rend)
Return True if the renderer is present in the widget renderers.
remove_post_processing(pp)
Remove a post processing effect.
..versionadded:: 0.3
remove_renderer(rend)
Remove a renderer from the current view.
Example
rend = v.add_renderer(AtomRenderer)
v.remove_renderer(rend)
New in version 0.3.
run()
Display the QtViewer
schedule(callback, timeout=100)
Schedule a function to be called repeated time.
This method can be used to perform animations.
Example
This is a typical way to perform an animation, just:
from chemlab.graphics import QtViewer
from chemlab.graphics.renderers import SphereRenderer
v = QtViewer()
sr = v.add_renderer(SphereRenderer, centers, radii, colors)
def update():
# calculate new_positions
sr.update_positions(new_positions)
v.widget.repaint()
v.schedule(update)
v.run()
3.3. chemlab.graphics
65
chemlab Documentation, Release 0.4
Note: remember to call QtViewer.widget.repaint() each once you want to update the display.
Parameters
callback: function() A function that takes no arguments that will be called at intervals.
timeout: int Time in milliseconds between calls of the callback function.
Returns a QTimer, to stop the animation you can use Qtimer.stop
The QtTrajectoryViewer class
class chemlab.graphics.QtTrajectoryViewer
Bases: PyQt4.QtGui.QMainWindow
Interface for viewing trajectory.
It provides interface elements to play/pause and set the speed of the animation.
Example
To set up a QtTrajectoryViewer you have to add renderers to the scene, set the number of frames present in the
animation by calling ;py:meth:~chemlab.graphics.QtTrajectoryViewer.set_ticks and define an update function.
Below is an example taken from the function chemlab.graphics.display_trajectory():
from chemlab.graphics import QtTrajectoryViewer
# sys = some System
# coords_list = some list of atomic coordinates
v = QtTrajectoryViewer()
sr = v.add_renderer(AtomRenderer, sys.r_array, sys.type_array,
backend='impostors')
br = v.add_renderer(BoxRenderer, sys.box_vectors)
v.set_ticks(len(coords_list))
@v.update_function
def on_update(index):
sr.update_positions(coords_list[index])
br.update(sys.box_vectors)
v.set_text(format_time(times[index]))
v.widget.repaint()
v.run()
Warning: Use with caution, the API for this element is not fully stabilized and may be subject to change.
add_renderer(klass, *args, **kwargs)
The behaviour of this function is the same as chemlab.graphics.QtViewer.add_renderer().
add_ui(klass, *args, **kwargs)
Add an UI element for the current scene. The approach is the same as renderers.
Warning: The UI api is not yet finalized
66
Chapter 3. Reference Documentation
chemlab Documentation, Release 0.4
set_text(text)
Update the time indicator in the interface.
update_function(func, frames=None)
Set the function to be called when it’s time to display a frame.
func should be a function that takes one integer argument that represents the frame that has to be played:
def func(index):
# Update the renderers to match the
# current animation index
3.3.3 Renderers and UIs
List of available renderers
Interfaces
class chemlab.graphics.renderers.AbstractRenderer(widget, *args, **kwargs)
AbstractRenderer is the standard interface for renderers. Each renderer have to implement an initialization
function __init__ and a draw method to do the actual drawing using OpenGL or by using other, more basic,
renderers.
Usually the renderers have also some custom functions that they use to update themselves. For example a SphereRenderer implements the function update_positions to move the spheres around without having to regenerate
all of the other properties.
See also:
Graphics and Visualization for a tutorial on how to develop a simple renderer.
Parameters
widget: chemlab.graphics.QChemlabWidget The parent QChemlabWidget. Renderers can use the
widget to access the camera, lights, and other informations.
args, kwargs: Any other argument that they may use.
draw()
Generic drawing function to be implemented by the subclasses.
class chemlab.graphics.renderers.ShaderBaseRenderer(widget, vertex, fragment)
Bases: chemlab.graphics.renderers.base.AbstractRenderer
Instruments OpenGL with a vertex and a fragment shader.
This renderer automatically binds light and camera information. Subclasses should not reimplement the draw
method but the draw_vertices method where you can bind and draw the objects.
Parameters
widget: The parent QChemlabWidget
vertex: str Vertex program as a string
fragment: str Fragment program as a string
draw_vertices()
Method to be reimplemented by the subclasses.
3.3. chemlab.graphics
67
chemlab Documentation, Release 0.4
class chemlab.graphics.renderers.DefaultRenderer(widget)
Bases: chemlab.graphics.renderers.base.ShaderBaseRenderer
Same as ShaderBaseRenderer with the default shaders.
You can find the shaders in chemlab/graphics/renderers/shaders/ under the names of
default_persp.vert and default_persp.frag.
draw_vertices()
Subclasses should reimplement this method.
SphereRenderer
class chemlab.graphics.renderers.SphereRenderer(widget, poslist, radiuslist, colorlist, shading=’phong’)
Renders a set of spheres.
The method used by this renderer is approximating a sphere by using triangles. While this is reasonably fast,
for best performance and animation you should use SphereImpostorRenderer
Parameters
widget: The parent QChemlabWidget
68
Chapter 3. Reference Documentation
chemlab Documentation, Release 0.4
poslist: np.ndarray((NSPHERES, 3), dytpe=float) A position array. While there aren’t dimensions, in the
context of chemlab 1 unit of space equals 1 nm.
radiuslist: np.ndarray(NSPHERES, dtype=float) An array with the radius of each sphere.
colorlist: np.ndarray(NSPHERES, 4) or list of tuples An array with the color of each sphere. Suitable colors
are those found in chemlab.graphics.colors or any tuple with values (r, g, b, a) in the range [0,
255]
update_positions(positions)
Update the sphere positions.
SphereImpostorRenderer
class chemlab.graphics.renderers.SphereImpostorRenderer(viewer, poslist, radiuslist,
colorlist, transparent=False,
shading=’phong’)
The interface is identical to SphereRenderer but uses a different drawing method.
The spheres are squares that always face the user. Each point of the sphere, along with the lighting, is calculated
in the fragment shader, resulting in a perfect sphere.
SphereImpostorRenderer is an extremely fast rendering method, it is perfect for rendering a lot of spheres ( >
50000) and for animations.
AtomRenderer
class chemlab.graphics.renderers.AtomRenderer(widget,
r_array,
type_array,
backend=”impostors”,
color_scheme=colors.default_atom_map,
radii_map=vdw_dict)
Render atoms by using different rendering methods.
3.3. chemlab.graphics
69
chemlab Documentation, Release 0.4
Parameters
widget: The parent QChemlabWidget
r_array: np.ndarray((NATOMS, 3), dtype=float) The atomic coordinate array
type_array: np.ndarray((NATOMS, 3), dtype=object) An array containing all the atomic symbols like Ar,
H, O. If the atomic type is unknown, use the Xx symbol.
backend: “impostors” | “polygons” | “points” You can choose the rendering method between the sphere impostors, polygonal sphere and points.
color_scheme: dict, should contain the ‘Xx’ key,value pair A dictionary mapping atom types to colors. By
default it is the color scheme provided by chemlab.graphics.colors.default_atom_map. The ‘Xx’ symbol
value is taken as the default color.
radii_map: dict, should contain the ‘Xx’ key,value pair. A dictionary mapping atom types to radii. The default is the mapping contained in chemlab.db.vdw.vdw_dict
update_positions(r_array)
Update the atomic positions
BondRenderer
class chemlab.graphics.renderers.BondRenderer(widget,
bonds,
r_array,
type_array,
radius=0.02,
style=’cylinders’,
shading=’phong’)
Render chemical bonds as cylinders or lines.
Parameters
widget: The parent QChemlabWidget
bonds: np.ndarray((NBONDS, 2), dtype=int) An array of integer pairs that represent the bonds.
r_array: np.ndarray((NATOMS, 3), dtype=float) The coordinate array
type_array: np.ndarray((NATOMS, 3), dtype=object) An array containing all the atomic symbols like Ar,
H, O. If the atomic type is unknown, use the Xx symbol.
radius: float, default=0.02 The radius of the bonds
style: “cylinders” | “lines” Whether to render the bonds as cylinders or lines.
BallAndStickRenderer
class chemlab.graphics.renderers.BallAndStickRenderer(widget, r_array, type_array,
bonds, shading=’phong’)
Render a ball and stick representation of a series of coordinates and bonds.
70
Chapter 3. Reference Documentation
chemlab Documentation, Release 0.4
Parameters
widget: The parent QChemlabWidget
r_array: np.ndarray((NATOMS, 3), dtype=float) The coordinate array
type_array: np.ndarray((NATOMS, 3), dtype=object) An array containing all the atomic symbols like Ar,
H, O. If the atomic type is unknown, use the Xx symbol.
bonds: np.ndarray((NBONDS, 2), dtype=int) An array of integer pairs that represent the bonds.
update_positions(r_array)
Update the coordinate array r_array
WireframeRenderer
class chemlab.graphics.renderers.WireframeRenderer(widget, r_array, type_array, bonds)
Render a wireframe representation of a series of coordinates and bonds.
3.3. chemlab.graphics
71
chemlab Documentation, Release 0.4
Parameters
widget: The parent QChemlabWidget
r_array: np.ndarray((NATOMS, 3), dtype=float) The coordinate array
type_array: np.ndarray((NATOMS, 3), dtype=object) An array containing all the atomic symbols like Ar,
H, O. If the atomic type is unknown, use the Xx symbol.
bonds: np.ndarray((NBONDS, 2), dtype=int) An array of integer pairs that represent the bonds.
PointRenderer
class chemlab.graphics.renderers.PointRenderer(widget, positions, colors)
Render colored points.
Parameters
72
Chapter 3. Reference Documentation
chemlab Documentation, Release 0.4
widget: The parent QChemlabWidget
positons: np.ndarray((NPOINTS, 3), dtype=np.float32) Positions of the points to draw.
colors: np.ndarray((NPOINTS, 4), dtype=np.uint8) or list of tuples Color of each point in the (r,g,b,a) format in the interval [0, 255]
update_colors(colors)
Update the colors
update_positions(vertices)
Update the point positions
TriangleRenderer
class chemlab.graphics.renderers.TriangleRenderer(widget, vertices, normals, colors, shading=’phong’)
Renders an array of triangles.
A lot of renderers are built on this, for example SphereRenderer. The implementation is relatively fast since
it’s based on VertexBuffers.
Parameters
3.3. chemlab.graphics
73
chemlab Documentation, Release 0.4
widget: The parent QChemlabWidget
vertices: np.ndarray((NTRIANGLES*3, 3), dtype=float) The triangle vertices, keeping in mind the unwinding order. If the face of the triangle is pointing outwards, the vertices should be provided in clokckwise
order.
normals: np.ndarray((NTRIANGLES*3, 3), dtype=float) The normals to each of the triangle vertices, used
for lighting calculations.
colors: np.ndarray((NTRIANGLES*3, 4), dtype=np.uint8) Color for each of the vertices in (r,g,b,a) values
in the interval [0, 255]
update_colors(colors)
Update the triangle colors.
update_normals(normals)
Update the triangle normals.
update_vertices(vertices)
Update the triangle vertices.
BoxRenderer
class chemlab.graphics.renderers.BoxRenderer(widget, vectors, origin=<Mock
color=(0, 0, 0, 255))
Used to render one wireframed box.
object>,
Parameters
widget: The parent QChemlabWidget
vectors: np.ndarray((3,3), dtype=float) The three vectors representing the sides of the box.
origin: np.ndarray((3,3), dtype=float), default to zero The origin of the box.
color: 4 int tuple r,g,b,a color in the range [0,255]
update(vectors)
Update the box vectors.
LineRenderer
class chemlab.graphics.renderers.LineRenderer(widget, startends, colors, width=1.5)
Render a set of lines.
74
Chapter 3. Reference Documentation
chemlab Documentation, Release 0.4
Parameters
widget: The parent QChemlabWidget
startends: np.ndarray((NLINES, 2, 3), dtype=float) Start and end position of each line in the form of an
array:
s1 = [0.0, 0.0, 0.0]
startends = [[s1, e1], [s2, e2], ..]
colors: np.ndarray((NLINES, 2, 4), dtype=np.uint8) The corresponding color of each extrema of each line.
update_colors(colors)
Update the colors
update_positions(vertices)
Update the line positions
3.3. chemlab.graphics
75
chemlab Documentation, Release 0.4
CylinderRenderer
class chemlab.graphics.renderers.CylinderRenderer(widget, bounds, radii, colors)
Renders a set of cylinders.
The API is quite similar to LineRenderer
Parameters
widget: The parent QChemlabWidget
bounds: np.ndarray((NCYL, 2, 3), dtype=float) Start and end points of the cylinder.
colors: np.ndarray((NYCL, 4), dtype=np.uint8) The color for each cylinder.
update_bounds(bounds)
Update cylinders start and end positions
76
Chapter 3. Reference Documentation
chemlab Documentation, Release 0.4
List of available UIs
TextUI
class chemlab.graphics.uis.TextUI(widget, x, y, text)
Display an overlay text at the point x, y in screen space.
Warning: The API for this element and uis in general is not yet finalized.
Parameters
widget: The parent QChemlabWidget
x, y: int Points in screen coordinates. x pixels from left, y pixels from top.
text: str String of text to display
3.3.4 Post Processing Effects
List of Post Processing Effects
FXAAEffect
class chemlab.graphics.postprocessing.FXAAEffect(widget,
span_max=4.0,
reduce_mul=0.125,
reduce_min=0.0078125)
Fast Approximate Anti Aliasing. It is an efficient way to add anti-aliasing to your scenes. The reason to have it
is to reduce jagged lines.
The parameters span_max, reduce_mul, reduce_min are tweakable even if it is suggested to keep them at their
default value.
3.3. chemlab.graphics
77
chemlab Documentation, Release 0.4
GammaCorrectionEffect
class chemlab.graphics.postprocessing.GammaCorrectionEffect(widget, gamma=2.2)
Add gamma correction to the current scene.
Scenes displayed by OpenGL are in RGB color space. The response to colors by our eyes (and by old CRT
screens) is not linear, in other words, we perceive better dark tones than light tones. As a result, the image
produced is usually too dark.
To offset this effect you can apply gamma correction. The correct value is screen-dependent but it is usually
between 1.8 and 2.5. You can tweak this parameter through the parameter gamma.
78
Chapter 3. Reference Documentation
chemlab Documentation, Release 0.4
GlowEffect
class chemlab.graphics.postprocessing.GlowEffect(widget)
Enhance objects with a glowing effect.
This effect can be used to illuminate objects like they were small lightbulbs. It can be used for example to
implement selection or special effects. To setup the illumination strength you can use the color alpha value. If
the alpha value is zero, the illumination will be maximum, if the alpha is 255 no illumination will take place. If
you change this value at runtime, the glowing will change accordingly.
For example, if you’re using a SphereImpostorRenderer, to illuminate the sphere you have to setup the
color like this:
# Setup positions and radii
# Set the alpha value to 0 for max illumination
colors = np.array([[0, 0, 0, 255, 0]], 'uint8')
v.add_renderer(positions, radii, colors)
3.3. chemlab.graphics
79
chemlab Documentation, Release 0.4
NoEffect
class chemlab.graphics.postprocessing.NoEffect(widget)
Re-render the object without implementing any effect.
This renderer serves as an example, and can be used to access the textures used for the rendering through the
texture attribute.
This texture can be used to dump the image being rendered.
OutlineEffect
class chemlab.graphics.postprocessing.OutlineEffect(widget, kind=’depthnormal’)
Add a black, cartoon-like outline.
This effect analyzes each point to be drawn and check if it’s at a point of discontinuity, either because there’s a
change in surface normal (an edge) or because there’s a change in depth (a step). You can customize the effect
by applyning just the normal or the depth test.
80
Chapter 3. Reference Documentation
chemlab Documentation, Release 0.4
Parameters
kind: ‘depthnormal’ | ‘depthonly’ | ‘normalonly’
Set the edge-determination test to both depth and normal discontinuity or either one of the two.
SSAOEffect
class chemlab.graphics.postprocessing.SSAOEffect(widget,
kernel_size=32,
kernel_radius=2.0, ssao_power=2.0)
Screen space ambient occlusion.
This effect greatly enhances the perception of the shape of the molecules. More occluded areas (pockets) are
darkened to produce a more realistic illumination. For each pixel to draw, the algorithm randomly samples its
neighbourhood to determine how occluded is the point. The effect can be tweaked to increase the darkening, the
accuracy and the sensibility to small pockets.
3.3. chemlab.graphics
81
chemlab Documentation, Release 0.4
Parameters
kernel_size: int (min 1 max 128), default 32
The number of random samples used to determine if an area is occluded. At small values the performance is good and the quality is bad, at high value is the opposite is true.
kernel_radius: float, default 2.0
The maximum distances of the sampling neighbours. It should be comparable with the pocket size
you intend to see. At small values it’s smoother but will darken just small pockets, at high values will
reveal bigger pockets but the result would be more rough.
ssao_power: float, default 2.0
Elevate the darkening effect to a certain power. This will make the dark areas darker for a more
dramatic effect.
3.3.5 Low level widgets
The QChemlabWidget class
This is the molecular viewer widget used by chemlab.
82
Chapter 3. Reference Documentation
chemlab Documentation, Release 0.4
class chemlab.graphics.QChemlabWidget(*args, **kwargs)
Extensible and modular OpenGL widget developed using the Qt (PyQt4) Framework. This widget can be used
in other PyQt4 programs.
The widget by itself doesn’t draw anything, it delegates the writing task to external components called ‘renderers’ that expose the interface found in AbstractRenderer. Renderers are responsible for drawing objects
in space and have access to their parent widget.
To attach a renderer to QChemlabWidget you can simply append it to the renderers attribute:
from chemlab.graphics import QChemlabWidget
from chemlab.graphics.renderers import SphereRenderer
widget = QChemlabWidget()
widget.renderers.append(SphereRenderer(widget, ...))
You can also add other elements for the scene such as user interface elements, for example some text. This is
done in a way similar to renderers:
from chemlab.graphics import QChemlabWidget
from chemlab.graphics.uis import TextUI
widget = QChemlabWidget()
widget.uis.append(TextUI(widget, 200, 200, 'Hello, world!'))
Warning: At this point there is only one ui element available. PyQt4 provides a lot of UI elements so
there’s the possibility that UI elements will be converted into renderers.
QChemlabWidget has its own mouse gestures:
•Left Mouse Drag: Orbit the scene;
•Right Mouse Drag: Pan the scene;
•Wheel: Zoom the scene.
renderers
Type list of AbstractRenderer subclasses
It is a list containing the active renderers. QChemlabWidget will call their draw method when appropriate.
camera
Type Camera
The camera encapsulates our viewpoint on the world. That is where is our position and our orientation.
You should use on the camera to rotate, move, or zoom the scene.
light_dir
Type np.ndarray(3, dtype=float)
Default np.arrray([0.0, 0.0, 1.0])
The light direction in camera space. Assume you are in the space looking at a certain point, your position
is the origin. now imagine you have a lamp in your hand. light_dir is the direction this lamp is pointing.
And if you move, jump, or rotate, the lamp will move with you.
Note: With the current lighting mode there isn’t a “light position”. The light is assumed to be infinitely
distant and light rays are all parallel to the light direction.
background_color
3.3. chemlab.graphics
83
chemlab Documentation, Release 0.4
Type tuple
Default (255, 255, 255, 255) white
A 4-element (r, g, b, a) tuple that specity the background color. Values for r,g,b,a are in the range [0, 255].
You can use the colors contained in chemlab.graphics.colors.
paintGL()
GL function called each time a frame is drawn
toimage(width=None, height=None)
Return the current scene as a PIL Image.
Example
You can build your molecular viewer as usual and dump an image at any resolution supported by the video
card (up to the memory limits):
v = QtViewer()
# Add the renderers
v.add_renderer(...)
# Add post processing effects
v.add_post_processing(...)
# Move the camera
v.widget.camera.autozoom(...)
v.widget.camera.orbit_x(...)
v.widget.camera.orbit_y(...)
# Save the image
image = v.widget.toimage(1024, 768)
image.save("mol.png")
See also:
https://pillow.readthedocs.org/en/latest/PIL.html#module-PIL.Image
The Camera class
class chemlab.graphics.camera.Camera
Our viewpoint on the 3D world. The Camera class can be used to access and modify from which point we’re
seeing the scene.
It also handle the projection matrix (the matrix we apply to project 3d points onto our 2d screen).
position
Type np.ndarray(3, float)
Default np.array([0.0, 0.0, 5.0])
The position of the camera. You can modify this attribute to move the camera in various directions using
the absoule x, y and z coordinates.
a, b, c
Type np.ndarray(3), np.ndarray(3), np.ndarray(3) dtype=float
Default a: np.ndarray([1.0, 0.0, 0.0]) b: np.ndarray([0.0, 1.0, 0.0]) c: np.ndarray([0.0, 0.0, -1.0])
84
Chapter 3. Reference Documentation
chemlab Documentation, Release 0.4
Those three vectors represent the camera orientation. The a vector points to our right, the b points upwards
and c in front of us.
By default the camera points in the negative z-axis direction.
pivot
Type np.ndarray(3, dtype=float)
Default np.array([0.0, 0.0, 0.0])
The point we will orbit around by using Camera.orbit_x() and Camera.orbit_y().
matrix
Type np.ndarray((4,4), dtype=float)
Camera matrix, it contains the rotations and translations needed to transform the world according to the
camera position. It is generated from the a,‘‘b‘‘,‘‘c‘‘ vectors.
projection
Type np.ndarray((4, 4),dtype=float)
Projection matrix, generated from the projection parameters.
z_near, z_far
Type float, float
Near and far clipping planes. For more info refer to: http://www.lighthouse3d.com/tutorials/view-frustumculling/
fov
Type float
field of view in degrees used to generate the projection matrix.
aspectratio
Type float
Aspect ratio for the projection matrix, this should be adapted when the application window is resized.
autozoom(points)
Fit the current view to the correct zoom level to display all points.
The camera viewing direction and rotation pivot match the geometric center of the points and the distance
from that point is calculated in order for all points to be in the field of view. This is currently used to
provide optimal visualization for molecules and systems
Parameters
points: np.ndarray((N, 3)) Array of points.
mouse_rotate(dx, dy)
Convenience function to implement the mouse rotation by giving two displacements in the x and y directions.
mouse_zoom(inc)
Convenience function to implement a zoom function.
This is achieved by moving Camera.position in the direction of the Camera.c vector.
orbit_x(angle)
Same as orbit_y() but the axis of rotation is the Camera.b vector.
3.3. chemlab.graphics
85
chemlab Documentation, Release 0.4
We rotate around the point like if we sit on the side of a salad spinner.
orbit_y(angle)
Orbit around the point Camera.pivot by the angle angle expressed in radians. The axis of rotation is
the camera “right” vector, Camera.a.
In practice, we move around a point like if we were on a Ferris wheel.
restore(state)
Restore the camera state, passed as a state dictionary. You can obtain a previous state from the method
Camera.state.
state()
Return the current camera state as a dictionary, it can be restored with Camera.restore.
unproject(x, y, z=-1.0)
Receive x and y as screen coordinates and returns a point in world coordinates.
This function comes in handy each time we have to convert a 2d mouse click to a 3d point in our space.
Parameters
x: float in the interval [-1.0, 1.0] Horizontal coordinate, -1.0 is leftmost, 1.0 is rightmost.
y: float in the interval [1.0, -1.0] Vertical coordinate, -1.0 is down, 1.0 is up.
z: float in the interval [1.0, -1.0] Depth, -1.0 is the near plane, that is exactly behind our screen, 1.0 is
the far clipping plane.
Return type np.ndarray(3,dtype=float)
Returns The point in 3d coordinates (world coordinates).
3.3.6 Transformations
Homogeneous Transformation Matrices and Quaternions.
A library for calculating 4x4 matrices for translating, rotating, reflecting, scaling, shearing, projecting, orthogonalizing, and superimposing arrays of 3D homogeneous coordinates as well as for converting between rotation matrices,
Euler angles, and quaternions. Also includes an Arcball control object and functions to decompose transformation
matrices.
Authors Christoph Gohlke, Laboratory for Fluorescence Dynamics, University of California, Irvine
Version 2012.10.14
Requirements
• CPython 2.7 or 3.2
• Numpy 1.6
• transformations.c 2012.01.01 (optional implementation of some functions in C)
Notes
The API is not stable yet and is expected to change between revisions.
This Python code is not optimized for speed. Refer to the transformations.c module for a faster implementation of
some functions.
86
Chapter 3. Reference Documentation
chemlab Documentation, Release 0.4
Documentation in HTML format can be generated with epydoc.
Matrices (M) can be inverted using numpy.linalg.inv(M), be concatenated using numpy.dot(M0, M1), or transform
homogeneous coordinate arrays (v) using numpy.dot(M, v) for shape (4, *) column vectors, respectively numpy.dot(v,
M.T) for shape (*, 4) row vectors (“array of points”).
This module follows the “column vectors on the right” and “row major storage” (C contiguous) conventions. The
translation components are in the right column of the transformation matrix, i.e. M[:3, 3]. The transpose of the transformation matrices may have to be used to interface with other graphics systems, e.g. with OpenGL’s glMultMatrixd().
See also [16].
Calculations are carried out with numpy.float64 precision.
Vector, point, quaternion, and matrix function arguments are expected to be “array like”, i.e. tuple, list, or numpy
arrays.
Return types are numpy arrays unless specified otherwise.
Angles are in radians unless specified otherwise.
Quaternions w+ix+jy+kz are represented as [w, x, y, z].
A triple of Euler angles can be applied/interpreted in 24 ways, which can be specified using a 4 character string or
encoded 4-tuple:
Axes 4-string: e.g. ‘sxyz’ or ‘ryxy’
• first character : rotations are applied to ‘s’tatic or ‘r’otating frame
• remaining characters : successive rotation axis ‘x’, ‘y’, or ‘z’
Axes 4-tuple: e.g. (0, 0, 0, 0) or (1, 1, 1, 1)
• inner axis: code of axis (‘x’:0, ‘y’:1, ‘z’:2) of rightmost matrix.
• parity : even (0) if inner axis ‘x’ is followed by ‘y’, ‘y’ is followed by ‘z’, or ‘z’ is followed by ‘x’.
Otherwise odd (1).
• repetition : first and last axis are same (1) or different (0).
• frame : rotations are applied to static (0) or rotating (1) frame.
References
1. Matrices and transformations. Ronald Goldman. In “Graphics Gems I”, pp 472-475. Morgan Kaufmann, 1990.
2. More matrices and transformations: shear and pseudo-perspective. Ronald Goldman. In “Graphics Gems II”,
pp 320-323. Morgan Kaufmann, 1991.
3. Decomposing a matrix into simple transformations. Spencer Thomas. In “Graphics Gems II”, pp 320-323.
Morgan Kaufmann, 1991.
4. Recovering the data from the transformation matrix. Ronald Goldman. In “Graphics Gems II”, pp 324-331.
Morgan Kaufmann, 1991.
5. Euler angle conversion. Ken Shoemake. In “Graphics Gems IV”, pp 222-229. Morgan Kaufmann, 1994.
6. Arcball rotation control. Ken Shoemake. In “Graphics Gems IV”, pp 175-192. Morgan Kaufmann, 1994.
7. Representing attitude: Euler angles, unit quaternions, and rotation vectors. James Diebel. 2006.
8. A discussion of the solution for the best rotation to relate two sets of vectors. W Kabsch. Acta Cryst. 1978.
A34, 827-828.
3.3. chemlab.graphics
87
chemlab Documentation, Release 0.4
9. Closed-form solution of absolute orientation using unit quaternions. BKP Horn. J Opt Soc Am A. 1987.
4(4):629-642.
10. Quaternions. Ken Shoemake. http://www.sfu.ca/~jwa3/cmpt461/files/quatut.pdf
11. From quaternion to matrix and back. JMP van Waveren. 2005. http://www.intel.com/cd/ids/developer/asmona/eng/293748.htm
12. Uniform random rotations. Ken Shoemake. In “Graphics Gems III”, pp 124-132. Morgan Kaufmann, 1992.
13. Quaternion in molecular modeling. CFF Karney. J Mol Graph Mod, 25(5):595-604
14. New method for extracting the quaternion from a rotation matrix. Itzhack Y Bar-Itzhack, J Guid Contr Dynam.
2000. 23(6): 1085-1087.
15. Multiple View Geometry in Computer Vision. Hartley and Zissermann. Cambridge University Press; 2nd Ed.
2004. Chapter 4, Algorithm 4.7, p 130.
16. Column Vectors vs. Row Vectors. http://steve.hollasch.net/cgindex/math/matrix/column-vec.html
Examples
>>> alpha, beta, gamma = 0.123, -1.234, 2.345
>>> origin, xaxis, yaxis, zaxis = [0, 0, 0], [1, 0, 0], [0, 1, 0], [0, 0, 1]
>>> I = identity_matrix()
>>> Rx = rotation_matrix(alpha, xaxis)
>>> Ry = rotation_matrix(beta, yaxis)
>>> Rz = rotation_matrix(gamma, zaxis)
>>> R = concatenate_matrices(Rx, Ry, Rz)
>>> euler = euler_from_matrix(R, 'rxyz')
>>> numpy.allclose([alpha, beta, gamma], euler)
True
>>> Re = euler_matrix(alpha, beta, gamma, 'rxyz')
>>> is_same_transform(R, Re)
True
>>> al, be, ga = euler_from_matrix(Re, 'rxyz')
>>> is_same_transform(Re, euler_matrix(al, be, ga, 'rxyz'))
True
>>> qx = quaternion_about_axis(alpha, xaxis)
>>> qy = quaternion_about_axis(beta, yaxis)
>>> qz = quaternion_about_axis(gamma, zaxis)
>>> q = quaternion_multiply(qx, qy)
>>> q = quaternion_multiply(q, qz)
>>> Rq = quaternion_matrix(q)
>>> is_same_transform(R, Rq)
True
>>> S = scale_matrix(1.23, origin)
>>> T = translation_matrix([1, 2, 3])
>>> Z = shear_matrix(beta, xaxis, origin, zaxis)
>>> R = random_rotation_matrix(numpy.random.rand(3))
>>> M = concatenate_matrices(T, R, Z, S)
>>> scale, shear, angles, trans, persp = decompose_matrix(M)
>>> numpy.allclose(scale, 1.23)
True
>>> numpy.allclose(trans, [1, 2, 3])
True
>>> numpy.allclose(shear, [0, math.tan(beta), 0])
True
>>> is_same_transform(R, euler_matrix(axes='sxyz', *angles))
True
88
Chapter 3. Reference Documentation
chemlab Documentation, Release 0.4
>>> M1 = compose_matrix(scale, shear, angles, trans, persp)
>>> is_same_transform(M, M1)
True
>>> v0, v1 = random_vector(3), random_vector(3)
>>> M = rotation_matrix(angle_between_vectors(v0, v1), vector_product(v0, v1))
>>> v2 = numpy.dot(v0, M[:3,:3].T)
>>> numpy.allclose(unit_vector(v1), unit_vector(v2))
True
class chemlab.graphics.transformations.Arcball(initial=None)
Virtual Trackball Control.
>>> ball = Arcball()
>>> ball = Arcball(initial=numpy.identity(4))
>>> ball.place([320, 320], 320)
>>> ball.down([500, 250])
>>> ball.drag([475, 275])
>>> R = ball.matrix()
>>> numpy.allclose(numpy.sum(R), 3.90583455)
True
>>> ball = Arcball(initial=[1, 0, 0, 0])
>>> ball.place([320, 320], 320)
>>> ball.setaxes([1, 1, 0], [-1, 1, 0])
>>> ball.setconstrain(True)
>>> ball.down([400, 200])
>>> ball.drag([200, 400])
>>> R = ball.matrix()
>>> numpy.allclose(numpy.sum(R), 0.2055924)
True
>>> ball.next()
down(point)
Set initial cursor window coordinates and pick constrain-axis.
drag(point)
Update current cursor window coordinates.
getconstrain()
Return state of constrain to axis mode.
matrix()
Return homogeneous rotation matrix.
next(acceleration=0.0)
Continue rotation in direction of last drag.
place(center, radius)
Place Arcball, e.g. when window size changes.
center [sequence[2]] Window coordinates of trackball center.
radius [float] Radius of trackball in window coordinates.
setaxes(*axes)
Set axes to constrain rotations.
setconstrain(constrain)
Set state of constrain to axis mode.
chemlab.graphics.transformations.affine_matrix_from_points(v0, v1, shear=True,
scale=True,
usesvd=True)
3.3. chemlab.graphics
89
chemlab Documentation, Release 0.4
Return affine transform matrix to register two point sets.
v0 and v1 are shape (ndims, *) arrays of at least ndims non-homogeneous coordinates, where ndims is the
dimensionality of the coordinate space.
If shear is False, a similarity transformation matrix is returned. If also scale is False, a rigid/Eucledian transformation matrix is returned.
By default the algorithm by Hartley and Zissermann [15] is used. If usesvd is True, similarity and Eucledian
transformation matrices are calculated by minimizing the weighted sum of squared deviations (RMSD) according to the algorithm by Kabsch [8]. Otherwise, and if ndims is 3, the quaternion based algorithm by Horn [9] is
used, which is slower when using this Python implementation.
The returned matrix performs rotation, translation and uniform scaling (if specified).
>>> v0 = [[0, 1031, 1031, 0], [0, 0, 1600, 1600]]
>>> v1 = [[675, 826, 826, 677], [55, 52, 281, 277]]
>>> affine_matrix_from_points(v0, v1)
array([[
0.14549,
0.00062, 675.50008],
[
0.00048,
0.14094,
53.24971],
[
0.
,
0.
,
1.
]])
>>> T = translation_matrix(numpy.random.random(3)-0.5)
>>> R = random_rotation_matrix(numpy.random.random(3))
>>> S = scale_matrix(random.random())
>>> M = concatenate_matrices(T, R, S)
>>> v0 = (numpy.random.rand(4, 100) - 0.5) * 20
>>> v0[3] = 1
>>> v1 = numpy.dot(M, v0)
>>> v0[:3] += numpy.random.normal(0, 1e-8, 300).reshape(3, -1)
>>> M = affine_matrix_from_points(v0[:3], v1[:3])
>>> numpy.allclose(v1, numpy.dot(M, v0))
True
More examples in superimposition_matrix()
chemlab.graphics.transformations.angle_between_vectors(v0,
v1,
axis=0)
Return angle between vectors.
directed=True,
If directed is False, the input vectors are interpreted as undirected axes, i.e. the maximum angle is pi/2.
>>> a = angle_between_vectors([1, -2, 3], [-1, 2, -3])
>>> numpy.allclose(a, math.pi)
True
>>> a = angle_between_vectors([1, -2, 3], [-1, 2, -3], directed=False)
>>> numpy.allclose(a, 0)
True
>>> v0 = [[2, 0, 0, 2], [0, 2, 0, 2], [0, 0, 2, 2]]
>>> v1 = [[3], [0], [0]]
>>> a = angle_between_vectors(v0, v1)
>>> numpy.allclose(a, [0, 1.5708, 1.5708, 0.95532])
True
>>> v0 = [[2, 0, 0], [2, 0, 0], [0, 2, 0], [2, 0, 0]]
>>> v1 = [[0, 3, 0], [0, 0, 3], [0, 0, 3], [3, 3, 3]]
>>> a = angle_between_vectors(v0, v1, axis=1)
>>> numpy.allclose(a, [1.5708, 1.5708, 1.5708, 0.95532])
True
chemlab.graphics.transformations.arcball_constrain_to_axis(point, axis)
Return sphere point perpendicular to axis.
90
Chapter 3. Reference Documentation
chemlab Documentation, Release 0.4
chemlab.graphics.transformations.arcball_map_to_sphere(point, center, radius)
Return unit sphere coordinates from window coordinates.
chemlab.graphics.transformations.arcball_nearest_axis(point, axes)
Return axis, which arc is nearest to point.
chemlab.graphics.transformations.clip_matrix(left, right, bottom, top, near, far, perspective=False)
Return matrix to obtain normalized device coordinates from frustrum.
The frustrum bounds are axis-aligned along x (left, right), y (bottom, top) and z (near, far).
Normalized device coordinates are in range [-1, 1] if coordinates are inside the frustrum.
If perspective is True the frustrum is a truncated pyramid with the perspective point at origin and direction along
z axis, otherwise an orthographic canonical view volume (a box).
Homogeneous coordinates transformed by the perspective clip matrix need to be dehomogenized (divided by w
coordinate).
>>> frustrum = numpy.random.rand(6)
>>> frustrum[1] += frustrum[0]
>>> frustrum[3] += frustrum[2]
>>> frustrum[5] += frustrum[4]
>>> M = clip_matrix(perspective=False, *frustrum)
>>> numpy.dot(M, [frustrum[0], frustrum[2], frustrum[4], 1])
array([-1., -1., -1., 1.])
>>> numpy.dot(M, [frustrum[1], frustrum[3], frustrum[5], 1])
array([ 1., 1., 1., 1.])
>>> M = clip_matrix(perspective=True, *frustrum)
>>> v = numpy.dot(M, [frustrum[0], frustrum[2], frustrum[4], 1])
>>> v / v[3]
array([-1., -1., -1., 1.])
>>> v = numpy.dot(M, [frustrum[1], frustrum[3], frustrum[4], 1])
>>> v / v[3]
array([ 1., 1., -1., 1.])
chemlab.graphics.transformations.compose_matrix(scale=None,
shear=None,
gles=None, translate=None,
spective=None)
Return transformation matrix from sequence of transformations.
anper-
This is the inverse of the decompose_matrix function.
Sequence of transformations: scale : vector of 3 scaling factors shear : list of shear factors for x-y, x-z, y-z
axes angles : list of Euler angles about static x, y, z axes translate : translation vector along x, y, z axes
perspective : perspective partition of matrix
>>> scale = numpy.random.random(3) - 0.5
>>> shear = numpy.random.random(3) - 0.5
>>> angles = (numpy.random.random(3) - 0.5) * (2*math.pi)
>>> trans = numpy.random.random(3) - 0.5
>>> persp = numpy.random.random(4) - 0.5
>>> M0 = compose_matrix(scale, shear, angles, trans, persp)
>>> result = decompose_matrix(M0)
>>> M1 = compose_matrix(*result)
>>> is_same_transform(M0, M1)
True
chemlab.graphics.transformations.concatenate_matrices(*matrices)
Return concatenation of series of transformation matrices.
3.3. chemlab.graphics
91
chemlab Documentation, Release 0.4
>>> M = numpy.random.rand(16).reshape((4, 4)) - 0.5
>>> numpy.allclose(M, concatenate_matrices(M))
True
>>> numpy.allclose(numpy.dot(M, M.T), concatenate_matrices(M, M.T))
True
chemlab.graphics.transformations.decompose_matrix(matrix)
Return sequence of transformations from transformation matrix.
matrix [array_like] Non-degenerative homogeneous transformation matrix
Return tuple of: scale : vector of 3 scaling factors shear : list of shear factors for x-y, x-z, y-z axes angles :
list of Euler angles about static x, y, z axes translate : translation vector along x, y, z axes perspective :
perspective partition of matrix
Raise ValueError if matrix is of wrong type or degenerative.
>>> T0 = translation_matrix([1, 2, 3])
>>> scale, shear, angles, trans, persp = decompose_matrix(T0)
>>> T1 = translation_matrix(trans)
>>> numpy.allclose(T0, T1)
True
>>> S = scale_matrix(0.123)
>>> scale, shear, angles, trans, persp = decompose_matrix(S)
>>> scale[0]
0.123
>>> R0 = euler_matrix(1, 2, 3)
>>> scale, shear, angles, trans, persp = decompose_matrix(R0)
>>> R1 = euler_matrix(*angles)
>>> numpy.allclose(R0, R1)
True
chemlab.graphics.transformations.distance(x1, x2)
Distance between two points in space
chemlab.graphics.transformations.euler_from_matrix(matrix, axes=’sxyz’)
Return Euler angles from rotation matrix for specified axis sequence.
axes : One of 24 axis sequences as string or encoded tuple
Note that many Euler angle triplets can describe one matrix.
>>> R0 = euler_matrix(1, 2, 3, 'syxz')
>>> al, be, ga = euler_from_matrix(R0, 'syxz')
>>> R1 = euler_matrix(al, be, ga, 'syxz')
>>> numpy.allclose(R0, R1)
True
>>> angles = (4*math.pi) * (numpy.random.random(3) - 0.5)
>>> for axes in _AXES2TUPLE.keys():
...
R0 = euler_matrix(axes=axes, *angles)
...
R1 = euler_matrix(axes=axes, *euler_from_matrix(R0, axes))
...
if not numpy.allclose(R0, R1): print(axes, "failed")
chemlab.graphics.transformations.euler_from_quaternion(quaternion, axes=’sxyz’)
Return Euler angles from quaternion for specified axis sequence.
>>> angles = euler_from_quaternion([0.99810947, 0.06146124, 0, 0])
>>> numpy.allclose(angles, [0.123, 0, 0])
True
92
Chapter 3. Reference Documentation
chemlab Documentation, Release 0.4
chemlab.graphics.transformations.euler_matrix(ai, aj, ak, axes=’sxyz’)
Return homogeneous rotation matrix from Euler angles and axis sequence.
ai, aj, ak : Euler’s roll, pitch and yaw angles axes : One of 24 axis sequences as string or encoded tuple
>>> R = euler_matrix(1, 2, 3, 'syxz')
>>> numpy.allclose(numpy.sum(R[0]), -1.34786452)
True
>>> R = euler_matrix(1, 2, 3, (0, 1, 0, 1))
>>> numpy.allclose(numpy.sum(R[0]), -0.383436184)
True
>>> ai, aj, ak = (4*math.pi) * (numpy.random.random(3) - 0.5)
>>> for axes in _AXES2TUPLE.keys():
...
R = euler_matrix(ai, aj, ak, axes)
>>> for axes in _TUPLE2AXES.keys():
...
R = euler_matrix(ai, aj, ak, axes)
chemlab.graphics.transformations.identity_matrix()
Return 4x4 identity/unit matrix.
>>> I = identity_matrix()
>>> numpy.allclose(I, numpy.dot(I, I))
True
>>> numpy.sum(I), numpy.trace(I)
(4.0, 4.0)
>>> numpy.allclose(I, numpy.identity(4))
True
chemlab.graphics.transformations.inverse_matrix(matrix)
Return inverse of square transformation matrix.
>>> M0 = random_rotation_matrix()
>>> M1 = inverse_matrix(M0.T)
>>> numpy.allclose(M1, numpy.linalg.inv(M0.T))
True
>>> for size in range(1, 7):
...
M0 = numpy.random.rand(size, size)
...
M1 = inverse_matrix(M0)
...
if not numpy.allclose(M1, numpy.linalg.inv(M0)): print(size)
chemlab.graphics.transformations.is_same_transform(matrix0, matrix1)
Return True if two matrices perform same transformation.
>>> is_same_transform(numpy.identity(4), numpy.identity(4))
True
>>> is_same_transform(numpy.identity(4), random_rotation_matrix())
False
chemlab.graphics.transformations.normalized(x)
Return the x vector normalized
chemlab.graphics.transformations.orthogonalization_matrix(lengths, angles)
Return orthogonalization matrix for crystallographic cell coordinates.
Angles are expected in degrees.
The de-orthogonalization matrix is the inverse.
>>> O = orthogonalization_matrix([10, 10, 10], [90, 90, 90])
>>> numpy.allclose(O[:3, :3], numpy.identity(3, float) * 10)
True
3.3. chemlab.graphics
93
chemlab Documentation, Release 0.4
>>> O = orthogonalization_matrix([9.8, 12.0, 15.5], [87.2, 80.7, 69.7])
>>> numpy.allclose(numpy.sum(O), 43.063229)
True
chemlab.graphics.transformations.projection_from_matrix(matrix, pseudo=False)
Return projection plane and perspective point from projection matrix.
Return values are same as arguments for projection_matrix function: point, normal, direction, perspective, and
pseudo.
>>> point = numpy.random.random(3) - 0.5
>>> normal = numpy.random.random(3) - 0.5
>>> direct = numpy.random.random(3) - 0.5
>>> persp = numpy.random.random(3) - 0.5
>>> P0 = projection_matrix(point, normal)
>>> result = projection_from_matrix(P0)
>>> P1 = projection_matrix(*result)
>>> is_same_transform(P0, P1)
True
>>> P0 = projection_matrix(point, normal, direct)
>>> result = projection_from_matrix(P0)
>>> P1 = projection_matrix(*result)
>>> is_same_transform(P0, P1)
True
>>> P0 = projection_matrix(point, normal, perspective=persp, pseudo=False)
>>> result = projection_from_matrix(P0, pseudo=False)
>>> P1 = projection_matrix(*result)
>>> is_same_transform(P0, P1)
True
>>> P0 = projection_matrix(point, normal, perspective=persp, pseudo=True)
>>> result = projection_from_matrix(P0, pseudo=True)
>>> P1 = projection_matrix(*result)
>>> is_same_transform(P0, P1)
True
chemlab.graphics.transformations.projection_matrix(point,
normal,
direction=None,
perspective=None,
pseudo=False)
Return matrix to project onto plane defined by point and normal.
Using either perspective point, projection direction, or none of both.
If pseudo is True, perspective projections will preserve relative depth such that Perspective = dot(Orthogonal,
PseudoPerspective).
>>> P = projection_matrix([0, 0, 0], [1, 0, 0])
>>> numpy.allclose(P[1:, 1:], numpy.identity(4)[1:, 1:])
True
>>> point = numpy.random.random(3) - 0.5
>>> normal = numpy.random.random(3) - 0.5
>>> direct = numpy.random.random(3) - 0.5
>>> persp = numpy.random.random(3) - 0.5
>>> P0 = projection_matrix(point, normal)
>>> P1 = projection_matrix(point, normal, direction=direct)
>>> P2 = projection_matrix(point, normal, perspective=persp)
>>> P3 = projection_matrix(point, normal, perspective=persp, pseudo=True)
>>> is_same_transform(P2, numpy.dot(P0, P3))
True
>>> P = projection_matrix([3, 0, 0], [1, 1, 0], [1, 0, 0])
>>> v0 = (numpy.random.rand(4, 5) - 0.5) * 20
94
Chapter 3. Reference Documentation
chemlab Documentation, Release 0.4
>>> v0[3] = 1
>>> v1 = numpy.dot(P, v0)
>>> numpy.allclose(v1[1], v0[1])
True
>>> numpy.allclose(v1[0], 3-v1[1])
True
chemlab.graphics.transformations.quaternion_about_axis(angle, axis)
Return quaternion for rotation about axis.
>>> q = quaternion_about_axis(0.123, [1, 0, 0])
>>> numpy.allclose(q, [0.99810947, 0.06146124, 0, 0])
True
chemlab.graphics.transformations.quaternion_conjugate(quaternion)
Return conjugate of quaternion.
>>> q0 = random_quaternion()
>>> q1 = quaternion_conjugate(q0)
>>> q1[0] == q0[0] and all(q1[1:] == -q0[1:])
True
chemlab.graphics.transformations.quaternion_from_euler(ai, aj, ak, axes=’sxyz’)
Return quaternion from Euler angles and axis sequence.
ai, aj, ak : Euler’s roll, pitch and yaw angles axes : One of 24 axis sequences as string or encoded tuple
>>> q = quaternion_from_euler(1, 2, 3, 'ryxz')
>>> numpy.allclose(q, [0.435953, 0.310622, -0.718287, 0.444435])
True
chemlab.graphics.transformations.quaternion_from_matrix(matrix, isprecise=False)
Return quaternion from rotation matrix.
If isprecise is True, the input matrix is assumed to be a precise rotation matrix and a faster algorithm is used.
>>> q = quaternion_from_matrix(numpy.identity(4), True)
>>> numpy.allclose(q, [1, 0, 0, 0])
True
>>> q = quaternion_from_matrix(numpy.diag([1, -1, -1, 1]))
>>> numpy.allclose(q, [0, 1, 0, 0]) or numpy.allclose(q, [0, -1, 0, 0])
True
>>> R = rotation_matrix(0.123, (1, 2, 3))
>>> q = quaternion_from_matrix(R, True)
>>> numpy.allclose(q, [0.9981095, 0.0164262, 0.0328524, 0.0492786])
True
>>> R = [[-0.545, 0.797, 0.260, 0], [0.733, 0.603, -0.313, 0],
...
[-0.407, 0.021, -0.913, 0], [0, 0, 0, 1]]
>>> q = quaternion_from_matrix(R)
>>> numpy.allclose(q, [0.19069, 0.43736, 0.87485, -0.083611])
True
>>> R = [[0.395, 0.362, 0.843, 0], [-0.626, 0.796, -0.056, 0],
...
[-0.677, -0.498, 0.529, 0], [0, 0, 0, 1]]
>>> q = quaternion_from_matrix(R)
>>> numpy.allclose(q, [0.82336615, -0.13610694, 0.46344705, -0.29792603])
True
>>> R = random_rotation_matrix()
>>> q = quaternion_from_matrix(R)
>>> is_same_transform(R, quaternion_matrix(q))
True
3.3. chemlab.graphics
95
chemlab Documentation, Release 0.4
chemlab.graphics.transformations.quaternion_imag(quaternion)
Return imaginary part of quaternion.
>>> quaternion_imag([3, 0, 1, 2])
array([ 0., 1., 2.])
chemlab.graphics.transformations.quaternion_inverse(quaternion)
Return inverse of quaternion.
>>> q0 = random_quaternion()
>>> q1 = quaternion_inverse(q0)
>>> numpy.allclose(quaternion_multiply(q0, q1), [1, 0, 0, 0])
True
chemlab.graphics.transformations.quaternion_matrix(quaternion)
Return homogeneous rotation matrix from quaternion.
>>> M = quaternion_matrix([0.99810947, 0.06146124, 0, 0])
>>> numpy.allclose(M, rotation_matrix(0.123, [1, 0, 0]))
True
>>> M = quaternion_matrix([1, 0, 0, 0])
>>> numpy.allclose(M, numpy.identity(4))
True
>>> M = quaternion_matrix([0, 1, 0, 0])
>>> numpy.allclose(M, numpy.diag([1, -1, -1, 1]))
True
chemlab.graphics.transformations.quaternion_multiply(quaternion1, quaternion0)
Return multiplication of two quaternions.
>>> q = quaternion_multiply([4, 1, -2, 3], [8, -5, 6, 7])
>>> numpy.allclose(q, [28, -44, -14, 48])
True
chemlab.graphics.transformations.quaternion_real(quaternion)
Return real part of quaternion.
>>> quaternion_real([3, 0, 1, 2])
3.0
chemlab.graphics.transformations.quaternion_slerp(quat0, quat1, fraction, spin=0,
shortestpath=True)
Return spherical linear interpolation between two quaternions.
>>> q0 = random_quaternion()
>>> q1 = random_quaternion()
>>> q = quaternion_slerp(q0, q1, 0)
>>> numpy.allclose(q, q0)
True
>>> q = quaternion_slerp(q0, q1, 1, 1)
>>> numpy.allclose(q, q1)
True
>>> q = quaternion_slerp(q0, q1, 0.5)
>>> angle = math.acos(numpy.dot(q0, q))
>>> numpy.allclose(2, math.acos(numpy.dot(q0, q1)) / angle) or
True
numpy.allclose(2, math.ac
chemlab.graphics.transformations.random_quaternion(rand=None)
Return uniform random unit quaternion.
rand: array like or None Three independent random variables that are uniformly distributed between 0 and 1.
96
Chapter 3. Reference Documentation
chemlab Documentation, Release 0.4
>>> q = random_quaternion()
>>> numpy.allclose(1, vector_norm(q))
True
>>> q = random_quaternion(numpy.random.random(3))
>>> len(q.shape), q.shape[0]==4
(1, True)
chemlab.graphics.transformations.random_rotation_matrix(rand=None)
Return uniform random rotation matrix.
rand: array like Three independent random variables that are uniformly distributed between 0 and 1 for each
returned quaternion.
>>> R = random_rotation_matrix()
>>> numpy.allclose(numpy.dot(R.T, R), numpy.identity(4))
True
chemlab.graphics.transformations.random_vector(size)
Return array of random doubles in the half-open interval [0.0, 1.0).
>>> v = random_vector(10000)
>>> numpy.all(v >= 0) and numpy.all(v < 1)
True
>>> v0 = random_vector(10)
>>> v1 = random_vector(10)
>>> numpy.any(v0 == v1)
False
chemlab.graphics.transformations.reflection_from_matrix(matrix)
Return mirror plane point and normal vector from reflection matrix.
>>> v0 = numpy.random.random(3) - 0.5
>>> v1 = numpy.random.random(3) - 0.5
>>> M0 = reflection_matrix(v0, v1)
>>> point, normal = reflection_from_matrix(M0)
>>> M1 = reflection_matrix(point, normal)
>>> is_same_transform(M0, M1)
True
chemlab.graphics.transformations.reflection_matrix(point, normal)
Return matrix to mirror at plane defined by point and normal vector.
>>> v0 = numpy.random.random(4) - 0.5
>>> v0[3] = 1.
>>> v1 = numpy.random.random(3) - 0.5
>>> R = reflection_matrix(v0, v1)
>>> numpy.allclose(2, numpy.trace(R))
True
>>> numpy.allclose(v0, numpy.dot(R, v0))
True
>>> v2 = v0.copy()
>>> v2[:3] += v1
>>> v3 = v0.copy()
>>> v2[:3] -= v1
>>> numpy.allclose(v2, numpy.dot(R, v3))
True
chemlab.graphics.transformations.rotation_from_matrix(matrix)
Return rotation angle and axis from rotation matrix.
3.3. chemlab.graphics
97
chemlab Documentation, Release 0.4
>>> angle = (random.random() - 0.5) * (2*math.pi)
>>> direc = numpy.random.random(3) - 0.5
>>> point = numpy.random.random(3) - 0.5
>>> R0 = rotation_matrix(angle, direc, point)
>>> angle, direc, point = rotation_from_matrix(R0)
>>> R1 = rotation_matrix(angle, direc, point)
>>> is_same_transform(R0, R1)
True
chemlab.graphics.transformations.rotation_matrix(angle, direction)
Create a rotation matrix corresponding to the rotation around a general axis by a specified angle.
R = dd^T + cos(a) (I - dd^T) + sin(a) skew(d)
Parameters:
angle : float a direction : array d
chemlab.graphics.transformations.scale_from_matrix(matrix)
Return scaling factor, origin and direction from scaling matrix.
>>> factor = random.random() * 10 - 5
>>> origin = numpy.random.random(3) - 0.5
>>> direct = numpy.random.random(3) - 0.5
>>> S0 = scale_matrix(factor, origin)
>>> factor, origin, direction = scale_from_matrix(S0)
>>> S1 = scale_matrix(factor, origin, direction)
>>> is_same_transform(S0, S1)
True
>>> S0 = scale_matrix(factor, origin, direct)
>>> factor, origin, direction = scale_from_matrix(S0)
>>> S1 = scale_matrix(factor, origin, direction)
>>> is_same_transform(S0, S1)
True
chemlab.graphics.transformations.scale_matrix(factor, origin=None, direction=None)
Return matrix to scale by factor around origin in direction.
Use factor -1 for point symmetry.
>>> v = (numpy.random.rand(4, 5) - 0.5) * 20
>>> v[3] = 1
>>> S = scale_matrix(-1.234)
>>> numpy.allclose(numpy.dot(S, v)[:3], -1.234*v[:3])
True
>>> factor = random.random() * 10 - 5
>>> origin = numpy.random.random(3) - 0.5
>>> direct = numpy.random.random(3) - 0.5
>>> S = scale_matrix(factor, origin)
>>> S = scale_matrix(factor, origin, direct)
chemlab.graphics.transformations.shear_from_matrix(matrix)
Return shear angle, direction and plane from shear matrix.
>>>
>>>
>>>
>>>
>>>
>>>
>>>
98
angle = (random.random() - 0.5) * 4*math.pi
direct = numpy.random.random(3) - 0.5
point = numpy.random.random(3) - 0.5
normal = numpy.cross(direct, numpy.random.random(3))
S0 = shear_matrix(angle, direct, point, normal)
angle, direct, point, normal = shear_from_matrix(S0)
S1 = shear_matrix(angle, direct, point, normal)
Chapter 3. Reference Documentation
chemlab Documentation, Release 0.4
>>> is_same_transform(S0, S1)
True
chemlab.graphics.transformations.shear_matrix(angle, direction, point, normal)
Return matrix to shear by angle along direction vector on shear plane.
The shear plane is defined by a point and normal vector. The direction vector must be orthogonal to the plane’s
normal vector.
A point P is transformed by the shear matrix into P” such that the vector P-P” is parallel to the direction vector
and its extent is given by the angle of P-P’-P”, where P’ is the orthogonal projection of P onto the shear plane.
>>> angle = (random.random() - 0.5) * 4*math.pi
>>> direct = numpy.random.random(3) - 0.5
>>> point = numpy.random.random(3) - 0.5
>>> normal = numpy.cross(direct, numpy.random.random(3))
>>> S = shear_matrix(angle, direct, point, normal)
>>> numpy.allclose(1, numpy.linalg.det(S))
True
chemlab.graphics.transformations.simple_clip_matrix(scale, znear, zfar, aspectratio=1.0)
Given the parameters for a frustum returns a 4x4 perspective projection matrix
Parameters: float scale: float znear,zfar: near/far plane z, float
Return: a 4x4 perspective matrix
chemlab.graphics.transformations.superimposition_matrix(v0, v1, scale=False, usesvd=True)
Return matrix to transform given 3D point set into second point set.
v0 and v1 are shape (3, *) or (4, *) arrays of at least 3 points.
The parameters scale and usesvd are explained in the more general affine_matrix_from_points function.
The returned matrix is a similarity or Eucledian transformation matrix. This function has a fast C implementation
in transformations.c.
>>> v0 = numpy.random.rand(3, 10)
>>> M = superimposition_matrix(v0, v0)
>>> numpy.allclose(M, numpy.identity(4))
True
>>> R = random_rotation_matrix(numpy.random.random(3))
>>> v0 = [[1,0,0], [0,1,0], [0,0,1], [1,1,1]]
>>> v1 = numpy.dot(R, v0)
>>> M = superimposition_matrix(v0, v1)
>>> numpy.allclose(v1, numpy.dot(M, v0))
True
>>> v0 = (numpy.random.rand(4, 100) - 0.5) * 20
>>> v0[3] = 1
>>> v1 = numpy.dot(R, v0)
>>> M = superimposition_matrix(v0, v1)
>>> numpy.allclose(v1, numpy.dot(M, v0))
True
>>> S = scale_matrix(random.random())
>>> T = translation_matrix(numpy.random.random(3)-0.5)
>>> M = concatenate_matrices(T, R, S)
>>> v1 = numpy.dot(M, v0)
>>> v0[:3] += numpy.random.normal(0, 1e-9, 300).reshape(3, -1)
>>> M = superimposition_matrix(v0, v1, scale=True)
>>> numpy.allclose(v1, numpy.dot(M, v0))
3.3. chemlab.graphics
99
chemlab Documentation, Release 0.4
True
>>> M = superimposition_matrix(v0, v1, scale=True, usesvd=False)
>>> numpy.allclose(v1, numpy.dot(M, v0))
True
>>> v = numpy.empty((4, 100, 3))
>>> v[:, :, 0] = v0
>>> M = superimposition_matrix(v0, v1, scale=True, usesvd=False)
>>> numpy.allclose(v1, numpy.dot(M, v[:, :, 0]))
True
chemlab.graphics.transformations.translation_from_matrix(matrix)
Return translation vector from translation matrix.
>>> v0 = numpy.random.random(3) - 0.5
>>> v1 = translation_from_matrix(translation_matrix(v0))
>>> numpy.allclose(v0, v1)
True
chemlab.graphics.transformations.translation_matrix(direction)
Return matrix to translate by direction vector.
>>> v = numpy.random.random(3) - 0.5
>>> numpy.allclose(v, translation_matrix(v)[:3, 3])
True
chemlab.graphics.transformations.unit_vector(data, axis=None, out=None)
Return ndarray normalized by length, i.e. eucledian norm, along axis.
>>> v0 = numpy.random.random(3)
>>> v1 = unit_vector(v0)
>>> numpy.allclose(v1, v0 / numpy.linalg.norm(v0))
True
>>> v0 = numpy.random.rand(5, 4, 3)
>>> v1 = unit_vector(v0, axis=-1)
>>> v2 = v0 / numpy.expand_dims(numpy.sqrt(numpy.sum(v0*v0, axis=2)), 2)
>>> numpy.allclose(v1, v2)
True
>>> v1 = unit_vector(v0, axis=1)
>>> v2 = v0 / numpy.expand_dims(numpy.sqrt(numpy.sum(v0*v0, axis=1)), 1)
>>> numpy.allclose(v1, v2)
True
>>> v1 = numpy.empty((5, 4, 3))
>>> unit_vector(v0, axis=1, out=v1)
>>> numpy.allclose(v1, v2)
True
>>> list(unit_vector([]))
[]
>>> list(unit_vector([1]))
[1.0]
chemlab.graphics.transformations.vector_norm(data, axis=None, out=None)
Return length, i.e. eucledian norm, of ndarray along axis.
>>> v = numpy.random.random(3)
>>> n = vector_norm(v)
>>> numpy.allclose(n, numpy.linalg.norm(v))
True
>>> v = numpy.random.rand(6, 5, 3)
>>> n = vector_norm(v, axis=-1)
>>> numpy.allclose(n, numpy.sqrt(numpy.sum(v*v, axis=2)))
100
Chapter 3. Reference Documentation
chemlab Documentation, Release 0.4
True
>>> n = vector_norm(v, axis=1)
>>> numpy.allclose(n, numpy.sqrt(numpy.sum(v*v, axis=1)))
True
>>> v = numpy.random.rand(5, 4, 3)
>>> n = numpy.empty((5, 3))
>>> vector_norm(v, axis=1, out=n)
>>> numpy.allclose(n, numpy.sqrt(numpy.sum(v*v, axis=1)))
True
>>> vector_norm([])
0.0
>>> vector_norm([1])
1.0
chemlab.graphics.transformations.vector_product(v0, v1, axis=0)
Return vector perpendicular to vectors.
>>> v = vector_product([2, 0, 0], [0, 3, 0])
>>> numpy.allclose(v, [0, 0, 6])
True
>>> v0 = [[2, 0, 0, 2], [0, 2, 0, 2], [0, 0, 2, 2]]
>>> v1 = [[3], [0], [0]]
>>> v = vector_product(v0, v1)
>>> numpy.allclose(v, [[0, 0, 0, 0], [0, 0, 6, 6], [0, -6, 0, -6]])
True
>>> v0 = [[2, 0, 0], [2, 0, 0], [0, 2, 0], [2, 0, 0]]
>>> v1 = [[0, 3, 0], [0, 0, 3], [0, 0, 3], [3, 3, 3]]
>>> v = vector_product(v0, v1, axis=1)
>>> numpy.allclose(v, [[0, 0, 6], [0, -6, 0], [6, 0, 0], [0, -6, 6]])
True
3.4 chemlab.db
3.4.1 AbstractDB
class chemlab.db.base.AbstractDB
Interface for a generic database.
A typical database can be used to retrieve molecules by calling the get method:
water = db.get("molecule", "example.water")
A database can also provide custom functionalities to store or search for entries. Those are implemented in
custom methods.
See the other implementations for more relevant examples.
get(feature, key, *args, **kwargs)
Get a data entry from the database.
Subclasses are required to implement this method to provide access to the database.
Parameters
•feature: str An identifier that represents the kind of data that we want to extract. Examples of such
identifier are “system”, “molecule”, “data” etc.
3.4. chemlab.db
101
chemlab Documentation, Release 0.4
•key: str The key associated with the database entry. By convention you can use dotted names to
provide some kind of nested structure.
•args, kwargs: Custom extra arguments.
3.4.2 ChemlabDB
class chemlab.db.ChemlabDB
Chemlab default database.
This database contains some example molecules and some atomic data.
get(self, ‘molecule’, key)
Retrieve a molecule from the database. The included molecule keys are:
•example.water
•example.norbornene
•gromacs.spc
•gromacs.spce
•gromacs.na+
•gromacs.clget(self, ‘data’, key)
Retrieve atomic data. The available data is:
•symbols: Atomic symbols in a list.
•vdwdict: Dictionary with per-element Van Der Waals radii.
•massdict: Dictionary of masses.
•paulingenegdict: Dictionary with per-element Pauling electronegativity
•arenegdict: Dictionary with per-element Allred-Rochow electronegativity
•maxbonddict: Dictionary of maximum bond valences. 6 if unknown.
•ionpotdict: Dictionary of ionisation potentials in eV
•eaffdict: Dictionary of electron affinities in eV
Data was taken from the OpenBabel distribution.
3.4.3 ChemSpiderDB
class chemlab.db.ChemSpiderDB(token=None)
Retrieve data from the online Chemspider database by passing an string identifier.
Parameters
token: str | None The chemspider security token. When token is None, chemlab will try to retrieve the token
from a configuration file in $HOME/.chemlabrc that has the entry:
[chemspider]
token=YOUR-SECURITY-TOKEN
The get method requires a key argument to retrieve a database entry. A valid key can be, for instance, the common
name of a certain chemical, a SMILES string or an InChi identifier. This is just an adapter on the chemspipy
library.
102
Chapter 3. Reference Documentation
chemlab Documentation, Release 0.4
get(self, ‘molecule’, key)
Retrieve a molecule 3D structure. Returns a Molecule instance.
get(self, ‘inchi’, key)
Retrieve the InChi string for the compound.
get(self, ‘molecularformula’, key)
Retrieve the molecular formula as a LaTeX string.
get(self, ‘imageurl’, key)
Retrieve the url of a 2D image representation of the compound.
get(self, ‘smiles’, key)
Retrieve the SMILES string for the compound.
get(self, ‘averagemass’, key)
Retrieve the average mass
get(self, ‘nominalmass’, key)
Retrieve the nominal mass
get(self, ‘inchikey’, key)
Return the InChi key.
get(self, ‘alogp’, key)
Predicted LogP (partition coefficient) using the ACD LogP algorithm.
get(self, ‘xlogp’, key)
Predicted LogP using the XLogP algorithm.
get(self, ‘image’, key)
PNG image of the compound as a data string.
get(self, ‘mol2d’, key)
MOL mdl file containing 2D coordinates of the compound.
get(self, ‘commonname’, key)
Retrieve the common name of the compound.
3.4.4 CirDB
class chemlab.db.CirDB
Get 3D structure of arbitrary molecules given a string identifier.
get(self, ‘molecule’, key)
Retrieve a molecule from the online CIR database by passing an identifier.
A key can be, for instance, the common name of a certain chemical, a SMILES string or an InChi identifier.
This is just an adapter on the CirPy library.
Returns a Molecule instance.
3.4.5 LocalDB
class chemlab.db.LocalDB(directory)
Store serialized molecules and systems in a directory tree.
See Having your own molecular database for an example of usage.
directory
Directory where the database is located.
3.4. chemlab.db
103
chemlab Documentation, Release 0.4
get(self, ‘molecule’, key)
Get an entry from the database. Key is the filename without extension of the serialized molecule.
Molecules are stored in the subdirectory.
get(self, ‘system’, key)
Get an entry from the database. Key is the filename without extension of the serialized system.
store(self, ‘molecule’, key, value)
store(self, ‘system’, key, value)
Store a Molecule or a System passed as value in the directory structure. The objects are dumped to disk
after being serialized to json.
3.4.6 RcsbDB
class chemlab.db.RcsbDB
Access to the RCSB database for proteins.
To download a protein, just write its PDB id that you can check on the website:
from chemlab.db import RcsbDB
mol = RcsbDB().get('molecule', '3ZJE')
get(self, ‘molecule’, key)
The 4 alphanumeric PDB entry that you can get from the RCSB website.
3.5 chemlab.utils
chemlab.utils.distances_within(coords_a, coords_b, cutoff, periodic=False, method=’simple’)
Calculate distances between the array of coordinates coord_a and coord_b within a certain cutoff.
This function is a wrapper around different routines and data structures for distance searches. It return a
np.ndarray containing the distances.
Parameters
coords_a: np.ndarray((N, 3), dtype=float) First coordinate array
coords_b: np.ndarray((N, 3), dtype=float) Second coordinate array
cutoff: float Maximum distance to search for
periodic: False or np.ndarray((3,), dtype=float) If False, don’t consider periodic images. Otherwise periodic
is an array containing the periodicity in the 3 dimensions.
method: “simple” | “cell-lists” The method to use. simple is a brute-force distance search, kdtree uses scipy
ckdtree module (periodic not available) and cell-lists uses the cell linked list method.
3.6 chemlab.mviewer.api
Those are the default commands included in the chemlab molecular viewer.
104
Chapter 3. Reference Documentation
chemlab Documentation, Release 0.4
3.6.1 Basic Commands
Those commands are used to retrieve the basic objects that are currently displayed.
information on what’s currently displayed in the molecular viewer.
Basic functions to retrieve
chemlab.mviewer.api.core.current_frame()
Return the integer corresponding to the current frame in the trajectory.
chemlab.mviewer.api.core.current_frame_times()
Return the list of times associated with the current trajectory.
chemlab.mviewer.api.core.current_nframes()
Return the number of frames in the current trajectory.
chemlab.mviewer.api.core.current_representation()
Return the current Representation instance. Representations are a way to interact with the displayed chemical
data.
chemlab.mviewer.api.core.current_system()
The chemlab.core.System that is currently being displayed.
chemlab.mviewer.api.core.current_time()
Return the floating point number corresponding to the current time in the trajectory (in ns).
chemlab.mviewer.api.core.current_trajectory()
Return the current trajectory. A trajectory is a set of frames.
chemlab.mviewer.api.core.frames(skip=1)
Useful command to iterate on the trajectory frames. It can be used in a for loop.
for i in frames():
coords = current_trajectory()[i]
# Do operation on coords
You can use the option skip to take every i th frame.
chemlab.mviewer.api.core.msg = <chemlab.mviewer.api.core._Msg object>
Update the message in the status bar
chemlab.mviewer.api.core.trajectory(start=None, stop=None, step=None)
Useful command to iterate on the trajectory frames by time (in ns). It is meant to be used in a for loop:
for i in trajectory(0, 10, 0.1):
coords = current_frame()
t = current_time()
# Do something
The previous snippet will stop at every frame from 0 to 10 ns with a step of 0.1 ns.
3.6.2 Loading Commands
Those commands are used to load, write, display or download structures from files or any other source.
chemlab.mviewer.api.display.autozoom()
Find optimal camera zoom level for the current view.
chemlab.mviewer.api.display.autozoom_()
Find optimal camera zoom level for the current view.
chemlab.mviewer.api.display.display_molecule(mol, autozoom=True)
Display a ~chemlab.core.Molecule instance in the viewer.
3.6. chemlab.mviewer.api
105
chemlab Documentation, Release 0.4
This function wraps the molecule in a system before displaying it.
chemlab.mviewer.api.display.display_system(system, autozoom=True)
Display a ~chemlab.core.System instance at screen
chemlab.mviewer.api.display.download_molecule(name)
Download a molecule by name.
chemlab.mviewer.api.display.goto_frame(frame)
Go to a specific frame in the current trajectory.
chemlab.mviewer.api.display.goto_time(timeval)
Go to a specific time (in nanoseconds) in the current trajectory.
chemlab.mviewer.api.display.guess_bonds()
Guess the bonds in the current system
chemlab.mviewer.api.display.load_molecule(name, format=None)
Read a ~chemlab.core.Molecule from a file.
See also:
chemlab.io.datafile
chemlab.mviewer.api.display.load_remote_molecule(url, format=None)
Load a molecule from the remote location specified by url.
Example
load_remote_molecule('https://raw.github.com/chemlab/chemlab-testdata/master/benzene.mol')
chemlab.mviewer.api.display.load_remote_system(url, format=None)
Load a system from the remote location specified by url.
Example
load_remote_system('https://raw.github.com/chemlab/chemlab-testdata/master/naclwater.gro')
chemlab.mviewer.api.display.load_remote_trajectory(url, format=None)
Load a trajectory file from a remote location specified by url.
See also:
load_remote_system
chemlab.mviewer.api.display.load_system(name, format=None)
Read a ~chemlab.core.System from a file.
See also:
chemlab.io.datafile
chemlab.mviewer.api.display.load_trajectory(name, skip=1, format=None)
Load a trajectory file into chemlab. You should call this command after you load a ~chemlab.core.System
through load_system or load_remote_system.
chemlab.mviewer.api.display.reload_system()
Reload the current system in the viewer.
chemlab.mviewer.api.display.write_molecule(filename, format=None)
Write the system displayed in a file as a molecule.
chemlab.mviewer.api.display.write_system(filename, format=None)
Write the system currently displayed to a file.
106
Chapter 3. Reference Documentation
chemlab Documentation, Release 0.4
3.6.3 Selection Commands
Those commands are for selecting objects in the molecular viewer before performing operations on them.
chemlab.mviewer.api.selections.cancel_selection()
Reset the current selection
chemlab.mviewer.api.selections.clear_selection()
Clear the current selection.
chemlab.mviewer.api.selections.hide_selected()
Hide the selected objects.
chemlab.mviewer.api.selections.hide_water()
Conveniency command to hide water molecules.
chemlab.mviewer.api.selections.invert_selection()
Invert the current selection. Select the currently unselected atoms.
chemlab.mviewer.api.selections.select_all()
Select all the visible atoms.
chemlab.mviewer.api.selections.select_atom_type(name)
Select atoms by their type.
You can select all the hydrogen atoms as follows:
select_atom_type('H')
chemlab.mviewer.api.selections.select_atoms(indices)
Select atoms by their indices.
You can select the first 3 atoms as follows:
select_atoms([0, 1, 2])
Return the current selection dictionary.
chemlab.mviewer.api.selections.select_connected_bonds()
Select the bonds connected to the currently selected atoms.
chemlab.mviewer.api.selections.select_molecules(name)
Select all the molecules corresponding to the formulas.
chemlab.mviewer.api.selections.select_selection(selection)
Select a Selection object
chemlab.mviewer.api.selections.selected_atoms()
The indices of the currently selected atoms.
chemlab.mviewer.api.selections.unhide_all()
Unhide all the objects
chemlab.mviewer.api.selections.unhide_selected()
Unhide the selected objects
chemlab.mviewer.api.selections.visible_atoms()
Return the indices of the currently visible atoms.
chemlab.mviewer.api.selections.visible_to_original(visible_index)
Transform the indexes of the visible atoms to the indexes of the total atoms.
3.6. chemlab.mviewer.api
107
chemlab Documentation, Release 0.4
3.6.4 Appeareance Commands
Those commands are for changing the appeareance of the object displayed by the molecular viewer.
chemlab.mviewer.api.appeareance.add_post_processing(effect, **options)
Apply a post processing effect.
Parameters
effect: string The effect to be applied, choose between ssao, outline, fxaa, gamma.
**options: Options used to initialize the effect, check the List of Post Processing Effects for a complete reference of all the options.
Returns
A string identifier that can be used to reference the applied effect.
chemlab.mviewer.api.appeareance.change_background(color)
Setup the background color to color.
Example:
change_background('black')
change_background('white')
change_background('#ffffff')
You can call this function interactively by using:
change_color.interactive()
A new dialog will popup with a color chooser.
See also:
chemlab.graphics.colors.parse_color()
chemlab.mviewer.api.appeareance.change_color(color)
Change the color of the currently selected objects. color is represented as a string. Otherwise color can be
passed as an rgba tuple of values between 0, 255
Reset the color by passing color=None.
You can call this function interactively by using:
change_color.interactive()
A new dialog will popup with a color chooser.
chemlab.mviewer.api.appeareance.change_default_radii(def_map)
Change the default radii
chemlab.mviewer.api.appeareance.change_post_processing_options(str_id,
tions)
Change the options of the post processing effect referred by its string id.
**op-
chemlab.mviewer.api.appeareance.change_radius(value)
Change the radius of the currently selected atoms by a certain value.
If value is None, set the radius to the default value.
chemlab.mviewer.api.appeareance.clear_post_processing()
Remove all post processing effects.
chemlab.mviewer.api.appeareance.list_post_processing()
List all the post processing effects by name.
108
Chapter 3. Reference Documentation
chemlab Documentation, Release 0.4
chemlab.mviewer.api.appeareance.remove_post_processing(str_id)
Remove a post processing effect by passing its string id provided by add_post_processing().
chemlab.mviewer.api.appeareance.scale_atoms(fac)
Scale the currently selected atoms atoms by a certain factor fac.
Use the value fac=1.0 to reset the scale.
chemlab.mviewer.api.appeareance.screenshot(filename, width=None, height=None)
Make a screenshot of the current view. You can tweak the resolution up to what your GPU memory supports.
By defaults it uses the current window resolution.
Example:
screenshot('screen.png', 1200, 1200)
3.7 chemlab.qc
This package contains quantum chemistry utilities.
Note: this module is include mainly for illustration/demo purposes. If you wish to maintain a quantum chemistry
section in chemlab, post an issue on http://github.com/chemlab/chemlab/issues .
chemlab.qc.molecular_orbital(coords, mocoeffs, gbasis)
Return a molecular orbital given the nuclei coordinates, as well as molecular orbital coefficients and basis set
specification as given by the cclib library.
The molecular orbital is represented as a function that takes x, y, z coordinates (in a vectorized fashion) and
returns a real number.
3.8 chemlab.notebook
This package contains commands useful in the IPython notebook
chemlab.notebook.download_molecule(name)
Fetch a molecule from the web by its common name
chemlab.notebook.load_molecule(name, format=None)
Read a ~chemlab.core.Molecule from a file.
See also:
chemlab.io.datafile
chemlab.notebook.load_remote_molecule(url, format=None)
Load a molecule from the remote location specified by url.
Example
load_remote_molecule('https://raw.github.com/chemlab/chemlab-testdata/master/benzene.mol')
chemlab.notebook.load_remote_system(url, format=None)
Load a system from the remote location specified by url.
Example
3.7. chemlab.qc
109
chemlab Documentation, Release 0.4
load_remote_system('https://raw.github.com/chemlab/chemlab-testdata/master/naclwater.gro')
chemlab.notebook.load_remote_trajectory(url, format=None, skip=1)
Load a trajectory file from a remote location specified by url.
See also:
load_remote_system
chemlab.notebook.load_system(name, format=None)
Read a ~chemlab.core.System from a file.
See also:
chemlab.io.datafile
chemlab.notebook.load_trajectory(name, format=None, skip=1)
Read a trajectory from a file.
See also:
chemlab.io.datafile
110
Chapter 3. Reference Documentation
CHAPTER 4
License
Chemlab is released under the GNU GPLv3 and its main developer is Gabriele Lanaro.
111
chemlab Documentation, Release 0.4
112
Chapter 4. License
Python Module Index
c
chemlab.graphics.transformations, 86
chemlab.mviewer.api.core, 105
chemlab.notebook, 109
113
chemlab Documentation, Release 0.4
114
Python Module Index
Index
A
AbstractDB (class in chemlab.db.base), 101
AbstractRenderer (class in chemlab.graphics.renderers),
67
add() (chemlab.core.System method), 54
add_post_processing()
(chemlab.graphics.QtViewer
method), 64
add_renderer() (chemlab.graphics.QtTrajectoryViewer
method), 66
add_renderer() (chemlab.graphics.QtViewer method), 64
add_ui() (chemlab.graphics.QtTrajectoryViewer method),
66
add_ui() (chemlab.graphics.QtViewer method), 65
affine_matrix_from_points()
(in
module
chemlab.graphics.transformations), 89
angle_between_vectors()
(in
module
chemlab.graphics.transformations), 90
Arcball (class in chemlab.graphics.transformations), 89
arcball_constrain_to_axis()
(in
module
chemlab.graphics.transformations), 90
arcball_map_to_sphere()
(in
module
chemlab.graphics.transformations), 90
arcball_nearest_axis()
(in
module
chemlab.graphics.transformations), 91
aspectratio (Camera attribute), 85
Atom (class in chemlab.core), 49
atom_export_array (Molecule attribute), 51
atom_export_array (System attribute), 53
atom_to_molecule_indices()
(chemlab.core.System
method), 54
AtomRenderer (class in chemlab.graphics.renderers), 69
autozoom() (chemlab.graphics.camera.Camera method),
85
bonds (System attribute), 53
box_vectors (System attribute), 53
BoxRenderer (class in chemlab.graphics.renderers), 74
C
Camera (class in chemlab.graphics.camera), 84
camera (QChemlabWidget attribute), 83
can_read (IOHandler attribute), 61
can_write (IOHandler attribute), 62
center_of_mass (Molecule attribute), 51
charge (Atom attribute), 50
charge_array (Molecule attribute), 51
charge_array (System attribute), 52
check_feature()
(chemlab.io.handlers.IOHandler
method), 62
chemlab.graphics.transformations (module), 86
chemlab.mviewer.api.core (module), 105
chemlab.notebook (module), 109
ChemlabDB (class in chemlab.db), 102
ChemSpiderDB (class in chemlab.db), 102
CirDB (class in chemlab.db), 103
clip_matrix()
(in
module
chemlab.graphics.transformations), 91
CmlIO (class in chemlab.io.handlers), 58
compose_matrix()
(in
module
chemlab.graphics.transformations), 91
concatenate_matrices()
(in
module
chemlab.graphics.transformations), 91
copy() (chemlab.core.Atom method), 50
copy() (chemlab.core.Molecule method), 51
copy() (chemlab.core.System method), 54
crystal() (in module chemlab.core), 57
current_frame() (in module chemlab.mviewer.api.core),
105
B
current_frame_times()
(in
module
chemlab.mviewer.api.core), 105
background_color (QChemlabWidget attribute), 83
BallAndStickRenderer
(class
in
chem- current_nframes() (in module chemlab.mviewer.api.core),
105
lab.graphics.renderers), 70
current_representation()
(in
module
chemBondRenderer (class in chemlab.graphics.renderers), 70
lab.mviewer.api.core), 105
bonds (Molecule attribute), 51
115
chemlab Documentation, Release 0.4
current_system() (in module chemlab.mviewer.api.core),
105
current_time() (in module chemlab.mviewer.api.core),
105
current_trajectory()
(in
module
chemlab.mviewer.api.core), 105
CylinderRenderer (class in chemlab.graphics.renderers),
76
D
datafile() (in module chemlab.io), 58
decompose_matrix()
(in
module
chemlab.graphics.transformations), 92
DefaultRenderer (class in chemlab.graphics.renderers),
67
directory (LocalDB attribute), 103
display_system() (in module chemlab.graphics), 62
display_trajectory() (in module chemlab.graphics), 63
distance() (in module chemlab.graphics.transformations),
92
distances_within() (in module chemlab.utils), 104
down()
(chemlab.graphics.transformations.Arcball
method), 89
download_molecule() (in module chemlab.notebook),
109
drag()
(chemlab.graphics.transformations.Arcball
method), 89
draw()
(chemlab.graphics.renderers.AbstractRenderer
method), 67
draw_vertices()
(chemlab.graphics.renderers.DefaultRenderer
method), 68
draw_vertices()
(chemlab.graphics.renderers.ShaderBaseRenderer
method), 67
E
from_arrays() (chemlab.core.Molecule class method), 52
from_arrays() (chemlab.core.System class method), 54
from_fields() (chemlab.core.Atom class method), 50
from_json() (chemlab.core.System class method), 55
FXAAEffect (class in chemlab.graphics.postprocessing),
77
G
GammaCorrectionEffect
(class
in
chemlab.graphics.postprocessing), 78
geometric_center (Molecule attribute), 51
get() (chemlab.db.base.AbstractDB method), 101
get() (ChemlabDB method), 102
get() (ChemSpiderDB method), 102, 103
get() (CirDB method), 103
get() (LocalDB method), 104
get() (RcsbDB method), 104
get_molecule() (chemlab.core.System method), 55
getconstrain() (chemlab.graphics.transformations.Arcball
method), 89
GlowEffect (class in chemlab.graphics.postprocessing),
79
GromacsIO (class in chemlab.io.handlers), 59
guess_bonds() (chemlab.core.Molecule method), 52
guess_bonds() (chemlab.core.System method), 55
H
has_renderer() (chemlab.graphics.QtViewer method), 65
I
identity_matrix()
(in
module
lab.graphics.transformations), 93
inverse_matrix()
(in
module
lab.graphics.transformations), 93
IOHandler (class in chemlab.io.handlers), 61
is_same_transform()
(in
module
lab.graphics.transformations), 93
chemchem-
chem-
EdrIO (class in chemlab.io.handlers), 59
L
empty() (chemlab.core.System class method), 54
euler_from_matrix()
(in
module
chem- light_dir (QChemlabWidget attribute), 83
lab.graphics.transformations), 92
LineRenderer (class in chemlab.graphics.renderers), 74
euler_from_quaternion()
(in
module
chem- load_molecule() (in module chemlab.notebook), 109
lab.graphics.transformations), 92
load_remote_molecule() (in module chemlab.notebook),
euler_matrix()
(in
module
chem109
lab.graphics.transformations), 92
load_remote_system() (in module chemlab.notebook),
export (Atom attribute), 50
109
export (Molecule attribute), 51
load_remote_trajectory() (in module chemlab.notebook),
110
F
load_system() (in module chemlab.notebook), 110
load_trajectory() (in module chemlab.notebook), 110
fd (IOHandler attribute), 61
LocalDB (class in chemlab.db), 103
fields (Atom attribute), 50
formula (Molecule attribute), 51
M
fov (Camera attribute), 85
frames() (in module chemlab.mviewer.api.core), 105
m_array (Molecule attribute), 51
116
Index
chemlab Documentation, Release 0.4
m_array (System attribute), 52
mass (Atom attribute), 49
mass (Molecule attribute), 51
matrix (Camera attribute), 85
matrix()
(chemlab.graphics.transformations.Arcball
method), 89
merge_systems() (in module chemlab.core), 57
mol_export (System attribute), 53
mol_indices (System attribute), 53
mol_n_atoms (System attribute), 54
mol_to_atom_indices() (chemlab.core.System method),
55
molecular_orbital() (in module chemlab.qc), 109
Molecule (class in chemlab.core), 50
MolIO (class in chemlab.io.handlers), 60
mouse_rotate()
(chemlab.graphics.camera.Camera
method), 85
mouse_zoom()
(chemlab.graphics.camera.Camera
method), 85
move_to() (chemlab.core.Molecule method), 52
msg (in module chemlab.mviewer.api.core), 105
N
n_atoms (Molecule attribute), 51
n_atoms (System attribute), 53
n_mol (System attribute), 53
next()
(chemlab.graphics.transformations.Arcball
method), 89
NoEffect (class in chemlab.graphics.postprocessing), 80
normalized()
(in
module
chemlab.graphics.transformations), 93
O
orbit_x() (chemlab.graphics.camera.Camera method), 85
orbit_y() (chemlab.graphics.camera.Camera method), 86
orthogonalization_matrix()
(in
module
chemlab.graphics.transformations), 93
OutlineEffect (class in chemlab.graphics.postprocessing),
80
P
paintGL() (chemlab.graphics.QChemlabWidget method),
84
PdbIO (class in chemlab.io.handlers), 60
pivot (Camera attribute), 85
place()
(chemlab.graphics.transformations.Arcball
method), 89
PointRenderer (class in chemlab.graphics.renderers), 72
position (Camera attribute), 84
projection (Camera attribute), 85
projection_from_matrix()
(in
module
chemlab.graphics.transformations), 94
projection_matrix()
(in
module
chemlab.graphics.transformations), 94
Index
Q
QChemlabWidget (class in chemlab.graphics), 82
QtTrajectoryViewer (class in chemlab.graphics), 66
QtViewer (class in chemlab.graphics), 64
quaternion_about_axis()
(in
module
chemlab.graphics.transformations), 95
quaternion_conjugate()
(in
module
chemlab.graphics.transformations), 95
quaternion_from_euler()
(in
module
chemlab.graphics.transformations), 95
quaternion_from_matrix()
(in
module
chemlab.graphics.transformations), 95
quaternion_imag()
(in
module
chemlab.graphics.transformations), 95
quaternion_inverse()
(in
module
chemlab.graphics.transformations), 96
quaternion_matrix()
(in
module
chemlab.graphics.transformations), 96
quaternion_multiply()
(in
module
chemlab.graphics.transformations), 96
quaternion_real()
(in
module
chemlab.graphics.transformations), 96
quaternion_slerp()
(in
module
chemlab.graphics.transformations), 96
R
r (Atom attribute), 49
r_array (Molecule attribute), 50
r_array (System attribute), 52
random_lattice_box() (in module chemlab.core), 57
random_quaternion()
(in
module
chemlab.graphics.transformations), 96
random_rotation_matrix()
(in
module
chemlab.graphics.transformations), 97
random_vector()
(in
module
chemlab.graphics.transformations), 97
RcsbDB (class in chemlab.db), 104
read() (chemlab.io.handlers.IOHandler method), 62
read() (CmlIO method), 58
read() (EdrIO method), 59
read() (GromacsIO method), 59
read() (MolIO method), 60
read() (PdbIO method), 60
read() (XtcIO method), 60, 61
read() (XyzIO method), 61
reflection_from_matrix()
(in
module
chemlab.graphics.transformations), 97
reflection_matrix()
(in
module
chemlab.graphics.transformations), 97
remotefile() (in module chemlab.io), 58
remove_atoms() (chemlab.core.System method), 55
remove_molecules() (chemlab.core.System method), 55
remove_post_processing() (chemlab.graphics.QtViewer
method), 65
117
chemlab Documentation, Release 0.4
remove_renderer() (chemlab.graphics.QtViewer method),
65
renderers (QChemlabWidget attribute), 83
reorder_molecules() (chemlab.core.System method), 55
restore() (chemlab.graphics.camera.Camera method), 86
rotation_from_matrix()
(in
module
chemlab.graphics.transformations), 97
rotation_matrix()
(in
module
chemlab.graphics.transformations), 98
run() (chemlab.graphics.QtViewer method), 65
S
scale_from_matrix()
(in
module
chemlab.graphics.transformations), 98
scale_matrix()
(in
module
chemlab.graphics.transformations), 98
schedule() (chemlab.graphics.QtViewer method), 65
set_text()
(chemlab.graphics.QtTrajectoryViewer
method), 66
setaxes()
(chemlab.graphics.transformations.Arcball
method), 89
setconstrain() (chemlab.graphics.transformations.Arcball
method), 89
ShaderBaseRenderer
(class
in
chemlab.graphics.renderers), 67
shear_from_matrix()
(in
module
chemlab.graphics.transformations), 98
shear_matrix()
(in
module
chemlab.graphics.transformations), 99
simple_clip_matrix()
(in
module
chemlab.graphics.transformations), 99
sort() (chemlab.core.System method), 56
SphereImpostorRenderer
(class
in
chemlab.graphics.renderers), 69
SphereRenderer (class in chemlab.graphics.renderers), 68
SSAOEffect (class in chemlab.graphics.postprocessing),
81
state() (chemlab.graphics.camera.Camera method), 86
store() (LocalDB method), 104
subsystem_from_atoms() (in module chemlab.core), 56
subsystem_from_molecules() (in module chemlab.core),
56
superimposition_matrix()
(in
module
chemlab.graphics.transformations), 99
System (class in chemlab.core), 52
T
TextUI (class in chemlab.graphics.uis), 77
toimage() (chemlab.graphics.QChemlabWidget method),
84
tojson() (chemlab.core.Molecule method), 52
tojson() (chemlab.core.System method), 56
trajectory() (in module chemlab.mviewer.api.core), 105
translation_from_matrix()
(in
module
chemlab.graphics.transformations), 100
translation_matrix()
(in
module
chemlab.graphics.transformations), 100
TriangleRenderer (class in chemlab.graphics.renderers),
73
type (Atom attribute), 49
type_array (System attribute), 52
U
unit_vector()
(in
module
chemlab.graphics.transformations), 100
unproject() (chemlab.graphics.camera.Camera method),
86
update()
(chemlab.graphics.renderers.BoxRenderer
method), 74
update_bounds()
(chemlab.graphics.renderers.CylinderRenderer
method), 76
update_colors()
(chemlab.graphics.renderers.LineRenderer method),
75
update_colors()
(chemlab.graphics.renderers.PointRenderer method),
73
update_colors()
(chemlab.graphics.renderers.TriangleRenderer
method), 74
update_function() (chemlab.graphics.QtTrajectoryViewer
method), 67
update_normals()
(chemlab.graphics.renderers.TriangleRenderer
method), 74
update_positions()
(chemlab.graphics.renderers.AtomRenderer method),
70
update_positions()
(chemlab.graphics.renderers.BallAndStickRenderer
method), 71
update_positions()
(chemlab.graphics.renderers.LineRenderer method),
75
update_positions()
(chemlab.graphics.renderers.PointRenderer method),
73
update_positions()
(chemlab.graphics.renderers.SphereRenderer
method), 69
update_vertices()
(chemlab.graphics.renderers.TriangleRenderer
method), 74
V
vector_norm()
118
(in
module
chemIndex
chemlab Documentation, Release 0.4
lab.graphics.transformations), 100
vector_product()
(in
module
lab.graphics.transformations), 101
chem-
W
WireframeRenderer
(class
in
chemlab.graphics.renderers), 71
write() (chemlab.io.handlers.IOHandler method), 62
write() (CmlIO method), 58
write() (GromacsIO method), 60
write() (XyzIO method), 61
X
XtcIO (class in chemlab.io.handlers), 60
XyzIO (class in chemlab.io.handlers), 61
Index
119