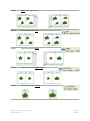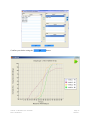
1
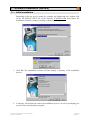
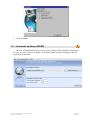
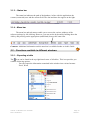
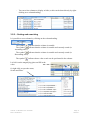
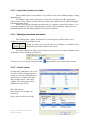
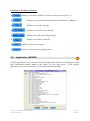
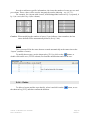
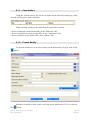
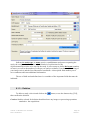
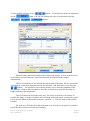
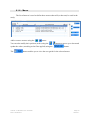
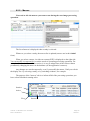
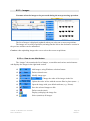
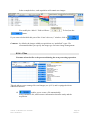
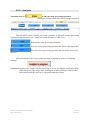
A.I.M. User Guide Image Analysis Authors : B. Moutault & C. Chevalier Date : 20/08/2012 Page 1 Version 1 Preface AIM facilitates the processing of images, using third-party software (ImageJ). AIM enables you to: establish a framework for your studies (date, client, species, device); carry out processing operations and obtain results (in one click); archive the following in a database: your series of images; your processing operations (ImageJ macros); your results files; your individual measurements; your clustered measurements (grouped by variety, image, etc.). calculate new measurements (for example: convert pixels to millimeters); cluster results (by variety, image, series) and to present them (filtered, in table format, in the form of a graph, for export into Excel,…). AIM simplifies processing operations for users by encapsulating them (automatic execution, one click) through the integration of history functions (traceability), rights management (user or super user), color management (UPOV, RHS, …..) and by displaying results in the form of a graph (curve, histogram). AIM facilitates multi-user, multi-workstation usage of the same project (study), as well as the sharing of processing operations (ImageJ macros) or results between partners (bodies, companies,). The field of imaging is becoming an increasingly integral part of our studies and professional projects on a daily basis. The tools available on the market are frequently expensive and too specialized. AIM will facilitate the processing of images, performed using ImageJ software, while offering significant flexibility with regard to the subjects studied (plant, medical, spatial, industrial,…). Some examples of image processing performed using series of GEVES images: - Surface measurements, height and width of grains. (back-lit table, corn, 2009) - Surface spread of fungus on leaves. (scanner, wheat, 2010) - Surface measurements, height and width of leaves. (scanner, rape seed cotyledons, 2010) - Surface measurements, height and width of flower petals. (scanner, flax, 2010) - Ground coverage of plants. (camera in field, peas, 2011) - Kinetics of seed imbibition and germination. (Jacobsen table, multiple species, 2011) - Surface and perimeter measurements to define the thickness of leaves. (scanner, carrot tops, 2011) - Quantification, labeling of colors on leaves and flowers. (back-lit table, peas and orchids, 2012) Authors : B. Moutault & C. Chevalier Date : 20/08/2012 Page 2 Version 1 CONTENTS Preface __________________________________________________ 2 CONTENTS _______________________________________________________________ 3 1 – Software installation (GEVES) _____________________________________________ 6 1.1 – Initial installation __________________________________________________________ 6 1.2 – Automatic updates (GEVES) ________________________________________________ 7 2 – Connection to AIM (GEVES) ______________________________________________ 8 3 – General overview ________________________________________________________ 9 3.1 – Main menu _______________________________________________________________ 9 3.1.1 – Title bar ____________________________________________________________________________ 9 3.1.2 – Toolbar _____________________________________________________________________________ 9 3.1.3 – Status bar __________________________________________________________________________ 10 3.1.4 – Menu bar___________________________________________________________________________ 10 3.2 – Functions available in different windows _____________________________________ 10 3.2.1 – Exporting a table_____________________________________________________________________ 3.2.2 – Sorting and searching _________________________________________________________________ 3.2.3 – Layout of columns in a table____________________________________________________________ 3.2.4 – Managing windows and tables _________________________________________________________ 3.2.5 – List of values ______________________________________________________________________ 10 11 12 12 12 4 – “File” Menu ___________________________________________________________ 14 4.1 – Send a message ___________________________________________________________ 14 4.2 – Application (GEVES) _____________________________________________________ 15 4.3 – Switch database (GEVES) __________________________________________________ 16 4.4 – Change password (GEVES) ________________________________________________ 16 4.5 – Screen shots _____________________________________________________________ 16 4.6 – Quit ____________________________________________________________________ 16 5 – “Referential” Menu _____________________________________________________ 17 5.1 – List of values _____________________________________________________________ 17 5.1.1 – Condition __________________________________________________________________________ 5.1.2 – Result variables______________________________________________________________________ 5.1.3 – Type - Image, Object, Study and File _____________________________________________________ 5.1.4 – Statistical parameters _________________________________________________________________ 18 18 20 21 5.2 – Experimental condition ___________________________________________________ 21 5.2.1 – Consult ____________________________________________________________________________ 22 5.2.2 – Create / Modify______________________________________________________________________ 22 5.2.3 – Delete _____________________________________________________________________________ 24 5.3 – Medium and Source ______________________________________________________ 25 5.3.1 – Consult ____________________________________________________________________________ 25 5.3.2 – Create / Modify______________________________________________________________________ 25 5.3.3 – Delete _____________________________________________________________________________ 26 5.4 – Zone layout _____________________________________________________________ 27 5.4.1 – Consultation ________________________________________________________________________ 5.4.2 – The concept of ZONES _______________________________________________________________ 5.4.3 – Create / Modify______________________________________________________________________ 5.4.4 – Delete _____________________________________________________________________________ 5.4.5 – Example ___________________________________________________________________________ 27 27 28 29 30 5.5 – List of Colors ____________________________________________________________ 31 5.5.1 – Consultation ________________________________________________________________________ 31 Authors : B. Moutault & C. Chevalier Date : 20/08/2012 Page 3 Version 1 5.5.2 – Color Functions _____________________________________________________________________ 31 5.5.3 – Coloring the rows (RGB, HSL) _________________________________________________________ 32 5.5.4 – Color Group Labels __________________________________________________________________ 33 5.6 – Species – Individual - Company (Non GEVES) _______________________________ 34 5.6.1 – Consultation ________________________________________________________________________ 34 5.6.2 – Create / Modify______________________________________________________________________ 34 5.6.3 – Delete _____________________________________________________________________________ 34 6 – “Processing Software” Menu _____________________________________________ 35 6.1 – Open ___________________________________________________________________ 35 6.2 – Application path _________________________________________________________ 35 6.3 – Define __________________________________________________________________ 35 6.4 – Default _________________________________________________________________ 35 6.5 – Download _______________________________________________________________ 35 6.6 – Online support ___________________________________________________________ 35 6.7 – Close automatically _______________________________________________________ 36 7 – “Quick processing” Menu _____________________________________________ 37 7.1 – Quick processing ________________________________________________________ 37 7.1.1 – How to use this feature ________________________________________________________________ 7.1.2 – Study______________________________________________________________________________ 7.1.3 – Images ____________________________________________________________________________ 7.1.4 – Macros ____________________________________________________________________________ 7.1.5 – Analysis ___________________________________________________________________________ 37 38 38 39 40 8 – “Macro” Menu _________________________________________________________ 41 8.1 – Management of “Macros” _________________________________________________ 41 8.1.1 – Consulting a macro ___________________________________________________________________ 8.1.2 – Create / Modify a macro _______________________________________________________________ 8.1.3 – Deletion ___________________________________________________________________________ 8.1.4 – Import / Export ______________________________________________________________________ 42 42 45 45 9 “Study” Menu ___________________________________________________________ 47 9.1 – Study declaration ________________________________________________________ 47 9.1.1 – Consultation ________________________________________________________________________ 9.1.2 – Create/ Modify ______________________________________________________________________ 9.1.3 – Deletion ___________________________________________________________________________ 9.1.4 – Materials ___________________________________________________________________________ 9.1.5 – Acquisition _________________________________________________________________________ 9.1.6 – Macro _____________________________________________________________________________ 48 48 49 50 51 53 9.2 – Analysis _________________________________________________________________ 54 9.2.1 – How to use this feature ________________________________________________________________ 9.2.2 – Macros ____________________________________________________________________________ 9.2.3 – Images ____________________________________________________________________________ 9.2.3.a – How to use this feature___________________________________________________________ 9.2.3.b – Loading images ________________________________________________________________ 9.2.4 – Files ______________________________________________________________________________ 9.2.5 – Analyses ___________________________________________________________________________ 54 55 56 56 57 58 59 9.3 – Integration ______________________________________________________________ 60 9.3.1 – Processing history and results files _______________________________________________________ 9.3.2 – Display ____________________________________________________________________________ 9.3.3 – Options ____________________________________________________________________________ 9.3.4 – Integrate ___________________________________________________________________________ 60 61 62 64 9.4 – Calculations _____________________________________________________________ 65 9.4.1 – How to use this feature ________________________________________________________________ 65 9.5 – Results _________________________________________________________________ 68 9.5.1 – Display ____________________________________________________________________________ 68 9.5.2 – Type of result _______________________________________________________________________ 69 Authors : B. Moutault & C. Chevalier Date : 20/08/2012 Page 4 Version 1 9.5.3 –Clustering __________________________________________________________________________ 69 9.5.4 – Deletion ___________________________________________________________________________ 73 9.5.5 – Graph _____________________________________________________________________________ 73 10 – “Windows” Menu ______________________________________________________ 76 10.1 – How to use this feature ___________________________________________________ 76 11 – “Help” Menu _________________________________________________________ 77 11.1 – How to use this feature ___________________________________________________ 77 12 – Frequently-asked questions ______________________________________________ 79 Authors : B. Moutault & C. Chevalier Date : 20/08/2012 Page 5 Version 1 1 – Software installation (GEVES) 1.1 – Initial installation Depending on the site you are using (for example, the Magneraud site), double click on the file INSTALL.EXE file in the directory Z:\Windev\AIM, then follow the installation assistant’s prompts, clicking on Next at each stage. 1. Click Yes. The installation assistant will then display a summary of the installation process: 2. A message will indicate the end of the installation process, as well as prompting you to create icons and launch the program: Authors : B. Moutault & C. Chevalier Date : 20/08/2012 Page 6 Version 1 3. Click on Finish. 1.2 – Automatic updates (GEVES) Once the AIM application has been networked, updates will be installed automatically. As soon as a new version is available, an automatic update prompt will appear when the application is launched. Authors : B. Moutault & C. Chevalier Date : 20/08/2012 Page 7 Version 1 2 – Connection to AIM (GEVES) The password used to connect to the database is the same as that used for all Oracle databases: Surname + Initial of first name Database Note: if you do not have an Oracle account, contact our database administrator (DBA) [email protected] When you first connect to the database, an information window will pop up and ask you to find your name in the address database: If your name appears in the window, select it and click on OK. Should your name not appear, search for it by clicking on “Full list individuals”. If your name does not exist in the address database, create a profile by going to Start\Programs\Adr\Adr Authors : B. Moutault & C. Chevalier Date : 20/08/2012 Page 8 Version 1 3 – General overview 3.1 – Main menu 3.1.1 – Title bar The title bar indicates the name of the software package and the active menu in square brackets. 3.1.2 – Toolbar The toolbar which appears in the start window remains available in all the main windows of the software package, although certain buttons may sometimes be inactive, in which case no action is possible, and they may be greyed out. The following functions are available: Quit , Close F2 Go to first entry F3 Go to previous entry F4 Go to next entry F5 Go to last entry F6 Search for entry using selection criteria F7 Delete selection criteria Ctrl + R Manage selection criteria Ctrl + G Refresh F8 Add entry F10 Modify entry F11 Delete entry F12 Print current Ctrl + P Import Ctrl + I Export Ctrl + E Copy entry Ctrl + D Select / Unselect All Ctrl + M List of data values F9 Help F1 Authors : B. Moutault & C. Chevalier Date : 20/08/2012 Page 9 Version 1 3.1.3 – Status bar The status bar indicates the path of the database, in line with the application, the current (connected) user and the current field. The date and time also appear on the right. 3.1.4 – Menu bar The menu bar and sub-menus enable you to access the various windows of the software package by left-clicking. However, you can use the keyboard by holding down the Alt key and pressing on the appropriate (underlined) letter at the same time. Comment: Additional information on this menu bar is available further on in this Guide. 3.2 – Functions available in different windows 3.2.1 – Exporting a table The icon can be found in the top right-hand corner of all tables. This icon provides you with the following options: - You can export the information contained in the window into various formats: Excel, Word, Authors : B. Moutault & C. Chevalier Date : 20/08/2012 Page 10 Version 1 - You can select columns to display or hide (or this can be done directly by rightclicking on a column heading) - 3.2.2 – Sorting and searching It is possible to sort columns by clicking on the column heading. The symbol indicates that the column is sortable. The symbol indicates that the column is sortable and currently sorted (in Ascending order). The symbol indicates that the column is sortable and currently sorted (in Descending order). The symbol indicates that a value search can be performed in the column. Left click on the magnifying glass and fill in the value. Or right-click to open the menu; Search and Filter. Authors : B. Moutault & C. Chevalier Date : 20/08/2012 Page 11 Version 1 3.2.3 – Layout of columns in a table If the column layout is not suitable, it is possible to move the columns simply by using drag-and-drop. All column widths can be adjusted to suit the user. In order to do this, position the mouse cursor on the column dividers and move them to the right or the left, while holding the left mouse button down. When browsing the left-hand part of the title of a column, a padlock will appear. You can set the columns to the left of the padlock by clicking. This means that, when you move the horizontal bar, the left-hand columns will not move anymore. 3.2.4 – Managing windows and tables The windows have “splits” (horizontal or vertical split bars) which allow you to modify the size of tables and other items. Place the cursor over the split (the cursor changes to a double arrow), hold down (left click) and move the cursor. In certain windows in AIM, you will find search criteria in the upper left-hand corner of the tables. Select fields to filter the list. You can use % as a search criterion and the button allows you to delete these criteria. 3.2.5 – List of values Certain entry fields allow you to call up a list of values. Simply place the cursor over the entry field and press the [F9] key. A window will open and you must select a value and validate. The information will be added to the entry fields. Filter the request: Enter a letter, for example “m” Press [F9] Select “Mint” and click on [Ok] Authors : B. Moutault & C. Chevalier Date : 20/08/2012 Page 12 Version 1 The information and the relevant code are added to the species field. Note: The symbol “%” can also be used and is compatible with previous versions of GEVES applications (GAD, DHS, VAT, GED, GEV,…). Caution: If the criteria you enter are too narrow, the list of values will remain empty, for example if the code begins with “9” Authors : B. Moutault & C. Chevalier Date : 20/08/2012 Page 13 Version 1 4 – “File” Menu 4.1 – Send a message In order to render the application more interactive, AIM provides you with the possibility of managing a messaging system. To access this system, click on Send a message in the File menu. When you first launch the application, click on the Click on the tabs to show New messages or Sent messages button. List of accounts: the main account is selected by default Click here to indicate the path of the file attached to the message Authors : B. Moutault & C. Chevalier Date : 20/08/2012 Page 14 Version 1 Functions of the different buttons: Enables you to delete, modify or create a new account (see point 3.1) Enables you to update data following any modifications or additions. Enables you to send a message. Enables you to create a new message. Enables you to edit an existing message. Enables you to delete a message. Enables you to print a message. Enables you to exit the messaging system. 4.2 – Application (GEVES) GEVES applications can be accessed directly through AIM without users having to re-enter their identification details, thanks to the option “Use the same log-in”. If the required application is not on your computer, it will be installed automatically. Authors : B. Moutault & C. Chevalier Date : 20/08/2012 Page 15 Version 1 4.3 – Switch database (GEVES) This submenu enables you to connect directly to another database, without closing the application. The prompt window displays a list of all available servers. Those ending in “Adre” concern data from production sites and those ending in “Copi” allow you to work on a copy of the database of one of the sites. The copies are loaded from production data from a site following a simple request. 4.4 – Change password (GEVES) It is possibly to change passwords directly in AIM. Enter the new password and click on the “Ok” button in order for the password to apply to all GEVES applications on all sites. 4.5 – Screen shots As the name suggests, when you click on “screen shot”, an image (.jpg) is saved on your computer. This image corresponds to what is displayed within the software package on the screen. Then a window opens, informing you of the location of the file image which has been generated and asking you if you wish to view the image. 4.6 – Quit This keeps your various settings for a future session and closes the AIM software package. Authors : B. Moutault & C. Chevalier Date : 20/08/2012 Page 16 Version 1 5 – “Referential” Menu 5.1 – List of values This window allows you to manage information in the secondary tables, contained in the main windows. There are three tabs available that enable you manage the different values for TYPES and VARIABLES for the AIM application. For each table: you can type the information directly into the final row, or click on the button. To modify information, double click on a row to enter data. To delete information, select a row and use the button or the shortcut key [F12] and then confirm the deletion process. Authors : B. Moutault & C. Chevalier Date : 20/08/2012 Page 17 Version 1 5.1.1 – Condition “Conditions” describes the framework within which you have acquired your series of images. Conditions enable you to keep a specific numerical value for each study acquisition. The most common example is keeping the “magnification” ratio, in order to ensure traceability and/or to use it during the image-processing phase, or the calculation phase, to transpose measurements in pixels into millimeters. The table AIM200_VAR_CONDITION contains a (unique) code and a label. Reminder: The rows highlighted in red indicate that the registered entry is already being used in a study and can no longer be deleted or modified. 5.1.2 – Result variables Result variables have two uses: - extracting measurements (columns) from results files, predefining them by their labels; calculating new result variables using a formula applied to a results table (similar to the way in which spreadsheets (Excel) work). Use the buttons to manage the variables. On the bottom left, there is an overview of the formula for the selected row. On the bottom right, there is a reminder of the nomenclature that may be used in the formulas. Authors : B. Moutault & C. Chevalier Date : 20/08/2012 Page 18 Version 1 The following elements are required in order to create a new variable: a unique number; a value for the ‘display order” (presentation of results); a label; the unit in which the variable expressed; the variable type; the heading of the column or formula. If the variable is intended to contain measurements extracted from results files, the column heading must be specific. For example, to retrieve surface area measurements, use the heading: “Area” If the variable is intended to contain measurements calculated on the basis of a formula, its wording needs to be edited. For example, in order to transpose surface measurements, from pixels to millimetres², the formula is and must be added on either side of the formula, in order to apply the calculation to all the rows to be displayed. You must replace: pixel surface area magnification squared with with with {1} which is the unique number of the variable [MAGN] which is the unique code for the condition power (…, 2) which is a Windev function Comments can also be inserted, by starting the row with a double slash. Another example involves a formula which allows you to calculate the volume of an ovoid shape. With the same surface variable {1}, magnification [MAGN] and the following Windev functions: “root”, “power” and “pi”. Authors : B. Moutault & C. Chevalier Date : 20/08/2012 Page 19 Version 1 to learn about all Windev functions to refer to: another result variable; a condition; a column contained in the calculations table *; a column which will contain the result of the formula; the name of the calculations table. * See the Calculation window (§ 9.4) for the list of columns present (row, image_name, …) 5.1.3 – Type - Image, Object, Study and File This feature enables you to describe the images and their various states (color, black and white,…). The column entitled “number of days archived” enables you to define the time period during which an image will be stored before you are prompted to delete it. This feature enables you to describe the objects being studied (type of material used). Authors : B. Moutault & C. Chevalier Date : 20/08/2012 Page 20 Version 1 This feature enables you to describe studies, for example, by function type (taking measurements, counting, examples, …) or by user type (seed sector, plant varieties sector, pests sector,…). This feature enables you to describe the results of image processing operations. Essentially, the processing operations produce a results file which is integrated into the database (FRA type), but they can also generate other types of files, which are not destined to be integrated (for example, a report file) (FRI type). There are also processes that do not generate any results files, such as processes which modify the color of images. The column relating to the number of days archived enables you to specify the length of time for which a processing result will be archived you are prompted to delete it. 5.1.4 – Statistical parameters This feature enables you to define a number of statistical parameters, by specifying the SQL syntax required in order to cluster the results generated by AIM. Note: SQL syntax must be compatible with ORACLE for AIM use within GEVES and with HYPERFILESQL for EXTERNAL use. Example: STD, MAX, MIN, COUNT, AVG, MEDIAN, SUM, VARIANCE, … 5.2 – Experimental condition You must define the experimental conditions for each new AIM study. This enables you to provide additional information during the automatized processing of data or calculations. Authors : B. Moutault & C. Chevalier Date : 20/08/2012 Page 21 Version 1 In general, these conditions are identical within the same study type. That is why experimental conditions are listed by type. This window enables you to consult and manage conditions (add-modify-delete). 5.2.1 – Consult When the window opens, the list is displayed according to the criteria entered in the search bar. You should use the “empty” study type to display everything. Once you have selected a list, the details will appear in the second table. . 5.2.2 – Create / Modify To open the window to create a list of experimental conditions, use the shortcut key [F10], or click on the button. Authors : B. Moutault & C. Chevalier Date : 20/08/2012 Page 22 Version 1 Likewise, to modify the experimental conditions, select a list and use the shortcut key [F11], or click on the button. Insert the type of study, the title and species. Click on the ‘OK’ button to validate. Note: the species is optional, but if it is stipulated by the user, then this list of experimental conditions will only apply to that species. Once the list has been created, you must add/remove conditions. In the details table, click on the button, or on conditions (multiple conditions may be selected). to select new Caution: when conditions are added, they do not, by default, contain any values or comments. It is up to you to provide that additional information by entering it directly into the details table. Authors : B. Moutault & C. Chevalier Date : 20/08/2012 Page 23 Version 1 To remove conditions, select them and use the shortcut key [F12], or click on the button and confirm the deletion. 5.2.3 – Delete In order to delete a list of experimental conditions, you must first of all clear the conditions contained therein. You must select all the conditions, and then confirm the deletion. Then you can select the conditions list to be deleted by clicking on the using the shortcut key [F12] and then confirming the deletion. Authors : B. Moutault & C. Chevalier Date : 20/08/2012 button, or Page 24 Version 1 5.3 – Medium and Source This window allows you to manage the medium and source for the images used in AIM. You must select the medium/source for each acquisition. 5.3.1 – Consult Select the source (in the main table) to see the various media linked to it (in the detail table). 5.3.2 – Create / Modify SOURCE To open the window to create a new source, use the shortcut key [F10], or click on on the Authors : B. Moutault & C. Chevalier Date : 20/08/2012 button. Page 25 Version 1 Likewise, to modify a source, select a row and use the shortcut key [F11], or click on the button. Insert the name, location, a comment and the number of media you wish to define concerning this source. Confirm by clicking on the OK button. Caution: When modifying the number of media, if you insert a lower number, the last media defined will be automatically deleted. (See § 5.3.3.) MEDIUM Then you must indicate the media created automatically at the same time as the “source” (number of media). In order to modify the media, use the shortcut key [F11] or click on the button, or double-click on the row. A window will open allowing you to change the name, validity, date, resolution and comment. 5.3.3 – Delete To delete a source (and all corresponding media), select the source and click on the button, or use the shortcut key [F12], and then confirm the deletion. Authors : B. Moutault & C. Chevalier Date : 20/08/2012 Page 26 Version 1 5.4 – Zone layout This window allows you to manage the zone layout used in AIM. 5.4.1 – Consultation Select a zone layout in the main table to see the description of the different zones in the details table. 5.4.2 – The concept of ZONES In image processing, depending on the type of measurements used and the form of the objects being studied, users have a wide range of layout options at their disposal. The object can be displayed alone or in batches of hundreds of objects. Objects may originate from the same population, or from various populations (population, group, batch, material, variety, replication). Each group has one defined space in the image series: one zone. Authors : B. Moutault & C. Chevalier Date : 20/08/2012 Page 27 Version 1 In AIM, you can manage several zones: 1 zone 2 zones 4 zones 16 zones Each zone represents one type of material and may contain one or more objects. 1 zone layout with 10 objects per zone 4 zone layout with 1 object per zone This image layout, which arranges the objects by type of material and number of zones, is called the zone layout, and you must to enter it in AIM when declaring studies. (See example § 5.4.4.) 5.4.3 – Create / Modify LAYOUT To open the window to create a zone layout, use the shortcut key [F10] or click on the button. Likewise, to make modifications, select a row and use the shortcut key [F11], or click on the simply double-click. button, or You should insert the name and number of zones you wish to define for the layout. It is also possible to add a description of the layout. Confirm the selection by clicking on the ‘OK’ button. Authors : B. Moutault & C. Chevalier Date : 20/08/2012 Page 28 Version 1 In order to add more specific information, also insert the number of zones per row and per column. These values will be used to integrate the results (indexing – see § 9.3.3.). For example, for a layout with 4 zones, AIM distinguishes between 2 by 2 (squared), 4 by 1 (in a row) and 1 by 4 (in a column). Caution : When modifying the number of zones, if you indicate a lower number, the last zones defined will be automatically deleted. (See § 5.4.4.) ZONE Then you must fill in the zones that are created automatically at the same time as the “layout” (number of zones). To modify those zones, use the shortcut key [F11] or click on the button, or double-click on the row (TITLE column). Perform the modification and exit the row. 5.4.4 – Delete To delete a layout (and the zone details), select it and click on the the shortcut key [F12], and then confirm the deletion. Authors : B. Moutault & C. Chevalier Date : 20/08/2012 button, or use Page 29 Version 1 5.4.5 – Example A study is being carried out on the color of leaves from a dozen plant varieties. A sample of some twenty or so leaves for each variety has been collected in the field. Ex 1 A zone layout with 1 zone is selected so that each scan shows only one plant variety. This will make the operation easier. A 1 zone layout has been created Ex 2 A zone layout with 4 zones is selected so that. each scan contains 4 varieties or, conversely, so that a single variety may be spread out over 4 scans. This feature ensures that a a failed scan does not lead to the loss of all measurements for a variety. A layout of 4 zones (squared, 2 by 2) has been created. Authors : B. Moutault & C. Chevalier Date : 20/08/2012 Page 30 Version 1 5.5 – List of Colors This window enables you to consult the color classification schemes, which are used as a repository in the AIM application. 5.5.1 – Consultation As with the other application windows, a search bar enables you to filter the information to be displayed. Choose the color classification scheme: UPOV, RHS or GEVES... Specify a language: French, English, German or Spanish… You can also filter the colors referenced in AIM by Label or by Code. The “Coloring” checkbox enables you to color the displayed rows. Note: Certain languages are not available for some color classes. 5.5.2 – Color Functions This option enables you to activate the button in the following windows: “Integration”, “Calculation” and “Results”. (§ 9.3, 9.4 and 9.5) Authors : B. Moutault & C. Chevalier Date : 20/08/2012 Page 31 Version 1 Active Inactive In AIM windows, when you click on the button, a sub-menu appears. 5.5.3 – Coloring the rows (RGB, HSL) This feature enables you to color the rows in the results tables described by their plans, for a better visual appreciation of the colors. This is often achieved using the RGB color model, but also by using Hue, Saturation and Luminosity, or directly by using a number from the AIM color group. Indicate the color reference. In order to ensure correspondence between the columns in your results and reference plans, doubleclick or use the arrows. Authors : B. Moutault & C. Chevalier Date : 20/08/2012 Page 32 Version 1 5.5.4 – Color Group Labels This feature enables you to name the colors of the rows of the results tables defined by group numbers, for a better understanding of the measurements. It also allows you to color rows. (§ 5.5.3.). You simply need to: indicate the column containing the number of the color group; select the language in which you wish the label to appear. Feature enabling you to concatenate the label and its color code. Feature enabling you to color the rows.. (§ 5.5.3.). Reminder: Not all languages are available with regard to color classes. Authors : B. Moutault & C. Chevalier Date : 20/08/2012 Page 33 Version 1 5.6 – Species – Individual - Company (Non GEVES) This window enables you to manage the species, individuals and companies used in the AIM application. By default, this window is hidden from GEVES users, who benefit from centralized management of species, individuals and companies. 5.6.1 – Consultation The three tables are split into three tabs. 5.6.2 – Create / Modify In order to add a new entry, place the cursor on the last row and type in the entry field. The codes used should be unique and the labels should be non-zero. Note: for individuals, the ACTIVE ( Y = yes , N = no) column enables the individual to be masked or displayed in the input windows. The same applies for companies. 5.6.3 – Delete To delete an entry, select it and click on the button. Note : If an individual or company is no longer valid, it is preferable to deactivate it rather than deleting it. Authors : B. Moutault & C. Chevalier Date : 20/08/2012 Page 34 Version 1 6 – “Processing Software” Menu 6.1 – Open “Open” enables you to launch the image-processing software. 6.2 – Application path “Application path” enables you to consult the executable file path (in grey) as defined on your computer. 6.3 – Define “Define” enables you to select the executable item (path and name of third party software). 6.4 – Default “Default” enables you to select the executable file path by default, as defined by the IT service of your company. It is stipulated in table STD_IDENTIFIANT. 6.5 – Download “Download” enables you to open the “ImageJ” software website directly on the downloads page. http://rsbweb.nih.gov/ij/download.html 6.6 – Online support “Online support” enables you to open the “ImageJ” software website on the homepage. http://rsb.info.nih.gov/ij/index.html “Online support for macros”: http://rsb.info.nih.gov/ij/developer/macro/functions.html Authors : B. Moutault & C. Chevalier Date : 20/08/2012 Page 35 Version 1 6.7 – Close automatically “Close automatically” is an option for automatic closure of the image-processing software when it is opened in the “Analysis” and “Quick Processing” windows. Authors : B. Moutault & C. Chevalier Date : 20/08/2012 Page 36 Version 1 7 – “Quick processing” Menu 7.1 – Quick processing As its name suggests, this window enables you to process a series of images quickly. The study declaration and integration of results stages are bypassed (although they can still be accessed if necessary). You can also open this window with the button from the window MAIN. 7.1.1 – How to use this feature When the window opens, AIM automatically launches a study. All you need to do is to: upload the images; select a macro; launch the analysis. Authors : B. Moutault & C. Chevalier Date : 20/08/2012 Page 37 Version 1 7.1.2 – Study Every time the window is opened, a new study is automatically created under the heading “Undefined” with the name “Quick processing” (which you can modify). This enables you to save all the processing operations performed through the AIM application. 7.1.3 – Images To upload the list of images, use the button. An options window will allow you to upload all the images contained in a directory. You can also upload images by selecting them directly. To modify the button option users must move from /Directory to File, then use the button. In order to remove one or more images from the list, you must select it/them and then click on the button. Authors : B. Moutault & C. Chevalier Date : 20/08/2012 Page 38 Version 1 The of images button enables you to select the complete list (select/unselect). A pop-up menu is available for this list of images. Rightclick to call up the pop-up menu. Open : enables you to open the first image selected Move up/Move down: enables you to change the order of the images in the list Save as: enables you to choose a directory in which to save the selected images. Upload [Dir]: see above Add [File]: see above Remove: see above 7.1.4 – Macros The list of macros is loaded automatically; you can filter it with the aid of input fields: Name, Description, Contact and Establishment. Reminder: Use the “%” symbol to search the names which start with or contain the text entered. Example: to only see macros that contain the word “process” in their name, type “ %process%” and refresh the list (exit the field). When you select a macro, the text appears in the “visualization” field. It is possible to make temporary modifications. These changes are saved until the list is refreshed, even if you change the macro. Authors : B. Moutault & C. Chevalier Date : 20/08/2012 Page 39 Version 1 7.1.5 – Analysis When you have selected the images and the macro, you need to launch the analysis by clicking on the button. A stand-by window appears while the images are being processed by third party software. If processing is not completed, you must inform AIM that it is to be cancelled, using the button. The AIM application detects when processing is completed and automatically brings up the images and results files (provided in the “Macro management” window). The new images will be uploaded to the list and the processing history updated. You can view the results files, using the button. The “Integration” window opens and you will be connected back to AIM in its normal functioning mode AIM (§ 9.3). Authors : B. Moutault & C. Chevalier Date : 20/08/2012 Page 40 Version 1 8 – “Macro” Menu 8.1 – Management of “Macros” In the AIM application, images are processed with the aid of external software (third party): for example, Image-J (selected by GEVES for its community and freeware character). AIM runs Image-J with the help of macros that can be managed from this window. Reminder: A macro is a scripting language which enables you to automatize a sequence of actions. Macros are saved under the file format TXT (text). The Image-J software has a save function to record actions performed (“record”), which renders the process of writing macros more simple. Authors : B. Moutault & C. Chevalier Date : 20/08/2012 Page 41 Version 1 8.1.1 – Consulting a macro When selecting a macro (in the main table), you can consult the list of macros containing that macro (in the details table). The macro text (in RTF) will be shown in the right hand part of the window (but cannot be modified here). Using the button, you can open the macro in a text file (the default program in this case is “Bloc-Notes”), without RTF formatting. 8.1.2 – Create / Modify a macro To open the window to create a new macro, use the shortcut key [F10] or click on the button. Likewise, to modify a macro, select a row and use the shortcut key [F11], or click on the button, or double-click on the row. Authors : B. Moutault & C. Chevalier Date : 20/08/2012 Page 42 Version 1 In addition to the macro text, you can enter a variety of information relating to the macro (description): - Name Description Validity The person (responsible for the macro) Their e-mail address Their telephone number Their company name And a mini macro user guide (explaining its aim, general function, displaying the images expected on entry and those produced on exit, explanations of certain variables, …) Authors : B. Moutault & C. Chevalier Date : 20/08/2012 Page 43 Version 1 Comment: it is important to be precise concerning labels, as this will make searching easier and improve the readability and sorting of macros. In the first tab, labeled “MACRO”, the macro is divided in 3 parts: the HEADER It is necessary to obtain the fixed values and parameters for the various commands used from your macros. This information must be entered into the variables, in order to clarify their use for users unfamiliar with the set-up, and to facilitate the temporary modification of macros while they are running. the BODY Enter the macro process into this part, taking care to use the variables in the HEADER and the AUTOMATIC HEADER. This part enables you to format the text into RTF, in order to increase the readability of the macro (e.g.: add colors to the comments). the OUTPUT To finish, you need to enter data into the “OUTPUT” part, which defines the elements that need to be recorded to end the processing operation (images, files, output files). There are three elements available: Result file: enables you to save all files (measurements and others) generated by the macro and the image-processing software in the following table: AIM16_FIC_RESULT_TRAITEMENT. The files will appear in the “Integrate” window and will be available for integration into the database. Image: enables you to save all images (segmented, superimposed/layered, etc…) in the table AIM13_IMAGE. The images will be available for new processing operations in the “Analysis” window. File: enables you to save all files (traceability, additional information) in the table AIM25_FIC_DIVERS_DESC). The files will be available for new processing operations in the “Analysis” window. You can change the order of the “outputs” Authors : B. Moutault & C. Chevalier Date : 20/08/2012 and delete them . Page 44 Version 1 Example: for a macro that generates a number of results files in Excel format and binary (black and white) images, with names ending in “ _NB ”, the output section should be set up as follows : Then click on the button to close the window. button to save the macro and click on the 8.1.3 – Deletion To delete a macro, select it and click on the and confirm the deletion. button, or use the shortcut key [F12], 8.1.4 – Import / Export You can import or export macros into and out of the AIM application, for example, to facilitate the exchange of macros between users in different organizations and companies. Each macro has a corresponding file (a Word file (*.doc)). Exporting macros Select the macros, click on the button and indicate the destination directory. Importing macros Click on the button and select one or more “Macro” files (Word files). Caution: if other Word documents are open, they will be closed automatically. Example: to work out the expected AIM format for importing macros, use the example file, by pressing the Authors : B. Moutault & C. Chevalier Date : 20/08/2012 button. Page 45 Version 1 Below are 2 example files: one empty and the other one already filled out. Authors : B. Moutault & C. Chevalier Date : 20/08/2012 Page 46 Version 1 9 “Study” Menu 9.1 – Study declaration Before processing images, you need to define the operating environment. This window enables you to create and manage the declarative aspect of studies , which includes information such as the name of the study, experimental conditions, study materials (varieties), the number of replications, usable macros, acquisitions, zone layout (varieties) on the images of the acquisitions, etc. Authors : B. Moutault & C. Chevalier Date : 20/08/2012 Page 47 Version 1 9.1.1 – Consultation Using the “Search criteria” bar, the list of studies can be filtered by study type, name of study and by species (code and label). When selecting a study (in the main table) it is possible to consult: - the list of materials (in the details table, in the “Materials” tab). - the list of acquisitions (in the details table, in the “Acquisition” tab). - the list of macros (in the details table, in the “Macro” tab). 9.1.2 – Create/ Modify To open the window to create a new study, use the shortcut key [F10] or click on the button. Similarly, to modify a study, select a row and use the shortcut key [F11], or click on the button. Authors : B. Moutault & C. Chevalier Date : 20/08/2012 Page 48 Version 1 Indicate the study type, its name, species, establishment and person requesting the study, the receipt and return dates and the number of replications for the objects/materials/varieties to be used in the study. It is necessary to define the layout (number of zones), as well as the number of cells per row and per column (if you know the indexing of your image series) and the list of theoretical conditions. A description field enables you to save comments and enter additional information. The use of bold and underlined text is a reminder of the important fields that must be indicated. 9.1.3 – Deletion To delete a study, select it and click on the then confirm the deletion. button, or use the shortcut key [F12], Caution: Studies selected for deletion should not have any images or processing operations attached to the acquisitions. Authors : B. Moutault & C. Chevalier Date : 20/08/2012 Page 49 Version 1 9.1.4 – Materials This list enables you to declare the material to be studied. The word “material” covers varieties, batches of seeds, or any other object to be studied (species, individuals, galaxies). Click on the button to create new rows. You have default access to the label, which is accompanied by a number incremented (which is the highest object number), as well as the type of material used. Double click on the row or on the the material. Click on the button to modify button to delete the material. You can manage the order of the materials you declare in the study using the buttons to move material up or down. The button reshuffles the order according to the filter in place. The order is important when automatically creating acquisitions, loading images automatically, etc. Authors : B. Moutault & C. Chevalier Date : 20/08/2012 Page 50 Version 1 You can import data from an Excel file (using the respecting the column order on the first page: To see an example file, click on the button), while button. The button will automatically generate acquisitions in accordance with the material selected (the order) and the number of replications declared in the study record. Example: There are three varieties and two replications. Six acquisitions are to be created. The following options are available for the creation order: Either by replication Variety_1 – replication_1 Variety_2 - replication _1 Variety_3 - replication _1 Variety_1 - replication _2 Variety_2 - replication_2 Variety_3 - replication _2 Or by material Variety_1 – replication _1 Variety_1 - replication _2 Variety_2 - replication _1 Variety_2 - replication _2 Variety_3 - replication _1 Variety_3 - replication _2 9.1.5 – Acquisition “Acquisitions” are the “directories” of the study. This concept is important, as each acquisition will contain images, measurement files, processing history and study results. Various data need to be entered for each acquisition, such as the layout and description of materials (their arrangement in the image series), the conditions in which the images were acquired, the image source, the date they were acquired and a target directory for automatic image retrieval (optional - § 9.2.2.b). Authors : B. Moutault & C. Chevalier Date : 20/08/2012 Page 51 Version 1 To add, modify or delete, use the use the buttons. To modify more than one acquisition, button. You can also manage the order of acquisitions with the buttons. Enter the name, date and medium used to acquire the images, as well as the directory in which they are saved because, when first launched, AIM will load the images automatically. The list of conditions is (by default) the same as that of the study, but you can modify it by entering values and comments directly into the table. Add and remove rows using the buttons. The checkbox (last column) enables you to enter the conditions in the "calculations" window and is designed to describe as accurately as possible the image or images relating to this acquisition. The list of materials works the same way. The aim is to describe as accurately as possible the image or images (and their zones) relating to the acquisition, so that your results can be directly linked to the materials (objects, varieties, ...). This list makes such a match possible. For each row, fill in the zone and replication, as well as the set up period, if you have time differences between seed lots (for example). Authors : B. Moutault & C. Chevalier Date : 20/08/2012 Page 52 Version 1 9.1.6 – Macro The list of macros is used to define those macros that will (or that can) be used in the study. Add or remove macros using the buttons. You can also modify their position (order) using the update the order (according to the filter applied) using the The buttons to move up or down and button. button enables you to view the user guide for the selected macro. Authors : B. Moutault & C. Chevalier Date : 20/08/2012 Page 53 Version 1 9.2 – Analysis This window enables you to manage images, files and perform analyses of the study. You will find the main tables here: "Study" and "Acquisitions" (at the top), and then in the details tables (in four tabs), tabs for "macros", "images", the "files" and the management of "analyses"(this tab only appears during analysis). 9.2.1 – How to use this feature Select the study to display the list of acquisitions and macros. Select one or more acquisitions to display images and files. Finally, select the macros, images (and files) to launch the analysis. Authors : B. Moutault & C. Chevalier Date : 20/08/2012 Page 54 Version 1 9.2.2 – Macros You need to tick the macros you want to run during the next image-processing operation. The list of macros is displayed when a study is selected. Whenever you select a study, the macros list is updated (macros are in their initial form). When you select a macro, its rich text content (RTF) is displayed on the right side. You can modify it (temporarily) to suit the needs of upcoming processing operations. For example, if the macro has a header section, it is easy to adapt some of the values without permanently changing the macro in the database (of the application’s macros). Any changes are stored temporarily, even if you modify the macro. Until you refresh the display list : by selecting a study, or by switching windows, for example. The purpose of the "macros" tab is to inform AIM of the processing operations you have selected and their running order. Inactive Active First Second Authors : B. Moutault & C. Chevalier Date : 20/08/2012 Page 55 Version 1 9.2.3 – Images You must select the images to be processed during the next processing operation. The list of images is displayed (updated) when you select one or more acquisitions. The images are saved by acquisition, meaning that the link to the declarative section in the previous window can be maintained. Caution: when uploading images take care to select the correct acquisitions. 9.2.3.a – How to use this feature The “images” tab contains the list of images, a search bar and various action buttons and displays the images in the right hand section. Add images, using Windows selection feature. Delete selected rows. Modify image type. Change the order of the images in the list. Update the order in line with the current filter in place (name…) Open the image with your default software (e.g.: Picasa). Save the selected images to disk. Delete search criteria. Display (redisplay) the image list. Select (unselect) all images. Authors : B. Moutault & C. Chevalier Date : 20/08/2012 Page 56 Version 1 You can filter the list of images displayed by using “Search criteria” “select type of image”. This filter is very effective when using different types of images: - color - black & white – superimposed- … 9.2.3.b – Loading images You have four options for loading images into acquisitions (directories). Select the acquisition, then in the “Images” tab click on the “Add” button, search for the images on your computer and confirm your selection. Select the acquisition, place cursor on the “Images” tab, from your desktop (Windows) select the images and drag and drop them onto the AIM list. Select one or more acquisitions and click on the button. This method works if you have defined the loading directories in the “Declaration” window (§ 9.1.5.). AIM will load all the images it finds, by acquisition, even if the image had been previously uploaded. Click on and indicate the directory containing all your images. A list will appear with the titles of the images, the order of which can be changed if necessary . You can select another directory and remove specific images . Comment : The fourth option is available when loading all your acquisitions. The order of your acquisitions in this list is important (sorted by date, name, etc….., or defined in the previous window (§ 9.1.5.)). Images will be loaded by matching the left and right-hand lists (acquisitions and images). Authors : B. Moutault & C. Chevalier Date : 20/08/2012 Page 57 Version 1 In the example below, each acquisition will contain two images. You modify the “Match” field as follows: . To load, use the button. If you want to delete/hide this part of the “Load a directory” window, click on . Comment : by default, the images added to acquisitions are “undefined” types. We recommended that you specify the image type for better image management. 9.2.4 – Files You must select the files to be processed during the next processing operation. This tab allows you to manage files and images (see §9.2.2) and is equipped with an additional function: enables you to create a file automatically: AIM_Parametres.Ini, which retraces information about the study and the acquisition. Authors : B. Moutault & C. Chevalier Date : 20/08/2012 Page 58 Version 1 9.2.5 – Analyses You must click on to start the next processing operation. (having previously selected the macros, images and files) This tab enables you to monitor processing operations, to relaunch or halt a processing operation in case of macro, user, image-processing software or AIM errors. Relaunch the same processing operation. Force the end of processing operation and retrieve the output files. Force the end of processing operation and cancel the retrieval of the files. AIM will indicate when a processing operation is ongoing by means of a flashing message. Caution: the names of the images sent for processing by macro are slightly modified by AIM. AIM concatenates the image code, enabling the software package to know under which acquisition they need to be registered upon their return. Authors : B. Moutault & C. Chevalier Date : 20/08/2012 Page 59 Version 1 9.3 – Integration This window enables you to consult and delete processing operations relating to the acquisitions (with or without the results files). It is possible to integrate these measurements into the database by choosing the result variables that are to be saved. There are two main tables: studies and acquisitions. The details table contains the list of processing operations (history), results files and results. 9.3.1 – Processing history and results files Each time an analysis is launched, AIM records the date of execution. Linked to each date you have either: one or more result files “no files” if the macro does not generate any “processing canceled” if the analysis was halted manually. Authors : B. Moutault & C. Chevalier Date : 20/08/2012 Page 60 Version 1 You can delete this history using the button. Be careful, as each deletion involves the cascade deletion of the attached results files, as well as the measurements in the database, calculations and clustered items. You can delete results files using the button (this does not involve cascade deletion of basic measurements, calculations and clustered items). You can view the macro used for the processing operation: . You can view the results file, in the format in which it was saved You can import your results file manually corrections. . should there be any modifications or You can manage types of results files ( § 5.1.3.) as well as the number of days for which they are saved , . When you select one or more processing histories, AIM informs you of the number of result variables and measurements already integrated into the database. 9.3.2 – Display You must select a processing row that contains one or more result files. Select file/files, place the cursor on the tab “File” and click on the button. The format of the result file, which comes from the image-processing software (ImageJ) should be a “Text” file (the extension is not important, e.g. txt, xls) with the first row showing the column headings and separated by a tab. See the example below. Once integration into AIM is complete, you will see: Authors : B. Moutault & C. Chevalier Date : 20/08/2012 Page 61 Version 1 9.3.3 – Options One stage prior to integration (into the database) is the indexing of measurements. This is done automatically with each display of results files ("File" tab) and takes into account the selected options ("Options" tab). Indexing enables AIM to handle each of the different measurements in the results files on an individual basis, enabling them to be registered in the database. When images contain more than one object, it is necessary to be able to distinguish between them. AIM attributes the following values: Row/Column/Zone to each measurement. By default, all images are subjected to “incremental” indexing as a part of which objects are numbered for 1 to N. Example with four objects: Row 1 1 1 1 Column 1 2 3 4 “Simple” indexing is carried out for each image based on the X and Y coordinates of the objects and the elements declared for the acquisition. Row 1 1 2 2 Column 1 2 1 2 “Track” indexing is carried out on the first image on the basis of the X and Y coordinates and the elements declared (as above). For subsequent images, the calculation of the minimum distance is used. Authors : B. Moutault & C. Chevalier Date : 20/08/2012 Page 62 Version 1 The aim here is to maintain the same identifiers, namely Row/Column/Zone for the objects, and to track them throughout the whole series of images, even if they have been displaced. Row 1 Img_2 Column 1 Img_3 Img_4 Img_5 “Manual” indexing is performed by copying the Row/Column/Zone values from the results file columns. A window will pop up to ask what these columns are. Select a column, click on to define it as a row, column or zone. You can also double-click. The “De-activated” indexing option enables you to take no action and simply to display the result file. However, you will not be able to integrate the measurements into the database. For “ Simple” and “Track” indexing options, AIM uses the names of columns X and Y for the calculations. If the names of the columns are different in your results file, you can indicate this manually. You can also relaunch indexing manually, using the button. Reminder: the names of the images sent for processing by macro are modified by AIM. AIM concatenates the image code, making it possible –once measurements are returnedto know under which image and acquisition the measurements should be saved. Caution: When saving measurements, the image code is important because it provides a link with the description of the material made in the study declaration. If AIM cannot make that connection, it will require you to enter a valid image code manually. To do this AIM opens a text file (Lecture.txt) containing the list of valid images and their codes. Authors : B. Moutault & C. Chevalier Date : 20/08/2012 Page 63 Version 1 9.3.4 – Integrate In the “File” tab you can integrate the results columns of your choice. To do this, click on the you to select result variables for integration. button and a window will open to allow The result variables have been defined to match the column headings in ImageJ (often in English). Select one or more rows and confirm by clicking on . A message window will warn you that the result variables have been saved and will inform you of the number of rows that have been integrated. Authors : B. Moutault & C. Chevalier Date : 20/08/2012 Page 64 Version 1 9.4 – Calculations This window enables you to launch pre-defined calculations for variables previously recorded in the form of a spreadsheet within which a formula may be applied. This method can be used to carry out pixels millimeters conversions, for example. Comment: Most of the work is done at the level of the declaration of formulas. 5.4.). (see § 9.4.1 – How to use this feature Display the results of a study, acquisition or processing operation using the button. Then click on the result variables. Authors : B. Moutault & C. Chevalier Date : 20/08/2012 button to open the window to select the Page 65 Version 1 Select one or more rows and confirm your selection using the button. Comment: formulas are based on other result variables, information defined in the study declarative section, or columns in the table; If one formula is missing or contains an error, the calculation stage will generate an error message. Otherwise, the data will be calculated and recorded, and the new “results” displayed. Authors : B. Moutault & C. Chevalier Date : 20/08/2012 Page 66 Version 1 You can relaunch the operation with new formulas, which can be based on the new “results”. Color indicators are provided to help you. Highlighted in red: the result variables that have already been calculated Highlighted in green: the result variables that probably need to be calculated. By default the list of result variables is limited to those which are of interest to you. However, you can display the whole list using the tick box Results can be exported to Excel using the . button. You can color the rows of the table using the Automatically hide part of the calculation table columns Authors : B. Moutault & C. Chevalier Date : 20/08/2012 button. . Page 67 Version 1 9.5 – Results This window displays the results of a study (raw, calculated and clustered results). It also makes it possible to cluster and delete data from the database. 9.5.1 – Display Select your study; the full details are displayed in the second part of the window. There are six tabs describing the materials, acquisitions, images, processing operations, result variables and statistical parameters which are part of the study. Everything is pre-selected by default when you open the window, or switch to another study. You have the choice of de-selecting or selecting one row or another from one tab or another in order to refine what is displayed or deleted. Caution: When you use the Next and Previous buttons to switch windows, AIM pre-selects the same study and the same acquisitions Authors : B. Moutault & C. Chevalier Date : 20/08/2012 . Page 68 Version 1 Other available filters include: - Results type (see § 9.5.2) - The tick box “In column” governs the layout of the result variables. Select the elements you wish to display, then click on the button. 9.5.2 – Type of result Cell – Image [Aim14]: raw and calculated results defining the cells, zones, images and acquisitions in your study. The following types are all results obtained from clustering operations (A19, A21, A20 and A22). Cell– Acquisition [Aim19]: defining cells, zones and acquisitions. In this case, the image feature has been removed (image series). Zone – Image [Aim21]: defining zones, images and acquisitions. In this case, the cell feature has been removed. Zone – Acquisition [Aim20]: defining zones and acquisitions. In this case the cell and image features have been removed. Object [Aim22]: defining objects. In this case everything has been removed and only objects are clustered. 9.5.3 –Clustering Select your study and click on the Authors : B. Moutault & C. Chevalier Date : 20/08/2012 button. Page 69 Version 1 A window will open and you will be able to select the material(s), acquisitions, images and processing operations covered by the clustering function, as well as the type/types of statistical parameters and clusters desired. Then confirm using the button. Example_1: For an overview of this clustering step, we will look at the example of a study involving four varieties. I have measured a "Volume" for a series of images using image-processing software ("Analysis" window). I integrated these results into the database, giving a total of over 7,000 measurements, as I have several cells (seeds) per image and have around 50 or so images. I have calculated a “Time” based on the frequency of images in my series. I wish to cluster my results by variety and by time. I select my study (in the “Result” window) and click on the button. This action opens the statistical parameters window. I only select the "Volume" and "Time" result variables in the "Var_Result" tab. Authors : B. Moutault & C. Chevalier Date : 20/08/2012 Page 70 Version 1 Then, in the "Param_Stat" tab I choose to calculate an "average". I then select the type of clustering required: by zones and images. That means I want to remove the cell feature (in order to have only a single volume measurement per variety and time). I confirm by clicking on the button. I call up a display by selecting "Image-Zone" I then locate the clustered averages for volume and time, with a measurement per variety and per image. Example_2: We wish to measure the surface of leaves. We have two varieties (v1 and v2) and our study contains two replications (r1, r2). We have three plants per variety/replication (p1, p2, p3), and we use two leaves per plant (f1, f2). In our images we arrange the leaves in two zones, so that each image contains two varieties. Transposing these elements into AIM; the varieties are the zones, the replications are the acquisitions, the plants are the images and the leaves are the cells. Authors : B. Moutault & C. Chevalier Date : 20/08/2012 Page 71 Version 1 AIM14 Raw, unclustered data AIM19 Data clustered by Leaf AIM21 Data clustered by Plant AIM20 Data clustered by Replication AIM22 Data clustered by Variety Authors : B. Moutault & C. Chevalier Date : 20/08/2012 Page 72 Version 1 9.5.4 – Deletion The deletion step is similar to the display step, as you need to select the study, the detail (image, material, etc.) and the results type before clicking on confirming your selection. and Caution: the process does not involve cascade deletion. If you delete the [Aim14] results, this action will not delete clustered data in [Aim22]. You have to perform the operation for each result type. Comment: However, relaunching the clustering function automatically enables you to delete previous clusters in the destination table. 9.5.5 – Graph This is a feature that enables you to view AIM application data. To do that, you need to display and select (all or part of) the results (see § 9.5.1) (particular attention should be paid to the selection order) and then click on the button. A selection window opens, with a list of usable column labels on the left side of the window ("Column” table). You must select the series (one or more columns) (“Series” table), the x- value (column) ("Xaxis" table) and the y-axis value (one column) ("Y-axis" table). Use the and buttons to move the “column” labels. Authors : B. Moutault & C. Chevalier Date : 20/08/2012 Page 73 Version 1 Confirm your choice using the Authors : B. Moutault & C. Chevalier Date : 20/08/2012 button. Page 74 Version 1 By default, the application: - recalculates the axes boundaries as accurately as possible; - concatenates the labels of the various series (columnA – columnB – columnC); - indicates the name of the study in the title; - places the key to the right of the graph; - retrieves the labels of the x- and y-axes as they are. You can change certain features of this graph using the following options: On the right-hand side of the window, the button is used to open and close the options panel. Right click on the graph to open the contextual menu. This enables you to change the axis labels and boundaries, move the key, save the graph or print it. Authors : B. Moutault & C. Chevalier Date : 20/08/2012 Page 75 Version 1 10 – “Windows” Menu 10.1 – How to use this feature This feature enables you to manage Aim windows with a single click. 1. Tile Shows all open windows arranged symmetrically. 2. Cascade Cascades all open windows. 3. Iconize All Reduces all windows to icons. 4. Restore All Enlarges all windows. 5. Align icons Aligns the icons of reduced windows. 6. Close all Closes all your windows. After the separate line, AIM listed open windows. To switch from one to another with a simple click. Authors : B. Moutault & C. Chevalier Date : 20/08/2012 Page 76 Version 1 11 – “Help” Menu 11.1 – How to use this feature The “Help” menu enables you to find information on the AIM application. You have access to the “ User manual ”, “ Help with automatic functions ”, “ Did you know ? ”, “ Data Dictionary ”, “ Data model ”, “ Request ”, “ Software issues, Suggestions,… ” and “About … ” to obtain a response to your questions and problems. “User manual” The AIM user guide, in .Pdf format. “Help with automatic functions” …… “Did you know?” “Data dictionary” description of AIM tables, in .Htm. format or for Other… applications. “Data model” the graphic representation of AIM tables, in .Pdf format, or for Other… applications. “Query” SQL text based on the tables in the application. “Dysfunction, Suggestion,…” automatically opens the SOS application and a new record. “About …” range of information on AIM, including the version number and the email address for IT support. Authors : B. Moutault & C. Chevalier Date : 20/08/2012 Page 77 Version 1 Authors : B. Moutault & C. Chevalier Date : 20/08/2012 Page 78 Version 1 12 – Frequently-asked questions Question My list of macros is empty (incomplete) in the Analysis window, even though the macros have been declared properly at the study level (study declaration window). Answer Only ‘active’ macros are visible in the Analysis window. Return to the MacroManagement window and validate the macros that you want to see and use in your study. (§ 6.1.2.) ============ END OF DOCUMENT ======== Auteurs : B. Moutault & C. Chevalier Date : 01/10/2009 Page 79 Version 1