1
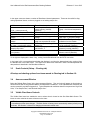
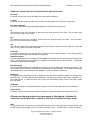
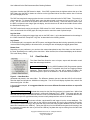
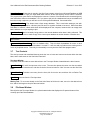
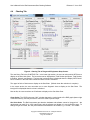
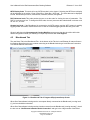
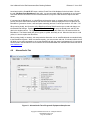
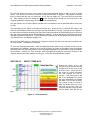
User’s Manual for the iBall Instruments Gas Charting Software
Release 15 June 2015
User’s Manual
for
The iBall Instruments Gas Charting Program
Software release version 75
Note: A complete List of Acronyms used in this Manual can be found in Appendix A
iBall Instruments Real Time Gas Detection Equipment
3540 National Drive
Norman OK 73069 USA
405 360 3300
24-HOUR TECHNICAL SUPPORT (405) 570 4449
Copyright 2015 iBall Instruments LLC All Rights Reserved
www.iballinstruments.com
Page 1 of 28 REL15
User’s Manual for the iBall Instruments Gas Charting Software
Release 15 June 2015
Table of Contents
SECTION 1.0 INTRODUCTION ..................................................................................................................... 3
1.1 Overview ............................................................................................................................................... 3
1.2 Database Structure .............................................................................................................................. 4
SECTION 2.0 GAS CHART MAIN SCREEN ................................................................................................. 5
2.1 Status Line ............................................................................................................................................ 5
2.3 Gas Units Chart (by Time) ................................................................................................................... 5
2.3 ROP Chart (by Depth) .......................................................................................................................... 6
2.4 Movement Up and Down the Charts .................................................................................................. 7
SECTION 3.0 GAS CHART CONTROL BOX ................................................................................................ 8
3.1 Main Control Buttons........................................................................................................................... 8
3.2 Real Time Data Screen ...................................................................................................................... 10
3.3 Scale Controls (Setup – Charting tab) ............................................................................................. 11
3.4 Announcement Window .................................................................................................................... 11
3.5 Visible Chart Items Controls ............................................................................................................. 11
3.6 Chart Data Box ................................................................................................................................... 13
3.7 Text Controls ...................................................................................................................................... 14
3.8 File Name Window ............................................................................................................................. 14
3.9 Hyperlinks ........................................................................................................................................... 15
SECTION 4.0 PROGRAM AND EQUIPMENT SETUP SCREEN ................................................................ 16
4.1 LAS/XLS Files Tab ............................................................................................................................. 16
4.2 Auto ROP/Lag Tab ............................................................................................................................. 17
4.3 Statistics/Tally Tab............................................................................................................................. 19
4.4 Charting Tab ....................................................................................................................................... 20
4.5 Bloodhound Tab................................................................................................................................. 21
4.6 Alarms/Audio Tab .............................................................................................................................. 22
SECTION 5.0 SELECT ITEMS BOX ............................................................................................................ 23
5.1 Chromatograph Data Window .......................................................................................................... 24
5.2 Geolograph Edit Box ......................................................................................................................... 25
Figures
Figure 1 - iBall Instrument’s Bloodhound and Gas Chart Communication Network ........................................... 3
Figure 2 - Gas Chart Main Screen ...................................................................................................................... 5
Figure 3 - Gas Chart Control Box ....................................................................................................................... 8
Figure 4 - Real Time Data Screen .................................................................................................................... 10
Figure 5 – Chart Data Box ................................................................................................................................ 13
Figure 6 - LAS/XLS Files Tab of the Program & Equipment Setup Screen...................................................... 16
Figure 7 - Auto ROP/LAG Tab of Program & Equipment Setup Screen .......................................................... 17
Figure 8 – Statistics/Tally Tab ........................................................................................................................... 19
Figure 9 - Charting Tab of Program & Equipment Setup Screen ..................................................................... 20
Figure 10 - Bloodhound Tab of Program & Equipment Setup Screen .............................................................. 21
Figure 11 - Alarms/Audio Tab of Program & Equipment Setup Screen ........................................................... 22
Figure 12 - Select Items Box ............................................................................................................................. 23
Figure 13 - Chromatograph Data Window ........................................................................................................ 24
Figure 14 - Geolograph Edit Box ...................................................................................................................... 25
Figure 15 - Geolograph Edit Box – Add/Delete Depth ...................................................................................... 26
APPENDICES
A.
B.
Glossary of Terms, Acronyms and Abbreviations ........................................................................... 22
Possible Alarm Messages from Bloodhound .................................................................................. 23
Copyright 2015 iBall Instruments LLC All Rights Reserved
www.iballinstruments.com
Page 2 of 28 REL15
User’s Manual for the iBall Instruments Gas Charting Software
SECTION 1.0
Release 15 June 2015
INTRODUCTION
The iBall Instruments Gas Charting software enables the user to chart gas levels and other drilling data in
real-time with high resolution and flexibility using the iBall Instruments Bloodhound system.
The Gas Charting software gathers information from the Bloodhound system, stores it in a Microsoft database, and displays gas levels, rate-of-penetration (ROP), and other data from the drilling operation. In addition, it can generate LAS and XLS text-based data files that can be utilized in logging software packages,
such as those from Wellsight Systems. This functionality enables the user to produce well logs for their client
or employer.
iBall Instruments distributes this software (and future upgrades) free of charge to all users of the Bloodhound .
Software can be downloaded from the iBall Instruments website at www.iballinstruments.com.
1.1
Overview
The Gas Chart software has full functionality when the computer it is running on is directly connected to a
Bloodhound (“RUNNING LOCALLY”) (see below, upper left), but slightly less functionality when the computer
is not directly connected to a Bloodhound , but is receiving data over the internet from the iBall Data Center
(“RUNNING REMOTELY) (see below, upper right).” In each section below, any limitations of the software
running remotely will be pointed out.
Figure 1 - iBall Instrument’s Bloodhound and Gas Chart Communication Network
Copyright 2015 iBall Instruments LLC All Rights Reserved
www.iballinstruments.com
Page 3 of 28 REL15
User’s Manual for the iBall Instruments Gas Charting Software
Release 15 June 2015
At first glance the software graphics appear to emulate a typical continuous chart recorder. However, the
software package is a powerful and accurate application capable of generating highly accurate charts, LAS
files and XLS files with details essential to the production of accurate mudlogs.
The waterfall chart design was selected as it is the most familiar to the greatest number of mudloggers and
geologists. The iBall Gas Chart software waterfall chart by default displays the newest data at the bottom of
the chart and as time goes on the data move upward. (If desired, the user may choose to have newest data
presented at the top of the page.)
The iBall Instruments Gas Chart software user interface consists of three Control Boxes and a few logical hot
keys that control every function. Once the user masters the few buttons on the three Control Boxes and
memorizes the “hot keys,” they are in complete control of the program.
A great deal of time has been spent working with today's mudloggers and geologists at various well sites to
make this program as intuitive as possible. iBall Instruments is always looking for suggestions to improve the
software and associated hardware devices. As suggestions are received from our users, improvements and
refinements are integrated into the application and updates are made available at no cost to our customers.
This manual provides step-by-step instructions on how to use the iBall Instruments Gas Chart software. A
simulated database is available to demonstrate the operation of the software.
1.2
Database Structure
The data that is collected by the Gas Chart software is stored in a Microsoft database structure using the Microsoft 4.0 JET engine database format. Unless otherwise selected, all databases are stored under the sub
folder C:\DB_CUE\. All databases generated by this application end with the “.MDB “ file extension, are created without encryption, and use no proprietary data formats. Therefore the user is able to examine, use and
modify the data with simple Microsoft tools such as Microsoft Access.
CAUTION: When viewing or editing the database using newer versions of Microsoft Access, it is
important to save it under the JET 4.0 database structure; otherwise the database will no longer be
compatible with the Gas Chart software.
Copyright 2015 iBall Instruments LLC All Rights Reserved
www.iballinstruments.com
Page 4 of 28 REL15
User’s Manual for the iBall Instruments Gas Charting Software
SECTION 2.0
Release 15 June 2015
GAS CHART MAIN SCREEN
When the Gas Chart program is started, it first makes several database checks to ensure that the database is
in the correct structure and has all the correct points. During this database check, a window will open up to
display the status of the database check and alert the user if there are any problems. After these database
checks are completed, the program will generate the Data Logger Main Screen and draw a uniform grid.
The Main Screen is a white box that will automatically resize to the top and bottom of the monitor screen size.
A minimum screen resolution of 1024 x 768 is suggested when using this program. A lower resolution is usable but not recommended.
The Main Screen is typically divided in half. The two charts (as shown in Figure 1) are separate and different.
The left hand chart primarily displays the rate of penetration (ROP) and is footage-based. The right hand
chart primarily displays the gas units and is time-based. You can think of the left hand chart as being by footage while the right hand chart is by time. The two charts will have equal horizontal scales for similar items
that are plotted on both of them, such as gas units on the right and lagged gas units on the left.
Figure 2 - Gas Chart Main Screen
Although new data comes into the software’s database every 6 seconds, the Main Screen is not automatically
updated that frequently. This reduces the problem of the charts shifting while the user is trying to do something, such as make a depth correction. To manually refresh the charts with the most recently received data,
the user may click on the Reset View button in the Chart Control Box (see below).
2.1
Status Line
On the very top of the Main Screen the user will always see a status line. This line displays the date, time
and depth data at the point of the mouse cursor on the Main Screen (NOT THE CURRENT DATE, TIME OR
DEPTH). Moving the mouse cursor up and down on the Main Screen will constantly display the time, date
and depth at the point of the mouse cursor. This helps in pinpointing an area of data to manipulate.
2.3
Gas Units Chart (by Time)
The right hand side of the Main Screen is the Gas Units Chart. This graph is charting gas units, and potentially other data, by time, minute by minute. The horizontal scales for the plotted data items are shown at the top
of the Gas Units Chart.
GAS CHART TIME AND DATE
In off-yellow, on the right hand side of the chart, every hour there is a time and date displayed. This is the
time and date that is transmitted by the Bloodhound instrument. (Be aware that, when running remotely, the
Bloodhound could be in a different time zone.) The time and date continues to be charted as long as there is
an input to the Gas Chart software, either locally from the Bloodhound, or from the Bloodhound remotely
through the Data Center.
Copyright 2015 iBall Instruments LLC All Rights Reserved
www.iballinstruments.com
Page 5 of 28 REL15
User’s Manual for the iBall Instruments Gas Charting Software
Release 15 June 2015
GAS UNITS LINE
The red graph line represents the gas units that have been detected over time. The red gas units scale at the
top of the chart can be changed as explained below. As the gas unit data flows into the Gas Chart program
from the Bloodhound gas detection equipment, the user does not have to be concerned about off scale readings. If the gas units go off scale, no data are lost. If the gas units are off the current scale, the user can adjust the scale to view the gas by making a simple entry in the Chart Control Box.
CHROMATOGRAPH LINE
The dark blue line displays the raw chromatograph output. If the iBall Instruments equipment is furnished with
the built in chromatograph, and if the user selects the chromatograph viewing function in the Chart Control
Box, the user will see the output of the chromatograph on the left hand side of the gas chart in miniature form.
(If your iBall Instruments equipment is not equipped with chromatograph hardware, then a flat blue line will
appear in that area.) Each time a gas sample is injected into the chromatograph, a small red tick line will intersect the blue line. If the user chooses to zoom into the Gas Units Chart, the separations will become more
noticeable. The user is also provided with the ability to select a portion of the chromatograph output and have
the computer display the chromatograph data in larger format. This feature is explained below.
HYDROGEN SULFIDE (H2S) LINE
The orange colored line represents the hydrogen sulfide detection in parts per million (PPM). When enabled
for viewing, there will be an orange colored line drawn to indicate the presence of H2S. The scale for the H2S
detector is from 0 to 500 PPM of H2S. If your iBall Instruments gas detection system does not have the H2S
detector installed, there will be a flat line shown on the display. This scale is not adjustable.
BLUE DEPTH TICK MARKS
If “Edited Geolograph” is selected in the Chart Control Box, blue tick marks will appear with the depth denoted
beside them at five foot intervals the left hand side of the gas chart. All Bloodhound Gas Detection systems
are equipped to detect foot/meter changes, either through connection to a geolograph depth switch, or from a
WITS (Wellsite Information Transfer Specification) interface. If the drilling rate is rapid, these foot or meter
ticks will run together and appear as a blue streak. The zoom function in the Chart Control Box provides the
user the ability view the ticks in detail. If the Bloodhound connected to a WITS interface, green tick marks will
be displayed to indicate tenths of a foot.
RED DEPTH TICK MARKS
If “Raw Geolograph” is selected in the Chart Control Box, red depth tick marks will appear. These are called
raw tick marks because these are the original (unedited) depth marks. Viewing these unedited marks allows
the user to note the differences between tick marks that have been edited and the originals.
2.3
ROP Chart (by Depth)
The left hand side of the Main Screen is the rate of penetration (ROP) Chart. The ROP Check Box must be
checked in the Chart Control Box for the ROP Chart to appear. The ROP is plotted by depth, foot by foot.
ROP Line
When the ROP Check Box is checked in the Chart Control Box, a black ROP line is plotted in minutes per
foot, with the depths shown to the left. The horizontal ROP scale can be adjusted in the Chart Control Box,
as described later.
AUTO ROP Line
When the Auto ROP Check Box is checked in the Chart Control Box, the plotted ROP line is dark red, and is
corrected for the slow feet caused by making connections.
Lag Gas Units Line
When the Lag Gas Check Box is checked in the Chart Control Box, the lagged gas units are plotted in red
foot by foot on the ROP chart. The lag is calculated based on the settings in the “Chart Control Box / Setup
Box / Lag Tab,” described in a following section. When lagged gas units are plotted on the ROP Chart, they
Copyright 2015 iBall Instruments LLC All Rights Reserved
www.iballinstruments.com
Page 6 of 28 REL15
User’s Manual for the iBall Instruments Gas Charting Software
Release 15 June 2015
have the same horizontal scale as gas units plotted on the Gas Units Chart. If the lagged gas units are off the
current scale, the user can adjust the gas units scale in the Chart Control Box.
Lag Gamma Line
When the Lag Gamma Check Box is checked in the Chart Control Box, and the Bloodhound is connected to
the WITS system and lagged gamma data is being entered into the WITS system by Measurement While
Drilling (MWD) or directional personnel, the lagged gamma data are plotted on the ROP Chart as a green line.
2.4
Movement Up and Down the Charts
Fine and gross movements are possible within the Gas Chart software Main Screen.
GROSS MOVEMENTS
On the very far left hand side of the Main Screen there is a jump bar. This is a vertical line with depth numbers next to it that goes from the top to the bottom of the chart. This represents all the data in the database.
To make a gross movement in the database, place the cursor near the vertical line at the desired depth so
that a double-ended arrow appears, and left-click. This will take the user to that approximate point in the database and display the data. After clicking, a red carrot (>) indicator on the jump line will show what part of
the database is currently displayed. This view will only remain until the next time the chart is refreshed, either
manually or automatically.
FINE MOVEMENTS
Fine movements in the database are accomplished by holding down a shift key and then holding down the left
mouse button and moving the mouse up and down. This operation will move “ghost” gas units up and down
that show where the Gas Units Graph will move to when the mouse button is released. The user is thus able
to make fine movements.
In addition, there are up and down arrow buttons in the Chart Control Box that permit the user to jump up or
down a page at a time.
Copyright 2015 iBall Instruments LLC All Rights Reserved
www.iballinstruments.com
Page 7 of 28 REL15
User’s Manual for the iBall Instruments Gas Charting Software
SECTION 3.0
Release 15 June 2015
GAS CHART CONTROL BOX
The Gas Chart Control Box is the
main control point of the program.
It allows the user to control what is
seen on the Gas Units Chart and
ROP Chart, select the input of data to the program, generate output
from the program, control view,
control scale, and insert and delete text within the chart.
To bring the Chart Control Box up
for use, the user must RIGHT
CLICK anywhere on the Gas
Chart Main Screen. To remove
the Chart Control Box the user
must LEFT CLICK on the Main
Screen or click on the small x in
the upper right hand corner of the
Chart Control Box.
Figure 3 - Gas Chart Control Box
3.1
Main Control Buttons
In the upper left hand corner of the Chart Control Box, there are two arrow buttons that enable the user to go
up or down a page on the Main Screen. These are the Page Up and Page Down Buttons.
Zoom In GU will allow the user to see more detail on the Gas Units Chart and will change the scale from 1”
per hour to 2” per hour. Pressing this button again will double the scale to 4” per hour and so forth.
Zoom Out GU will allow more gas chart data onto the screen at one time.
Reset View will instantly set the view to the newest data and set the Gas Units Chart to 1” per hour. This is
handy if you get lost in the database, or zoom in or out too much and want a speedy way to get back to a
known position.
Redraw Chart button does not bring the most recent data into view. It simply refreshes the chart that is currently being viewed. For example, if the user clicks or unclicks the “Raw Chromatograph” chart item, the Redraw Chart button then must be pressed in order to view the changes that the user has made.
Bloodhound Connected button. Normally this button is green. If it is not green, then the Gas Chart program is NOT collecting and storing data from the Bloodhound. The number in the window is the Main
Screen automatic refresh (update) cycle in seconds. The default is 120 seconds (2 minutes). To change the
refresh rate, place the mouse cursor in the window and enter the desired refresh rate, then hit the Redraw
Chart button. The Number on the green Refresh button counts down the seconds until the next refresh. The
Copyright 2015 iBall Instruments LLC All Rights Reserved
www.iballinstruments.com
Page 8 of 28 REL15
User’s Manual for the iBall Instruments Gas Charting Software
Release 15 June 2015
number in the Refresh Text Box above the Gas Units box is a client entered second count-down timer that
defaults to what is entered in the box whenever a new packet of Bloodhound information is received. If the
Refresh button above the text box is red then it will count down and retry to connect to the Bloodhound every
120 seconds (the default setting, or whatever is entered in the text box below the Refresh button). If the user
clicks on this button, the button will turn gray and the software will not attempt to connect to the Bloodhound
(and will disconnect if connected). If the button is gray, clicking on it again will turn it red or green and the
software will attempt to connect to the Bloodhound.
To disable the Main Screen automatic refresh cycle, click on the green Refresh Button. The button will
turn red with the wording “Refresh Off.” This function is useful for disabling screen updates while working on
an up-hole footage renumbering issue. To turn the automatic refresh cycle back on, click on the red Refresh
Off button.
NOTE: the user does not have to know which serial port the Bloodhound is connected to. The program will
search all serial ports and attempt a connection to the first Bloodhound it finds.
WITS Connected button. Gas Chart software will turn this button green if the Bloodhound has detected
WITS input. The number in the button is a 30-second count down timer that resets to 30 whenever a new
packet of WITS information is received. This button will turn red if no WITS input has been found.
Strokes button shows the number of total pump strokes per minute coming in from WITS. When WITS pump
stroke data is not being received, the button turns gray and reads “No Pump Data.” When logging without
WITS input (e.g. with a geolograph setup), clicking the button changes between “Pumps On” and Pumps Off.”
Print button will allow the user to print the current visible chart to a printer that is connected to the computer.
Before hitting Print, the scale of the print can be set using the “ROP Inches Per 100 ft” box.
Setup button will allow the user to set the Gas Chart software preferences and is explained in detail later in
this document.
Real Time Data button opens the Real Time Data Screen that allows the user to see the real-time data that is
being received from the Bloodhound gas detection system. This is an excellent method to verify that the
Bloodhound instrument is running and communicating.
Copyright 2015 iBall Instruments LLC All Rights Reserved
www.iballinstruments.com
Page 9 of 28 REL15
User’s Manual for the iBall Instruments Gas Charting Software
3.2
Release 15 June 2015
Real Time Data Screen
As shown in Figure 4, the heading of the Real Time Data Screen provides the Bloodhound Serial Number, the
Job Number, and the date and time of the most recent data packet received. Important parameters are
shown in large boxes at the upper left, including Gas Units, Hole Depth, Bit Depth, ROP in minutes per foot
and the current calculated Lag Depth.
Figure 4 - Real Time Data Screen
If the Gas Chart software is running locally, the Lag Depth shown is that calculated within the Gas Chart software, based on the settings in the “Chart Control Box / Setup Box / Lag Tab,” described in a following section.
If the Gas Chart software is running remotely, the Lag Depth shown is that being calculated by Gas Chart
software running on the wellsite, and transmitted through the Bloodhound to the WITS system.
Below these parameters are shown the levels of the gas components, methane (C1) through normal butane
(n-C4), detected during the most recent chromatograph cycle.
Copyright 2015 iBall Instruments LLC All Rights Reserved
www.iballinstruments.com
Page 10 of 28 REL15
User’s Manual for the iBall Instruments Gas Charting Software
Release 15 June 2015
In the upper center are shown a number of Bloodhound internal parameters. These can be useful for diagnosing operational issues, such as a plugged, cut or leaking sample line.
%CO2 – current percent CO2
% O2 – current percent O2
H2S PPM – parts per million H2S
ROP in ft/hr
Pri Volts – primary gas sensor
voltage
CG Volts – chromatograph sensor
voltage
AC Volts – incoming AC voltage
Motor % - percent duty of the
sample pump motor
Time of last data packet
Vac –sample line suction in millimeters mercury (mmHG),
(absolute)
LPH – sample flow in liters/hr
Packet Number (most recent)
Sec Volts – secondary gas sensor
voltage
CG ID – most recent chromatograph run sequential ID number
AC Frequency – incoming AC frequency, Hz
HRM Temp – temperature at the
gas detector, °F
Error Number
Error Description
Date of last data packet
Temp – circuit board temperature,
°F
Atten – attenuation setting
Volts DC – internal voltage
H2S Volts – H2S sensor voltage
RSSI – Received Signal Strength
Indication from the modem
Amps – amperage going out the
12 volt connector (cavitator)
CG Pressure – chromatograph
pressure in mmHg (absolute)
Exhaust Prs – backpressure at
exhaust, mmHG (absolute)
To the right are displayed the data, if any, coming into the Bloodhound from the WITS connection.
In the lower left is a communications window that displays in real time the data packets being received from
the Bloodhound or the Data Center. The sequence of data items contained in these comma-separated text
data packets is described in the Bloodhound Manual.
3.3
Scale Controls (Setup – Charting tab)
All setup and charting options have been moved to Charting tab in Section 4.0:
3.4
Announcement Window
Below the Refresh Rate Control is the Announcement Window. Text and color will appear in this window to
announce both Gas Chart-generated alarms and Bloodhound conditions. A list of Bloodhound conditions that
can be reported is provided in Appendix A. Typical Bloodhound conditions that will be reported are “High Gas
Units,” “Low Sample Flow,” and “Blocked Sample Line.”
3.5
Visible Chart Items Controls
The Visible Chart Items box enables the user to select what is viewed on the Gas Chart Main Screen. The
items are color coded to the same colors as on the chart.
NOTE: After turning on or off an item or items to view, the user must then click on the "Redraw Chart" button
to immediately see the chart changes. The Main Screen is factory-set to automatically redraw (refresh) every
3 minutes. See Section 3.4 above for changing the automatic refresh rate.
Copyright 2015 iBall Instruments LLC All Rights Reserved
www.iballinstruments.com
Page 11 of 28 REL15
User’s Manual for the iBall Instruments Gas Charting Software
Release 15 June 2015
ITEMS THAT CAN BE SELECTED TO APPEAR ON THE GAS UNITS CHART
Gas Units
If checked, the gas units line will be visible on the chart (when refreshed).
C Values
If checked, the gas component values (C1 through n-C4) will display to the left of the total gas units.
Raw Chromatograph
If checked, causes the raw chromatograph separations to be drawn on the gas chart.
O2
This allows for the O2 line to be drawn. It also turns on the scale at the top of the chart. The O2 scale is from
0 to 21% and is fixed in the software.
CO2
This allows for the CO2 line to be drawn. It also turns on the scale at the top of the chart. The CO2 scale is
from 0 to 10% and is fixed in the software.
H2S
The hydrogen sulfide line is visible when this check mark is shown. It also turns on the scale at the top of the
chart. The H2S scale is fixed at 0 to 500 PPM.
Peak Tags
If checked, blue total gas unit peak tags will be visible on the chart when refreshed. The peak tags attach
themselves to the total gas chart at peaks of the gas units.
Edited Geolograph
The edited geolograph tick mark display will show blue foot tick marks on the left hand side of the Gas Units
Chart. This allows for the user to clearly see variations on the drilling rate and also the depth. These depth
tick marks can be adjusted and edited.
Raw Geolograph
The raw geolograph display will show red foot tick marks on the left hand side of the Gas Units Chart. This
allows for the user to clearly see variations on the drilling rate and also the depth. These depth tick marks are
not editable and can not be changed in the database. They are available for reference.
WITS Data
If the Bloodhound is receiving WITS data, checking this box will cause the charting software to display selected WITS items. The items that can be displayed are: total strokes per minute, total strokes, inclination, azimuth, and gamma. To select the WITS item to chart, see the following section “Chart Control Box / Setup
Box / WITS tab.”
Off Bottom
If checked, an orange line is plotted along the left edge of the Gas Units Chart when the bit is off bottom.
Pumps On/Off
If checked, a light blue line is plotted along the left edge of the Gas Units Chart when the pumps are off.
All setup and charting options have been moved to Charting tab in Section 4.0:
ITEMS THAT CAN BE SELECTED TO APPEAR ON THE RATE OF PENETRATION (ROP) CHART
ROP
Turning on this check box will move the entire Gas Units Chart over to the right side of the Main Screen, and
an ROP Chart will be displayed on the left side of the Main Screen. The ROP Chart is scaled by depth, to
Copyright 2015 iBall Instruments LLC All Rights Reserved
www.iballinstruments.com
Page 12 of 28 REL15
User’s Manual for the iBall Instruments Gas Charting Software
Release 15 June 2015
help better visualize the ROP based on depth. If the ROP is greater than the highest value at the top of the
ROP Chart, then the ROP is shown as a red line on the right hand side of the chart, and the time in minutes
per foot is displayed in red.
The ROP horizontal scale range permits the user to set the horizontal scale for ROP Chart. The scale is in
minutes per foot. To change the ROP scale, enter the desired scale in minutes per foot, such as "0 to 10", "0
to 20". The "to" must to be in the syntax for this function to work correctly. If the user does not wish to view
the ROP or wishes to have a larger gas unit display, turn this check box off and the entire Main Screen will be
the Gas Units Chart by time.
The ROP vertical scale can be set using the “ROP Inches Per 100 ft” window in the Control Box. This changes the vertical scale of the ROP graph, and may be used to control the scale of printed output.
Lag Gas Units
Checking this box displays the lagged gas units on the ROP chart. Lag is calculated based on the settings in
the “Chart Control Box / Setup Box / Lag Tab,” as described in the following section.
Lag Gamma
If the Bloodhound is connected to the WITS system, and lagged Gamma data is being reported by the Measurement While Drilling (MWD) or directional crew, checking this box will display the lagged gamma data.
Rotate Chart
Depending on your preference, you can have the newest data plotted at top of the chart or at the bottom of
the chart, depending on the setting of the check box. When checked, the newest data displays at the bottom.
This is the factory setting.
3.6
Chart Data Box
The Chart Data Box allows the user to Import, export and otherwise control
data flow and storage locations.
Generate LAS/XLS file The Log ASCII Standard (LAS) file generator permits
the user to generate a file that is compatible with most mud logging software
packages. When hitting this button, the user will be asked to supply a file
name and a place to put it on the hard drive. At the same time an XLS file is
Figure 5 – Chart Data Box
generated and placed in the same folder. The difference between the two is that the LAS file will not duplicate feet depth and will place a –999.99 on missing feet. The XLS file will display duplicate feet, and will not
show missing feet. All data
is time and date stamped. It is suggested that the user use a different file name each time an export file
is generated.
Export DB To IBD Text File The data that comes into the Gas Chart program is in packet form. Within Gas
Chart, the packet is taken apart and stored in a Microsoft Database File or “.MDB”. This button will take the
data that has been stored in a MDB file and save it into a comma-delimited text file. Text-based data files are
a convenient export file type because they can more easily transposed into various file formats.
Import IBD Or Text File This button will take a text-based file and import it into the current database. The
Bloodhound system stores all the data on the USB key and internal SD card in this text-based file format.
This function is useful for filling in any holes that exist in the Gas Chart program database, but not in the text
based file contained on the USB key. Taking the USB key from the Bloodhound system and inserting it into
the computer will enable the user to pull from the USB key any data that may be missing from the Gas Chart
program database.
Copyright 2015 iBall Instruments LLC All Rights Reserved
www.iballinstruments.com
Page 13 of 28 REL15
User’s Manual for the iBall Instruments Gas Charting Software
Release 15 June 2015
Open Data Base All data that is viewed in the Gas Chart program comes from a Microsoft Database or MDB
file. To select a file to open, the Open Data Base button is hit and the directory and file name is selected.
The program then opens the file and displays the contents. However, if the Bloodhound is connected (green),
new data will be written to the database. So if you want to just look at a database and not put new data into it
from the running equipment, you will have to turn off the green Bloodhound Connected button.
Start New Data Base This button starts a fresh empty database. This is used when starting a new well.
The user will be prompted for a directory and file name to organize the data to be saved. When Start New
Data Base is selected, a blank white chart will be displayed on the computer, because this is an empty database, and there is not yet anything to plot.
Save Data Base Data is constantly being written to the named database when data is being collected. This
button allows for the user to make a copy of the current open database to another location or another drive.
NOTE: This does not affect the current database or its contents. This just copies the current database to another location.
Compact / Repair Data Base This is a database utility. This will check the database for errors or other
problems, and will then re-index the database if it needs it. It will also add any fields that are missing and remove any duplicate entries. This utility is automatically run every time the Gas Chart program starts.
3.7
Text Controls
The text input area and associated buttons permit the user to insert and remove text boxes within the database, and to make notes on the Gas Units Chart itself.
Text Input Window
First press Clear Box and then enter desired text in the Text Input Window located below the three buttons.
Insert Text Box will “stick” the input text to the cursor. The user then places the cursor over the area where
he or she wishes to insert the text, and then clicks the left mouse button to “stick” the text onto the Gas Units
Chart.
Delete Text Box To delete a text entry from the chart, left click on the text, and then click on Delete Text
Box.
Clear Box clears text from the Text Input Area.
Moving Text: To move text already on the Gas Units Chart, left click on the text, move it to the desired location, and left click again to drop it at the new location.
3.8
File Name Window
Directly below the Text Input Window is a yellow-tinted window that displays the file path and name of the
currently open Gas Chart database.
Copyright 2015 iBall Instruments LLC All Rights Reserved
www.iballinstruments.com
Page 14 of 28 REL15
User’s Manual for the iBall Instruments Gas Charting Software
3.9
Release 15 June 2015
Hyperlinks
At the bottom of the Gas Chart Control Box are three hyperlinks.
Clicking on the "Help" link will open up this Manual. You do not need to be connected to the Internet to see
this help.
The “Open Error Log" button opens a log of alarm messages that have been received from the Bloodhound ,
and error messages that have been generated by the Gas Chart software. Scroll to the bottom of the window
to view the most recent alarms and error messages.
If an internet connection is active, the “www.iballinst.com" button allows the user to go to the iBall Instruments
home page where information and downloads are available.
Copyright 2015 iBall Instruments LLC All Rights Reserved
www.iballinstruments.com
Page 15 of 28 REL15
User’s Manual for the iBall Instruments Gas Charting Software
SECTION 4.0
Release 15 June 2015
PROGRAM AND EQUIPMENT SETUP SCREEN
On the Gas Chart Control Box, the Setup Button opens the Program and Equipment Setup Screen. This
screen allows the user to set program options. The screen is composed of six (6) tabs.
4.1
LAS/XLS Files Tab
Figure 6 - LAS/XLS Files Tab of the Program & Equipment Setup Screen
This Tab is for the LAS/XLS file generation. The user can chose to generate an LAS file, an XLS file, or both.
LAS file options 1) include whether to generate a file containing all the data or just the last 48 hours of data; 2)
type of LAS file header to include; 3) whether the depth column is lagged depths. XLS file options 1) include
whether to generate a file containing all the data or just the last 48 hours of data; 2) whether to generate a
header; 3) whether the depth column is lagged depths. The user can choose to alter the output to show gas
Units in PPM and ROP in ft/hr.
The user can chose the following data separation types: Tab delimited, comma delimited, space delimited, or
custom character delimited. In addition, the user can choose to create files from the entire depth range or a
selected depth range.
Copyright 2015 iBall Instruments LLC All Rights Reserved
www.iballinstruments.com
Page 16 of 28 REL15
User’s Manual for the iBall Instruments Gas Charting Software
4.2
Release 15 June 2015
Auto ROP/Lag Tab
This Tab is for setting up the Auto ROP and Gas Units Lag, Gamma Tool and Surface/Line Lag. For the Gas
Units Lag, the user can select between generating the lag using pump strokes or from time and depth if WITS
is active, otherwise Time/Depth is the only option.
Figure 7 - Auto ROP/LAG Tab of Program & Equipment Setup Screen
Zone 1 is the default lag settings! Failure to set any lag settings, or if any lag settings are invalid, Zone 1
lag settings will be used by Default. Any of the Zones that are invalid or in error are highlighted in red. Different Zones can be used to model sections of casing, liner, and various hole sizes as the well is drilled.
Pump Strokes Method: To use the pump strokes method, the Bloodhound must be connected to the WITS
interface and WITS must be supplying pump strokes.
To use the pump strokes method, the user clicks the round button next to “Generate Lag Using Pump
Strokes,” and enters the strokes per 100 feet of hole. (To calculate the strokes per 100 feet of hole, divide the
bottom-up strokes by the hole depth, then multiply by 100. For instance, if the hole is 5,000 feet deep with
2,800 bottom-up strokes, (2,800 ÷ 5,000) x 100 = 56 strokes per 100 feet.)
The setting will be saved upon closing the screen. Information can often be obtained from the Mud Engineer
or Mud Report. For example, for a 7 7/8-inch diameter hole containing 4 ½-inch drill pipe, the annular volume
of 1,000 feet of hole is about 41 barrels (bbls). For a pump with a capacity of 0.0725 bbls per stroke, it would
take about 56 strokes to circulate 100 feet of hole. For a hole 5,000 feet deep, it would take about 2,800
strokes (5 x 560) to achieve bottoms-up.
The check box labeled “Always Calculate Total Strokes From Strokes Per Minute” should be used if the driller
is resetting WITS Total Strokes to zero every joint, as some do.
Copyright 2015 iBall Instruments LLC All Rights Reserved
www.iballinstruments.com
Page 17 of 28 REL15
User’s Manual for the iBall Instruments Gas Charting Software
Release 15 June 2015
Time/Depth Method: To use the time/depth method, the user clicks the round button next to “Generate Lag
Using Time /Depth,” and enters the known minutes of lag time at a known depth. For example, for a 7 7/8inch diameter hole containing 4 ½-inch drill pipe, the approximate annular volume at a depth of 5,000 feet is
about 203 bbls. For a pump with a capacity of 0.0725 bbls per stroke running at 60 strokes per minute, it
would take about 47 minutes to circulate bottoms-up. Minutes of lag can also be determined by a bottoms-up
test using carbide or other material, or by converting the number of strokes needed to minutes (2,800 strokes
÷ 60 strokes per minute = 47 minutes). The Bottoms Up Minutes window will give the current lag minutes for
the current depth.
With either method, the user will have to periodically adjust the settings to best match drilling breaks to gas
increases. This is due to the many real-world factors that affect lag, including changes in hole washout and
pump efficiencies, among others.
If the user wants to recalculate the lag time for any depth or range of depths, the right hand side of the tab will
allow the user to adjust the lag times for the whole database or just a section of it based on feet. If the user
wishes to recalculate the lag for the whole database, select the type of lag calculations, adjust the lag variables, and then hit the red button. The program will recalculate the lag based on the settings that the user provides. If the user wishes to recalculate the lag for a range of feet, then the user should enter the starting and
ending feet that will be recalculated, and then hit the yellow button to just recalculate the lag within the range
selected. If footage is missing from the database because of driller recalculation or other problems, the brown
button “Insert Missing Packet Place Holders Into The Data Base” should be pressed to try correcting the errors.
Copyright 2015 iBall Instruments LLC All Rights Reserved
www.iballinstruments.com
Page 18 of 28 REL15
User’s Manual for the iBall Instruments Gas Charting Software
4.3
Release 15 June 2015
Statistics/Tally Tab
Figure 8 – Statistics/Tally Tab
This tab allows the user to calculate the pipe tally, Total Off Bottom Time, Total On Bottom Time, Percentage
Off Bottom Time, Percentage Drilling Time, etc. from the data in the database by clicking Calculate Statistics
and Auto Tally Database buttons.
Copyright 2015 iBall Instruments LLC All Rights Reserved
www.iballinstruments.com
Page 19 of 28 REL15
User’s Manual for the iBall Instruments Gas Charting Software
4.4
Release 15 June 2015
Charting Tab
Figure 9 - Charting Tab of Program & Equipment Setup Screen
The next Setup Tab is the CHARTING Tab. In the lower right section, the user can select which WITS item to
display on the Gas Units Chart. The items that can be displayed are Total Strokes per Minute, Total Strokes,
Inclination, Azimuth, and Gamma. The item that is selected here is displayed when the Display WITS Checkbox is turned on in the Gas Chart Control Box and the chart is refreshed.
The upper left is the Chart Items to display on the Gas Chart. (Refresh chart after selection is complete).
In the center section, the user can select one or more diagnostic items to display on the Gas Chart. The
item(s) will be displayed when the chart is refreshed.
Next to this, the user can select an Oil Indicator to display on the Gas Units Chart.
Chart Scales: The “ROP Inches per 100 ft” window changes the vertical scale of the ROP graph (bottom right
of the Main Screen), and may be used to control the scale of printed output.
Gas Units Scale The iBall Instruments gas detection hardware and software cannot be "pegged out” - the
gas detector can read 0% to 100% natural gas, and the software can display it in very innovative ways. To
change the gas unit scale, the user just enters the scale desired to be viewed, e.g. "0 to 500", "0 to 10000”.
Copyright 2015 iBall Instruments LLC All Rights Reserved
www.iballinstruments.com
Page 20 of 28 REL15
User’s Manual for the iBall Instruments Gas Charting Software
Release 15 June 2015
WITS Display Scale This scale is for any WITS item that is to be viewed. Selecting the WITS item to display
will be described in the section “Chart Control Box / Setup Box / WITS tab.” The items that can be displayed
include total strokes per minute, total strokes, inclination, azimuth, and gamma.
ROP Horizontal scale This scale permits the user to set the scale for viewing the rate of penetration. The
ROP is in minutes per foot. To change the ROP scale, the user just enters the scale desired in minutes such
as "0 to 10", "0 to 20".
Gamma Lag Scale If the Bloodhound is connected to the WITS system, and the WITS system is sending
lagged gamma information, this allows the user to view the collected lagged gamma data at a given scale.
We won’t talk about the Chromatograph Charting Modifiers except to say that they should be left in their
default configuration unless you discuss your unique requirements with Tech Support.
4.5
Bloodhound Tab
The next Setup Tab is the Bloodhound Tab. At the bottom of the Tab, the Local Ethernet Or Internet Connection Settings area allows the user to select connecting to the Bloodhound using a Local Ethernet Connection
or a Remote Ethernet Connection.
Figure 10 - Bloodhound Tab of Program & Equipment Setup Screen
When Gas Chart software is being used on a computer directly connected to the Bloodhound (“running locally”), the box should be unchecked.
When Gas Chart software is being used at a location remote from the Bloodhound (“running remotely”), check
the box next to “Use Ethernet Instead of Serial Connection” and type in the 4 digit number of the BloodCopyright 2015 iBall Instruments LLC All Rights Reserved
www.iballinstruments.com
Page 21 of 28 REL15
User’s Manual for the iBall Instruments Gas Charting Software
Release 15 June 2015
hound and push the “Look UP IP” button, and the IP and Port will be displayed in the box below. Click on
the red “Get Data From Bloodhound” and voila! You are connected, although, depending on your internet
connection and the connection from the remote Bloodhound, may take a few minutes to acquire the data
stream.
If connected to the Bloodhound on a local Ethernet (through a router or computer that is running a DHCP
service) check the same button as above and enter the local IP address displayed on the LCD panel of the
Bloodhound (just wait a minute, it will scroll past eventually) and use 23 as the port number: 192.168.1.7:23
When running locally, the left section of the Bloodhound Setup Tab allows the user to read and change certain Bloodhound Settings. Pressing Get Data From Bloodhound will query the Bloodhound and fill in the
data in the windows above. The right section allows the user to see the health of the IR sensors within the
Bloodhound. The Sensor health will go from green, to yellow, and finally to red. When the bars turn to a mid
yellow, it is time to replace the IR sensors.
When running locally or remotely, this setup tab also allows the user to send Bloodhound commands directly
to the Bloodhound system. When connected remotely, you must connect and wait 15 minutes until the server
will allow you to send commands to the remote Bloodhound (with the proper login/password). All commands
can be found in the Bloodhound user’s manual that can be downloaded from the iBall Instruments web site at
www.iballinst.com.
4.6
Alarms/Audio Tab
Figure 11 - Alarms/Audio Tab of Program & Equipment Setup Screen
Copyright 2015 iBall Instruments LLC All Rights Reserved
www.iballinstruments.com
Page 22 of 28 REL15
User’s Manual for the iBall Instruments Gas Charting Software
Release 15 June 2015
The final Tab allows the user to set a number of Gas Chart-generated alarms to notify the user of certain
events. First, the user must select a sound file to play when the alarm is triggered. The program comes with
three (3) sounds that the user can select from, or the user can supply one. The sound file must be a WAV
file. After selecting a WAV file, hitting the Test button will play the file through the PC sound card (to the
computer speakers or head phones) for testing and volume adjustment.
The next selection is to check the Metric Units Box if the user desires to set the Gas Chart alarms using metric units.
The third setting is the “Alarm on Bloodhound Alarms” box. When this box is checked, ANY alarms that
sound on the Bloodhound instrument will cause the Gas Chart alarm to sound. Text and color will appear in
the Announcement Window located on the Gas Chart Control Box below the Scale Setting Area to announce
both Gas Chart-generated alarms and Bloodhound conditions. A list of Bloodhound conditions that can be
reported is provided in Appendix A. Typical Bloodhound conditions that will be reported are “High Gas Units,”
“Low Sample Flow,” and “Blocked Sample Line.”
When the Gas Chart alarm is in triggered, the “Repeat In Seconds” box will cause the sound to repeat every
so many seconds. The default is 10 seconds.
To set a Gas Chart-generated alarm, check the appropriate alarm selection box (or boxes) and fill in the desired values in the windows. Note that, when running remotely, the “Alarm on Lag Depth” uses the lag depth
calculated within the Gas Chart software, not the lag depth calculated by the Gas Chart running at the Bloodhound location. Likewise the “Time And Date” alarm will trigger when that time and date is reached on the
computer that the Gas Chart software is running on, not the time at the Bloodhound location.
SECTION 5.0
SELECT ITEMS BOX
Double left clicking on the gas
chart will bring up a select tool that
changes color and is “stuck” to the
tip of the cursor. Also at the tip of
the cursor is a green information
box that displays the time in
minutes. If the cursor goes to the
left of the geolograph tick marks,
the green information box displays
the depth. This is useful in selecting a range of feet or minutes of
data. By double clicking on a second point on the Gas Chart, you
have just selected a range of data,
and the Select Items Box will ap-
pear.
Figure 12 - Select Items Box
Copyright 2015 iBall Instruments LLC All Rights Reserved
www.iballinstruments.com
Page 23 of 28 REL15
User’s Manual for the iBall Instruments Gas Charting Software
Release 15 June 2015
5.1 Chromatograph Data Window
Examine Raw Chromatograph This button allows the
user to see a close-up view
of the selected chromatograph output. Left clicking
and holding on the chromatogram will allow the user to
adjust the trace up and down
on the display window. If the
trace is too large or too small,
the user can adjust the over
all visual size in the Program
and
Equipment
Setup
Screen, under the Chromatograph Tab. When the user is
satisfied with the display, a
print can be made of the
chromatogram.
The peak search times are
shown as heavy-colored
overlays on the chromatograph curve.
Each timewindow is centered on its
associated vertical line. The
width of the time windows is
controlled by Bloodhound
registers 61 through 65.
Figure 13 - Chromatograph Data Window
The data for the particular chromatogram is available to the right of the chromatogram. If a particular peak
timing is off, or is incorrectly labeled, then all the user has to do is click on the Set Cx peak, place the cross
hairs over the correct peak, and DOUBLE CLICK on the peak to set the new timing window for that component.
To see the previous separation, hit the Previous button. To see the next separation, hit the Next button.
Set Lag Time/Depth This is an easy way to set the Time/Depth feet and time settings. By selecting this button, the user will tell the computer to automatically set a lag based on time and depth. This selection will bring
up the Program and Equipment Setup Screen with the Auto ROP/Lag Tab displayed and the time and footage
filled in.
Figure 13 – Chromatogr
Copyright 2015 iBall Instruments LLC All Rights Reserved
www.iballinstruments.com
Page 24 of 28 REL15
User’s Manual for the iBall Instruments Gas Charting Software
Release 15 June 2015
Restore Selected Geolograph Data This will restore any geolograph data that has been previously deleted or
changed in the range that was selected. To see the difference, select the Raw Geolograph check box and
redraw the chart.
Restore All Geolograph Data This button restores all the geolograph data from the start of the database to
the end. Any changes that have been made will be undone.
Delete Selected Geolograph Ticks This will remove the blue geolograph tick marks from the database. To
see the difference between the blue edited geolograph tick marks and the raw geolograph tick marks, just
check either the Raw or Edited tick marks box of the Gas Chart Control Box.
Erase Selected Data This button will erase all of the selected data from the database. The program will then
perform a database check and then re-index the database.
5.2
Geolograph Edit Box
The gas chart program also has
the ability to edit the geolograph
tick marks on a one-by-one basis.
To change the edited geolograph
data the user must move the
mouse over the geolograph tick
marks, and hold down the right
mouse button. When moving the
cursor over the geolograph tick
marks, it will turn into the up/down
arrow cursor. This will bring up the
Geolograph Edit Select Tool. This
tool is a blinking horizontal line that
will follow the mouse up and down
while the right mouse button is
held down. There is also a green
data box that follows the line that
Figure 14 - Geolograph Edit Box
indicates a depth and time that the mouse is pointing to in the database. While holding down the right mouse
button and moving the mouse up and down, the user will be able to select a specific point that the user will be
able to edit. When releasing the right mouse button, the geolograph edit box will appear next to the mouse.
Add Depth Tick Mark This will
insert a non-numbered foot tick.
This inserted foot tick is not
numbered and will be red in color with a red NF (New Foot) next
to it. These new foot ticks are
intended to be renumbered by
the user at a later time.
Delete Depth Tick Mark This
will remove a single foot tick
from the database. This foot tick
can be a blue edited foot tick or
a red NF foot tick. It will always
Copyright 2015 iBall Instruments LLC All Rights Reserved
www.iballinstruments.com
Page 25 of 28 REL15
User’s Manual for the iBall Instruments Gas Charting Software
Release 15 June 2015
remove the nearest foot tick to the horizontal selection tool.
Figure 15 - Geolograph Edit Box – Add/Delete Depth
Insert Renumbering Stop If the user just wants to renumber within a set of boundaries, then the user has the
ability to enter into the database a single or multiple renumbering stop(s). Renumbering stops allow the user
to control where the renumbering will take place. The insert renumbering stop button will allow the user to
insert as many renumbering stops as needed to control the renumbering of the geolograph.
Remove Renumbering Stop This will remove the nearest renumbering stop to the horizontal select tool.
Renumber Going Up Hole This button tells the charting program to renumber from the horizontal select tool
moving up towards the top of the hole.
Renumber Going Down Hole This buttons tells the charting program to renumber from the horizontal select
tool moving down towards the bottom of the hole.
And Renumber Starting At If the user wishes to change the renumbering numbers, then the user should enter the number that the renumbering will start at. This will start the renumbering at a new number and continue up or down until the end of the database or a renumbering stop is seen.
Renumber Geolograph Start This button will tell the charting program to begin renumbering the database
with the given parameters.
Copyright 2015 iBall Instruments LLC All Rights Reserved
www.iballinstruments.com
Page 26 of 28 REL15
User’s Manual for the iBall Instruments Gas Charting Software
Release 15 June 2015
APPENDIX A
Glossary of Terms, Acronyms and Abbreviations
ASCII
Browser
CG
CO2
DB
H2S
I/O Port
IDB
LAS
LPH
MDB
mmHG
O2
PC
ROP
TCP
TG
USB
WITS
XLS
American Standard Code for Information Interchange
a program used to view HTML documents
Chromatograph
Carbon Dioxide
Database
Hydrogen Sulfide
Input/Output Ports
iBall Database file extension
Logical ASCII Standard File protocol (File Extension compatible with EXCEL & Notepad)
Liters Per Hour
Microsoft Database (Used with Microsoft ACCESS and EXCEL)
Millimeters of Mercury (unit of pressure defined as 1/760 of an atmosphere)
Oxygen
Personal Computer
Rate of Penetration
transmission control protocol: a protocol developed for the internet to get data from one network device to another
Total Gas
Universal Serial Bus (USB) is a serial bus standard to interface devices
Wellsite Information Transfer Specification
Filename Extension (Microsoft Excel spreadsheet file)
Copyright 2015 iBall Instruments LLC All Rights Reserved
www.iballinstruments.com
Page 27 of 28 REL15
User’s Manual for the iBall Instruments Gas Charting Software
Release 15 June 2015
APPENDIX B
POSSIBLE ALARM MESSAGES FROM BLOODHOUND
Condition
No Alarm
High Sample Line Pressure
Blocked Sample Line
Alarm
Number
0
1
2
Detector Voltage High
Detector Voltage Low
High Flow Rate
Low Flow Rate
Low Power Voltage
High Amps going out to 12V Cavitator terminals (60 second average)
High Temperature inside Case
Low Temperature inside Case
High Gas Units
10
11
12
HRM Warming Up
Unit In Shutdown Mode
Geolograph Switch Noise
13
14
15
CG Low Pressure
16
High H2S
Exhaust Blocked (high ex prs)
3
4
5
6
7
9
Bloodhound Register Setting
Reg 52: factory setting 200 (means –200
mmHg)
No register setting - Automatic from HRM
No register setting - Automatic from HRM
Reg 50: factory setting 200 LPH
Reg 51: factory setting 20 LPH
Set at 11.1 VDC No register setting
Reg 37: factory setting 5
Set to 0 to disable
Reg 46: factory setting 120 degrees F
Reg 47: factory setting 35 degrees F
Reg 53: factory setting 22 (means 2200 units)
Set to 0 to disable
No register settings
Reg 33: factory setting 180 spikes
Set to 0 to disable
Reg 54: factory setting 70 (means 700 mmHg)
Set to 0 to disable
Reg 56: factory setting 50
Can set from 0 to 200
Set to 0 to disable
Set to 50 mmHg - No register setting
Copyright 2015 iBall Instruments LLC All Rights Reserved
www.iballinstruments.com
Page 28 of 28 REL15