1
PERKIN ELMER
Lambda 12
Lambda 14
Lambda 14P
UV/Vis Spectrometers
Operation
Part Number 0993-5011
Publication
B2161.20
Release 2.0/Feb. 95
UV/Vis/NIR Spectroscopy
Certificate No. FM 22178
Bodenseewerk Perkin-Elmer GmbH is registered for the design and manufacture of
laboratory analytical equipment in respect to the quality system according to
ISO 9001:1987/EN 29001: 1987/BS 5759: Part 1:1987.
Perkin-Elmer and UV WinLab are trademarks of the Perkin-Elmer Corporation
Registered names, trademarks, etc. used in this document, even when not
specifically marked as such, are not to be considered unprotected by law.
Release
History
Release
5X
Publication Date
June 1994
1.0
September 1994
2.0
February 1995
The information contained in this document is subject to change without notice.
This document contains proprietary information that is protected by copyright.
All rights are reserved. No part of this document may be reproduced in any form whatsoever
or translated into any language without the prior written permission of the
Perkin-Elmer Corporation or one of its subsidiaries.
Copyright © 1994 Bodenseewerk Perkin-Elmer GmbH
Printed in the Federal Republic of Germany
Technical Documentation
Bodenseewerk Perkin-Elmer GmbH
D-88647 Ueberlingen, Federal Republic of Germany
Part Number: 0993-5011
Publication:
B2161.20
Release:
2.0/ February 1995
Table of Contents
Safety Information
Safety Conventions in the Handbook
IEC1010 - Safety Requirements
Electricity
Radio Frequency
Environment
Chemicals
Waste Disposal
UV Radiation
Toxic Fumes
Compressed Gases
S-2
S-3
S-4
S-5
S-6
S-6
S-6
S-7
S-7
S-7
Chapter 1: Introduction
1.1 Keys
1.1.1 Key Combinations
1.1.2 Displays
1-2
1-3
1-4
Chapter 2: Switching On and Off
2.1
2.2
2.3
B2161.20
Startup
Shutdown
Single Cell Holder
2.3.1 Description
,
2.3.2 Installing the Single Cell Holder
2.3.3 Aligning the Single Cell Holder
2.3.4 Minimum Volume Applications
Release 2.0
2-2
2-3
2-4
2-4
..2-5
2-6
2-9
C-1
Table of Contents (continued)
Chapter 3: Operating without Methods
3.1 Overview
3.2 Setting the Wavelength Manually
3.3 Manual Background Correction
3.4 Quick Sample Measurement
3.5 Reset
Chapter 4: How to use Methods
4.1 What are Methods?
4.2 Selecting a Method
4.2.1 Default Methods
4.3 Editing Methods
4.3.1 Modifying a Method
Changing a Parameter
Tagging a Parameter
4.3.2 Deleting a Method
4.3.3 Creating a New Method
Creating an Empty Method File
Overwriting an Existing Method
4.3.4 New Method Name
4.3.5 Checking a Method
4.3.6 Copying Method Parameters into a New Method File
Marking for Copy
Copying the Method into Another Method File
4.3.7 Printing Out a Method
4.4 Printing Out a Directory
4.4.1 Spectrometer Directory
4.4.2 Branch Directory
4.5 Help Key
Chapter 5: Measuring using methods
5.1 Overview
5.2 Method Procedure
5.3 Analysis Procedure
C-2
3-1
3-2
3-3
3-4
3-5
4-1
4-2
4-3
4-4
4-5
4-6
4-7
4-8
4-9
4-9
4-10
. . . 4-11
4-12
4-13
4-13
4-14
4-15
4-16
4-16
4-16
4-17
5-1
5-2
5-3
B2161.20 Release 2.0
Table of Contents (continued)
5.4
5.5
5.6
5.7
Single Wavelength Measurements
5-6
Scanning a Spectrum
5-8
Measurement at Several Wavelengths
5-10
Concentration Determination
5-12
5.7.1 CONCENTRATION 1 Method (Peak heights)
5-12
5.7.2 CONCENTRATION 2 Method (Peak Areas, 2nd Derivative) . . . 5-18
5.7.3 Processing the Calibration Curve (CONCENTRATION Methods) 5-24
5.8 Enzyme Kinetics
5-26
5.9 Substrate Kinetics
5-30
5.9.1 Recalculation of Results with POSTRUN KIN
5-34
5.10 Methods for Quantitative Analysis of Oligonucleotides
5-36
5.11 Date/Time
5-40
5.12 Wakeup
5-42
5.13 Self Test
5-43
Chapter 6: Operating with accessories
6.1 General
6.2 Accessories
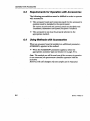
6.3 Requirements for Operation with Accessories
6.4 Using Methods with Accessories
6.4.1 Spectrometer without Accessory Board
6.5 Running Methods with an Accessory
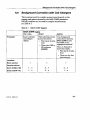
6.6 Background Correction with Cell Changers
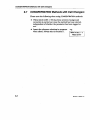
6.7 CONCENTRATION Methods with Cell Changers ,
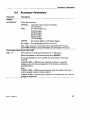
6.8 Accessory Parameters
Chapter 7: Care
7.1 Daily Care
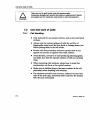
7.2 Use and Care of Cells
7.2.1 Cell Handling
7.2.2 Pressure Buildup in Cells
7.2.3 Sample Compartment Windows
B2161.20 Release 2.0
,
6-1
6-1
'... 6-2
6-2
6-3
6-4
6-5
6-6
6-7
7-1
7-2
7-2
7-3
7-3
C-3
Table of Contents (continued)
Chapter 8: Analytical Notes
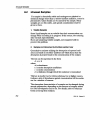
8.1 Background Correction
8.2 Unusual Samples
8.3 Solvent Properties
8-1
8-2
8-4
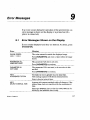
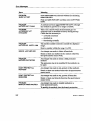
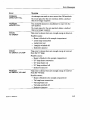
Chapter 9: Error Messages
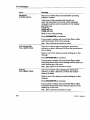
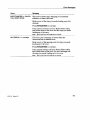
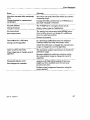
9.1 Error Messages Shown on the Display
9.2 Error Reports on the Printer
9-1
9-6
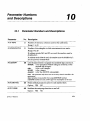
Chapter 10: Parameter Numbers and Descriptions
10.1 Parameter Numbers and Descriptions
10-1
Appendix l:SuperUser
Al.l Activating SuperUser Mode
A1.2 Deactivating SuperUser Mode
Al-1
Al-1
Appendix 2: Protect Functions
A2.1 General Information about Protect Functions
A2.2 Setting Protect Functions
Setting Method Protect Function
A2-1
A2-2
A2-3
Appendix 3: Instrument Branches
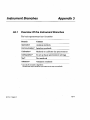
A3.1 Overview Of the Instrument Branches
A3.2 Selecting a Branch
A3.3 About the Various Branches
A3.4 APPLICATION - the Application Branch
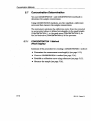
A3.5 COMMUNICATION - the Communication Branch
A3.6 CALIBRATION - the Calibration Branch
A3.7 CONFIGURATION - the Configuration Branch
A3.8 VALIDATION-the Validation Branch
A3.9 TEST - the Test Branch
A3-1
A3-2
A3-3
A3-3
A3-3
A3-4
A3-5
A3-7
A3-7
C-4
B2161.20 Release 2.0
Table of Contents (continued)
Appendix 4: Enzyme Kinetics
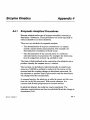
A4.1 Enzymatic Analytical Procedures
A4.2 Enzyme Kinetics
A4.3 Substrate Kinetics
Annex 1: Translations of Warnings
B2161.20 Release 2.0
A4-1
A4-2
A4-4
C-5
Table of Contents (continued)
Illustrations
1-1
2-1
2-2
5-1
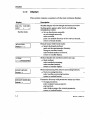
Features common to Lambda 12,14 and 14P
Single Cell Holder B050-5071
,
Correct Alignment of the Radiation Beam in the Cell Sample Area
Flow diagram of a typical method procedure
1-1
2-4
2-7
5-4
Tables
2-1
4-1
4-2
4-3
6-1
8-1
A2-1
C-6
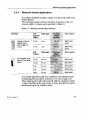
Minimum Volume Requirements
Text and symbols on the lower line of the display
Type of Tags
Help Key Combinations
BACK CORR Tagging
Lower Wavelength Limits of Solvents
Protect Functions
2-9
4-6
4-7
4-17
6-5
8-5
A2-1
B2161.20 Release 2.0
Safety
Information
This section contains important safety information. Please read this
information carefully before you install the instrument and observe
the recommendations at all times.
Safety Information
Contents
Section
Page
Safety Conventions in the Handbook
S-2
IEC 1010 - Safety Requirements
S-3
Electricity
S-4
Radio Frequency
S-5
Environment
S-6
Chemicals
S-6
Waste Disposal
S-6
UV Radiation
S-7
Toxic Fumes
S-7
Compressed Gases
S-7
S-7
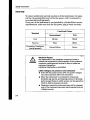
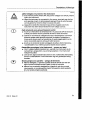
Safety Information
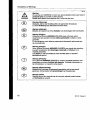
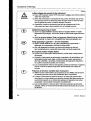
Safety Conventions in the Handbook
Possible hazards that could harm the user or result in damage to the
instrument are clearly stated at appropriate places throughout this
handbook.
The following safety conventions are used throughout this handbook:
,W01.01
WARNING
Warning
We use the term WARNING to inform you about situations
that could result in personal injury to yourself or other
persons.
Details about these circumstances are in a box like this
one.
C01.01
A
CAUTION
Caution
We use the term CAUTION to inform you about situations
tnat
could result in serious damage to the Instrument or
other equipment.
Details about these circumstances are in a box like this
one.
Translations of the warning messages used in this handbook are given in
an Annex at the end of this handbook.
S-2
Safety Information
IEC 1010 - Safety Requirements
This instrument has been designed and tested in accordance with
Perkin-Elmer specifications and IEC 1010: Safety requirements for
electrical equipment for measurement, control, and laboratory use.
The instrument is protected in accordance with IEC Class 1 rating.
This handbook contains information and warnings that must be followed by the user to ensure safe operation and to maintain the instrument in a safe condition.
Before using this instrument it is essential to read the handbook carefully and to pay particular attention to any advice it contains concerning
potential hazards that may arise from the use of the instrument.
The advice is intended to supplement, not supersede, the normal safety
code of behavior prevailing in the user's country.
S-3
Safety Information
Electricity
To ensure satisfactory and safe operation of the instrument, it is essential that the green/yellow lead of the line power cord is connected to
true electrical earth (ground).
If any part of the instrument is not installed by a Perkin-Elmer service
representative, make sure that the line power plug is wired correctly:
Cord Lead Colors
Terminal
International
USA
Live
Brown
Black
Neutral
Blue
White
Protective Conductor
(earth/ground)
Green/Yellow
Green
W02.01
WARNING
Electrical Hazard
Any interruption of the protective conductor inside or
outside the instrument or disconnection of the protective
conductor (earth/ground) terminal is likely to make the
instrument dangerous.
Intentional interruption is prohibited.
W02.02
Lethal voltages are present in the instrument
• Even with the power switch OFF, line power voltages
can still be present within the instrument.
• When the instrument is connected to line power,
terminals may be live, and opening covers or removing
parts (except those to which access can be gained by
hand) is likely to expose live parts.
• Capacitors inside the instrument may still be charged
even if the instrument has been disconnected from all
voltage sources.
S-4
Safety Information
When working with the instrument:
• Connect the instrument to a correctly installed line power outlet
that has a protective conductor (earth/ground).
• Do not attempt to make internal adjustments or replacements
except as directed in this handbook.
• Do not operate the instrument with any covers or parts removed.
• Servicing should be carried out only by a Perkin-Elmer Service
Representative or similarly authorized and trained person.
• Disconnect the instrument from all voltage sources before opening
it for any adjustment, replacement, maintenance, or repair.
If, afterwards, the opened instrument must be operated for further
adjustment, maintenance, or repair, this must only be done by a
skilled person who is aware of the hazard involved.
• Use only fuses with the required current rating and of the specified
type for replacement.
Do not use makeshift fuses or short circuit the fuse holders.
• Whenever it is likely that the instrument is no longer electrically
safe for use, make the instrument inoperative and secure it against
any unauthorized or unintentional operation.
The instrument is likely to be electrically unsafe when it:
— Shows visible damage.
— Fails to perform the intended measurement.
— Has been subjected to prolonged storage under unfavorable
conditions.
— Has been subjected to severe transport stresses.
Radio Frequency
This equipment generates radio frequency energy and if not installed
and used properly, i.e. in strict accordance with the handbook, may
cause harmful interference to radio communications.
S-5
Safety Information
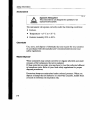
Environment
W01.03
WARNING
Explosive Atmosphere
This instrument is not designed for operation in an
explosive atmosphere.
The instrument will operate correctly under the following conditions:
• Indoors.
• Temperature+15 °C to+35 °C.
• Relative humidity 20 % to 80 %.
Chemicals
Use, store, and dispose of chemicals that you require for your analyses
in accordance with the manufacturer's recommendations and local
safety regulations.
Waste Disposal
Waste containers may contain corrosive or organic solutions and small
amounts of the substances that were analyzed.
If these materials are toxic, you may have to treat the collected effluent
as hazardous waste. Refer to your local safety regulations for proper
disposal procedures.
Deuterium lamps are maintained under reduced pressure. When you
dispose of lamps that are defective or otherwise unusable, handle them
correctly to minimize the implosion risk.
S-6
Safety Information
UV Radiation
You should be aware of the health hazard presented by UV radiation.
• When the deuterium (UV) lamp is switched on, do not open
spectrometer covers unless specifically instructed to do so in the
handbook.
• Always wear UV-absorbing eye protection when the deuterium lamp
is exposed.
• Never gaze into the deuterium lamp.
Toxic Fumes
If you are working with volatile solvents, toxic substances, etc., you
should provide an efficient laboratory ventilation system to remove
vapors that may be produced when you are performing analyses.
Compressed Gases
Handle cylinders of compressed gas with care, in accordance with local
regulations.
We recommend that gas cylinders be located outside the laboratory and
the gases led to the laboratory through approved gas supply lines.
Use only approved tubing, connectors, and regulators for gas supply
lines.
S-7
Safety Information
S-8
Introduction
1
1
Introduction
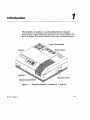
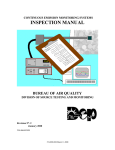
The Lambda 12, Lambda 14 and Lambda 14P are versatile
spectrometers operating in the ultraviolet (UV) and visible (Vis)
spectral ranges. The spectrometers have some common features.
Lamp Compartment
Power Switch
Display
Keyboard
Connector Panel
Sample Compartment
Figure 1-1
B2161.20 Release 2.0
Features common to Lambda 12, 14 and 14P
1-1
Keys
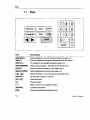
1.1 Keys
(co)
(METHOD J r
(PARAMETER)
f
HELP j
(^OTO\
STOP ^ VBACKN
\CORRJ
f START ^
®
©©®
©®
(5) O ©
f ENTER j
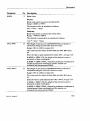
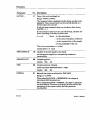
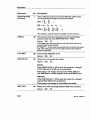
Key
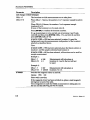
Description
[METHOD]
[HELP]
Selects methods. Use with numerical keys (seepage 4-2).
Provides additional parameter information on the display.
To change the wavelength setting (seepage 3-2).
Selects next parameter. Switches to next lower level.
Stops a method. Switches to next higher level.
Starts background correction (seepage 3-3).
Selects previous or next element in a particular level.
To start and continue a method.
Numerical keys.
Decimal point.
Minus, used to enter negative values.
[GOTO X]
[PARAMETER]
[STOP]
[BACK CORR]
[<]
[H
[START]
[0]to[9]
[ENTER]
[CE]
1-2
Confirms parameter.
Clears unconfirmed parameter entry.
B2161.20 Release 2.0
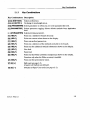
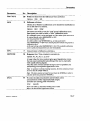
Key Combinations
1.1.1
Key Combinations
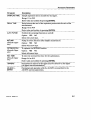
Key Combinations Description
Selects method nnn.
To change to wavelength nnn.n.
[nn] [PARAMETER] Selects parameter nn when you are in the parameter list level.
[•] [PARAMETER] Selects parameter tagging. Selects default methods from Application
level.
[ - ] [PARAMETER] Selects previous parameter.
Prints out a method or branch directory.
W [HELP]
Prints out current values shown on the display.
[0] [HELP]
Prints out method parameters.
[1] [HELP]
Prints out a directory of the methods available in the branch.
[2] [HELP]
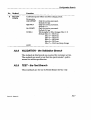
Prints out the additional method information shown on the display.
[3] [HELP]
Line feed.
[4] [HELP]
Form feed.
[5] [HELP]
Prints out the Peltier cell holder temperature shown on the display.
[6] [HELP]
[nnn] [METHOD]
[nnn.n] [GOTO X]
Functions only when the Peltier accessory is installed.
[7] [HELP]
Prints out the spectrometer status.
[7][9]M
Full reset (seepage 3-5).
(Caution: all methods are deleted!).
Switches to Super User mode (seepage Al-1).
[1] [5] [-]
B2161.20 Release 2.0
1-3
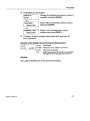
Displays
1.1.2
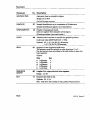
Displays
This section contains a summary of the most common displays.
Description
Display
500.0 NM
0.000 ABS
INPUT
>
<
Standby display
APPLICATION
PARAM/< — >
2 SCAN
< — >/PARAM/START
MODIFY METHOD
PARAM/->
ORDINATE MODE ABS
PARAM/->
1-4
Standby display with wavelength and measured value.
Starting point, appears after switch-on following
initialization routine.
—> Set up absorbance manually,
set wavelength manually,
select method,
print out method directory of the relevant branch,
return to branch header.
Branch header with branch name.
—> Select the branch method,
print out the spectrometer directory,
change to another branch,
select default method of branch,
return to standby display.
Method header with method number and type.
—> Start method,
select method processing,
select another method,
return to standby display.
Method processing with selected processing function.
—» Start processing function,
select another processing function,
return to method header.
Parameter directory with parameter names and value.
—» Change parameter,
select next/previous parameter,
start method,
select help messages for current parameter,
return to method header.
82767.20
Re/ease 2.0
Displays
Displays shown during the measurement:
Display
Description
BACK CORR
Request to start background correction.
PRESS START
Display during background correction.
BACK CORR
xxx nm
n
xxx ABS
SAMPLE n
Request to start sample measurement.
PRESS START
SCAN
xxx nm
CYCLES
xxx ABS
Display during sample measurement (SCAN method).
<— >
Display of a tagged parameter.
If necessary, the parameter can be changed.
BACK CORR IN CELL1
PRESS START
Cell Changer: request to insert blank solutions and start
background correction.
SAMPLES IN 9-CELL
PRESS START
Cell Changer: request to insert sample solutions and
start the measurement.
BACK CORR SIPPER
ACCESSORY START
Sipper: request to press start key on the Sipper (background correction).
SAMPLE 1 SIPPER
ACCESSORY START
Sipper: request to press start key on the Sipper (sample
measurement).
REF 1
[ xxx ]
PRESS START
Request to measure a reference solution.
ORDINATE& ABS
B2161.20 Release 2.0
1-5
1-6
B2161.20
Release 2.0
Switching On and Off
2
Startup and Shutdown
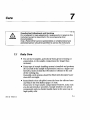
2
Please take your time when operating the spectrometer, wait
until the BUSY display has switched off before pressing the next
key in the sequence. This allows the software to complete the
calculations, and the motors to move the optics to their required
setting.
Before starting analysis, leave the spectrometer switched on for
approximately 10 minutes to allow the lamps to warm up and
stabilize.
B2161.20 Release 2.0
2-1
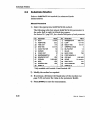
Startup
2.1
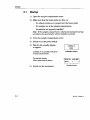
Startup
1) Open the sample compartment cover.
2) Make sure that the beam paths are free, i.e.
- No objects (cables etc.) project into the beam paths.
- No samples are in the sample compartment.
- Accessories are properly installed.
Note: If the sample compartment is obstructed during the startup
procedure, the spectrometer will not initialize correctly.
3) Close the sample compartment cover.
4) Switch on at the power switch.
5) Wait for the standby display
to appear.
Lambda 14 or Lambda 14P shows
on those spectrometers.
The standby display.
Other values may be shown.
6) Switch on the accessories.
2-2
LAMBDA 12
BUSY
Initialization display
500.0 NM
0.000 ABS
INPUT
>
<
Standby display
B2161.20
Release 2.0
Shutdown
2.2
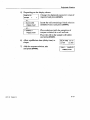
Shutdown
1) Return the spectrometer to standby,
use [STOP] or [PARAMETER].
2) Switch off the accessories.
3) Open the sample compartment cover.
4) Remove samples and cells from the sample compartment.
5) If accessories (e.g. flowcell) are installed in the sample
compartment clean them thoroughly.
6) Close the sample compartment cover.
7) Switch off the spectrometer.
See also Wakeup, page 5-42.
B2161.2Q Release 2.0
2-3
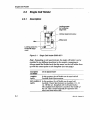
Single Cell Holder
2.3
2.3.1
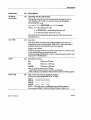
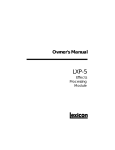
Single Cell Holder
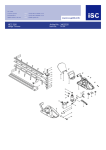
Description
Locking screw
for horizontal
alignment
Vertical alignment screw
Milled post
Lifter
Locking screw forhorizontal alignment
Figure 2-1
Single Cell Holder B050-5071
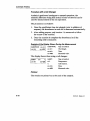
Note: Depending on the spectrometer, the single cell holder can be
installed in two different positions in the sample compartment.
Always install the holder such that the arrow on the cell holder lines
up with the center point on the baseplate (see next page):
2-4
Inscription
on Holder
Use in Spectrometer
LAMBDA
legible
BIO LAMBDA 2
legible
In this position, the cell holder can be used with all
Lambda Series Spectrometers.
In this position, the cell holder can be used with
Lambda 2 Series Spectrometers as Lambda 2,11,12,
14, 14P, Bio etc. (baseplate with 4 threaded holes).
The smallest beam diameter is exactly in the middle of
the cell. This is useful especially for operation with
micro and semi-micro cells.
B2161.20
Release 2.0
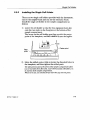
Single Cell Holder
2.3.2
Installing the Single Cell Holder
There are two single cell holders provided with the instrument,
one for the sample beam and one for the reference beam.
Install the single cell holder in the sample compartment as
follows:
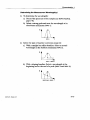
1) Lower the cell holder so that the two alignment holes slip
onto the two studs on the baseplate at the bottom of the
sample compartment.
The arrow on the cell holder must line up with the center
point of the baseplate, and BIO LAMBDA 2 must be legible.
ooooo
2) Move the milled posts a little to locate the threaded holes in
the baseplate, and then tighten the milled posts.
The tube ports located at the front of the sample compartment allow
you to lead tubes from flowcells, water-thermostatted cell holders, etc.
in and out of the sample compartment.
When not in use, you should always insert the caps into the ports.
B2161.20
Release 2.0
2-5
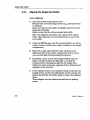
Single Cell Holder
2.3.3
Aligning the Single Cell Holder
Coarse Alignment
1) Open the sample compartment cover.
Fill cells with a low-absorbing solvent (e.g., deionized water
or ethanol).
Insert one cell into the sample cell holder and one into the
reference cell holder.
Make certain that the cells are pushed down fully.
Note: The alignment procedure is for a given cell in a given
holder. After alignment, the cell should always be used in the
same holder.
2) Using the [GOTOX] key, slew the monochromator to 0 nm to
obtain a beam of visible (zero order) radiation in the sample
compartment.
3) Block the sample and reference beam windows on the
right-hand side of the sample compartment with a card to
prevent white light from saturating the detector.
4) By holding a piece of matt white paper behind each cell
holder, visually examine the light spot to see that the
radiation beam is passing through the cell sample area.
Diffraction patterns become apparent if the radiation beam
impinges on the cell wall.
5) If the radiation beam is not centered exactly, loosen the two
locking screws and the two milled posts on the relevant cell
holder and shift the cell holder plate to center the radiation
beam.
Then retighten the two milled posts and the two locking
screws.
2-6
B2161.20 Release 2.0
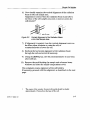
Single Cell Holder
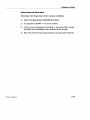
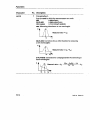
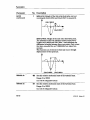
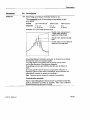
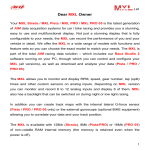
6) Now visually examine the vertical alignment of the radiation
beam in the cell sample area.
Alignment is correct when the radiation beam is just above
the floor of the cell sample area (min. 2 mm) or covers the
cell window1:
min. 2 mm
Figure 2-2
Correct Alignment of the Radiation Beam
in the Cell Sample Area
7) If alignment is required, turn the vertical alignment screw on
the lifter either clockwise to raise the cell, or
counterclockwise to lower the cell.
8) Recheck the horizontal alignment of the radiation beam
through the cell and correct if necessary.
9) Using the [GOTOX.] key, slew the monochromator to any value
above 200 nm.
10) Remove the card blocking the sample and reference beam
windows and close the sample compartment cover.
This completes coarse alignment of the cell holders.
If necessary, proceed with fine alignment as described on the next
page.
1
B2161.20
Release 2.0
The center of the window for micro flowcells should be ideally
approximately 15 mm above the base of the cell.
2-7
Single Cell Holder
Fine Alignment
If fine alignment is necessary, proceed as follows:
1) Using the [GOTOX] key, slew the monochromator to the
requested measurement wavelength or to 460 nm.
2) Call up a method that uses %T as the ordinate.
If necessary change the ordinate mode to %T.
3) Remove the reference cell from the sample compartment.
4) Make horizontal fine alignment to the sample cell holder
(locking screws and milled posts loosened) to obtain the
highest possible transmittance reading on the display (close
the sample compartment cover while measuring
transmittance).
Make fine alignment to the vertical alignment screw again to
obtain the highest possible reading (close the sample
compartment cover while measuring transmittance).
5) When you are satisfied with the alignment, tighten the milled
posts and the locking screws on the cell holder.
6) Reinsert the reference cell in the reference cell holder.
The sample cell remains in its holder.
7) Repeat steps 4 and 5 with the reference cell holder, but this
time obtain the lowest possible transmittance reading on the
display.
This completes the fine alignment procedure.
When the cell holder has been aligned once, you can take it out and
reinstall it without aligning it again.
2-8
•
B2161.20 Release 2.0
Minimum Volume Applications
2.3.4
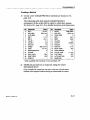
Minimum Volume Applications
To measure minimum sample volumes, use microcells (offered by
Perkin-Elmer).
The minimum sample volume required is a function of the cell
internal width or volume and is specified in Table 2-1.
7ajb/e 2-1
CellType
Height of liquid
slightly more
than height of
beam.
£
Cell window completely filled with
liquid.
Minimum Volume Requirements
Cell
Internal
Width
Pathlength
2 mm
1 cm
150 (iL
B007-9404
(pair)
4 mm
1 cm
300 |iL
B007-9402
(pair)
Cell
Volume
Pathlength
0.5 (iL
0.01 cm
2yL
B051-0076
2.5 \xL
0.5 cm
5|*L
B051-0077
5jxL
0.1cm
lOfiL
B051-0078
5fiL
1.0 cm
10 nL
B050-5823
30 nL
1.0 cm
50 (xL
B019-0608
Minimum
Volume
Required
Minimum
Volume
Required
Part Number
Part Number
You should align microcells very carefully in the radiation beam
by following the procedures in Section 2.3.3, above (page 2-6).
When aligning microcells, fill each cell with the minimum volume
of liquid specified in the above table to make sure that the liquid
meniscus is not in the radiation beam.
B2T67.2O Release 2.0
2-9
2-10
B2W1.20
Release 2.0
Operating without Methods
3
Operating without Methods
3.1
3
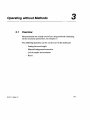
Overview
Measurements are usually carried out using methods containing
all the necessary parameters, see Chapter 5.
The following functions can be carried out via the keyboard:
- Setting the wavelength
- Manual background correction
- Quick sample measurement
- Reset
B2161.20
Release 2.0
3-1
Setting the Wavelength Manually
3.2
Setting the Wavelength Manually
The wavelength can be set manually using the [GOTO X] key as
follows:
...either...
1) Press [GOTO X].
2) Enter the desired wavelength, e.g. 325.5.
3) Press [ENTER].
The monochromator slews to the selected wavelength.
...or...
1) Enter a wavelength using the numeric keys, e.g. 325.5.
2) Then press [GOTO X].
The monochromator slews to the selected wavelength.
3-2
62767.20
Release 2.0
Manual Background Correction
3.3
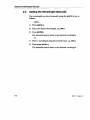
Manual Background Correction
In this operation, the [BACK CORR] key is used to set the
measured absorbance value to 0, or transmittance value to 100%,
for the actual wavelength shown on the display.
1) Open the sample compartment cover.
2) Place cells with blank solution in the reference and sample
cell holders.
...or...
Place empty cells in the reference and sample cell holders.
3) Close the sample compartment cover.
4) Set the desired wavelength using [GOTO X].
5) Press [BACK CORR].
Background correction is complete once the standby display
reappears.
The ordinate mode of the last used method always appears on the display.
To convert absorbance to transmittance or vice versa, select a TIME DRIVE
method, and then select the desired ordinate mode.
B2161.20
Release 2.0
3-3
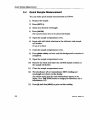
Quick Sample Measurement
3.4
Quick Sample Measurement
You can make quick sample measurements as follows:
1) Prepare the sample.
2) Press [GOTO X].
3) Select your desired wavelength.
4) Press [ENTER].
The monochromator slews to the selected wavelength.
5) Open the sample compartment cover.
6) Insert cells with blank solutions in the reference and sample
cell holders.
Or use air as blank.
7) Close the sample compartment cover.
8) Press [BACK CORR] and wait until the background correction is
completed.
9) Open the sample compartment cover.
10) Remove the blank and insert the cell with sample solution in
the sample cell holder.
11) Close the sample compartment cover.
12) The absorbance (A) or transmittance (%T) reading and
wavelength are shown on the display.
The ordinate mode of the last used method always appears on the
display. Use a TIME DRIVE method to change from absorbance (A) to
transmittance (%T).
13) Press [0] and then [HELP] to print out the reading.
3-4
B2161.20 Release 2.0
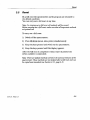
Reset
3.5
Reset
By a full reset the spectrometer and its program are returned to
the default condition.
You can carry out a full reset at any time.
Note: In carrying out a full reset, all methods will be erased.
Before carrying out a full reset, make sure that all important methods
are printed out.
To carry out a full reset:
1) Switch off the spectrometer.
2) Press [7] [9] [•] (seven, nine, point) simultaneously.
3) Keep the keys pressed and switch on the spectrometer.
4) Keep the keys pressed until the display appears.
After the full reset is completed a status report is printed out
(when a printer is connected).
Note: There are default methods stored in the internal memory of the
spectrometer. These methods are not deleted after a full reset and can
be copied and amended (see Section 4.2.1, page 4-3).
B2161.20 Release 2.0
3-5
3-6
B2161.20
Release 2.0
How to use Methods
4
4
Methods
4.1
What are Methods?
Methods are a collection of those parameters necessary for a
particular analysis using the spectrometer and are stored as
method files.
You can process large numbers of samples efficiently using the
methods.
The parameter values necessary for the analysis in question need
only be set once and are then available on request.
Up to 200 methods can be stored in the spectrometer; each
method can be allocated a number between 1 and 999.
On delivery, 10 basic methods are programmed in the
spectrometer; these are immediately available for use.
B2161.20
Release 2.0
4-1
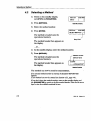
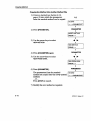
Selecting a Method
4.2
Selecting a Method
1) Switch to the standby display,
use [STOP] or [PARAMETER].
2)
500.0 nm
0.000 ABS
INPUT
>
Press [METHOD].
<
Standby display
3) Enter the method number.
4) Press [ENTER].
500.0 nm
0.000 ABS
SELECT METHOD > <
t
The method is loaded onto the
operational memory.
y
Entry Field
The method header then appears on
the display.
...or...
1) In the standby display, enter the method number.
2) Press [METHOD].
/
The method is loaded onto the
operational memory.
Method Number
S Method
I I
Name
2 SCAN
The method header then appears on
the display.
<—>/PARAM/START
Method header
The method can now be used for measurement.
If an unused method number is entered, the function NEW METHOD
appears.
A new method can now be created (see Section 4.3.3, page 4-9).
If you don't know the method number, return to the standby display and
use [PARAMETER] to switch to the first method header. Then use the arrow
keys to view the available methods in turn.
4-2
B2161.20 Release 2.0
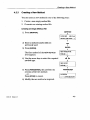
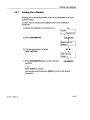
Default Methods
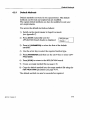
4.2.1
Default Methods
Default methods are stored in the spectrometer. The default
methods can be read and copied, but not modified.
The copied default methods can then be modified to suit your
own requirements.
You access the default methods as follows:
1) Switch on the spectrometer in SuperUser mode
(see Appendix 1).
2) Press [STOP] repeatedly until the
APPLICATION
APPLICATION branch header is displayed.
F
J
,
PARAM/<-->
OAO
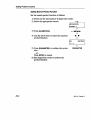
3) Press [•] [PARAMETER] to select the first of the default
methods.
4) Use the arrow key to select the required method type.
5) Press [PARAMETER] and then use the arrow key to select COPY
FROM MARK.
6) Press [STOP] to return to the APPLICATION branch.
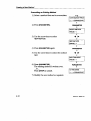
7) Create an empty method file (seepage 4-9).
8) Copy the default method into the empty method file using the
NEW FROM MARK parameter (seepage 4-14).
The default method can now be amended as required.
B2161.20 Release 2.0
4-3
Editing Methods
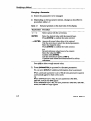
4.3
Editing Methods
The following options are available:
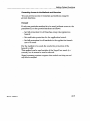
•
MODIFY METHOD
•
DELETE METHOD
•
NEW METHOD
•
NEW METHOD NAME
•
CHECK METHOD
•
MARK FOR COPY, NEW FROM MARK
• PRINT METHOD
To recreate methods that have been inadvertently erased or written over,
regularfy print out all important methods.
4-4
52767.20
Release 2.0
Modifying a Method
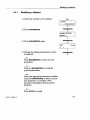
4.3.1
Modifying a Method
1) Select the method to be modified.
2 SCAN
< — >/PARAM/START
PARAMETER
2) Press [PARAMETER].
MODIFY METHOD
PARAM/->
t
PARAMETER
t
3) Press [PARAMETER] again.
SLIT
<
4) Change the displayed parameter values
if required.
1.0 nm
>
PARAMETER
...or...
Press [PARAMETER] to select the next
parameter.
...or...
Press [-] [PARAMETER] to recall the
previous parameter.
...or...
Enter the appropriate parameter number
and press [PARAMETER] to select a particular parameter, see Chapter 10 for
parameter description and parameter
numbers.
.or.
Press [STOP] to cancel.
B2161.20
Release 2.0
4-5
Modifying a Method
Changing a Parameter
1) Select the parameter to be changed.
2) Depending on the parameter shown, change as described in
procedure table 4-1:
Table 4-1
Text and symbols on the lower line of the display.
Text/Symbol Procedure
<— >
Select option with the arrow keys.
ENTER:
Enter the desired value with the numeric keys.
Press [ENTER] to confirm the value entered.
- > ENTER: Appears if several values have to be entered.
Use the arrow key to select the desired parameter.
Enter the required value.
Press [ENTER] to confirm the value entered.
e.g.
Several reference values have to be entered.
Enter the value for REF1.
Confirm with [ENTER].
Use the arrow key to move to REF 2.
Continue until values have been entered for all the
references.
Press [CE] to delete wrongly entered values.
3) Press [PARAMETER] to proceed to the next parameter.
You can press [HELP] for additional information about a parameter.
When a particular parameter is set to YES the extra parameters required
automatically appear in their correct order.
e.g.
When GRAPHICS PLOT is YES, the extra parameters ORD MAX,
ORD MIN, SCALE and GRID appear.
When GRAPHICS PLOT is NO, the extra parameters ORD MAX, ORD MIN,
SCALE and GRID no longer appear.
4-6
B2161.20 Re/ease 2.0
Modifying a Method
Tagging a Parameter
You tag a parameter to change it at appropriate times during the
analysis, e.g. prior to the start of each sample measurement.
Untagged parameters can only be changed prior to the start of a method.
Table 4-2 shows the type of tagging, and when it appears during
the analysis:
Table 4-2
Type of Tags
Tag
Symbol
CALL
BATCH
START
FIX
&
I
*
FIX
Appears
Prior to the start of a method.
Prior to the start of each sample batch.
Prior to the start of each sample.
No tag
Tag a parameter as follows:
1) Select the parameter to be
tagged, for example:
2) Press [•] [PARAMETER].
3) Select the appropriate tagging with the
arrow keys.
BACK CORR
NO
PARAM/->
• PARAMETER
!
BACK CORR
FIX
PARAM/->
4) Press [ENTER].
Every parameter can be tagged. For parameters where tagging is less
meaningful (e.g. LAMP, GRAPHICS PLOT), tagging is accepted, but not
carried out.
B2161.20 Release 2.0
4-7
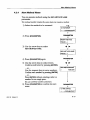
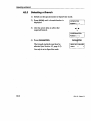
Deleting a Method
4.3.2
Deleting a Method
1) Select a method that can be deleted.
e.g.
2 SCAN
< — >/PARAM/START
2) Press [PARAMETER].
PARAMETER
MODIFY METHOD
PARAM/->
3) Use the arrow keys to select
DELETE METHOD.
•
A
DELETE METHOD
PARAM/->
i
4) Press [PARAMETER] again to delete the
PARAMETER
method.
The method is deleted as soon as
[PARAMETER] is pressed, and the display
returns to the next method header in the list.
...or...
Press [STOP] to cancel.
4-8
B2161.20 Release 2.0
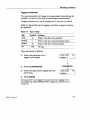
Creating a New Method
4.3.3
Creating a New Method
You can create a new method in one of the following ways:
1. Create a new empty method file.
2. Overwrite an existing method file
Creating an Empty Method File
1) Press [METHOD].
METHOD
0.000 ABS
500.0 nm
SELECT METHOD > <
2) Enter a method number nnn not
previously used.
3) Press [ENTER].
The first method of the NEW METHOD
level appears.
4) Use the arrow keys to select the required
method type.
+
nnn
t
ENTER
1
NEW TIMEDRIVE
PARAM/->
<
•
NEW SCAN
PARAM/->
5) Press [PARAMETER], this confirms the
creation of the new method.
...or...
Press [STOP] to cancel.
PARAMETER
1
nnn SCAN
< — >/PARAM/START
6) Modify the new method as required.
B2161.20 Release 2.0
4-9
Creating a New Method
Overwriting an Existing Method
1) Select a method that can be overwritten.
e.g.
13WAVELENGTHPROG
< — >/PARAM/START
2) Press [PARAMETER].
PARAMETER
i
MODIFY METHOD
PARAM/->
i
3) Use the arrow keys to select
NEW METHOD.
•
A
NEW METHOD
PARAM/->
4) Press [PARAMETER] again.
5) Use the arrow keys to select the method
type.
PARAMETER
•
A
t
NEW TIME DRIVE
PARAM/->
6) Press [PARAMETER].
The existing method is written over.
...or...
Press [STOP] to cancel.
PARAMETER
13 TIME DRIVE
< — >/PARAM/START
7) Modify the new method as required.
4-10
B2161.20 Release 2.0
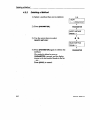
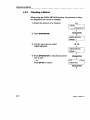
New Method Name
4.3.4
New Method Name
You can rename methods using the NEW METHOD NAME
parameter.
The method number remains the same when you rename a method.
1) Select the method to be renamed.
e.g.
13 TIME DRIVE
< — >/PARAM/START
PARAMETER
2) Press [PARAMETER].
MODIFY METHOD
PARAM/->
3) Use the arrow keys to select
NEW METHOD NAME.
•
NEW METHOD NAME
PARAM/->
PARAMETER
4) Press [PARAMETER] again.
<
5) Use the arrow keys to select letters.
Confirm each letter by pressing [ENTER].
...or...
Use the numeric keys to enter numbers.
Confirm each number by pressing [ENTER].
...or...
Press [ENTER] without entering a letter or
number for an empty space.
You can combine numbers and letters.
6) Press [PARAMETER] to confirm the new
•
NEW METHODNAME
>
TIMEDRI<
PARAMETER
name.
13 TIME DRIVE 2
< — >/PARAM/START
B2161.20 Release 2.0
4-11
Checking a Method
4.3.5
Checking a Method
When using the CHECK METHOD function, the parameter values
are displayed, but cannot be changed.
1) Select the method to be checked.
e.g.
2 SCAN
< — >/PARAM/START
1
PARAMETER
2) Press [PARAMETER].
MODIFY METHOD
PARAM/->
<
3) Use the arrow keys to select
•
CHECK METHOD.
CHECK METHOD
PARAM/->
4) Press [PARAMETER] to check each param-
PARAMETER
eter in turn.
...or...
Press [STOP] to cancel
SLIT
1.0 nm
CHECK ONLY
PARAMETER
4-12
B2161.20
Release 2.0
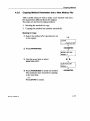
Copying Method
4.3.6
Copying Method Parameters into a New Method File
This is useful when you wish to make a new method with only a
few parameters different from the original.
Two steps are involved in this procedure:
1. Marking the method for copy.
2. Copying the method into another method file.
Marking for Copy
1) Select the method who's parameters are
to be copied.
e.g.
2 SCAN
< — >/PARAM/START
2) Press [PARAMETER].
PARAMETER
1
MODIFY METHOD
PARAM/->
•
3) Use the arrow keys to select
MARK FOR COPY.
<
•
t
MARK FOR COPY
PARAM/->
i
4) Press [PARAMETER] to mark the method.
The method is now marked for copying
in the next step.
PARAMETER
.or.
Press [STOP] to cancel.
B2161.20
Release 2.0
4-13
Copying Method
Copying the Method into Another Method File
1) Create a method (see Section 4.3.3,
page 4-9) into which the parameters
from the marked method can be copied.
e.g.
13 SCAN
< — >/PARAM/START
2) Press [PARAMETER].
PARAMETER
MODIFY METHOD
PARAM/->
3) Use the arrow keys to select
<
•
NEW METHOD.
NEW METHOD
PARAM/->
4) Press [PARAMETER] again.
5) Use the arrow keys to select
NEW FROM MARK.
PARAMETER
<
•
NEW FROM MARK
PARAM/->
6) Press [PARAMETER].
The parameters from the marked
method are copied into the newly created
method.
...or...
Press [STOP] to cancel.
PARAMETER
13 SCAN
< — >/PARAM/START
7) Modify the new method as required.
4-14
B2181.2Q
Release
2.0
Printing Out a Method
4.3.7
Printing Out a Method
Printing out a method provides a list of its parameters and their
current values.
A printer must be installed and configured (refer to the installation
handbook).
1) Select the method to be printed out.
e.g.
2 SCAN
< — >/PARAM/START
2) Press [PARAMETER].
PARAMETER
+
MODIFY METHOD
PARAM/->
3) Use the arrow keys to select
PRINT METHOD.
<
•
PRINT METHOD
PARAM/->
4) Press [PARAMETER] again to print out the
method.
PARAMETER
...or...
Press [STOP] to cancel.
You can also press [1] and then [HELP] to print out the method
parameters.
B2161.20 Release 2.0
4-15
Printing Out a Director
4.4
Printing Out a Directory
Printing out a directory provides a list of its methods.
A printer must be installed and configured (refer to the installation
handbook).
There are two directories, the spec'trometer directory and the
branch directory.
4.4.1
Spectrometer Directory
The spectrometer directory is a list of all methods for the
spectrometer (including the Super User methods).
Print out the directory as follows:
1) Select a branch header.
e>g#
APPLICATION
PARAM/< — >
2) Press [•] and then [HELP]
to print out a directory of
T
[•] [HELP]
4.4.2
Branch Directory
The branch directory is a list of all the methods in the selected
branch.
Print out all the methods in the selected branch as follows:
To select SuperUser branches, you must first enter as SuperUser, see
Appendix 1.
1) Select a method in the branch to be
printed out.
c
2) Press [•] and then [HELP]
to print out the branch
directory.
e<g#
2 SCAN
< — >/PARAM/START
i
[•] [HELP]
You can also press [2] and then [HELP] to print out the branch
directory.
4-16
B2161.20 Release 2,0
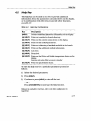
Help Key
4.5
Help Key
The help key can be used on its own to provide additional
information about the parameters currently shown on the display,
or in combination with other keys to provide other functions,
see table 4-3:
Table 4-3 Help Key Combinations
Key
Description
[HELP]
Provides additional parameter information on the display.
[•] [HELP] Prints out a method or branch directory.
[0] [HELP] Prints out the current values shown on the display.
[1] [HELP] Prints out the method parameters.
[2] [HELP] Prints out a directory of methods available in the branch.
[3] [HELP] Prints out the additional method information.
[4] [HELP] Line feed.
[5] [HELP] Form feed.
[6] [HELP] Prints out the Peltier cell holder temperature shown on the
display.
Functions only when Peltier accessory is installed
[7] [HELP] Prints out spectrometer status.
To view the help text for a particular parameter proceed as
follows:
1) Select the desired parameter.
2) Press [HELP].
3) Continue to press [HELP] to view all the text.
...or...
Press [PARAMETER] to interrupt the help function.
Help text is available in German, refer to the help configuration in
SuperUser.
B2161.20 Release 2.0
4-17
B2161.20 Release 2.0
Measuring using Methods
5
5
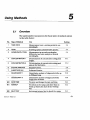
Using Methods
5.1
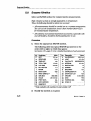
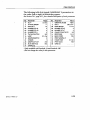
Overview
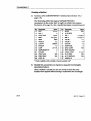
The spectrometer incorporates the basic types of methods shown
in the table below:
No. Type of Method
1
TIME DRIVE
2
SCAN
3
WAVELENGTH PROG
4
CONCENTRATION 1
5
CONCENTRATION 2
6
ENZYME KINETICS
7
SUBSTRATE KIN
-
OLIGOQUANT 1
-
OLIGOQUANT 2
900
DATE/TIME
901
WAKEUP
999
SELF TEST
B2161.20
Release 2.0
Use
Measurement over a certain period at one
wavelength.
Scanning spectra and derivative spectra.
Measurement at several wavelengths;
differential and ratio analysis at several
wavelengths.
Determination of concentration using peak
height.
Determination of concentration using peak
area or 2nd derivative.
Enzyme kinetics.
Substrate kinetics.
Quantitative analysis of oligonucleotides up
to 50 bases long.
Quantitative analysis of oligonucleotides
longer than 50 bases.
To enter and change the date and time.
To switch on the lamps and allow them to
warm up before the start of the working
day.
Instrument internal test to check the optics.
Section
5.4 .-
5.5
5.6
5.7.1
•
5.7.2
5.8
5.9
5.10
5.10
5.11
5.12
5.13
5-1
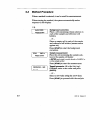
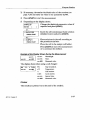
5.2
Method Procedure
When a method is selected, it can be used for measurements.
When starting the method, the system automatically makes
requests via the display:
e.g.
BACKCORR
PRESS START
SCAN
SMPLn
PRESS START
Background correction:
Place a cell containing a blank solution in
each of the sample and reference cell
holders.
...or...
Place an empty cell in each of the sample
and reference cell holders (measurement
against air).
Press [START] to start the background
correction.
Sample measurement:
Place the cell containing the sample solution in the sample cell holder.
n ENTER can be used to switch directly to SAMPLE n;
n is the sample number.
ORDINATE& ABS
Press [START] to start the measurement.
Tagged parameter (& is the CALL tag):
if desired, enter a new value and press
[ENTER].
...or...
Select a new value using the arrow keys.
Press [START] to proceed with the analysis.
5-2
B2161.20
Release 2.0
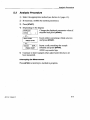
Analysis Procedure
5.3
Analysis Procedure
1) Select the appropriate method (see Section 4.2, page 4-2).
2) If necessary, modify the method parameters.
3) Press [START].
4) Depending on the display:
Change the displayed parameter values if
SAMPLE ID
required
and press [START].
ENTER
>
... or...
BACKCORR
PRESS START
... or...
xxxxxx
SMPL 1
PRESS START
Insert cell(s) containing a blank solution
and press [START].
Insert a cell containing the sample
solution and press [START].
XXXXis any method type.
5) Continue to insert samples when asked until they have all
been measured.
Interrupting the Measurement
Press [STOP] to interrupt a method in progress.
B2161.20
Release 2.0
5-3
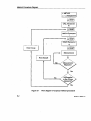
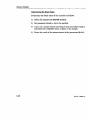
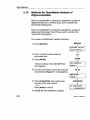
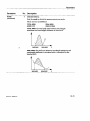
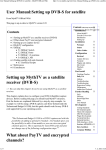
Method Procedure Diagram
n METHOD
<—>/PARAM/START
No
/
Measurement
Repeated
All Samples
in the Group
measured?
Figure 5-1
5-4
Flow diagram of a typical method procedure
B2161.20 Release 2.0
5-5
B2161.20
Release 2.0
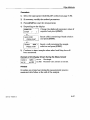
Time Drive
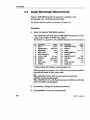
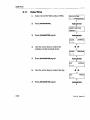
5.4
Single Wavelength Measurements
Select a TIME DRIVE method to measure a sample at one
wavelength over a defined period of time.
For Enzyme Activity methods, see Section 5.8, page 5-26.
Procedure
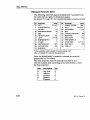
1) Select the desired TIME DRIVE method.
The following table lists typical TIME DRIVE parameters in the
order (left to right) in which they appear.
See Section 10.1, page 10-1, for a detailed description of each parameter.
No.
17
3
14
16
19
22
26
28
32
36
Parameter
SLIT*
WAVELENGTH
RESPONSE
BACK CORR
FIRST SAMPLE #
CYCLE-TIME
ORD.MAX
SCALE
PRINT DATA
OPERID
Value
2.0 nrn
500.0 nm
0.5 s
YES
1
0.1 min
0.000 ABS
20 nm/min
YES
No.
1
11
15
18
21
25
27
29
35
37
Parameter
Value
ORDINATE MODE
ABS
FACTOR
1.0
LAMP
UV + Vis
SAMPLES/BATCH
0
1
CYCLES
GRAPHICS PLOT
YES
ORD.MIN
1.000 ABS
GRID
NO
AUTO METHOD
NO
SAMPLE ID
* Only available with Lambda 14 arid Lambda 14P
When a particular parameter is set to YES the extra parameters required
automatically appear in their correct order.
e.g.
When GRAPHICS PLOT is YES, the extra parameters ORD MAX,
ORD MIN, SCALE and GRID appear.
When GRAPHICS PLOT « NO, the extra parameters ORD MAX, ORD MIN,
SCALE and GRID no longer appear.
2) If necessary, change the method parameters.
3) Press [START] to start the measurement.
5-6
B2W1.20 Release 2.0
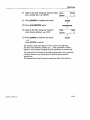
Time Drive
4) Depending on the display:
SAMPLE ID
I Change the displayed parameter values if
ENTER
>
< required and press [START].
... or...
Insert cell(s) containing a blank solution
and press [START].
BACK CORR
PRESS START
... or...
TIMEDRIVE
SMPL1
PRESS START
Insert a cell containing the sample
solution and press [START].
5) Continue to insert samples when asked until they have all
been measured.
Example of the Display Shown During the Measurement
xxx nm
xxx min
xxxABS
xxx nm:
Wavelength.
xxx ABS
xxx min
C :xx
Measured value; ordinate as selected.
Time; units as selected.
Repeat measurement cycles still to be performed
This appears on the top right, when cycles > 1 .
Printout
The result is printed out at the end of the analysis.
B2161.20
Release 2.0
5-7
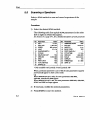
Scan
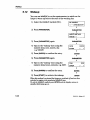
5.5
Scanning a Spectrum
Select a SCAN method to scan and record a spectrum of the
sample.
Procedure
1) Select the desired SCAN method.
The following table lists typical SCAN parameters in the order
(left to right) in which they appear.
See Section 10.1, page 10-1, fora detailed description of each parameter.
No.
17
3
13
15
18
21
25
27
29
32
35
37
Parameter
Value
SLIT*
2.0 nm
WAV. MAX
1100.0 nm
SPEED
960 nm/min
LAMP
UV+Vis
SAMPLES/BATCH
0
1
CYCLES
GRAPHICS PLOT
YES
ORD.MIN
0.000 ABS
GRID
YES
PRINT DATA
YES
AUTO METHOD
YES
SAMPLE ID
No.
1
4
14
16
19
22
26
28
30
33
36
Parameter
Value
ORDINATE MODE
ABS
WAV MIN
190.0 nm
2nm
SMOOTH
YES
BACK CORR
1
FIRST SAMPLE #
CYCLE TIME
0.1 min
ORD.MAX
1.000 ABS
SCALE
50.0 nm/cm
OVERLAY
NO
THRESHOLD
0.1 ABS
OPER. ID
* Only available with Lambda 14 and Lambda 14P
When a particular parameter is set to YES the extra parameters required
automatically appear in their correct order.
e.g.
When GRAPHICS PLOT is YES, the extra parameters ORD MAX,
ORD MIN, SCALE and GRID appear.
When GRAPHICS PLOT is NO, the extra parameters ORD MAX, ORD MIN,
SCALE and GRID no longer appear.
2) If necessary, modify the method parameters.
3) Press [START] to start the method.
5-8
B2161.20 Release 2.0
Scan
4) Depending on the display shown:
SAMPLE ID
I Change the displayed parameter values if
ENTER
>
< required and press [START].
... or...
Insert cell(s) containing a blank solution
and press [START].
BACK CORR
PRESS START
... or...
SCAN
SMPL1
PRESS START
Insert a cell containing the sample
solution and press [START].
5) Continue to insert samples when asked until they have all
been measured.
Example of the Display Shown During the Measurement
SCAN
xxx nm
SMPL 1
xxxABS
xxx n m :
xxx ABS
CYC:xx
Wavelength.
Measured value; ordinate as selected.
Repeat measurement cycles still to be performed
This appears on the top right, when cycles > 1 .
Printout
Graphics are printed out during the measurement process;
numerical data follow at the end of the analysis.
82161.20 Release 2.0
5-9
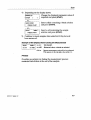
Wavelength Program
5.6
Measurement at Several Wavelengths
Select a wavelength program (WAVELENGTH PROG) method to
measure a sample at several different wavelengths.
Procedure
1) Select the desired WAVELENGTH PROG method.
The following table lists typical WAVELENGTH PROG
parameters in the order (left to right) in which they appear.
See Section 10.1, page 10-1, fora detailed description of each parameter.
No. Parameter
17 SLIT*
2
3
11
11
15
18
21
25
27
29
35
Value
2.0 nm
# WAVELENGTH
3
WAV. 2
418.5 nm
FACTOR 1
1.0
FACTOR 2
1.0
LAMP
UV+Vis
SAMPLES/BATCH
0
CYCLES
1
GRAPHICS PLOT
YES
ORD. MIN
0.000 ABS
GRID
YES
AUTO METHOD
NO
37
SAMPLE ID
No.
1
3
3
11
14
16
19
22
26
28
32
36
Parameter
Value
ORDINATE MODE
ABS
WAV. 1
459.9 nm
360.0 nm
WAV. 3
FACTOR 2
1.0
RESPONSE
0.5 S
BACK CORR
YES
1
FIRST SAMPLE*
CYCLE TIME
0.1 min
ORD.MAX
1.000 ABS
SCALE
20 mm/min
PRINT DATA
YES
OPER. ID
* Only available with Lambda 14 and Lambda 14P
When a particular parameter is set to YES the extra parameters required
automatically appear in their correct order.
e.g.
When GRAPHICS PLOT is YES, the extra parameters ORD MAX,
ORD MIN, SCALE and GRID appear.
When GRAPHICS PLOT is NO, the extra parameters ORD MAX, ORD MIN,
SCALE and GRID no longer appear.
2) If necessary, modify the method parameters.
3) Press [START] to start the measurement.
5-10
B2161.20 Release 2.0
Wavelength Program
4) Depending on the display:
SAMPLE ID
I Change the displayed parameter values if
ENTER
>
< required and press [START].
... or...
Insert cell(s) containing a blank solution
and press [START].
BACK CORR
PRESS START
... or...
WAVPROG
SMPL1
PRESS START
I
Insert a cell containing the sample
solution and press [START].
5) Continue to insert samples when asked until they have all
been measured.
Example of the Display Shown During the Measurement
WAVPROG
xxx nm
SMPLn
xxx nm:
Wavelength.
Measured value; ordinate as selected.
xxxABS
CYC:xx
Repeat measurement cycles still to be performed
This appears on the top right, when cycles > 1 .
Printout
The result is printed out at the end of the analysis.
B2161.20 Release 2.0
5-11
Concentration Methods
5.7
Concentration Determination
You use CONCENTRATION 1 and CONCENTRATION 2 methods to
determine the sample concentration.
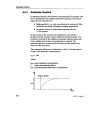
Using CONCENTRATION methods, you first establish a calibration
curve and then measure the sample concentration.
The instrument calculates the calibration curve from the corrected
or uncorrected values at defined wavelengths via the peak heights
(CONCENTRATION 1), or the peak areas (CONCENTRATION 2), or
the 2nd derivative (CONCENTRATION 2) of the spectrum.
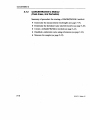
5.7.7
CONCENTRATION 1 Method
(Peak heights)
Summary of the procedure for creating a CONCENTRATION 1 method:
• Determine the measurement wavelength(s) (seepage 5-13).
• Create a CONCENTRATION 1 method (seepage 5-14).
• Establish a calibration curve using references (seepage 5-15).
• Measure the sample (seepage 5-16).
5-12
B2161.20 Release 2.0
Concentration 1
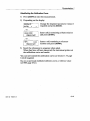
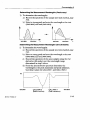
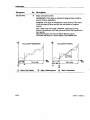
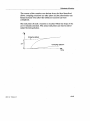
Determining the Measurement Wavelength(s)
1) To determine the wavelengths:
a) Record the spectrum of the sample (see SCAN method,
page 5-8).
b) Select a strong peak and note the wavelength at its
absorbance maximum (WAV. 1).
WAV.1
2) Select the type of baseline correction required:
a) With a straight but offset baseline: Select a second
wavelength at the baseline minimum (WAV. 2).
WAV.1
WAV.2'
b) With a sloping baseline: Select a wavelength at the
beginning and at the end of a peak (WAV. 2 and WAV. 3).
WAV.3 WAV.1 WAV.2
B2161.20 Release 2.0
5-13
Concentration 1
Creating a Method
1) Create a new CONCENTRATION 1 method (see Section 4.3.3,
page 4-9).
The following table lists typical CONCENTRATION 1
parameters in the order (left to right) in which they appear.
See Section 10.1, page 10-1, for a detailed description of each parameter.
No.
17
3
6
7
9
8
10
12
15
18
21
32
26
36
Parameter
SLIT*
WAV. 1
CONC UNIT
Value
2.0 nm
3
ng/mL
REF2
2.0 ng/mL
REFS.
NEW
0.2
VALUE 2
CUR FIT
DIVISOR
LINEAR
LAMP
UV+Vis
SAMPLES/BATCH
CYCLES
PRINT DATA
PRINT REFS
OPER. ID
1.0
0
1
YES
YES
No.
1
2
7
7
8
8
11
14
16
19
22
25
35
37
Parameter
MODE
Value
ABS
# OF REFS
3
LO^g/mL
3.0 ng/mL
REF1
REF3
VALUE 1
0.1
VALUE 3
0.3
FACTOR
1.0
1s
RESPONSE
YES
1
BACK CORR
FIRST SAMPLE
0.1 min
CYCLE-TIME
PLOT REFS
YES
AUTO METHOD
YES
SAMPLE ID
* Only available with Lambda 14 and Lambda 14P
2) Modify the parameters as required, using the wavelengths
determined above.
Once a method is created you can save it and use it for the same
analysis when required without having to redetermine the wavelengths.
5-14
B2161.20 Release 2.0
Concentration 1
Establishing the Calibration Curve
1) Press [START] to start the measurement.
2) Depending on the display:
SAMPLE ID
ENTER
>
Change the displayed parameter values if
required and press [START].
.or.
BACK CORR
PRESS START
Insert cell(s) containing a blank solution
and press [START].
...or...
REFn
[xxx]
PRESS START
Insert a cell containing a reference
solution and press [START].
3) Insert the references in sequence when asked.
When they have all been measured, the instrument prints out
the calibration curve and results.
You can now amend the calibration curve (see Section 5.7.3 page
5-24) if required.
You can use previously established calibration curves, or reference values
(see REFS, page 10-21).
B2161.20 Release 2.0
5-15
Concentration 1
Measuring the Sample
1) Press [START] to start the measurement.
2) Depending on the display:
Change the displayed parameter values if
SAMPLE ID
required
and press [START].
ENTER
>
... or...
Insert cell(s) containing a blank solution
and press [START].
BACK CORR
PRESS START
... or...
CONC1
SMPL1
PRESS START
Insert a cell containing the sample
solution and press [START].
3) Continue to insert samples when asked until they have all
been measured.
Example of the Display Shown During the Measurement
CONC1
SMPL1
xxxC
xxx.xnra
CYCLES XX
xxx.x nm
xxx nm:
Wavelength.
xxx C:
Result; units as selected.
CYCLES:XXRepeat measurement cycles still to be performed
This appears on the top right,when cycles > 1 .
xxx C
Printout
If PLOT REFERENCES and PRINT DATA are set to YES, the
calibration curve and results are printed out.
5-76
B2161.20 Release 2.0
5-17
82161.20
Release 2.0
Concentration 2
5.7.2
CONCENTRATION 2 Method
(Peak Areas, 2nd Derivative)
Summary of procedure for creating a CONCENTRATION 2 method:
• Determine the measurement wavelengths (seepage 5-19).
• Determine the threshold value (2nd derivative) (seepage 5-20).
• Create a CONCENTRATION 2 method (seepage 5-21).
• Establish a calibration curve using references (seepage 5-22).
• Measure the sample (seepage 5-23).
5-18
B2W1.20 Release 2.0
Concentration 2
Determining the Measurement Wavelengths (Peak areas)
1) To determine the wavelengths:
a) Record the spectrum of the sample {see SCAN method, page
5-8).
b) Select a strong peak and note the wavelength at its start
(WAV. MAX) and end (WAV. MIN).
A
A
...or...
WAV.MIN
WAV. MAX
WAV.MIN
WAV. MAX
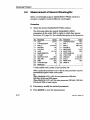
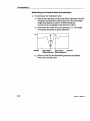
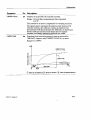
Determining the Measurement Wavelengths (2nd derivative)
1) To determine the wavelengths:
a) Record the spectrum of the sample {see SCAN method, page
5-8).
b) Select a strong peak and note the wavelength at its start
(WAV. MAX) and end (WAV. MIN).
c) Record the spectrum of the same sample using the 2nd
derivative (D2 mode) over the wavelength range
determined in step b above.
d) From the 2nd derivative spectrum determine the
wavelength at the peak maximum and peak minimum.
Use these values for CALC.WAV 1 and CALC. WAV 2.
D2
WAV.MIN
B2161.20
Release 2.0
CALC.WAV 2
(Peak minimum)
CALC.WAV 1
(Peak maximum)
WAV. MAX
5-19
Concentration 2
Determining the Threshold Value (2nd derivative)
1) To determine the threshold value:
a) Record the spectrum of the most dilute reference solution
using the 2nd derivative (D2 mode) over the wavelength
range determined in step lb of Determining the
measurement wavelengths (2nd derivative) above.
b) Determine the value D2 of this spectrum, i.e. the height
from peak maximum to peak minimum.
WAV.MIN
CALC.WAV2
CALC.WAV 1
WAV.MAX
(Peak minimum) (Peak maximum)
c) Select a value for the threshold parameter somewhat
lower than this D2 value.
5-20
B2161.20 Release 2.0
Concentration 2
Creating a Method
1) Create a new CONCENTRATION 2 method (see Section 4.3.3,
page 4-9).
The following table lists typical CONCENTRATION 2
parameters in the order (left to right) in which they appear.
See Section 10.1, page 10-1, fora detailed description of each parameter.
No.
17
3
2
7
7
8
8
11
13
15
18
21
32
26
36
Parameter
Value
SLIT*
2.0 nm
WAV. MAX
600.0 nm
# OF REFS
3
1.0 C
REF1
3.0 C
REF3
VALUE 1
0.1
VALUE 3
0.3
1.0
FACTOR
SPEED
960 nm/min
UV+Vis
LAMP
SAMPLES/BATCH
0
1
CYCLES
PRINT DATA
YES
PRINT REFS
YES
OPER. ID
No.
1
4
6
7
9
8
10
12
14
16
19
22
25
35
37
Parameter
MODE
WAV. WIN
CONC UNIT
REF2
REFS
VALUE 2
CUR FIT
DIVISOR
SMOOTH
BACK CORR
FIRST SAMPLE
CYCLE-TIME
PLOT REFS
AUTO METHOD
SAMPLE ID
Value
PEAK AREA
500.0 nm
C
2.0 C
NEW
0.2
LINEAR
1.0
2nm
YES
1
0.1 min
YES
YES
* Only available with Lambda 14 and Lambda 14P
Modify the parameters as required, using the values
determined above.
Once a method is created you can save it and use it for the same
analysis when required without having to redetermine the values.
BZ161.S0 Release 2.0
5-21
Concentration 2
Establishing the Calibration Curve
1) Press [START] to start the measurement.
2) Depending on the display:
Change the displayed parameter values if
SAMPLE ID
required and press [START].
ENTER
>
... or...
BACK CORR
PRESS START
... or...
REF n
[ XXX ]
PRESS START
Insert cell(s) containing a blank solution
and press [START].
Insert a cell containing the sample
solution and press [START].
3) Insert references in sequence when asked.
When they have all been measured, the instrument prints out
the calibration curve and results.
You can now amend the calibration curve {see Section 5.7.3,
page 5-24) if required.
You can use previously established calibration curves, or reference values
(see REFS, page 10-21).
5-22
B2161.20 Release 2.0
Concentration 2
Measuring the Sample
1) Press [START] to start the measurement.
2) Depending on the display:
Change the displayed parameter values if
SAMPLE ID
required
and press [START].
ENTER
>
... or...
Insert cell(s) containing a blank solution
and press [START].
BACK CORR
PRESS START
... or...
CONC2
SMPL1
PRESS START
Insert a cell containing the sample
solution and press [START].
3) Continue to insert samples when asked until they have all
been measured.
Example of the Display Shown During the Measurement
SMp,
CONC2
xxx.x nm
.
xxxC
CYCLES XX
xxx.x nm
xxx nm:
Wavelength.
xxx C:
Result; units as selected.
CYCLES:XXRepeat measurement cycles still to be performed
This appears on the top right,when cycles > 1 .
xxx C
Printout
If PLOT REFERENCES and PRINT DATA are set to YES, the
calibration curve and results are printed out.
B2161.20 Release 2.0
5-23
Calibration Curve
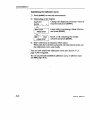
5.7.3
Processing the Calibration Curve
(CONCENTRATION Methods)
Changing the Type of Curve Fit
The type of calibration curve fit (linear or quadratic) can be
altered without having to carry out additional measurements.
The procedure is as follows:
1) Modify the method: Select REFS = OLD
CUR FIT as required
2) Press [START].
The new curve fit is calculated on already available data.
Remeasuring the Reference Solution
Should a measuring point lie outside the calibration curve and
need to be remeasured, proceed as follows:
1) Modify the method: select REFS = NEW.
2) Press [START].
3) When asked for first reference solution,
enter the number of the reference to be
remeasured and press [ENTER].
REF 1
[ xxx ]
PRESS START
4) Place the reference solution in the sample cell holder
and press [START].
5) Wait until measurement is complete and then press [STOP].
6) Set REFS = OLD.
,7) Press [START].
The new calibration curve is calculated with the new value.
If the new curve is satisfactory, measure the sample,
...or...
if it is not acceptable, repeat the procedure.
5-24
B2161.20 fle/easB 2.0
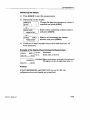
Calibration Curve
Deleting a Point from the Calibration Curve
To delete such a point proceed as follows:
Linear curve through zero
In the method parameters;
1) Set REF n = 0.000 and VALUE n = 0.000.
n is the number of reference solutions.
2) Press [START] to confirm the changes.
...or...
Press [STOP] to cancel.
Non linear curves, and curves with intercept
In the method parameters;
1) Note the ordinate value and the concentration value of the
last point.
2) Replace the ordinate value and the concentration value of the
point to be deleted (REF n) with the values noted in step 1
above.
2) Reduce the value for # OF REFS by 1.
3) Press [START] to confirm the changes.
...or...
Press [STOP] to cancel.
B216T.20
Release
2.0
5-25
Enzyme Kinetics
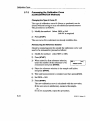
5.8
Enzyme Kinetics
Select an ENZYME method for enzyme kinetic measurements.
Note: Enzyme activity is strongly dependent on temperature.
Thus, the following should be taken into account:
— All measurements should be carried out at a constant temperature.
You can use the temperature sensor (Part Number B018-5227)
for monitoring the temperature.
— All solutions and essential instrument accessories, especially cells
and cell holders, should be thermostatted prior to use.
Procedure
1) Select the appropriate ENZYME method.
The following table lists typical ENZYME parameters in the
order (left to right) in which they appear.
See Section 10.1, page 10-1, for a detailed description of each parameter.
No.
17
14
20
22
24
10
7
16
19
26
28
32
35
37
Parameter
SLIT*
Value
2.0 nm
RESPONSE
0.5S
TIME UNIT
min
TOTAL TIME
LAG TIME
1.0 min
0.0 min
DIL. FACTOR
1.0
BLANK
0.0
BACKCORR
FIRST SAMPLE*
ORD.MAX
SCALE
YES
1
1.000 ABS
20 mm/min
PRINT DATA
ALL
AUTO METHOD
YES
Value
340.0 nm
No. Parameter
3 WAVELENGTH
15
9
21
11
12
6
14
25
27
29
34
36
LAMP
UV+Vis
CALCULATE
REGRESSION
INTERVAL
0.2 min
1.0
ENZ.FACTOR
DIVISOR
ENZ.UNITS
SAMPLES/BATCH
GRAPHICS PLOT
ORD.MIN
1.0
U/L
0
YES
0.000 ABS
GRID
POSTRUN KIN.
YES
YES
OPER. ID
SAMPLE ID
* Only available with Lambda 14 and Lambda 14P
2) Modify the method as required.
5-26
B2161.20 Release 2.0
Enzyme Kinetics
3) If necessary, determine the blank value of the reaction (see
page 5-28) and enter the value in the parameter BLANK.
4) Press [START] to start the measurement.
5) Depending on the display shown:
Change the displayed parameter values if
SAMPLE ID
required and press [START].
ENTER
>
...or...
Insert the cell containing a blank solution
(distilled water) and press [START].
n BACKCORR
PRESS START
...or...
Place solutions in the cell according to
the procedure and mix.
Place the cell in the sample cell holder.
Press [START] to start the measurement
or to continue the method.
n SAMPLE 1
PRESS START
Example of the Display Shown During the Measurement
xxx min
xxx nm
xxxnm:
xxx ABS
xxx min:
Wavelength.
Time.
xxx ABS
Measured value.
The display showrt when using a cell changer:
EN
x°C
xxx min
n
C:001
xxx ABS
EN:
x°C:
Type of method.
Temperature.
n:
Cell location.
Cycle number.
Interval time.
Measured value.
C:001:
xxx min:
xxx ABS
Printout
The results are printed out at the end of the analysis.
B2161.20
Release 2.0
5-27
Enzyme Kinetics
Determining the Blank Value
Determine the blank value of the reaction as follows:
1) Select the appropriate ENZYME method.
2) Set parameter BLANK = 0.0 in the method.
3) Carry out a measurement according to your procedure using a
cell filled with redistilled water in place of the sample.
4) Enter the result of the measurement in the parameter BLANK.
5-28
B2161.20 Release 2.0
B2161.20
Release
2.0
conCm
"
"
Substrate Kinetics
5.9
Substrate Kinetics
Select a SUBSTRATE KIN method for substrate kinetic
measurements.
Manual Procedure
1) Select the appropriate SUBSTRATE KIN method.
The following table lists typical SUBSTRATE KIN parameters in
the order (left to right) in which they appear.
See Section 10.1, page 10-1, fora detailed description of each parameter.
No.
17
14
20
22
11
12
6
18
25
27
29
34
36
Parameter
SLIT*
RESPONSE
Value
2.0 nm
0.5 s
TIME UNIT
min
END TIME
3.0 min
CONC FACTOR
1.0
DIVISOR
1.0
CONC UNIT
C
SAMPLES/BATCH
0
GRAPHICS PLOT
YES
ORD.MIN
0.000 ABS
GRID
YES
POSTRUN KIN
YES
OPER. ID
No.
3
15
23
21
10
7
16
19
26
28
32
35
37
Parameter
WAVELENGTH
Value
340.0 nm
LAMP
UV+Vis
DELAY TIME
0.0 min
0
CREEPING CYCLE
DIL.FACTOR
1.0
BLANK
0.0
YES
BACK CORR
1
FIRST SAMPLE #
ORD.MAX
1.000 ABS
21 mm/min
SCALE
PRINT DATA
ALL
AUTO METHOD
YES
SAMPLE ID
* Only available with Lambda 14 and Lambda 14P.
2) Modify the method as required.
3) If necessary, determine the blank value of the reaction (see
page 5-33) and enter the value in the parameter BLANK.
4) Press [START] to start the measurement.
5-30
B2161.20 Release 2.0
Substrate Kinetics
5) Depending on the display shown:
SAMPLE ID
Change the displayed parameter values if
required
and press [START].
ENTER
>
<
...or...
n BACKCORR
PRESS START
Insert the cell containing a blank solution
(distilled water) and press [START].
...or...
n SAMPLE 1
PRESS START
Place solutions (with the exception of
enzyme solution) in a cell and mix.
Place the cell in the sample cell holder
and press [START].
6) Allow equilibrium time (delay time) to
elapse.
Add the enzyme solution, mix
and press [START].
B2161.20
Release 2.0
DELAY TIME xxxnm
xxx MIN
xxxABS
-WAIT-
SAMPLE 1
PRESS START
5-31
Substrate Kinetics
Procedure with a Cell Changer
Analysis is performed analogous to manual operation, the
essential difference being that instead of one cell several can be
used for measurement in the one operation.
The procedure is as follows:
1. Once the equilibrium time has elapsed (prior to addition of
enzyme), the absorbance in each cell is measured automatically.
2. After adding enzyme, only location 1 is measured to follow
the course of the reaction.
3. Once the reaction is complete the absorbance in all the
remaining cells is measured.
Example of the Display Shown During the Measurement
SUBSTRATE xxx nm
xxx min
xxx ABS
SUBSTRATE:
Type of method.
xxxnm:
Wavelength.
xxx min:
xxx ABS:
Time.
Measured value.
The display shown when using a cell changer:
SUBST
xxx min
x°C
n
xxx ABS
SUBST:
x°C:
Type of method.
Temperature.
n:
Cell location.
Time.
Measured value.
xxx min:
xxx ABS:
Printout
The results are printed out at the end of the analysis.
5-32
B2181.20
Release 2.0
Substrate Kinetics
Determining the Blank Value
Determine the blank value of the reaction as follows:
1) Select the appropriate SUBSTRATE method.
2) Set parameter BLANK = 0.0 in the method.
3) Carry out a measurement according to your procedure using a
cell filled with redistilled water in place of the sample.
4) Enter the result of the measurement in the parameter BLANK.
B2161.20
Release 2.0
5-33
Postrun Kinetics
5.9. 1
Recalculation of Results with POSTRUN KIN
You can recalculate the results from ENZYME and SUBSTRATE
methods using the POSTRUN KIN parameter.
When you set the POSTRUN KIN parameter to YES the following
parameters in the corresponding method can be modified:
ENZYME method:
LAG TIME and TOTAL TIME
SUBSTRATE method: END TIME (manual operation only)
Note: Observe the following:
The time set for the LAG TIME must be smaller than the TOTAL TIME.
If a cell changer is being used, make sure that both LAG TIME and
TOTAL TIME are whole multiples of the INTERVAL time.
Proceed as follows to calculate the results:
1) Create a method with
POSTRUN KIN = YES.
e.g.
POSTRUN KIN YES
2) Carry out a measurement
{see Section 5.8 or 5.9).
At the end of the measurement
POSTRUN KIN appears on the display.
3) Press [START] to recalculate results.
START
LAG TIME
0.0 MIN
ENTER
>
<
...or...
If the results are not to be recalculated,
select NO using the arrow keys and
press [START].
ENTER
START
4) Enter new values as required for the
parameter displayed and press [ENTER].
5) Press [START] to continue.
5-34
B2161.20 Release 2.0
B2161.20 Release 2.0
5-35
Oligo Methods
5.10
Methods for Quantitative Analysis of
Oligonucleotides
Select an OLIGOQUANT 1 method for quantitative analysis of
oligonucleotides up to 50 bases long, and to calculate the
theoretical melting point.
Select an OLIGOQUANT 2 method for quantitative analysis of
oligonucleotides longer than 50 bases, and to calculate the
theoretical melting point.
You create an OLIGOQUANT method as follows:
1) Press [METHOD].
METHOD
0.000 ABS
500.0 nm
SELECT METHOD > <
2) Enter a method number nnn not
previously used.
3) Press [ENTER].
i
nnn
ENTER
•
The first method of the NEW METHOD
level appears.
NEWTIMEDRIVE
4) Use the arrow keys to select the required
<
method type (Oligoquant 1 or Oligoquant 2).
PARAM/->
•
i
NEW OLIGO1
PARAM/->
5) Press [PARAMETER], this confirms the
creation of the new method.
...or...
Press [STOP] to cancel.
PARAMETER
r
nnn OLIGOQUANT 1
< — >/PARAM/START
6) Modify the new method as required.
5-36
BS161.20 Release 2.0
Oligo Methods
Procedure
1) Select the appropriate OLIGOQUANT method (seepage 5-38).
2) If necessary, modify the method parameters.
3) Press [START] to start the measurement.
4) Depending on the display:
Change the displayed parameter values if
SAMPLE ID
required and press [START].
ENTER
>
... or...
Insert eell(s) containing a blank solution
and press [START].
BACK CORR
PRESS START
... or...
OLIGO n
SMPL 1
PRESS START
Insert a cell containing the sample
solution and press [START].
5) Continue to insert samples when asked until they have all
been measured.
Example of the Display Shown During the Measurement
OLIGO n
xxx nm
SMPL n
xxx nm:
Wavelength.
xxx ABS
xxx ABS
Measured value; ordinate as selected.
Printout
Graphics are printed out during the measurement process;
numerical data follow at the end of the analysis.
B2161.20
Release 2.0
5-37
Oligo Methods
Oligoquant Parameter Tables
The following table lists typical OLIGOQUANT 1 parameters in
the order (left to right) in which they appear.
See Section 10.1, page 10-1, for a detailed description of each parameter.
No. Parameter
17 SLIT*
2
# WAVELENGTHS
11 FACTOR 1
60 SEQUENCE LENGTH
61 SEQ
76 TM CALCULATION
15 LAMP
18 SAMPLES/BATCH
21 CYCLES
25 GRAPHICS/PLOT
35 AUTO METHOD
37 SAMPLE ID
Value
2.0 nm+
1+
1.0
20
2
NO
UV+Vis
0
1
NO1"
NO
Value
No. Parameter
ABS t
1 ORDINATE MODE
WAV. 1
260.0 nm f
3
1.0 cm
59 PATH LENGTH
61
65
14
16
19
22
32
SEQ.
36
OPER. ID
1
CHNGE CONSTANTS
NO
RESPONSE
1s
BACK CORR
FIRST SAMPLE #
NO
1
CYCLE TIME
0.01 min
PRINT DATA
YES
* Only available with Lambda 14 and Lambda 14R
~\Do not change the value for this parameter.
Once the OLIGOQUANT 1 method is created, the method
parameters can be edited.
The base sequence must be entered from base 5' to 3'.
Use the numeric keys according to the table below to enter
the base sequence.
Base
Description
Key
N
A
C
G
Any base
Adenine
Cytosine
Guanine
Thymine
8
7
4
1
0
T
5-38
B2161.20 Release 2.0
Oligo Methods
The following table lists typical OLIGOQUANT 2 parameters in
the order (left to right) in which they appear.
See Section 10.1, page 10-1, for a detailed description of each parameter.
No.
17
2
11
60
60
60
76
15
18
21
25
35
37
Parameter
SLIT*
# WAVELENGTH
FACTOR 1
NUMBER OFdA
NUMBER OFdG
NUMBER OF N
TM CALCULATION
LAMP
SAMPLES/BATCH
CYCLES
GRAPHICS PLOT
AUTO METHOD
SAMPLE ID
Value
2.0 nm
1*
1.0
0
0
0
NO
UV+Vis
0
1
NO
NO
No.
1
3
59
60
60
65
14
16
19
22
32
36
Parameter
Value
ORDINATE MODE
ABS1'
WAV. 1
£>60.0 nm1'
PATHLENGTH
1.0 cm
0
NUMBER OF dC
NUMBER OF dT
0
CHNGE CONSTANTS
NO
RESPONSE
0.5 S
BACK CORR
YES
FIRST SAMPLE #
1
CYCLE TIME
0.1 min
YES
PRINT DATA
OPER. ID
* Only available with Lambda 14 and Lambda 14P.
t Do not change the value for this parameter.
B2161.20 Release 2.0
5-39
Date/Time
5.11
Date/Time
1) Select the DATE/TIME method (900).
900 DATE/TIME
< — >/PARAM/START
f
2)
Press [PARAMETER].
PARAMETER
MODIFY METHOD
PARAM/->
i
3)
Press [PARAMETER] again.
PARAMETER
CLOCK
4) Use the arrow keys to select the
realtime or the internal clock.
I
CLOCK
5)
Press [PARAMETER] again.
INTERNAL
REALTIME
PARAMETER
DAY
MONDAY
DAY
FRIDAY
6) Use the arrow keys to select the day.
7)
5-40
Press [PARAMETER] again.
PARAMETER
B2161.20 Release 2.0
Date/Time
8)
9)
Type in the date using the numeric keys;
year, month day. e.g. 940429.
DATE
ENTER
Press [ENTER] to confirm the entry.
10) Press [PARAMETER] again.
11) Type in the time using the numeric
keys; hours, minutes, e.g. 1430.
12) Press [START] to activate the clock.
000000
ENTER
PARAMETER
0000
TIME
ENTER
START
...or...
Press [STOP] to cancel.
The realtime clock need only be set once, and has the following
functions: day (Monday, Tuesday, etc.), date (yymmdd) and time
(hhmm), and continues working when the instrument is switched off.
The internal clock is limited to the following functions: date (yymmdd)
and time (hhmm), and counts from the time the spectrometer is
switched on.
The internal clock must be reset to actual time after each switch on.
B2161.20 Release 2.0
5-41
Wakeup
5.12
Wakeup
You can use WAKEUP to set the spectrometer to switch on the
lamps to warm up before the start of the working day.
1) Select the WAKEUP method (901).
901 WAKEUP
< — >/PARAM/START
2) Press [PARAMETER].
PARAMETER
MODIFY METHOD
PARAM/->
t
3) Press [PARAMETER] again.
4) Type in the 'wakeup' date using the
numeric keys; year, month, day.
e.g. 940429.
PARAMETER
DATE
000000
ENTER
>
t
5) Press [ENTER] to confirm the entry.
6) Press [PARAMETER] again.
7) Type in the 'wakeup' time using the
numeric keys; hours, minutes, e.g. 0655.
<
ENTER
PARAMETER
TIME
0000
ENTER
>
8) Press [ENTER] to confirm the entry.
ENTER
9) Press [START] to activate the wakeup.
START
<
When this method is activated the lamps are switched off and are then
switched on again at the preselected WAKEUP time.
To exit the WAKEUP method press [STOP] and the display returns to
standby. Both lamps go on.
5-42
B2161.20 Release 2.0
Self Test
5.13
Self Test
The spectrometer tests the signals from the optics electronically,
and prints a report at the end of the test. We recommend you do
this test after installing a new lamp.
1) Select the SELF TEST method (999).
999 SELF TEST
<-->/START
2) Press [START] to activate the self test.
START
... or...
Press [STOP] to cancel.
If there are any FAIL results in the self test report then repeat the
test.
If you have any further enquiries contact your Perkin-Elmer
office.
B2161.20 Release 2.0
5-43
5-44
B21B1.20 Release 2.0
Operating with Accessories
6
Operating with Accessories
6.1
6
General
Accessories are components, or instruments, that are installed or
connected in the sample compartment, or otherwise connected to
the spectrometer. For some of these accessories parameters have
to be taken into account in the methods.
The accessories described below have parameters in the various
methods.
6.2
Accessories
*,
Samples can be applied either manually or with the help of a
number of accessories.
The following accessories are currently available:
Changers
SCell Changer
6Cell Changer
8Cell Changer
9Cell Changer
13Cell Changer
Sippers:
Vacuum Sipper or Peristaltic Sipper
Autosamplers: AS-90/91
B2767.20 fie/ease 2.0
6-1
Operation with Accessories
6.3
Requirements for Operation with Accessories
The following preconditions must be fulfilled in order to operate
with accessories:
• The accessory board and connector panel for the accessory in
question must be installed in the spectrometer.
The various circuit boards and connector panels are described in the
"Installation, Maintenance and System Description" handbook.
• The accessory in use must be properly selected in the
appropriate method.
6.4
Using Methods with Accessories
When an accessory board is installed, an additional parameter,
ACCESSORY, appears in the method.
• When the ACCESSORY parameter appears, select the
appropriate accessory type (see Section 10.1, page 10-1).
Note: The method can still be used even if the accessory in question
is not connected; the spectrometer simulates operation with the
accessory.
However, with cell changers only one sample can be measured.
6-2
B2161.20 Release 2.0
Spectrometer without Accessory Board
6.4.1
Spectrometer without Accessory Board
Spectrometers without an accessory board cannot be operated
with accessories, but the method parameters for accessories can
be selected. The methods can be stored and used on
spectrometers with the necessary equipment.
The procedure for setting up a method for an accessory although
an accessory board is not installed is as follows:
1) Switch on the spectrometer in Super User mode
(see Appendix 1).
2) Select the CONFIGURATION branch.
3) Select method 7 ACCESSORY CONFIG.
4) Modify the method by selecting ACCESSORY = YES.
5) Press [START] to store the changes and to activate the
accessory mode.
6) To deactivate the Super User mode, switch off the
spectrometer.
7) Wait about two minutes to allow the lamps to cool down.
8) Switch on the spectrometer.
9) Set up the method as required.
B2161.20 Release 2.0
6-3
Running Methods with an Accessory
6.5
Running Methods with an Accessory
When using methods with accessories, the spectrometer
automatically presents the necessary actions, e.g.:
BACK CORR IN CELL1
PRESS START
SAMPLES IN 9-CELL
PRESS START
BACK CORR SIPPER
ACCESSORY START
SAMPLE 1
SIPPER
ACCESSORY START
6-4
Insert blank at location 1 of the cell
changer, and then press [START].
Insert samples in the cell changer, and then
press [START].
Press [START] on the Sipper (background
correction).
i
Press [START] on the Sipper (sample
measurement).
B2161.20 Release 2.0
Background Correction with Cell Changers
6.6
Background Correction with Cell Changers
The locations used for sample measurement depend on the
tagging and option chosen for the BACK CORR parameter.
Not all locations can be used for sample measurement,
see Table 6-1:
Table 6-1 BACK CORR Tagging
Procedure
Locations
Blank solution
Sample solution
BACK CORR=YES
BACKCORR=NO
62767.20 Release 2.0
BACK CORR tagging
FIX / CALL
START
Insert solutions
When selecting a backaccording to
ground correction:
display.
- First insert all solutions
- Then select YES or
NO and press
[START].
BATCH
If no background
correction is selected,
BACK CORR is only
selectable in the
appropriate method!
Thus, on demand to
insert the sample:
- First insert all solutions
- Then start the first
measurement.
1
1
1
1 ... n
1 ... n.
2... n
2... n
2... n
1 ... n
6-5
CONCENTRATION Methods with Cell Changers
6.7
CONCENTRATION Methods with Cell Changers
Please note the following when using CONCENTRATION methods:
• When BACK CORR = YES has been selected, background
correction is carried out once the method has been started,
independent of whether the parameter has been tagged or
not.
• Insert the reference solutions in sequence
when asked. Always start at location 1.
e.g.
REFS IN CELL 1 - 5
PRESS START
6-6
82161.20
Release 2.0
Accessory Parameters
6.8
Parameter
Accessory Parameters
Description
General
ACCESSORY
Select the accessory.
MANUAL:
operation with standard cell holder,
no accessories
CELL:
for cell changers e.g.
SCell Changer
6Cell Changer
8Cell Changer
9Cell Changer
13Cell Changer
SIPPER:
for Vacuum Sipper or Peristaltic Sipper
AS-90/91: for autosamplers AS-90 and AS-91
Note: Sipper operation is not possible when using SUBSTRATE methods.
If ENZYME methods are used, neither Sipper nor Autosampler can be used.
Cell changer (5cell, 6ce//, 8cell, 9cell)
CELL 1 -n
B2161.20 Release 2.0
The locations at which measurements are to take place.
Enter the number of the locations and press [ENTER].
If e.g. measurement is to be carried out at locations 2 and 5 only,
enter 25.
If BACK CORR = YES has been selected, location 1 is used for
background correction, independent of the locations selected as
described above.
Thus:
If BACK CORR = YES has been selected, place the blank at location 1
and the sample solutions from location 2.
If BACK CORR = NO has been selected, all locations can be used for
sample measurement.
6-7
Accessory Parameters
Parameter
Description
Cell changer (13Cell Changer)
CELL 1-7
The locations at which measurements are to take place.
CELL 8-13
When CELL 1 -7 shows, the numbers 1 to 7 represent sample locations
1 to 7.
When CELL 8-13 shows, the numbers 1 to 6 represent sample
locations 8 to 13.
If none of the locations is to be used, enter 0.
Press [ENTER] to confirm the location numbers.
If e.g. measurement is to be carried out at locations 2 and 5 only,
enter 25 and then press [ENTER] (CELL 1 -7), and enter 0 and then
press [ENTER] (CELL 8-13).
If BACK CORR = YES has been selected, location 1 is used for
background correction measurement, independent of the locations
selected as described above.
Thus:
If BACK CORR = YES has been selected, place the blank solution at
location 1 and the sample solutions from location 2.
If BACK CORR = NO has been selected, all locations can be used for
sample measurement.
Example 1:
CELL 1-7
Measurement will take place at
= 246
CELL 8-13 = 0
locations 2,4 and 6; the rest will not
be used.
Example 2:
CELL 1-7
= 567
Measurement will take place at
CELL 8-13 = 123456 locations 5 to 13.
STIRRER
6-8
Switches the magnetic stirrer on and off.
Option: YES NO
Select with arrow key.
If the magnetic stirrer has been switched on, place a small magnetic
stirring bar in each of the cells.
The arrangement is such that whilst measurement is taking place in
the one cell the following cell will be stirred.
B2161.20
Release 2.0
Accessory Parameters
Parameter
Description
SAMPLING TIME
Sample aspiration time in seconds for the sipper.
Range: 0.1 to 99.9
Enter value and confirm by pressing [ENTER].
DELAY TIME
Delay between the end of the aspiration process and the start of the
measurement.
Range: 0.0 to 99.9
Enter value and confirm by pressing [ENTER].
AUTO PURGE
Switches the autopurge function on and off.
Option: YES
RETURN
(Peristaltic Sipper
only)
NO
Select with arrow keys.
""*
Pump in reverse direction after sample measurement.
Option: YES NO
Select with arrow keys.
OPTIMIZATION
To optimize the RETURN function.
(Peristaltic Sipper
only)
Option: YES
REV. TIME
(Peristaltic Sipper
only)
To enter the reversed flow time for the optimization.
SIPPERS
AS-90/91 +
SIPPER
82761.20
Re/ease 2.0
NO
Select with arrow keys.
Range: 0.0 to 99.9
Enter value and confirm by pressing [ENTER].
Parameters for control of the sipper must be entered via the sipper
(see sippers user documentation).
Parameters and operation with the AS-90/91 are described in the
AS-90/91 user documentation.
6-9
B21B1.20 Release 2.0
Care
7
7
Care
W01.02
Unauthorized Adjustments and Servicing
Do not attempt to make adjustments, replacements or repairs to this
instrument except as described in the accompanying User
WARNING
Documentation.
Only a Perkin-Elmer service representative or similarly trained and
authorized person should be permitted to service the instrument.
7.1
Daily Care
• Do not leave samples, particularly those given to fuming or
evaporation, in the sample compartment for longer than
necessary.
• If any type of sample handling system is installed and portions
of it are left in the sample compartment (such as a sipper and
flowcell), make certain that the system is cleaned at the end
of the working day.
Generally, such systems should be filled with deionized water
when left overnight.
• Immediately clean all spilled materials from the affected area
and wipe it dry with lintless paper or cloth.
If you have to wipe sample compartment windows, make sure
you do not introduce scratches. Sample windows are optical
components and you should handle them in the same way as
high quality cells.
B2161.20
Release 2.0
7-1
Use and Care of Cells
A
Take care not to spill liquids onto the spectrometer.
Expensive damage can result to the optics or electronics If liquids
are spilled and run inside the instrument or onto the keyboard.
CAUTION
7.2
7.2.1
Use and Care of Cells
Cell Handling
• Only hold cells by non-optical surfaces, such as the matt finish
surfaces.
• Always wipe the optical surfaces of cells dry and free of
fingermarks, using a soft lint free cloth or cleaning tissue, just
before placing them in the cell holder.
• Protect cells from scratches, and never permit them to rub
against one another or against other hard surfaces.
• Avoid abrasive, corrosive or stain-producing cleaning agents,
and make sure that the exposed surfaces of cells are optically
clean.
• When measuring cold solutions, always bear in mind that
condensation can form on the optical surfaces.
• Make sure no bubbles cling to the inner surfaces of the cell,
particularly when handling cold solutions.
• For maximum precision and accuracy, calibrate and test with
cells of the same type, and always insert cells into the holders
with the same orientation.
7-2
B2161.20 Release 2.0
Use and Care of Cells
7.2.2
Pressure Buildup in Cells
• Only fill the cell so full that the liquid meniscus is just above
the radiation beam. The remaining air space in the cell is then
adequate to compensate for any slight increase in pressure in
the cell during routine operation.
• If, for analytical reasons, it is necessary to fill the cell
completely, insert the stopper only lightly so that the liquid in
the cell has a chance to expand.
• Do not insert a stopper forcefully into a completely filled cell
since this is likely to cause the cell to burst.
• When working at higher temperatures, use a drilled stopper
(0.4 mm hole) to allow for expansion in the cell.
7.3
Sample Compartment Windows
• Generally, the windows should be installed at all times.
• The windows are optical components and require the same
care and handling as cells.
• You can remove the windows to clean them, they are held in
place by a magnetic frame.
Windows are most suitably cleaned by wiping them with a soft
lint free cloth moistened with ethanol.
B2161.20 Release 2.0
7-3
7-4
B2161.20 Release 2.0
Analytical Notes
8
Analytical Notes
8.1
8
Background Correction
The type of background correction depends on the method type
selected.
In methods with a fixed wavelength e.g. TIME DRIVE, WAVELENGTH
PROGRAM, CONCENTRATION 1 the displayed measurement value
for absorbance is set to 0, for transmission to 100%, at the
measurement wavelength (this is called an autozero).
You can use the [BACK CORR] key to perform a manual autozero
in fixed wavelength methods (see Section 3.3, page 3-3).
In methods with measurement over a wavelength range
e.g. SCAN, CONCENTRATION 2 a background correction is
performed over the selected wavelength range.
A background correction can only be performed in a method.
The ordinate mode of the last used method always appears on the display.
To change from absorbance to transmittance or vice versa, select a
TIME DRIVE method, and then select the desired ordinate mode.
A background correction, or autozero, must be performed:
• at the start of a new method,
• when the wavelength is changed,
• when the wavelength range is extended,
• each time the solvent is changed.
To perform a background correction, or autozero, place cells with
a blank solution (or reference solution) in the sample cell holder
and reference cell holder.
B2161.20 Release 2.0
8-1
Unusual Samples
8.2
Unusual Samples
If a sample is chemically stable and undergoes no physical or
chemical change other than to absorb incident radiation, errors in
photometric values should not be caused by the sample. Many
samples are not this stable, and special consideration must be
given to them.
1. Volatile Samples
Some liquid samples are so volatile that their concentration can
change while recording is in progress. If this occurs, the resulting
data will lack reproducibility.
If you are analyzing volatile samples, use stoppered cells to
prevent this problem.
2. Samples not Governed by the Beer-Lambert Law
Quantitative analyses utilizing the absorption of spectral radiation are based on the Beer-Lambert law which states that the
absorption is proportional to the concentration of the analyte.
The law can be expressed in the form
A =ecd
where
A
e
c
d
is absorbance
is molar absorption coefficient
is molar concentration
is thickness through which the radiation is transmitted
This law is mostly true for dilute solutions, but at higher concentrations a plot of absorbance against concentration will be nonlinear for a number of reasons.
The absorption characteristics of a sample can be changed during
sample preparation, depending on the amount of reagent added
for color development and so on. For details, refer to reference
books covering these subjects.
8-2
B2iei.2O
Release 2.0
Unusual Samples
Temperature has an influence to a greater or lesser degree on the
absorption characteristics of a sample. You should check this
effect if non-repeatable results are obtained.
If you are measuring temperature-dependent samples, either wait
until temperature equilibrium has been attained or use a thermostatted cell or cell holder.
3. Chemically Reactive Samples
If a reaction takes place in the cell between the sample material
and the solvent, spectral data based on that sample cannot always
be expected to have sufficient reliability or repeatability.
For samples of this type, use a quantitative method that takes
advantage of the change in transmittance with time at a fixed
wavelength.
For details, refer to reference books covering this specific subject.
4. Photoactive Samples
Some samples are known to be photoactive in that they fluoresce
upon absorbing radiation. Since a small portion of the fluorescent
radiation will be measured by the detector, a higher apparent
transmittance will often result.
Samples are also known that undergo photochemical reactions as
they absorb radiation. With such samples, which are mostly biochemical, lack of reproducibility will characterize the resultant
data.
5. Other Sample Properties
Samples that are polarizing in nature, or have a double index of
refraction, are often difficult to measure accurately. The emerging monochromatic radiation is slightly polarized due to having
been refracted.
Thin-film samples also pose a problem since optical interferences
may develop, causing a regular interference pattern to be superimposed on the spectral curve.
B2161.20 Release 2.0
8-3
Solvent Properties
8.3
Solvent Properties
The solvent should meet the following requirements:
• It should dissolve the sample without reacting with it.
• The radiation absorption in the scanning region should be
low. High absorption by the blank reduces the reference
energy, thus increasing noise.
• Evaporation should be fairly low at ambient temperature.
In general, aromatic compounds exhibit high absorption in the
UV region and hence are not suitable as solvents for measurements in this region.
Water is virtually the only useful solvent below 195 nm, but it
must be freed from oxygen to attain best transmission.
Whenever you are going to use a solvent with unknown absorption characteristics, scan its spectrum first to determine whether
it is suitable.
The lower wavelength limits of a number of commonly used solvents are presented in the following table.
The lower limit has been defined as that wavelength at which
10 mm of pure solvent has a transmission of 10 %.
8-4
B2161.20 Release 2.0
Solvent Properties
Table 8-1
Lower Wavelength Limits of Solvents
Tetrachloroethylene
i
m-Xylene
i
Toluene c
N,N-Dimethylformamide
I
I
Ethyl Propionate
i
i•
Tetrachloride c=
I
I
Ethyl Formate =
•i
Butyl Acetate
i
i
Ethyl Acetate
Methyl Formate
I
Chloroform
1,2-Dichloroethane
I
i
Diohloromethane
I
Glycerol
Dioxan
t?-**')^?!'-*''!'!'!'!
1
H
•'''''•'"'•'''•'V''"*?'n'i t'l'iffi-'''-
I
Hexane
I
i-Octane MHSM
I
2,2,4-Trimethylpentane
I
Acetonitrile
i
Cyclohexane
I
Methanol
I
Ethanol
Methylcyclohexane
I
i-Propanol
Water
190
B2161.20 Release 2.0
210
230
250
270
nm
290
310
330
350
370
8-5
Q.Q
B2161.20 Release 2.0
Error Messages
9
9
Error Messages
If an error occurs during the operation of the spectrometer, an
error message is shown on the display or is printed out (if a
printer is connected).
9.7
Error Messages Shown on the Display
Errors remain displayed until they are deleted. To delete, press
[PARAMETER].
Error
Meaning
RANGE ERROR:
xxxx.x - xxxx.x
The value entered is outside the displayed range.
Press [PARAMETER] and enter a value within the range
shown.
PARAMETER XX:
DOES NOT EXIST
The parameter XX does is not exist.
Press [PARAMETER] to continue.
PARAMETER XX:
NOT USED
The parameter XX is not used, or is not active in this
method.
Press [PARAMETER] to continue.
HINT:
INT.GREATER TOT.TIM
The Interval time is greater than the total time.
This message appears with kinetic measurements.
Select a shorter interval time.
HINT:
SELECT INTERVAL TIME
Appears with enzyme methods with cell changers, if the
interval time does not correlate with the measurement
time.
Select the INTERVAL time so that the TOTAL TIME can be
divided by the INTERVAL time evenly.
B2161.20
Release 2.0
9-1
Error Messages
Error
Meaning
PROBLEM:
MARK NOT SET
COPY FROM MARK was selected without first initiating
MARK FOR COPY.
First use MARK FOR COPY and then select COPY FROM
MARK,
9-2
PROBLEM:
METHOD NOT FOUND
A method has been tagged MARK FOR COPY although
the method in question is no longer available.
PROBLEM:
ACCESSORY NOT
INITIALIZED
This error is shown when the instrument gets no
response from an attached accessory during startup.
Check that the accessory is:
- correctly connected
- switched on
- functioning normally
PROBLEM:
METHOD NO. LIMITS 1-999
The method number entered is outside the displayed
range.
Enter a number within the range 1 to 999.
ERROR: LAST METHOD
An attempt was made to delete all methods.
Retain at least one method in the memory otherwise
the spectrometer cannot work.
PROBLEM:
METHOD PROTECTED
An attempt was made to select a fully protected
method.
The protection has to be modified if the method is to
be used.
DON'T PROTECT ALL
METHODS
An attempt was made to ALL protect all the methods.
Retain at least one method otherwise the spectrometer
cannot work.
DON'T PROTECT ALL
BRANCHES
An attempt was made to ALL protect all branches.
Retain at least one branch otherwise the spectrometer
cannot work.
PROBLEM:
BRANCH WRITE PROTECT
An attempt was made to modify methods in a
write-protected branch.
To modify the method, alter the branch protection.
B2161.20
Release 2.0
Error Messages
Error
Meaning
PROBLEM:
DIRECTORY FULL
An attempt was made to store more than 200 methods.
To create space for the new method, delete a method
that is no longer required.
PROBLEM:
MEMORY FULL
The available memory is insufficient to cope with the
new method.
To create space for the new method, delete a method
that is no longer required.
ERROR:
NO ENERGY
This error is shown when not enough energy is detected.
ERROR:
NO ENERGY, UV LAMP
This error is shown when not enough energy is received
from the UV lamp.
Possible causes:
- Beam is blocked in the sample compartment
- Loose lamp connection
- Lamp burnt out
- Lamp(s) switched off
- Defective detector
Possible causes:
- Beam is blocked in the sample compartment
- UV lamp loose connection
- UV lamp burnt out
- UV lamp switched off
- Defective detector
PROBLEM:
NO ENERGY, VIS LAMP
This error is shown when not enough energy is received
from the Vis lamp.
Possible causes:
- Beam is blocked in the sample compartment
- Vis lamp loose connection
- Vis lamp burnt out
- Vis lamp switched off
- Defective detector
B2161.ZQ
Release 2.0
9-3
Error Messages
Error
Meaning
PROBLEM:
SYSTEM ERROR
This error is shown when the instrument operating
software "crashes".
A full reset is then automatically carried out.
After the instrument is reset one of the following
messages is shown on the second line of the display:
BATTERY LOW
TIMER FAIL
RS232-IRQ FAIL
TIMER-IRQ FAIL
Make a note of this message.
Press [PARAMETER] to continue.
If you cannot continue call your Perkin-Elmer office
and inform them of the error message.
Note: After a full reset all methods are erased.
SPECTROMETER
FULL RESET DONE
This error is shown after changing the instrument
software, or after a full reset, or when the spectrometer
data is defect.
Make a note of the steps you made leading up to this
message.
Press [PARAMETER] to continue.
If you cannot continue call your Perkin-Elmer office
and inform them of the error message and the steps you
made leading up to the error.
Note: After a full reset all methods are erased.
DIALOG,
FULL RESET DONE
This error is shown after changing the instrument
software, or after a full reset, or when the method
memory is defect.
Make a note of the steps you made leading up to this
message.
Press [PARAMETER] to continue.
If you cannot continue call your Perkin-Elmer office
and inform them of the error and the steps you made
leading up to the error.
Note: After a full reset all methods are erased.
9-4
B2161.20 Release 2.0
Error Messages
Error
Meaning
SPECTROMETER + DIALOG
FULL RESET DONE
This error is shown after changing the instrument
software, or after a full reset.
Make a note of the steps you made leading up to this
message.
Press [PARAMETER] to continue.
If you cannot continue call your Perkin-Elmer office
and inform them of the error and the steps you made
leading up to the error.
Note: After a full reset all methods are erased.
BUS ERROR + a message
This error, plus a message, is shown when the
instrument has an address error.
Make a note of this message and the steps you made
leading up to the error.
Press [PARAMETER] to continue.
If you cannot continue call your Perkin-Elmer office
and inform them of the error, the error message and
the steps you made leading up to the error.
Note: After a full reset all methods are erased.
B21B1.20 Release 2.0
9-5
Error Messages
9.2
Error Reports on the Printer
Error
Meaning
Baseline correction data do not fit.
The background correction last carried out did not
correlate to the method used.
Start baseline correction.
Carry out a new background correction with the
proper method.
Cannot approximate calibration curve.
Check references or change curve fit
algorithm.
Cannot calculate delta absorbance.
Because too few points read.
Cannot calculate slope.
Because too few. points read.
End time out of limits.
Change end time.
The calibration data deviate strongly from the
curve form selected or not enough points were
measured for the curve form selected.
Check the references, select another curve form or
carry out more measurements.
A kinetic method was interrupted with [STOP].
Too few points available to calculate delta absorbance.
A kinetic method was interrupted with [STOP].
Too few points available to calculate the slope.
In recalculation, an out of limits value for
END TIME was entered.
Enter a lower END TIME value and repeat the
procedure.
Lag or total time is not divisible by
interval time (0.0).
In recalculation, the LAG TIME or TOTAL TIME
entered was not divisible by the INTERVAL time.
Enter a value for LAG TIME or TOTAL TIME that is
fully divisible by the INTERVAL time.
Lag or total time out of limits.
Change lag and/or total time.
In recalculation, a greater value for LAG TIME or
TOTAL TIME was entered than the actual measuring
time.
Enter a lower value for LAG TIME or TOTAL TIME.
Lag time greater than total time.
Change lag time?
9-6
In recalculation, a value for LAG TIME was entered
that was greater than the measuring time.
Enter a LAG TIME less than the TOTAL TIME.
B2161.20 Release 2.0
Error Messages
Error
Meaning
More than one peak within wavelength
limits.
More than one peak identified within the selected
measuring range.
Change threshold or measurement
wavelengths.
Change WAV. MIN and WAV. MAX or THRESHOLD so
that only one peak is detected.
No peak detected.
The THRESHOLD is too high to detect peaks.
Change threshold.
Select a lower value for THRESHOLD.
No points stored.
The method was interrupted with [STOP] before
data could be stored, e.g. during the equilibrium
time of a substrate method.
Restart the method.
Start measurement.
Two solutions for 1 ABS value.
Change curve fit algorithm.
Value not within valid limits.
Check references or change curve fit
algorithm.
Wavelength data do not fit.
Start background correction.
B2161.20
Release 2.0
In a non-linear calibration curve two reference
solutions exhibit the same absorbance value.
Check the references, or change the concentration
range, or change the curve fit algorithm.
The measured sample concentration is outside the
calibration range.
Measure additional calibration solutions within
the concentration range or change the curve fit
algorithm.
Appears with TIME DRIVE methods if the wavelength has been modified since the last background correction.
Perform a new background correction using the
proper method.
9-7
9-8
B2161.20 Release 2.0
Parameter Numbers
and Descriptions
10
Parameter Numbers
and Descriptions
10.1
Parameter
10
Parameter Numbers and Descriptions
No. Description
# OF REFS
2
Number of reference solutions used for the calibration.
Range: 1 to 20
# WAVELENGTHS
2
Number of wavelengths at which measurements are made.
Range: 0 to 20
If ordinate modes RAT and DIF are used, the number must be
divisible by 2.
If ordinate mode COR is used, the number must be divisible by 3.
See also parameter Ordinate Mode.
ACCESSORY
38
Lets the spectrometer recognize the accessory type connected.
MANUAL is for operations without using an accessory, or for
manual cell changers.
CELL
is for a cell changer.
SIPPER
is for a sipper.
AS-90/91 is for the AS-90/91 autosampler.
Note: This parameter only shows when an accessory board is installed in the
spectrometer.
Sipper operation is not possible when using SUBSTRATE methods.
If ENZYME methods are used, neither sipper nor autosampler can be used.
AUTO METHOD
35
Prints method parameters prior to each method start.
Option: YES NO
AUTO PURGE
48
Switches the autopurge function on and off.
Option: YES
62761.20
Release 2.0
NO
10-1
Parameters
Parameter
BACKCORR
No. Description
16 Background correction.
Option:
YES
NO
Without tagging, background correction should be carried out
at the start of the method.
If tagging has been carried out, background correction is
offered:
- At the start of the method (CALL tagging)
- Prior to each sample batch (BATCH tagging)
- Prior to each sample (START tagging)
Time Drive, Wavelength Prog.
Background correction is carried out at every wavelength,
i.e. the basic signal is set to zero.
Scan.
Background correction is carried out within the range
WAV. MAX and WAV. MIN, i.e. the baseline is set to zero.
Concentration 1, Concentration 2,
If BACK CORR = YES has been selected, background correction
must be carried out prior to measurement of the first reference
solution.
Background correction should be carried out at wavelengths
WAVELENGTH 1 -3, i.e. the baseline signal is set to zero at these
points.
Substrate, Enzyme.
Background correction is carried out at the wavelength
selected.
10-2
B2161.20 Release 2.0
Parameters
Parameter
BLANK
No. Description
7
Blank value.
Enzyme.
Blank value (units as selected for ENZ UNIT).
Range: 0.00001 to 9999.9
The enzyme activity is calculated as follows:
Substrate.
Blank value (units as selected for CONC UNIT).
Range: -9999.9 to 9999.9
The substrate concentration is calculated as follows:
c Sub = C ibtal ~ c Blank
CALC. WAV 1
5
Wavelength in nm (used in CONCENTRATION 2 methods for
calculations using the 2nd order derivative only).
Range: 190.0 to 1100.0, in steps of 0.1
The values must lie within the WAV. MAX and WAV. MIN values
set.
Enter the value at peak maximum for GALC. WAV 1, seepage 5-20.
In MODE = DERIV 2 FIX, the height of the derivative curve is
measured at these wavelengths.
In MODE = DERIV 2 PEAK, a derivative maximum or minimum is
located around these wavelengths and the nearest one
evaluated (see also parameter MODE).
CALC. WAV 2
5
Wavelength in nm (used in CONCENTRATION 2 methods for
calculations using the 2nd order derivative only).
Range: 190.0 to 1100.0, in steps of 0.1
The values must lie within the WAV. MAX and WAV. MIN values
set.
Enter the value at peak minimum for CALC. WAV 2, seepage 5-20.
In MODE = DERIV 2 FIX, the height of the derivative curve is
measured at these wavelengths.
In MODE = DERIV 2 PEAK, a derivative maximum or minimum is
located around these wavelengths and the nearest one
evaluated (see also parameter MODE).
B2161.20
Release 2.0
10-3
Parameters
Parameter
CALCULATE
No. Description
9
Slope calculation mode:
REGRESSION: The slope is calculated using all data points by
means of linear regression.
INTERVAL: The slope is calculated for each interval. The mean
of all the slopes is then used for the calculation of enzyme
activity.
Note: When using CALCULATE = INTERVAL, please bear in mindInstead of the parameter LAG TIME, parameter DELAY TIME (equilibration
time) appears.
Measurement begins only when the DELAY TIME has elapsed.
The TOTAL TIME must be a whole multiple of the INTERVAL time.
CALCULATE=REGRESSION
TIME
Start of the Method
10-4
Start of Measurement
(3)
Start of Calculation
B21B1.20 Release 2.0
Parameters
Parameter
No. Description
CELL 5
39
To enter the location of the cell, or cells, to be measured in the
Scell changer.
CELL 6
40
To enter the location of the cell, or cells, to be measured in the
6cell changer.
CELL 8
43 To enter the location of the cell, or cells, to be measured in the
8cell changer.
CELL 9
44
CELL 1-7
41
CELL 8-13
CHNG CONST
To enter the location of the cell, or cells, to be measured in the
9cell changer.
To enter the location (1 to 7) of the cell, or cells, to be
measured in the 13cell changer.
Example:
Cell 1-7 = 2 4 6
Measurement will take place at
Cell 8-13 = 0
locations 2, 4 and 6; the rest will not
be used.
42 To enter the location (8 to 13) of the cell, or cells, to be
measured in the 13cell changer.
Example:
Cell 1-7 = 5 6 7
Measurement will take place at
Cell 8-13 = 1 2 3 4 5 6 locations 5 to 13.
65 To change the molecular mass and molar absorption coefficient
values of oligonucleotide bases.
Option: YES
NO
Shows only when TM (theoretical melting point) is YES.
Refer to the Biochemical Application manual.
B2161.20
Release 2.0
10-5
Parameters
Parameter
CONC FACTOR
No. Description
11
Concentration factor.
Range: 0-00001 to 9999.9
Note: The concentration factor is calculated as follows:
Concentration Factor
d
V X M
X v x 1000
where:
Vis the volume of the total solution in the cell in mL
M is the molar mass of the substrate in glmol
d is the pathlength in cm
v is the volume of sample in mL
1000 is the conversion factor for volume units in liters
Depending on the procedure used, the molar absorption coefficient may
need to be taken into account.
CONC UNIT
6
Concentration Unit, defines the concentration unit used for
the analysis.
C
is any concentration unit.
g/L
is gram per liter.
mg/L is milligram per liter.
mg/mL is milligram per milliliter.
mg/dL is milligram per deciliter.
ng
is microgram.
ng/mL is microgram per milliliter.
mol
is mole,
mmol is millimole.
nmol isnanomole.
pmol is picomole.
ppm
is parts per million (mg/kg).
ppb
is parts per billion (fig/kg).
%
is percent.
A1% is the absorbance of a solution containing 1 g substance
in 100 mL of solution, in a cell of 1 cm pathlength.
APHA is color number.
The units may appear in all capitals on the display.
10-6
B2161.20 Release 2.0
Parameters
Parameter
No. Description
CREEP CYCLE
21
CREEP TIME
24
Number of cycles after the reaction end time.
Range: 0 (no further measurements after end point)
2 to 99
This parameter is used to compensate for creeping reactions:
The spectrometer calculates the slope for each interval. If it
remains constant, the substrate reaction is complete; the
spectrometer will then determine the difference in absorbance
for the substrate reaction. If the slope does not remain
constant, two further measuring intervals are added.
Duration of the measuring interval (units as selected for
TIME UNIT). Appears only if CREEP CYCLES is 2 or more.
Range: 0.1 to 999.9
CREEP CYCLES
Creeping Reaction
Time
Start of the Method (?) Enzyme Added (3) Start of Measurement
32161.20
Release 2.0
10-7
Parameters
Parameter
No.
Description
CUR FIT
1 0 Different types of calibration Curve Fit can b e calculated by
the spectrometer software.
LINEAR
used when t h e measured values vary linearly
with t h e concentration, t h e curve passes
through t h e origin.
LINEAR INTERC used when t h e measured values vary linearly
with t h e concentration, t h e curve has an
intercept on t h e measured value axis t o
compensate for background interferences.
QUADRATIC
used when t h e measured values d o not vary
linearly with t h e concentration, t h e curve
passes through the origin.
QUAD INTERC
used when the measured values d o not vary
linearly with t h e concentration, t h e curve h a s
an intercept on t h e measured value axis to
compensate for background interferences.
CYCLE TIME
22 The time in minutes between the start of one sample
measurement to the start of the next sample measurement.
Range: 0.002 to 999.99
-
CYCLE TIMEMeasurementi
CYCLE TIME-i
Measurement
Duration of the analysis = CYCLES X CYCLE TIME
Note: When using accessories, set the CYCLE TIME longer than required for
scanning the spectrum. This avoids time problems.
CYCLES
21
The number of times one sample is scanned or measured.
Range: 1 to 99
Note: If CYCLES is set to 0, the sample is scanned or measured continuously until you stop the method.
10-8
B21B1.20 Release 2.0
Parameters
Parameter
No. Description
DELAY TIME
23
Equilibration time
(Only in the case of use with the cell holder or in manual
operation with CALCULATE = INTERVAL).
This is the time from the start of the method to the start of
measurement (units as selected for TIME UNIT).
Range: 0.0 to 999.9
Note: Measurement begins after equilibration time has elapsed.
Substrate.
Once the equilibration time has elapsed, add the enzyme
solution to the cell and mix.
47
Operating with a Sipper.
Delay between the end of the aspiration process and the start
of the measurement.
Range: 0.1 to 99.9
DIL FACTOR
10
Dilution factor.
Range: 0.00001 to 9999.9
DIVISOR
12
Divisor.
Range: 0.00001 to 9999.9
For example the molar absorption coefficient value can be entered
as divisor. Values can be obtained from the literature.
Note: If the absorption coefficient is already included in the ENZ FACTOR
(enzyme factor), enter DIVISOR ~ 1.
Enzyme.
Enzyme activity is automatically calculated as follows:
a
Enz = enzyme factor x dilution factor x 1/divisor x dA/dt
Substrate.
Substrate concentration c sub is calculated as follows:
c sub = concentration factor x dilution factor x 1/divisor x AA
with AA = absorbance difference.
B2161.20 Release 2.0
10-9
Parameters
Parameter
DIVISOR
(continued)
No. Description
12
Concentration 1, Concentration 2.
Divisor.
The measured value is multiplied by the factor or divided by
the divisor and the resultant value displayed. Thus, dilution
procedures or differing masses can be taken into account.
If a dedicated correction factor is to be used for each sample,
select FACTOR or DIVISOR as a START (tag) parameter
(seepage 4-7). The factor or divisor can be entered
immediately prior to each analysis.
Example:
A particular component of a powder is to be determined and
displayed in mg/g.
The calibration curve is compiled using pure substance in
solution made up in mg/L.
In order that the results can be displayed independently of the
actual mass of powder used, the mass of the powder should be
entered as the divisor.
If the powder were dissolved in 0.25 L instead of in 1 L, an
additional dilution factor of 0.25 should be entered.
The results are then automatically calculated as follows:
(0.25/mass of powder in g) x concentration in mg/L =
concentration in mg/g
END TIME
22
Time from the start of the reaction (i.e. addition of enzyme) to
the end of the reaction (units as selected for TIME UNIT).
Range: 0.1 to 999.9
ENZ FACTOR
11
Enzyme factor.
Range: 0.00001 to 9999.9
Calculate the enzyme factor as follows:
Enzyme factor = V/dv
where:
V is the volume of the total solution in the cell in mL
d is the pathlength in cm
v is the volume of sample in mL
Note: Depending on the procedure used, the molar absorption coefficient
may need to be taken into account.
10-10
B2161.20 fle/ease2.0
Parameters
Parameter
ENZUNIT
No. Description
6
Enzyme Unit.
U/L
is units per liter.
U/mL is units per milliliter.
mU/L is milliunits per liter.
U
is units.
mil
is milliunits.
mg/mL is milligrams per milliliter.
is any unit.
Enzyme Unit U is the amount of enzyme which catalyzes the conversion of
1 p.mol (or micro-equivalent) of substrate per minute.
The unit may appear in capitals on the display.
FACTOR
11
Factor.
Range: 0.000001 to 9999
The measured value is multiplied by the factor and the result
displayed. Thus, concentration can be read off directly or a
dilution taken into account.
If only the true measured value is to be shown, then choose
FACTOR = 1.
If concentration units are to be read off directly, calculate the
factor according to the Beer-Lambert law:
A = ecd
where A is the absorbance
e is the molar absorption coefficient
c is the concentration of the sample
d is the pathlength of the cell
Thus, the concentration c = A/(ed)
and the factor f = l/(ed)
82f67.20
Release 2.0
10-11
Parameters
Parameter
FACTOR n
No.
Description
11 Factor (for each wavelength n).
Range: -9999.9 to 9999.9
The measured value is multiplied by the factor and the result
displayed. Thus, concentration can be read off directly or a
dilution taken into account.
If only the true measured value is to be shown, then choose
FACTORn = 1.
If concentration units are to be read off directly, calculate the
factor according to the Beer-Lambert law:
A = ecd
where A is the absorbance
e is the molar absorption coefficient
c is the concentration of the sample
d is the pathlength of the cell
Thus, the concentration c = A/(ed)
and the factor f = l/(ed)
FIRST SAMPLE #
19 Number of the first sample in the batch.
All subsequent samples are automatically numbered
consecutively.
GRAPHICS PLOT
25 Graphics printout.
Option: YES NO
GRID
29
INTERVAL
21 Interval time (units as selected for TIME UNIT).
Range: 0.1 to 999.9
When using CALCULATE = REGRESSION, the change in
absorbance dA/dt is printed out.
When using CALCULATE = INTERVAL, the slope is calculated
for each interval. The mean of all slopes is then used for the
calculation of the enzyme activity (see also parameter
CALCULATE).
10-12
Graphics printout with grid,
(valid only when GRAPHICS PLOT = YES).
Option: YES NO
B2161.20 Release 2.0
Parameters
Parameter
INTERVAL
(continued)
No. Description
21
Operating with the Cell Changer:
During the interval time the spectrometer measures once at
each location. To do this you need to know the minimum
measuring time t m i n :
t min = W X (3 X RESPONSE + x + 0.1) seconds
where: N = the number of cells
3 X RESPONSE = measuring time per cell
x = relocation time from cell to cell
The interval time should always be greater than the required
minimum time.
LAG TIME
24
Lag time.
This is the time from the start of the method to the start of
calculation (units as selected for TIME UNIT). After this time a
constant reaction rate should have been reached.
Range: 0.0 to 999.9
Measurement begins with the start of the method. However, enzyme activity
is only calculated from the end of the lag time.
(Only when using POSTRUN KIN = YES, or manual operation together with
CALCULATE = REGRESSION).
LAMP
1 5 Switched o n lamps.
UV:
VIS:
190nmto326nm
326nmtoll00nm
UV/VIS:
190 nm to 1100 nm
Note: In order to preserve the UVlamp:
• Switch off the lamp only at the end of the working day.
- Allow the lamp to cool off for at least 2 minutes before switching on again.
LINE TYPE
31 Type of line used for the graphics printout
(valid only when GRAPHICS PLOT = YES).
DASH1:
DASH2:
DASH3:
DASH4:
—
AUTO: For each curve, a different type of line is used in
the sequence DASH1, DASH2, DASH3, DASH4, DASH1 etc.
B2161.20 Release 2,0
10-13
Parameters
Parameter
MODE
No. Description
1
Concentration 1.
Sets the mode in which the measurements are made.
ABS
isabsorbance
DELTA ABS
is delta absorbance
3WL Analysis
is 3 wavelength analysis
ABS: Measuring absorbance at one wavelength:
A
T
/ T\
Measured value =
DELTA ABS: Correction for an offset baseline by measuring
at two wavelengths:
Measured value = Aw -Av2
3 WL ANLYS: Correction for a sloping baseline by measuring at
three wavelengths:
Measured value =
10-14
W 2 — Wo
B2161.20
•-
Au
Release 2.0
Parameters
Parameter
No.
MODE
(continued)
1
Description
Concentration 2.
Sets the mode in which the measurements are made.
There are four possibilities:
TOTAL AREA
PEAK AREA
DERIV 2 FIX
DERIV 2 PEAK
TOTAL AREA: the total peak area between wavelength
maximum and wavelength minimum is calculated.
WAV.MIN
WAV.MAX
PEAK AREA: the peak area between wavelength maximum and
wavelength minimum is calculated with a correction for the
baseline drift.
WAV.MIN
B2161.20 Release 2.0
WAV.MAX
10-15
Parameters
Parameter
MODE
(continued)
No. Description
1
DERIV 2 FIX: Height of the 2nd order derivative curve at
wavelengths CALC.WAV2 and CALC.WAV1 is measured.
DERIV 2 PEAK: Height of the 2nd order derivative peak.
The software locates the extreme values around wavelengths CALC.WAV2 and CALC.WAV 1 and calculates the
difference in height between these two points. Only values
that have exceeded the set THRESHOLD are taken into
account.
This function can avoid errors that may occur through
displacement of the spectrum.
CALC.WAV2 CALC.WAV1
MMASS dA
66 Sets the relative molecular mass of the Adenine base.
Range: 0 to 99999
Used with the Oligoquant methods.
MMASS dC
67 Sets the relative molecular mass of the Cytosine base.
Range: 0 to 99999
Used with the Oligoquant methods.
10-16
BS161.S0 Release 2.0
Parameters
Parameter
MMASS dG
No. Description
68 Sets the relative molecular mass of the Guanine base.
Range: 0 to 99999
Used with the Oligoquant methods.
MMASS dT
69 Sets the relative molecular mass of the Thymine base.
Range:0 to 99999
Used with the Oligoquant methods.
MMASS dN
70
Sets the relative molecular mass of the base.
N is used to represent any base.
Range: 0 to 99999
Used with the Oligoquant methods.
NUMBER OFdA
60 Sets the number of Adenine bases.
Range: 0 to 999
Used with the Oligoquant methods.
NUMBER OFdC
61
Sets the number of Cytosine bases.
Range: 0 to 999
Used with the Oligoquant methods.
NUMBER OFdG
62
Sets the number of Guanine bases.
Range: 0 to 999
Used with the Oligoquant methods.
NUMBER OFdT
63 Sets the number of Thymine bases.
Range: 0 to 999
Used with the Oligoquant methods.
NUMBER O F N
64 Sets the number of bases. N is used to represent any base.
Range: 0 to 999
Used with the Oligoquant methods.
B2161.20 Release 2.0
10-17
Parameters
Parameter
No.
Description
OLIGO
78 To enter the concentration of primer (DNA) in the solution.
This is not necessarily the concentration in the cell. Used for
the melting point calculation.
Shows only when Ty (theoretical melting point) is YES.
Refer to the Biochemical Application manual.
OPER. ID
36 User identification up to a maximum 8 characters.
User identification appears on each printout.
ORD.MAX
2 6 Maximum ordinate scale range for graphics printout (valid only
ORD.MIN
Range: -9999.9 to 9999.9
If the analytical value obtained is outside the set values, the
latter should be changed.
Note: Derivative spectra can also have negative values.
27 Minimum ordinate scale range for graphics printout (valid only
if GRAPHICS PLOT = YES).
if GRAPHICS PLOT = YES).
Range: -9999.9 to 9999.9
If the analytical value obtained is outside the set values, the
latter should be changed.
Note: Derivative spectra can also have negative values.
10-18
82167.20
Release 2.0
Parameters
Parameter
ORDINATE MODE
B2161.20
Release 2.0
No. Description
1
Ordinate
%T
ABS:
D1 to D4:
Mode.
transmittance in percent
Absorbance
1st to 4th derivatives of the spectrum
(derivative spectra)
RAT:
Absorbance ratio
DIF:
Absorbance difference
COR:
Corrected Absorbance ratio
CONC: Concentration (see also FACTOR)
Derivative modes D l to D4 can be used to resolve overlapping
peaks, to reduce interference and to enhance the fine structure of
a particular peak.
This facilitates the qualitative evaluation of spectra with overlapping peaks and the quantitative evaluation of spectra with undesired background absorption.
The derived values obtained are multiplied by 10 for every degree
of derivation in order to produce graphics that are easier to interpret.
Resolution and noise increase with the degree of derivation. In
general, the 2nd derivative is more helpful in this respect than the
1st: the resolution is better and the characteristic maximum of the
signal is easy to recognize as a derivative minimum.
Should the 1st or 2nd derivatives prove insufficient, the 3rd or 4th
derivatives can be used, providing the noise level remains within
acceptable limits.
The parameters SPEED and SMOOTH influence the quality of
derived spectra. In choosing parameter values, take the following
into account:
- SPEED: Guideline value = peak width in nm x 10. High scan
speeds decrease resolution; low scan speeds increase noise.
- SMOOTH: In the case of derivation spectra, smoothing exerts
a greater influence than in absorbance measurement.
Smoothing should thus be kept to a minimum.
Guideline value < peak width in nm x 0.5.
Derivation is not possible with a degree of smoothing of 0, independent of the ordinate mode selected.
10-19
Parameters
Parameter
ORDINATE MODE
(continued)
No. Description
1
Ratio, difference and corrected ratio (RAT, DIF, COR) modes
are determined according to the equations below:
(RAT =
T • T ' -)
f\2
r\4
(DIF = A, - A2 , A3 - A4 , ...)
A
n
(COR=£
2
_
A
"3
'
A
"5
_
A
"6
'
'">
The subscript 1 stands for the first wavelength, 2 for the second etc...
OVERLAY
3 0 Prints spectra from the same batch onto the same graphics
printout (valid only when GRAPHICS PLOT = YES).
Option: YES NO
Overlaying graphics printouts, functions only if the printer used has an
automatic paper reverse function!
//CYCLES = 1, all the results of a particular batch are printed out sequentially. This enables spectra to be more easily compared than if they are
printed out separately.
PLOT REFS
25
Prints out the calibration curve.
Option: YES NO
POSTRUNKIN
3 4 Allows you to recalculate the results.
Option: YES NO
Enzyme.
When POSTRUN KIN = YES is used, the results for a changed
TOTAL TIME and LAG TIME can be recalculated.
When using a cell changer, the values for TOTAL TIME and
LAG TIME must be a whole multiple of the set INTERVAL time.
Substrate.
When POSTRUN KIN = YES is used, the results for a changed
reaction END TIME can be recalculated.
When using a cell changer no recalculation is possible.
PRINT DATA
70-20
32
Prints out a table containing analytical data when activated.
Option: YES NO
B2161.20 Release 2.0
Parameters
Parameter
No. Description
PRINT REFS
26
Prints out data from the references when activated.
Option: YES NO
REFS
9
Reference solutions.
Choice as to whether a calibration curve should be established or
not at the start of a method.
Option:
OLD
NEW
Old means you wish to use the "OLD" stored calibration curve.
New means you wish to make a "NEW" calibration curve.
If a calibration curve is to be used again, or if the values of the curve are to
be entered directly, select REFERENCES = OLD
(see also parameter VALUE).
It is often useful to tag REFERENCES e.g. as CALL parameters:
select REFERENCES = NEW when selecting the first method and generate a
calibration curve.
At the next call-up, select REFERENCES = OLD. The available calibration
curve is used and measurement can start immediately.
REFn
7
RESPONSE
14 Response time. Time constant in seconds (s).
Option: 0.1; 0.2; 0.5; 1; 2; 5; 10
A large value for time constant gives good signal/noise ratios,
but can cause undesirable smoothing of the curve, especially
with rapidly altering signals.
Thus the time constant should be kept as low as possible, but
maintaining an acceptable signal/noise ratio.
Concentration of reference solution n.
Note: In analyses involving creeping reactions, the time constant set must
be lower than the CREEP TIME set.
Note: The time constant set must be lower than the INTERVAL in order to
calculate dA/dt (see parameter INTERVAL).
[SALT]
77
To enter the salt concentration (monovalent cation
concentration) of the oligonucleotide sample.
Used for the melting point calculation.
Unit: mmol/L
Shows only when Tu (theoretical melting point) is YES.
Refer to the Biochemical Application manual.
B2161.20 Release 2.0
10-21
Parameters
Parameter
No. Description
Aspiration time in seconds for sipper.
Range: 0.0 to 99.9
SAMPLING TIME
Used with the sipper accessory.
SAMPLE ID
37 Sample identification up to a maximum of 8 characters.
Sample identification appears on every printout.
SAMPLES/BATCH
18 Number of samples per batch
(does not appear when using the cell changer).
If batch procedure is not used, enter 0
SCALE
28
Abscissa scale in nm/cm or mm/min for graphics printout,
(valid only when GRAPHICS PLOT = YES).
Options: 0.5; 1; 2; 5; 10; 20; 50; 100 nm/cm
1; 2; 5; 10; 20; 50; 100 mm/min
SEQ.n
61
Sequence of the oligonucleotide bases.
The sequence must be entered in order from base 5' to 3'.
Use the numeric keys according to the table below to enter the
base sequence.
Option:
Base
Key
A is Adenine
7
C is Cytosine 4
G isGuanine 1
T is Thymine 0
N is any base 8
SEQUENCE
LENGTH
60
Length of the oligonucleotide base sequence.
Range: 2 to 50
SLIT
17 Required slit width in nm.
Options: 0.5,1,2,4
Note: Only shows with Lambda 14 and Lambda 14P spectrometers.
10-22
B2161.20 Release 2.0
Parameters
Parameter
SMOOTH
No. Description
14 Smoothing according to Savitzky-Golay in nm.
The acceptable level of smoothing is dependent on the
scan speed.
SPEED:
up to 960 nm/min
SMOOTH:
1920 nm/min
0,2,3,4
0,4,6,
6, 8,10 nm
8,10 nm
Guideline: 0.5 x peak width of lowest peak.
2880 nm/min
0,6,
8,10 nm
Smooth 2 nm, corresponds to
V2 Peak width. Spectrum
quality not compromised
Smooth 6 nm. Spectrum quality
poor.
Smooth value is 10 nm. Benzene
spectrum not recognizable
Smoothing influences resolution and noise: an increase in smoothing
decreases the noise, but resolution suffers.
A too high degree of smoothing tends to average out the values
and the fine structures of the spectrum disappear.
If smoothing is too low, spectral fine structures may be hidden by
noise.
If an unacceptable value is selected, an appropriate indication is
displayed. If then no other value is substituted, the spectrometer will
automatically continue to operate at smoothing 0.
Note: Derivative spectra cannot be scanned at smoothing 0.
Concentration methods.
Select a smoothing factor that is as low as possible so that the
peak is smoothed as little as possible. The value selected
should depend on the level of noise.
B2161.Z0 Release 2.0
10-23
Parameters
Parameter
SPEED
No.
13
Description
Scanning speed in nm/min.
Select the scanning speed depending on the type of sample and
the desired resolution. The following can be used as a general
rule:
-
For narrow peaks, select a low scanning speed and low
degree of smoothing in order to limit the noise level.
-
For broader peaks, higher scanning speeds can be selected.
- For derivative spectra, observe the comments given under
ORDINATE MODE.
STIRRER
49
Guideline values:
Overview spectra
Broad peaks
Solid and liquid samples
2880; 1920 nm/min
960; 480; 240 nm/min
120; 60; 30 nm/min
Gaseous samples, spectra
with higher resolution
expanded spectra
30; 15; 7.5 nm/min
Switches magnetic stirrer on and off.
Option: YES
NO
If magnetic stirring has been switched on, place a small
magnetic stirring bar in each of the cells. The arrangement is
such that whilst measurement is taking place in one cell, the
following cell is stirred.
Used with the 13Cell changer accessory.
TEMP CHECK
50
Temperature measurement.
Option: YES NO
If TEMP CHECK = YES has been selected, a temperature sensor
(Part Number B018-5227) must be in stalled. The temperature
measured in the cell is included in the printout.
If a temperature sensor has not been installed, select
TEMP CHECK = NO.
10-24
B2161.20 Release 2.0
Parameters
Parameter
No. Description
TEMPERATURE
51
To enter the required temperature in ° C
(only in combination with TEMP CHECK = YES).
Range: 0.0 to 150.0
Measurement begins as soon as the temperature in the cell has
reached the required temperature + 0.1° C.
For temperatures of 0.0 ° C or less, the temperature is only
registered and printed out together with the analytical results.
Operation with a Peltier cell holder.
To enter the required temperature of the Peltier cell holder.
Range: 15.0 to 45.0
THRESHOLD
33
Scan.
Threshold value for the printout of analytical data
(valid only when PRINT DATA = YES).
Range: 0.0 to 9999
Only data above the given threshold value is printed out.
Concentration.
Threshold value for MODE = DERIV PEAK 2.
Only values above the given threshold value will be recognized
as peaks.
TIME UNIT
20
Units for all subsequent time parameters.
mm:
s:
TM CALCULATION
76
minutes
seconds
Calculates the theoretical melting point
Refer to the Biochemical Application manual.
B2161.2Q
Release 2.0
10-25
Parameters
Parameter
TOTAL TIME
No. Description
22
Total time from the start of the method (or end of DELAY TIME)
to the end of the measurement
(units as selected for TIME UNIT).
Range: 0.1 to 999.9
Select the measuring time so that the end of the measurement is still within
the linear portion of the curve.
Manual operation:
For CALCULATE = REGRESSION, the time is that between the start of the
method and end of the measurement.
For CALCULATE = INTERVAL, the time is that between the end of the
DELAY TIME and end of the measurement.
Operation with Cell Changer:
The time from the end of the DELAY TIME to the end of the measurement.
Within this measuring period, all samples are measured n-times consecutively.
'
The number of cycles is determined by the measuring time and the
INTERVAL time:
Number of cycles = TOTAL TIME/INTERVAL + 1.
If the result proves to be a decimal fraction, the next higher whole
number is taken, e.g. 100/30 + 1 = 4.33 = 5 cycles.
The cycle time is identical to the INTERVAL time..
The final cycle begins at the end of the measuring time i.e. measurement
ends only on completion of the final cycle.
TRAY#
50
Enter the number of the tray used with the AS90/91 autosampler.
VALUE n
8
If the calibration curve is to be compiled from known values
(e.g. from the literature values or from previous measurements),
these values should be entered here.
Make sure that the entering sequence is the same as for the corresponding
concentrations (parameter REF).
If the calibration curve is to be recorded, do not enter anything
here.
After calibration, the absorbance values for the reference solutions are
automatically entered.
The spectrometer calculates the calibration curve from these values.
10-26
B2161.20 Release 2.0
Parameters
Parameter
No. Description
WAV. MAX
3
Upper limit of the wavelength range in nm.
Value range: 190.0 to 1100.0; in steps of 0.1.
WAV. MIN
4
Lower limit of the wavelength range in nm.
Range: 190.0 to 1100.0, in steps of 0.1.
Ifpeak areas are usedforthe calculation (seeparameter MODE), theareaiscalculated between the upper and lower wavelength values.
If calculation is made via a 2nd order derivative, the derivative spectrum is
recorded between the upper and lower wavelength values.
WAVE, n
3
Wavelength program, Oligoquant 1.
Measuring wavelength in nm.
Range: 190.0 to 1100.0, in steps of 0.1.
Note: The wavelengths is run in the sequence in which they are entered
(when using the ORDINATE MODE, take RAT and DIF into account).
Enter wavelengths in decreasing sequence if possible — highest first, lowest
last.
Concentration 1.
Wavelength (n) in nm.
Range: 190.0 to 1100.0, in steps of 0.1.
When using MODE = ABS, only 1 wavelength can be entered.
When using MODE = DELTA ABS, 2 wavelengths must be
entered.
When using MODE = 3 WL ANALYS, 3 wavelengths must be
entered.
WAVELENGTH. 1 = measuring wavelength
WAVELENGTH. 2 and 3 = wavelengths for baseline correction.
Seepage 10-14.
WAVELENGTH
3
The wavelength (nm) at which measurements are made.
Range: 0 (for adjustment of cell holder)
190.0 to 1100.0 in steps of 0.1.
B2161.20
Release 2.0
10-27
10-28
B2161.20 Release 2.0
Appendix
SuperUser
A1.1
Appendix 1
Activating SuperUser Mode
SuperUser mode gives you access to all the branches in the
instrument. You activate SuperUser mode as follows:
1) Switch off the spectrometer.
2) Wait about two minutes to allow the lamps to cool down.
3) Press [1] [5] [-] (one, five, minus) simultaneously.
4) Keep the keys pressed and switch on the spectrometer.
5) Release the keys when the display appears.
The SuperUser mode is now active.
A1.2
Deactivating SuperUser Mode
1) Switch off the spectrometer.
2) Wait about two minutes to allow the lamps to cool down.
3) Switch on the spectrometer.
The SuperUser mode is now deactivated.
B2161.20 Release 2.0
A1-1
A1-2
B2161.20 Release 2.0
Protect Functions
A2.1
Appendix 2
General Information about Protect Functions
Protect functions define the right of access to methods and
branches. They can only be defined in the SuperUser mode.
You can prevent access to branches and methods using the
protect function. You can set the protection so that for routine
sample checking only the method dedicated to that task is accessible.
Table A2-1 lists the protect functions available in order of
priority, WRITE has lowest priority, ALL (full) has highest priority.
Table A2-1 Protect Functions
B276T.20 fie/ease 2.0
Protect Function
Effect
Write protection
Prevents method parameters
from being written over.
WRITE
Read/Write protection Prevents methods from being
read and from being overwritten.
RD/WR
Execute protection
Prevents methods from being
used.
Full protection
Prevents access to a branch
and all of its methods.
Designation
EXECUTE
ALL
A2-1
Setting Protect Functions
A2.2
Setting Protect Functions
Please observe the following when setting protect functions:
-
Protect functions set for a method are valid for this particular method only.
-
Protect functions set for a branch are automatically valid
for all the methods contained in the branch.
-
If a particular method has a higher protect function
priority than the branch, the method protection is valid.
-
If the method has a lower priority than the branch, the
branch protection is valid.
Example:
When a branch has read and write protection: all the methods in
this branch have the same protection.
However, full protection can be set for individual methods, since
full protection has a higher priority than read/write protection.
Write protection is not possible for individual methods since the
branch has the higher priority.
A2-2
B2161.20 Release 2.0
Setting Protect Functions
Setting Method Protect Function
Set the method protect function as follows:
1) Switch on the spectrometer in SuperUser mode.
2) Select appropriate method.
e.g.
2 SCAN
< — >/PARAM/START
•
3) Press [PARAMETER].
PARAMETER
MODIFY METHOD
PARAM/->
•
<
4) Use the arrow keys to select
CHANGE PROTECTION.
CHANGE PROTECTION
PARAM/->
5) Press [PARAMETER] again.
PARAMETER
A
6) Use the arrow keys to select the desired
protect function.
•
t
NO
7^) Prpss FPARAMETERl
[ ] t o m n f i r m the
1
PROTECT
PARAMETER
protection
...or...
Press [STOP] to cancel.
8) Exit SuperUser mode to activate the
protect function
B2161.20
Release 2.0
A2-3
Setting Protect Functions
Setting Branch Protect Function
Set the branch protect function as follows;
1) Switch on the spectrometer in SuperUser mode.
2) Select the appropriate branch.
e.g.
APPLICATION
PARAM/->
3) Press [•] [METHOD].
METHOD
i
NO
<—>
5) Press [PARAMETER] to confirm the protection
...or...
Press [STOP] to cancel.
6) Exit SuperUser mode to activate the
protect function
A2-4
•
<
4) Use the arrow keys to select the required
protect function.
PROTECT
PARAMETER
B2161.20 Release 2.0
Setting Protect Functions
Preventing Access to the Methods and Branches
You can prevent access to branches and methods using the
protect functions.
Example
If only one particular method is to be used (without access to the
parameters), set the protect functions as follows:
- Set full protection for all branches except the application
branch.
- Set read/write protection for the application branch.
- Set full protection for all methods in the application branch
not to be used.
For the method to be used, the read/write protection of the
branch is valid.
This method can be used outside of the SuperUser mode (i.e.
started), but it cannot be read or altered.
Tagged parameters continue to appear when methods are being run and
may then be modified.
B2161.20
Release 2.0
A2-5
82161.20
Release 2.0
Instrument Branches
A3.1
Appendix 3
Overview Of the Instrument Branches
The basic spectrometer has 6 branches
Branch
Content
Application
Analysis methods
Communication* Interface methods
Calibration*
Methods to calibrate the spectrometer
Configuration*
To set up basic spectrometer settings
Test*
Test methods
Validation*
Validation methods
* Can only be accessed as SuperUser.
Methods can only be modified, you cannot create any new methods.
82767.20
Release 2.0
A3-1
Selecting a Branch
A3.2
Selecting a Branch
1) Switch on the spectrometer in SuperUser mode.
2) Press [STOP] until a branch header is
displayed.
APPLICATION
PARAM/< — >
3) Use the arrow keys to select the
required branch.
<
•
CONFIGURATION
PARAM/< — >
4)
Press [PARAMETER].
PARAMETER
The branch methods can then be
500.0 NM 0.000 ABS
selected (see Section 4.2, page 4-2).
INPUT
>
<
Can only be set in SuperUser mode.
A3-2
B2161.20
Release 2.0
About Branches
A3.3
About the Various Branches
With branches that do not contain analytical methods, you must always
press [START] after making the change to make the changes effective.
A3.4
APPLICATION - the Application Branch
This branch contains the analytical methods.
A3.5
COMMUNICATION - the Communication Branch
This branch contains a method for controlling the spectrometer
via an external computer.
62161.20
Release 2.0
No. Method
Function
29
Control of the spectrometer via an external
computer.
A precondition is that the computer should be
equipped with a program compatible with the
method in use, e.g. UV WinLab, or PECSS
(version 3.1 or later).
FREERUN
A3-3
Calibration Branch
A3.6
CALIBRATION - the Calibration Branch
Only for service personnel (or very experienced users). This
branch contains methods for wavelength calibration of the
spectrometer.
No. Method
19 0%T
CALIBRATION
20 ONE WAVEL.
CALIB.
21
A3-4
TWO WAVEL.
CALIB.
Function
Switches the dark signal compensation on and off.
A residual current (dark signal) flows through the detector even
when there is no beam.
This signal is taken into account when the dark signal function is
switched on. Compensation then takes place automatically,
either at the start of a method or every 10 minutes, whichever
occurs first.
Wavelength calibration with one peak.
To check the calibration, record the spectrum of a wavelength
standard and compare with that recorded by the spectrometer. If
they do not correlate, the spectrometer should be recalibrated.
Parameters:
0 nm PEAK
Internal calibration at 0 nm.
D2 PEAK
Internal calibration at 656.1 nm.
SPEC PEAK
Calibration using an external wavelength
standard, e.g. holmium oxide.
OLD PEAK
Measured wavelength of the external standard.
NEW PEAK
Actual wavelength of the external standard.
Wavelength calibration with two peaks.
To check the calibration, record the spectrum of a wavelength
standard and compare with that recorded by the spectrometer. If
they do not correlate, the spectrometer should be recalibrated.
Parameters:
AUTO PEAK
Internal calibration at 0.0 and 656.1 nm.
SPEC PEAK
Calibration using an external wavelength
standard, e.g. holmium oxide.
OLD PEAK n
Measured wavelength of the peak.
NEW PEAK n Actual wavelength of the peak.
B2W1.20 Release 2.0
Configuration Branch
A3.7
CONFIGURATION - the Configuration Branch
This branch contains methods for configuration of the spectrometer to the individual requirements of the user.
No. Method
1
HELP CONFIG
Function
Level and language of help messages.
Parameters:
LEVEL
Extent
LANGUAGE
Language
•2
AS90/91 CONFIG
Setting for the AS-90/91 (sample locations, upper and lower
limits for the sampler arm, etc.).
Details are contained in the AS-90/91 User's Manual.
4
COMM. CONFIG
Protocol for the RS 232 interface for use with a PC.
The default parameter values are for use with PECSS and a.n
Epson PC.
Default values:
Port Enable: No
ETXT-Character: 015
Respond: Prompt
Prompt-Character: 021
Baud Rate: 4800
Break-Character: 043
Bits/Character: 8
Erase-Character: 010
Stopbit: 1
Kill-Character: 010
Parity: none
Range: 2
Terminator: CRLF
PORT USAGE
CONF.
Usage of the RS 232 interface.
The parameter MAIN PORT determines, whether a printer or a
PC can be connected to the RS 232 interface:
MAIN PORT
lstRS-232
2ndRS-232
PRINTER
COMPUTER
printer
PC
PC
printer
After a full reset the value is set to PRINTER. To facilitate administration, set MAIN PORT= PRINTER and connect the printer to the
1st RS 232 interface, the PC to the 2nd RS 232 interface.
If one interface fails, change the method to switch the interface
usage.
B2161.20 Release 2.0
A3-5
Configuration Branch
No. Method
6
Function
PRINTER CONFIG Printer Output.
Parameters:
PRINTER ON?
PRINTER
GAP
COLOR ON?
PERFORATION
PLOT HEADER
7
ACCESSORY
CONFIG
Switches output to the printer on and off.
Selects the printer:
EPSON LQ
EPS. EX/FX + BIDIRECTIONAL
Sets the gap between two pages.
Switches color printing on and off
(only for color printers).
Skip over Perforation.
Header printed at the start of each plot.
Accessory mode (for spectrometers without accessory board).
Parameters:
ACCESSORY ON? Switches accessory mode on and off.
CELL
To select the type of cell changer.
NO is no cell changer.
CELL5, CELL6, CELL8, CELL9, CELL13 is for
SIPPER
cell changer type.
To select the type of sipper.
VASI, PESI
AS-90/91
8
USER CONFIG
SI = sipper, VA = vacuum, PE = peristaltic.
autosampler
Switches from single to double beam mode; switches background correction on and off.
Parameters:
BEAM DB Double beam
BEAM SBR Single reference beam
BEAMSBS Single sample beam
BASELINE CORR? YES Background correction on
BASELINE CORR? NO
Background correction off
Note: When using single beam mode, operate only with ordinate
mode %T.
A3-6
B2W1.20 Release 2.0
Configuration Branch
No. Method
9
FACTORY
CONFIG
Function
Calibration peaks offsets and filter change points.
Parameters:
ONM OFFSET
Only for service personnel.
ABS FACT
D2 OFFSET
FILTER n
Default: 0.0 nm
Only for service personnel.
Default: 1.0
Only for service personnel.
Default: 0.0 nm
Wavelengths for filter change (filter 2-7)
Default:filter 2 = 830.0 nm
filter 3 = 683.0 nm
filter 4 = 558.0 nm
filter 5 = 420.0 nm
filter 6 = 383.0 nm
filter 7 = 326.0 nm (lamp change
point)
A3.8
VALIDATION • the Validation Branch
The methods in this branch are reserved for customer service.
The methods are used to test that the spectrometer's performance lies within specification.
A3.9
TEST - the Test Branch
These methods are for use by Perkin-Elmer Service only.
B2W1.20
Release 2.0
A3-7
Validation
i
P
S
r
1
Status Display
P
1r
Service
Methods
M: [METHOD] n [ENTER]
P: [PARAMETER]
S: [STOP]
< > : Arrow keys
B2161.20 Release 2.0
Enzyme Kinetics
A4.1
Appendix 4
Enzymatic Analytical Procedures
Enzyme analysis makes use of enzyme controlled reactions to
determine a substance. These procedures are used especially in
clinical chemistry and food chemistry.
There are two methods of enzymatic analysis:
— The determination of enzyme concentration or enzyme
activity: enzyme kinetic measurement. For example: the
determination of enzymes in blood serum.
- The determination of the concentration of a substrate:
substrate kinetic measurement. For example: the determination of components in food, e.g. alcohol in wine.
The basis of both methods is the conversion of a substrate into a
product whereby the enzyme acts as a catalyst.
The reaction can be followed photometrically: an added coenzyme (e.g. NADH) is oxidized or reduced in the course of the
reaction and the resulting change in absorbance measured. Or,
the substrate or product may be photoactive and the absorbance
will change with the concentration.
In enzyme kinetics, the substrate is added in excess and the reaction rate (as dA/dt) measured. With excess substrate, it is
constant and directly proportional to enzyme activity.
In substrate kinetics, the substrate reacts completely. The
substrate concentration can then be calculated from the change in
absorbance
B2161.20
Release 2.0
A4-1
Enzyme Kinetics
A4.2
Enzyme Kinetics
In enzyme kinetics, the enzyme activity of a sample solution is
determined: the sample solution containing enzyme (e.g. serum)
is reacted with a high excess of substrate.
The substrate is converted to product by the enzyme, the rate of
the reaction can be followed photometrically and is a direct
measure of the enzyme activity.
(Enzyme activity is given as International Units U:
1U = the enzyme activity required to convert 1 umole of
substrate per minute, under optimal conditions.)
The following reaction can be assumed for the conversion of
substrate S into product P:
k
S+E
1
k
N
s
S—E
3
^
>
P+E
k2
where:
£ = enzyme and k = reaction rate constant.
The rate of reaction S + E
Michaelis-Menten equation:
> P + E is governed by the
with v = £•£
7 = Reaction Rate
dr = - ^ !dr§ = ^dr
and ku =
k2 + k3
.
= Michaelis-Constant
Due to the large excess of substrate there is a limiting case:
c 8 > kM
and hence
v = k3 • c0E is valid.
A4-2
B2161.20 Release 2.0
Enzyme Kinetics
Thus, the reaction rate is constant (no consumption of enzyme)
and directly proportional to enzyme concentration or enzyme
activity. Hence, the enzyme activity of a solution can be directly
determined by measuring the reaction rate.
df
dA
dt
'-OE
Time
In practice, the course of the curve obtained can deviate from the
ideal form: it becomes linear only after a certain lag time and
flattens out towards the end. In such a case, only the linear region
of the curve is used for calculating the reaction rate.
Lag Time
Linear
Region
Time
B2161.20
Release 2.0
A4-3
Substrate Kinetics
A4.3
Substrate Kinetics
In substrate kinetics the substrate concentration of a sample solution is determined via enzyme controlled reactions. The advantages of such a process are:
• High specificity, i.e. only one substrate is converted. This
avoids the necessity of complex sample preparation.
• A quicker reaction, with measuring times of only
3—30 minutes.
In the course of the reaction, the substrate is converted to
product and the reaction can be followed photometrically. The
reaction is started by the addition of enzyme and proceeds relatively quickly until a state of equilibrium is attained. The
substrate has been converted by this time and the absorbance
does not alter any more.
The measured difference in absorbance (A/1) is directly proportional to the substrate concentration:
where:
csub' is the substrate concentration
/: is the concentration factor
AA: is the measured difference in absorbance
Enzyme added
J
AA
Time
A4-4
B2161.20
Release 2.0
Substrate Kinetics
The course of the reaction can deviate from the ideal described
above: creeping reactions can take place and the absorbance can
hence increase even after the substrate reaction has been
completed.
The end point of such a reaction is reached when the slope of the
curve remains constant. The actual end point can then be determined by extrapolation.
Enzyme added
Creeping reaction
Time
B2161.20
Release 2.0
A4-5
A4-6
B2181.20 Release 2.0
Translations of Warnings
Translations of Warnings
This annex contains translations of the numbered warnings used
in this handbook.
B2161.20
Release 2.0
T-1
Translations of Warnings
W01.01
WARNING
Warning
We use the term WARNING to inform you about situations that could result in
personal injury to yourself or other persons.
Details about these circumstances are in a box like this one.
Warning (Warnung)
Bedeutet, daB es bei Nichtbeachten der genannten Anweisung
zu einer Verletzung des Benutzers kommen kann.
Warning (Advarsel)
Betyder, at brugeren kan blive kvaestet, hvis anvisningen ikke overhoides.
Warning (Peligro)
Utilizamos el termino WARNING (PELIGRO) para informarle sobre
situaciones que pueden provocar danos personates a usted o a otras
personas.
En los recuadros como este se proporciona informacion sobre este tipo
de circunstancias.
Warning (Danger)
Nous utiiisons la formule WARNING (DANGER) pour avertir des situations
pouvant occasionner des dommages corpore/s a I'utilisateur ou a
d'autres personnes.
Les details sur cescirconstances sont donnies dans un encadre
semblable a celui-ci.
Warning (Pericolo)
Con il termine WARNING (PERICOLO) vengono segnalate situazioni che
potrebbero provocare incident'! alle persone. Troverete informazioni su
tali circostanze in un riquadro come questo.
Warning (Waarschuwing)
Betekent dat, wanneer de genoemde aanwijzing niet in acht wordt
genomen, dit kan leiden tot verwondlngen van de gebruiker.
Warning (Aviso)
Significa que a nao observincia da instrugao referida poderi causar
urn ferimento ao usuirio.
1-2
B2161.20 Release 2.0
Translations of Warnings
A
CAUTION
Caution
We use the term CAUTION to inform you about situations that could result in
serious damage to the instrument or other equipment.
Details about these circumstances are in a box like this one.
Caution (Achtung)
Bedeutet, daB die genannte Anleitung genau befolgt werden muB, urn
einen Gerateschaden zu vermeiden.
Caution (Bemaerk)
Dette betyder, at den neevnte vejiedning skal overhoides n0je for at undgi
en beskadigelse af apparatet.
Caution (Advertencia)
Utilizamos el t&mino CAUTION (ADVERTENCIA) para advertir sobre
situaciones que pueden provocar averias graves en este equipo o en
otros. En recuadros este se proporciona informacion sobre este tipo de
circunstancias.
Caution (Attention)
Nous utiiisons Ie terme CAUTION (ATTENTION) pour signaler les situations
susceptibles de provoquer de graves deteriorations de I'instrument ou
d'autre materiel.
Les details sur ces circonstances figurent dans un encadre semblable a
celui-ci.
Caution (Attenzione)
Con il termine CAUTION (ATTENZIONE) vengono segnalate situazioni
che potrebbero arrecare gravl danni allo strumento o ad altra
apparecchiatura.
Troverete informazioni su tali circostanze in un riquadro come questo.
Caution (Opgelet)
Betekent dat de genoemde handleiding nauwkeurig moet worden
opgevolgd, om beschadiging van het instrument te voorkomen.
Caution (Atengao)
Significa que a instrugao referida tern de ser respeitada para evitar a
danificagao do aparelho.
B2161.20 Release 2.0
7-3
Translations of Warnings
W01.03
Explosive Atmosphere
This instrument is not designed for operation in an explosive atmosphere.
WARNING
D
DK;
00 • • H.
E
Exploslonsfahlge Atmospharen
Das Gerat dart nicht in explosionsfahigen Atmospharen betrieben werden!
Eksplosive omgivelser
Apparatet mi ikke anvendes i eksplosive omgivelser!
Atmdsfera exploslva
Este aparato no ha sido disenado para utilizarlo en atmosferas explosivas.
•———•
Atmosphere explosive
Cet instrument n'estpas congu pour fonctionner dans une atmosphere
explosive.
Atmosfera esploslva
Questo strumento non e adatto per I'uso in atmosfera esplosiva.
NL
-
P
T-4
Explosiegevaarlljke omgevingen
Het instrument mag oJst in een explosiegevaarlijke omgeving worden
gebruikt!
Atmosferas explodiveis
O aparelho Q|Q pode ser utilizado em atmosferas explodiveis!
B2161.20
Release 2.0
Translations of Warnings
W02.01
WARNING
Electrical Hazard
Any interruption of the protective conductor inside or outside
the instrument or disconnection of the protective conductor (earth/ground)
terminal is likely to make the instrument dangerous.
Intentional interruption is prohibited.
Gefahrdung durch Elektrizitat
Das Gerat muB zum Betrieb immer geerdet sein.
Auf keinen Fall die Schutzleiter im Gerat oder in der Netzzuleitung trennen
Oder entfernen.
Fare pi grund af elektricltet
Apparatet skal altid vaere jordet.
Man mi under ingen omstaendigheder skille eller fjerne jordlederen inde i
apparatet eller i stromledningen.
Peligro electrico
Cualquier interrupcion del conductor de proteccidn dentro o fuera del
aparato, o la desconexion del terminal del mismo (toma de tierra) podrian
ocasionar serios peligros al usar el equipo.
Prohibida la interrupcion intencionada.
Risque d'electrocution
Toute interruption du conducteur de protection a I'interieur ou a I'exterieur
de I'instrument, ou deconnexion du raccord du conducteur de protection
(terre) peut rendre I'instrument dangereux. II est interdit d'interrompre
volontairement ce conducteur.
Pericolo: elettricita
Qualsiasi interruzione delta protezione del conduttore all'interno o
all'esterno dello strumento, o lo scollegamento del terminale
(di terra/massa) del conduttore di protezione possono rendere pericoloso
lo strumento.
E' vietato provocare volontariamente queste interruzioni.
Risico's door elektriciteit
Het instrument moet voor de werking altijd geaard zijn. In geen geval mag
de aarding van het instrument of de netvoeding worden onderbroken of
worden verwijderd.
Perigo por electricidade
Para a operagao o aparelho tern de estar sempre ligado a terra. De forma
alguma separar ou retirar os condutores de protecgao a terra no aparelho
ou no cabo de alimentagao da rede.
B2161.20
Release 2.0
7-5
Translations of Warnings
W02.02
WARNING
Lethal voltages are present in the instrument
• Even with the power switch OFF, line power voltages can still be present
within the instrument.
• When the instrument is connected to line power, terminals may be live,
and opening covers or removing parts (except those to which access
can be gained by hand) is likely to expose live parts.
• Capacitors inside the instrument may still be charged even if the
instrument has been disconnected from all voltage sources.
Gefahrliche Spannung im Gerat
• Auch in ausgeschaltetem Zustand kann an einigen Stellen im Gerat
Netzspannung anliegen, wenn das Gerat am Stromnetz angeschlossen
ist
• Auch bei ausgeschaltetem Gerat und getrennter Netzverbindung konnen
Kondensatoren im Gerat noch mit gefahrlicher Spannung geladen sein.
Farlig spaending i apparatet - fare for kveestelser
• Ogsi i slukket tllstand kan der vaere netspaending nogle steder i
apparatet, hvis apparatet er tilsluttet til stromnettet.
• Selv nir apparatet er slukket, og stromforbindelsen er afbrudt,
kan kondensatorerne i apparatet veere ladet med farlig spaending.
En el aparato existen voltajes letales
• Incluso con el interruptor desconectado, puede haber voltaje dentro
del equipo.
• Cuando el instrumento se encuentre conectado a la red elGctrica, los
terminates pueden estar bajo corriente y estos quedar expuestos al
abrir las cubiertas o al extraer componentes (exceptuando aquellos a
los cuales se puede acceder con la mano).
• Los condensadores internos del aparato pueden permanecer cargados
incluso cuando el aparato haya sido desconectado del voltaje de
la Knea.
Presence de tensions mortelles dans I'instrument
• Meme lorsque i'interrupteur de puissance est surARRET, des tensions
de secteur peuvent encore etre pr6sentes dans I'instrument.
• Lorsque I'instrument est relie au secteur, les raccords peuvent etre
sous tension, et des parties sous tension peuvent §tre dGcouvertes en
ouvrant des capots ou en retirant des pieces (a /'exception de celles
auxquelles il est possible d'accGder manuellement).
• Les condensateurs contenus dans I'instrument peuvent encore etre
charges, mime si I'instrument a 6t6 d6connect6 de toutes les sources
de tension.
T-6
B2161.20
Release 2.0
Translations of Warnings
WARNING
Lethal voltages are present in the Instrument
• Even with the power switch OFF, line power voltages can still be present
within the instrument.
m When the instrument is connected to line power, terminals may be live,
and opening covers or removing parts (except those to which access
can be gained by hand) is likely to expose live parts.
• Capacitors inside the instrument may still be charged even if the
instrument has been disconnected from all voltage sources.
Nello strumento sono present! tensioni mortali
• Anche se I'interruttore di aiimentazione e in posizione OFF, la tensione
di linea pud essere ancora presente aH'interno dello strumento.
• Quando to strumento e collegato alia rete di aiimentazione i terminali
possono essere sotto tensione; aprendo le calotte di protezione o
rimuovendo alcune parti (ad eccezione di quelle raggiungibili con la
mano) e possibile esporre altre parti sotto tensione.
• Anche se to strumento e stato scollegato da tutte le fonti di tensione,
i condensatori al suo interno possono essere ancora carichi.
Gevaarlijke spanningen in het instrument - gevaar van letsel
m Ook in uitgeschakelde toestand kan, wanneer het instrument op de
netvoeding is aangesloten, op sommige plaatsen in het instrument
netspanning staan.
• Ook bij een uitgeschakeld instrument en een onderbroken netvoeding
kunnen condensatoren in het instrument nog een gevaarlijke lading
bevatten.
Tensao perigosa no aparelho - perigo de ferimento
• Mesmo desligado, o aparelho podera ainda ter tensao de rede em
alguns pontos enquanto estiver ligado a rede de corrente.
• Mesmo com o aparelho desligado e a ligagao a rede de corrente
interrompida, os condensadores dentro do aparelho ainda poderao
ter urns tensao perigosa aplicada.
B2161.20 Release 2.0
T-7
Translations of Warnings
T-8
B2W1.20
Release 2.0
Index
Index
Beer-Lambert Law, 10-11,10-12
ABS, 10-14,10-19
Accessory, 10-1
configuration, A3-6
operation with, 6-1
parameters, 6-7
requirements, 6-2
spectrometer without... board,
6-3
type, 6-1
with methods, 6-2
Alignment
cell holder, 2-6
microcell, 2-9
Analysis Procedure, 5-3
Application
branch, A3-3
minimum volume..., 2-9
AS-90/91, 6-9,10-1
configuration, A3-5
Auto Method, 10-1
Auto Purge, 10-1
Autopurge, 6-9
B
Back Corr, 10-2
Background Correction, 5-2,8-1,
10-2
manual setting, 3-3
with cell changers, 6-5
Baseplate, 2-4
Baud rate, for PC, A3-5
B216120
Release 2.0
Beer-Lambert Law, 8-2
Blank, 10-3
Branch
application, A3-3
calibration, A3-4
communication, A3-3
configuration, A3-5
directory, 4-16
protect function, A2-4
selecting, A3-2
test, A3-7
validation, A3-7
Branches, overview, A3-1
Calc.Wav 1,10-3
Calc.Wav 2,10-3
Calculate, 10-4,10-12,10-26
interval, 10-4
regression, 10-4
Calibration
branch, A3-4
curve, 10-8,10-26
deleting a point from, 5-25
processing, 5-24
Care
daily, 7-1
of the instrument, 7-1
Cell, 2-9,10-1
centre height, 2-7
changer
13cell, 6-8
5cell, 6-7
6cell, 6-7
8cell, 6-7
9cell, 6-7
holder, 2-4
alignment, 2-6
installation, 2-5
lifter for short cells, 2-4
part numbers, 2-9
pathlength, 2-9
use and care of, 7-2
Cell 1-7,10-5
Cell 5,10-5
Cell 6,10-5
Cell 8,10-5
Cell 8-13,10-5
Cell 9,10-5
Chemically Reactive Samples,
8-3
Chng Const, 10-5
Cleaning
sample compartment, 7-1
sample compartment window,
7-1, 7-3
Clock
internal, 5-41
realtime, 5-41
Cold Solutions, 7-2
Communication
branch, A3-3
configuration, A3-5
lndex-1
Index
Compressed gases, safety
information, S-7
Cone, 10-19
factor, 10-6
unit, 10-6
Concentration Method, 5-12
concentration 1
calibration curve, 5-15
create, 5-14
measurement wavelength^), 5-13
sample measurement, 5-16
summary, 5-12
concentration 2
2nd derivative, 5-19
calibration curve, 5-22
create, 5-21
measurement wavelengths,
5-19
peak areas, 549
sample measurement, 5-23
summary, 5-18
threshold, 5-20
with cell changers, 6-6
Configuration
accessory, A3-6
AS-90/91, A3-5
branch, A3-5
communication, A3-5
factory, A3-7
help, A3-5
port usage, A3-5
printer, A3-6
user, A3-6
Connector, panel, 1-1
Copying
method, 4-14
method parameters, 4-13
Cor, 10-1,10-19,10-20
Creep
cycle, 10-7
time, 10-7
Creeping reactions, A4-5
Cur Fit, 10-8
lndex-2
Curve
calibration, 5-12,5-15,5-22,
5-24,10-26
changing the type of... fit, 5-24
type of... fit, 10-8
Cycle Time, 10-8
Cycles, 10-8
Dl, 10-19
D2,10-19
D3,10-19
D4, 10-19
Daily Care, 7-1
Date/Time, 5-40
Default Methods, 4-3
Delay Time, 6-9,10-9
Deleting, a method, 4-8
Delta ABS, 10-14
Deriv 2 Fix, 10-15,10-16
Deriv 2 Peak, 10-15,10-16
Derivative, second, 5-19
Dif, 10-1,10-19,10-20
Dil Factor, 10-9
Directory
branch, 4-16
printing, 4-16
spectrometer, 4-16
Display, 1-1,1-4
initialization, 2-2
standby, 2-2
symbols, 4-6
Divisor, 10-9,10-10
Double Index of Refraction, 8-3
Editing Methods, 4-4
Electricity, safety information,
S-4
End Time, 10-10
Enz
factor, 10-10
unit, 10-11
Enzyme Kinetics, 5-26, A4-2
activity, 5-26, A4-2
international unit, A4-2
blank value, 5-28
enzymatic analytical procedures, A4-1
Factor, 10-11
... n, 10-12
concentration, 10-6
dilution, 10-9
enzyme, 10-10
Features, 1-1
Filter change points, A3-7
First Sample #, 10-12
Form Feed, 1-3
Gases, safety information, S-7
Graphics Plot, 10-12
Grid, 10-12
H
Help, A3-5
key, 4-17
key combinations, 4-17
text, 4-17
I
Installing, cell holder, 2-5
Instrument, care of the..., 7-1
Interface Failure, A3-5
Interference Pattern, 8-3
Interrupting the Measurement,
5-3
B2161.20 Release 2.0
Index
Interval, 10-12,10-13
Interval Time, 5-34
K
Key
arrow, 1-2
back corr, 1-2
ce, 1-2
combinations, 1-3
enter, 1-2
goto L@, 1-2,1-3
help, 1-2,1-3
method, 1-2,1-3
minus, 1-2
parameter, 1-2,1-3
point, 1-2
start, 1-2
stop, 1-2
Keyboard, 1-1
Lag Time, 5-34,10-13
Lamp, 10-13
Lamp Compartment, 1-1
Lifter, 2-4
Line Feed, 1-3
Line Type, 10-13
Lower Wavelength Limits, of
solvents, 8-5
M
Mark for Copy, 4-13
Measurement Wavelengths, 5-19
2nd derivative, 5-19
peak areas, 5-19
peak heights, 5-12,5-13
B2161.20 Release 2.0
Method
checking, 4-12
concentration, 5-12
copying, 4-14
copying... parameters, 4-13
creating a ... file, 4-9
creating a new ..., 4-9
deleting, 4-8
editing, 4-4
modify, 4-5
name, 4-11
overview, 5-1
overwriting, 4-10
printing, 4-15
procedure, 5-2
protect function, A2-3
types, 5-1
Michaelis constant, A4-2
Michaelis-Menten Equation,
A4-2
Microcell, 2-9
alignment, 2-9
liquid height, 2-9
minimum volume application,
2-9
MMass
dA, 10-16
dC, 10-16
dG, 10-17
dN, 10-17
dT, 10-17
Mode, 10-14,10-15,10-16
ordinate, 10-19,10-20
N
New from Mark, 4-14
New Method, creating a ..., 4-9
Number of
dA, 10-17
dC, 10-17
dG, 10-17
dT, 10-17
N, 10-17
Oligo, 10-18
Oligo Method
oligoquant 1, 5-36
oligoquant 2, 5-36
Oper.ID, 10-18
Optimization, 6-9
Ord.Max, 10-18 ~
Ord.Min, 10-18
Ordinate Mode, 10-19,10-20
Overlay, 10-20
Overview
branches, A3-1
methods, 5-1
Parameter
changing, 4-6
descriptions, 10-1-10-28
numbers, 10-1-10-28
tagging, 4-7
Part numbers, cell, 2-9
Pathlength, of cells, 2-9
Peak
areas, 5-19,10-15
deriv 2,10-15,10-16
heights, 5-12, 5-13
Peristaltic Sipper, 6-9
Personal Computer
operation with, A3-5
RS-232 interface, A3-5
Photoactive Samples, 8-3
Plot Refs, 10-20
Polarizing Samples, 8-3
Port usage, A3-5
Postrun Kinetics, 5-34,10-20
Power switch, 1-1
Pressure buildup in cells, 7-3
lndex-3
Index
Print
branch, directory, 1-3
current values, 1-3
data, 10-20
directory, 4-16
method, 4-15
directory, 1-3
information, 1-3
parameters, 1-3
Peltier temperature, 1-3
refs, 10-21
status, 1-3
using help key combinations,
4-17
Printer
configuration, A3-6
output configuring, A3-6
Protect Function, A2-1
execute, A2-1
for branches, A2-4
for methods, A2-3
full, A2-1
preventing access to methods
and branches, A2-5
read/write, A2-1
setting, A2-2
write, A2-1
Quick Sample Measurement, 3-4
Radiation beam, 2-7
Rat, 10-1,10-19,10-20
Refn, 10-21
Reference Solution, remeasuring, 5-24
Refs, 10-21
Reset, 3-5
full, 1-3
Response, 10-21
lndex-4
Return, 6-9
to standby, 5-42
Rev. Time, 6-9
RS 232 interface
use of, A3-5
use with PC, A3-5
Safety Information, S-3
Salt, 10-21
Sample Compartment, 1-1
window, 7-1, 7-3
cleaning, 7-1,7-3
Sample ID, 10-22
Sample Measurement, 5-2
Sample Volume, minimum in
microcell, 2-9
Samples
/Batch, 10-22
chemically reactive, 8-3
not governed by Beer-Lambert law, 8-2
photoactive, 8-3
polarizing, 8-3
thin-film, 8-3
unusual, 8-2
volatile, 8-2
Sampling Time, 6-9,10-22
Scale, 10-22
Scan, 5-8
Select
branch, A3-2
default method, 1-3,4-3
method, 4-2
previous parameter, 1-3
tag, 1-3
Self Test, 5-43
Seq n, 10-22
Sequence Length, 10-22
Shutdown, 2-3
Sipper, 6-9,10-1
Slit, 10-22
Smooth, 10-23
Solvent
lower wavelength limits of...,
8-5
properties, 8-4
Spectrometer, directory, 4-16
Speed, 10-24
Spilled Materials, 7-1
Standby
display, 2-2
return to, 5-42
Startup, 2-2
Stirrer, 6-8,10-24
Substrate Kinetics, 5-30, A4-4
blank value, 5-33
procedure with cell changer,
5-32
Super User, Al-1
activating, Al-1
deactivating, Al-1
mode, 1-3
Tagged Parameters, 5-2
Tagging, 10-2
parameters, 4-7
symbols, 4-7
type of..., 4-7
Temp Check, 10-24
Temperature, 8-3,10-25
Peltier cell holder, 10-25
sensor, 10-24
Test, branch, A3-7
Thin-film Samples, 8-3
Threshold, 5-20,10-25
Time Drive, 5-6
Time Unit, 10-25
TM Calculation, 10-25
Total Area, 10-15
Total Time, 5-34,10-26
82767.20
Release 2.0
Index
Toxic fumes, safety information,
S-7
Tray #, 10-26
Tube ports, 2-5
u
Unit
concentration, 10-6
enzyme, 10-11
time, 10-25
Unusual Samples, 8-2
User, configuration, A3-6
UV radiation, S-7
w
Wakeup, 5-42
Warnings, translations of... T-l
Waste, disposing of, S-6
Wav.Max, 5-19,10-27
Wav.Min, 5-19,10-27
Wave n, 10-27
Wavelength, 10-27
manual setting, 3-2
Wavelength Program, 5-10
Symbols
V
#ofRefs, 10-1
# Wavelengths, 10-1
%T, 10-19
Validation, branch, A3-7
Value n, 10-26
Volatile Samples, 8-2
3WLAnalys, 10-14
B2161.20
Release 2.0
Numbers
lndex-5
lndex-6
B2161.20 Release 2.0